 A. A. Pimenta1*
 O. M. Adebayo1C. M. Wrasse2R. de Jesus1,3A. M. Santos1P. P. Batista1V. F. Andrioli1P. R. Fagundes4E. A. Kherani1S. A. Savio5O. F. Olajide1
- 1Heliophysics, Planetary Science and Aeronomy Division, National Institute for Space Research (INPE), São José dos Campos, São Paulo, Brazil
- 2Space Weather Division, National Institute for Space Research (INPE), São José dos Campos, São Paulo, Brazil
- 3State Key Laboratory for Space Weather, National Space Science Center (NSSC), Chinese Academy of Science (CAS), Beijing, China
- 4Physics and Astronomy Laboratory, University of Paraíba Valley (UNIVAP), São José dos Campos, São Paulo, Brazil
- 5Coordination of Satellites Tracking, Control and Reception, Satellite Control Center (CORCR/CCS), National Institute for Space Research (INPE), São José dos Campos, São Paulo, Brazil
This event is the first documented study in the Brazilian sector regarding a super bolide whose explosion was equivalent to 21 kilotons of TNT (∼8.83 × 10¹³J). The energy released by this event in the altitude range from 96 to 99 km in the upper atmosphere was equivalent to the atomic bomb detonated at an altitude of approximately 550 m over the Nagasaki city, Japan, during World War II. This observation was detected by all-sky images system with a filter in near infrared (NIR) band from 715 to 930 nm, operating at Cachoeira Paulista (22.7°S, 45°W) and lidar observations of the mesospheric sodium and potassium layers, operating at São José dos Campos (23.1°S, 45.9°W), both observatories in Brazil. The all-sky images system showed strong explosion in the mesosphere and a subsequent long-lived meteor train with more than 14 min through the NIR band. On the other hand, the lidar showed that the meteor explosion occurred in an altitude range from 96 to 99 km with the consequent sodium and potassium atoms enhancement on the background layers. Shortly after the fireball explosion, a digisonde operating at Cachoeira Paulista detected a sudden appearance of a sporadic-E layer. Using GNSS data, an analysis of the generation of infrasonic pressure waves excited during meteor explosion is presented. In addition, thermospheric neutral density values obtained with Swarm Satellite B prior to, during, and after 25 May 2023, showed a neutral density peak on 25 May 2023, at ∼ 12 UT, after the super bolide explosion (∼4.5 h later), and reached approximately 0.574 × 10⁻¹² kg/m3, 15% above the average neutral density value prior to event. In this work we present and discuss several features related to this super bolide explosion in the upper atmosphere/ionosphere.
1 Introduction
Objects responsible for fireballs are in the mass interval of 10–3 – 106 kg and come mainly from comets and asteroids (Hughes, 1993). These bodies usually do not survive atmospheric interaction, especially when they enter the atmosphere at high speed and are low density cometary fragments (Ceplecha et al., 1998). Observations of large bolides and their associated effects on Earth’s atmosphere are routinely made using several instrumental techniques. Satellite instruments (Tagliaferri et al., 1994), photographs (Borovička and Betlem, 1997; Ceplecha et al., 1998), video observations (Brown et al., 1994; Campbell-Brown and Koschny, 2004), all-sky images (Pimenta et al., 2022), infrasound recordings (ReVelle, 1999; Edwards et al., 2006; Silber et al., 2009; Cheng et al., 2021), all contribute to our observational understanding of these rare events recorded. The last two techniques mentioned are used when a meteoroid penetrates in an altitude range of 50–350 km and creates a blast wave of sufficiently low frequency to propagate to the ionospheric F-region. For bolide events, the blast wave created by hypersonic passage of the meteoroid may propagate to very large distances as acoustic wave, in the infrasound spectrum (0.001 Hz–20 Hz) and may be detectable by the Global Navigation Satellite System (GNSS). By this system, for example, it is possible to estimate the equivalent TNT size of a fireball explosion from the period of the signal received for bolides, which are sufficiently large. On the other hand, if the bolide explosion occurs at the typical meteor ablation altitude, in the range of 85–100 km, it is possible to use the all-sky imaging system to estimate the location and both the mass and energy injected in the upper atmosphere (Pimenta et al., 2022).
The present study is the rarely reported documented observation of a super bolide detected directly by All-sky imaging system, with a filter in near infrared (NIR) band from 715 to 930 nm, operating at Cachoeira Paulista (22.7°S, 45°W) and a sodium potassium lidar, operating at São José dos Campos (23.1°S, 45.9°W), both observatories in Brazil. The all-sky images system showed the meteor explosion in the mesosphere and a subsequent long-lived meteor train which lasted more than 14 min through the NIR band. On the other hand, the lidar showed that the meteor explosion occurred in an altitude range from 96 to 99 km with the consequent sodium and potassium atoms enhancement on the background layers. Shortly after the meteor explosion, a digisonde operating at Cachoeira Paulista detected a sudden appearance of a sporadic-E layer. In addition, infrasound observations were used to estimate the energy injected in the Earth upper atmosphere/ionosphere due to the meteor explosion. However, in data analysis, we need to be careful because there are many sources of infrasound, both anthropogenic (explosions, space debris, aircraft, rocket launches) and natural (earthquakes, volcanoes, waterfalls, storms), impeding the identification of meteor events. Fortunately, the multiple scientific instruments used during the event occurrence leave no doubt that the signal in the infrasound spectrum detected originated from the meteor’s explosion in the upper atmosphere. Using GNSS data, an analysis of the generation of infrasonic pressure waves excited during the meteor explosion showed some particularities of this event. This was the largest fireball observed in the Brazilian sector on record with a TNT equivalent of ∼21 kilotons. In addition, neutral density variations measured by the Swarm B satellite were analyzed during this strong meteor explosion. In this work, we present and discuss several features related to this strong meteor explosion that released considerable energy in the upper atmosphere/ionosphere.
2 Measurements techniques and observations
We think that the data presented on this super bolide event are quite unique for their completeness. They include all-sky images to determine the trajectory and location of the bolide explosion, sodium/potassium lidar measurement to estimate the altitude of the explosion, meteor radar to estimate the winds in the mesosphere-lower thermosphere (MLT) region, digisonde to observe if sporadic-E layer occurred during the event and GNSS network to infer the hydrodynamic energy injected in the upper atmosphere/ionosphere. In addition, neutral density variations measured by the Swarm B satellite were analyzed during this strong meteor explosion. Table 1 shows the locations of the ground-based scientific instruments used in this study.
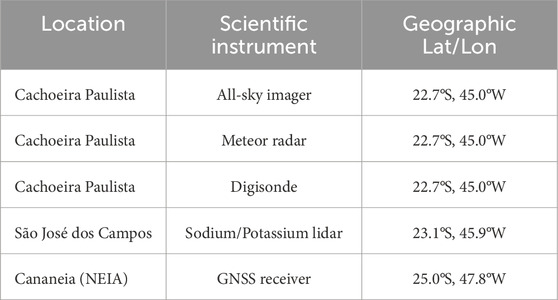
Table 1. Locations of the scientific instruments.
One way to obtain the heliocentric orbit of an approaching meteoroid is by monitoring the night sky for thousands of hours with sky-observation cameras or by obtaining casual video or satellite records. Observations of the near infrared (NIR) band from 715 to 930 nm nightglow emission using monochromatic wide-angle imager with CCD camera at Cachoeira Paulista observatory (22.7° S, 45.0° W) have been carried out since October 1998 to the present day. The NIR filter, which passes the 8–3; 4–0; 9–4; 5–1; 6–2; 7-3 and part of 8-4 Meinel bands, has a notch at 865.5 nm so that it strongly rejects the molecular oxygen emission. The CCD imager area is 1.91 cm2, high resolution, 1,024 × 1,024 back-illuminated array and quantum efficiency greater than 80% in the near infrared (NIR) band. CCD arrays perform three essential functions: photons are transduced to electrons, integrated and stored, and finally read out. Exposure time is the time between start acquisition and stop acquisition commands sent by the application software to the camera. At the end of the exposure time, the CCD is readout and cleaning starts again. So, the time needed to take a full frame at full resolution is: tc + texp + tR, where:
tc is the shutter compensation time (ms), texp is the exposure time and tR is the CCD readout time. The images were binned on-chip down to 512 × 512 pixels resolution to enhance the signal-to-noise ratio and are recorded at intervals of 126 s with 15 s exposure time rate. The field of view of the all-sky imager is ∼178°, which is equivalent to a horizontal diameter of 900 km, assuming the bolide explosion around 97 km. However, the all-sky images usually have problems associated with the use of all-sky optics for airglow studies. The image appears curved and compressed at low elevation angles. This occurs because the lens projects an image onto the CCD camera such that each pixel subtends an equal angle of the sky. To correct these problems, we first transform the images using the unwarping method described by Garcia et al. (1997). In this present work, the unwarped images represent an area of the processed image of 122,500 km2 (350 km × 350 km), assuming the airglow layer height around 97 km. The final geographic coordinate system is a 2-D uniformly spaced grid at the height of the airglow layer. In the next paragraphs, during the presentation of the meteor radio and sodium/potassium lidar data, we will discuss why we are considering the airglow layer around 97 km.
In Figure 1A we show a raw all-sky image obtained through a filter in near infrared (NIR) band from 715 to 930 nm at 08:00:46 UT (05:00:46 LT), on 25 May 2023. The image shows a very bright meteor crossing the zenith of Cachoeira Paulista, terminating in a very bright fireball with terminal flare located at a Right Ascension 20 h 19 min 48 s and Declination −59° 01′ 35″. It is important to mention that 08:00:46 UT is the time that the cycle was completed for the image acquisition (tc + texp + tR = 126 s) and does not represent the exact moment of the meteor explosion (terminal flare). So, according to the clock of the computer (not controlled by GPS) used in the image acquisition process, the meteor explosion occurs between 07:58:40 UT and 07:58:55 UT (the period of CCD exposure time = 15 s). Later, when we present the meteor radar data (with GPS controlled clock), we will show that the meteor probably exploded at 07:59:00.872 UT at an altitude of 96.2 km. Figure 1B shows the unwarped image of the same bright meteor crossing the zenith of Cachoeira Paulista (22.7°S, 45°W) observatory, terminating in a very bright fireball with terminal flare located on the Atlantic Ocean. The fireball (terminal flare) occurs around the same longitude as the city of São José dos Campos. In the image, the asterisk symbol indicates the location of São José dos Campos (SJC) observatory where we have a sodium/potassium lidar and the diamond (NEIA), the location of one of the GNSS network receivers closest to the bolide explosion. Also, in this figure it is possible to observe that during the explosion of the super bolide fragmentations (luminosity spikes in the fireball) occurred that probably threw part of the original mass in specific directions as shown by red arrows.
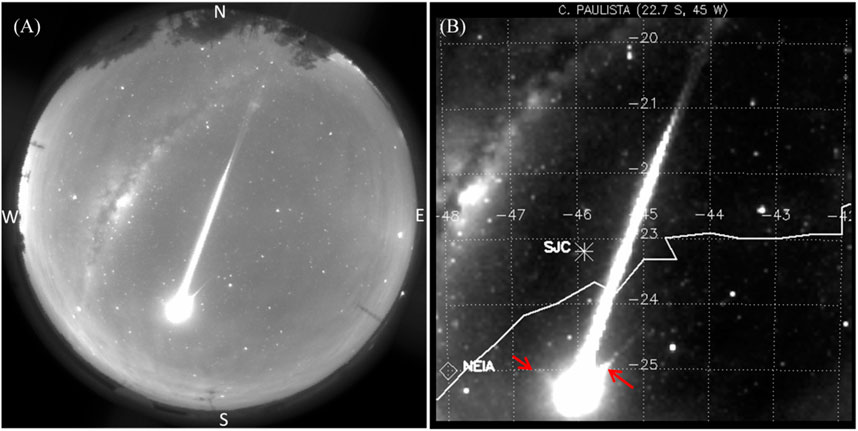
Figure 1. (A) Raw all-sky image on 25 May 2023, at 08:00:46 UT in the near infrared (NIR) band from 715 to 930 nm, showing a very bright meteor terminating in a very bright fireball with terminal flare located at Right Ascension 21 h 28 min 18 s and Declination −65° 15′ 34″. (B) Shows the same bright meteor crossing the zenith of Cachoeira Paulista (22.7°S, 45°W) observatory terminating in a very bright fireball with terminal flare located on the Atlantic Ocean. Unwarped image (B) represents an area of the processed image of 122,500 km2 (350 km × 350 km), assuming the airglow layer height around 97 km. Above the white continuous line we have the continent and below the Atlantic Ocean. Still in image (B), the asterisk symbol indicates the location of São José dos Campos (SJC) observatory where we have a sodium/potassium lidar and the diamond (NEIA), the location of one of the GNSS network receivers closest to the bolide explosion. The red arrows indicate that during the explosion of the super bolide, fragmentations (luminosity spikes in the fireball) occurred and possibly threw part of the original mass in specific directions.
To highlight the meteor train after the fireball, a zoom in the images can be seen in Figure 2 (the images were cropped around the fireball). The first NIR image, obtained at 08:02:53 UT after the initial fireball, shows a bright train, already showing the effects of wind distortion. The following four images show the airglow decreasing intensity with further wind distortion as shown by yellow arrows. The last image (not shown in Figure 2) on which the train is still visible in our data was 14 min after the fireball. The long-lived train observed in NIR airglow suggests that it could be related to emissions from the OH bands, which emission peak occur around 87 km. However, we propose an alternative explanation for the train observed through the wide-band NIR filter: the main emission may be a continuum. This topic, however, is beyond the scope of this work.
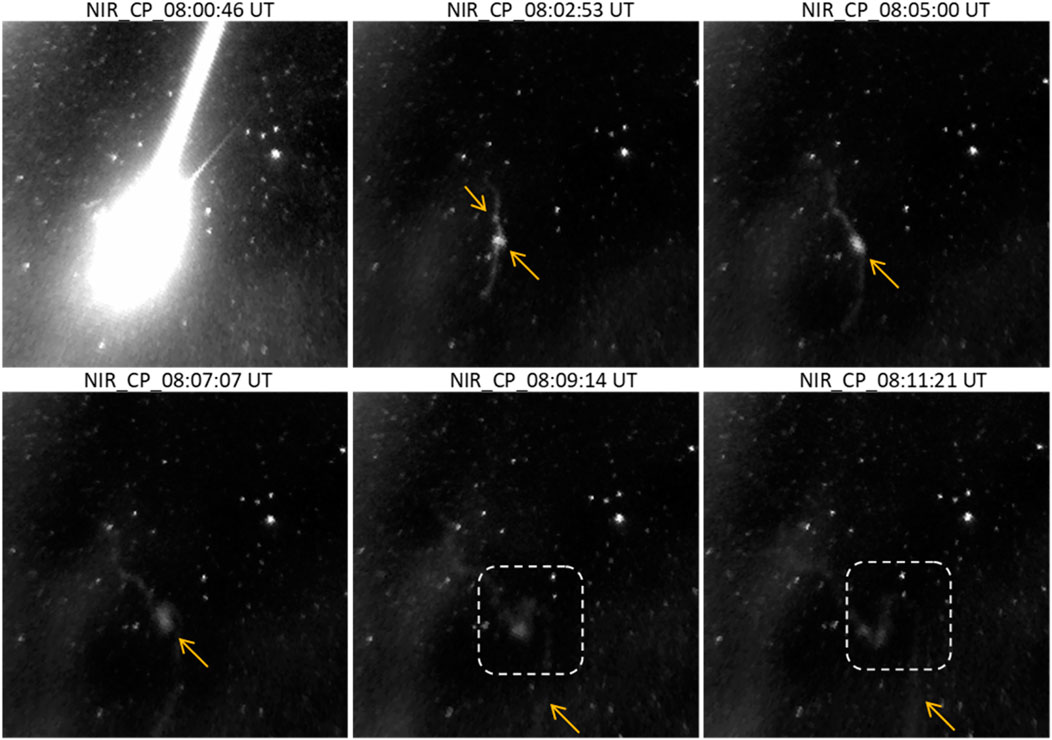
Figure 2. Sequence of nightglow emission all-sky images obtained from 08:00:46 UT to 08:11:21 UT, on the night 25 May 2023, to highlight the formation phase of meteor train after the fireball. With the passage of time, the train suffers the effects of horizontal diffusion, increasing its horizontal extent, and decreasing the horizontal gradient in its density, as shown by the yellow arrows. In addition, the dotted squares in the figure show the effect on the train due both zonal and meridional wind blowing westwards and northwards, towards the city of São José dos Campos, where we have a dual beam sodium/potassium lidar.
The all-sky images can be used to estimate the horizontal high-speed component triggered by the meteor explosion, superimposed on the background wind, which has a relatively very short duration. By analyzing the first six spatial displacements of the bright regions (a cloud of solid aerosol particles-meteor dust), indicative of increased airglow emissions in successive images shown in Figure 2, we determined that the average horizontal high-speed component, which was superimposed on the background wind, was approximately 470 m/s ± 50 m/s. Details of this methodology can be found in Pimenta et al. (2001). In a recent paper, Pimenta et al. (2022), using data from wide-angle CCD cameras with a narrow sodium filter (18 Å bandwidth centered at 589.3 nm), meteor radar and digisonde, showed that the dynamics of a long-lasting meteor train are conditioned by the wind and that the first minutes of the train development, a horizontal high-speed component is present, resulting from explosion of the meteor body in the upper atmosphere. They also concluded that the aerosol formed by explosive fragmentation was concentrated at the heights of 90–100 km and after a few minutes, the movement (the horizontal high-speed component) slowed down to typical wind velocities at the heights mentioned. Our current results corroborate with them in the sense that in the first minutes after the meteor explosion a horizontal high-speed component arises on the background wind and along the time its movement decelerates to typical wind velocities in the MLT region. They also shown that the horizontal displacement of the metallic atoms, deposited by the meteor explosion in the upper atmosphere are carried by the horizontal winds, indicating that it will be visible in locations other than that of the initial formation, and its dimensions will depend on this location. So, the probability of seeing the cloud of metallic atoms with another scientific instrument, for example, a lidar, would depend mainly on the area which the cloud sweeps out as it is carried along by the horizontal winds.
Another scientific instrument used in this study was a meteor radar (SkiYMET system), installed at Cachoeira Paulista observatory. The SkiYMET radar affords measurements of variety of scientific parameters, and some of them are present in Table 2. In the table, Rge is the range of the echo detected (in km), Ht is the echo height above ground level (in km), Phi0 is the azimuth angle of the echo detected (in degree) and Amax is the peak value of the amplitude of the meteor echo (in digitiser unit). The SkiYMET system details, operating mode, meteor detection method, are the same as described by Hocking et al. (2001). As shown in Table 2, a strong echo with an amplitude about 14440 (digital units) occurred at 07:59:00.872 UT at an altitude of 96.2 km, which suggests that the meteor radar captured the instant of the bolide explosion. The moment of greatest echo amplitude (14440) recorded at 07:59:00.872 UT by the meteor radar, does not precisely align with any instant within the exposure time of the all-sky image (07:58:40 UT – 07:58:55 UT). However, given the higher accuracy of the meteor radar clock, it is assumed that the bolide explosion occurred at 07:59:00.872 UT at an altitude of 96.2 km as shown by Table 2. As discussed in the following sections, the altitude of the bolide explosion identified by meteor radar measurements (96.2 km) corresponds closely with the altitude range (96–99 km) characterized by increased concentrations of sodium and potassium atoms detected through lidar observations.
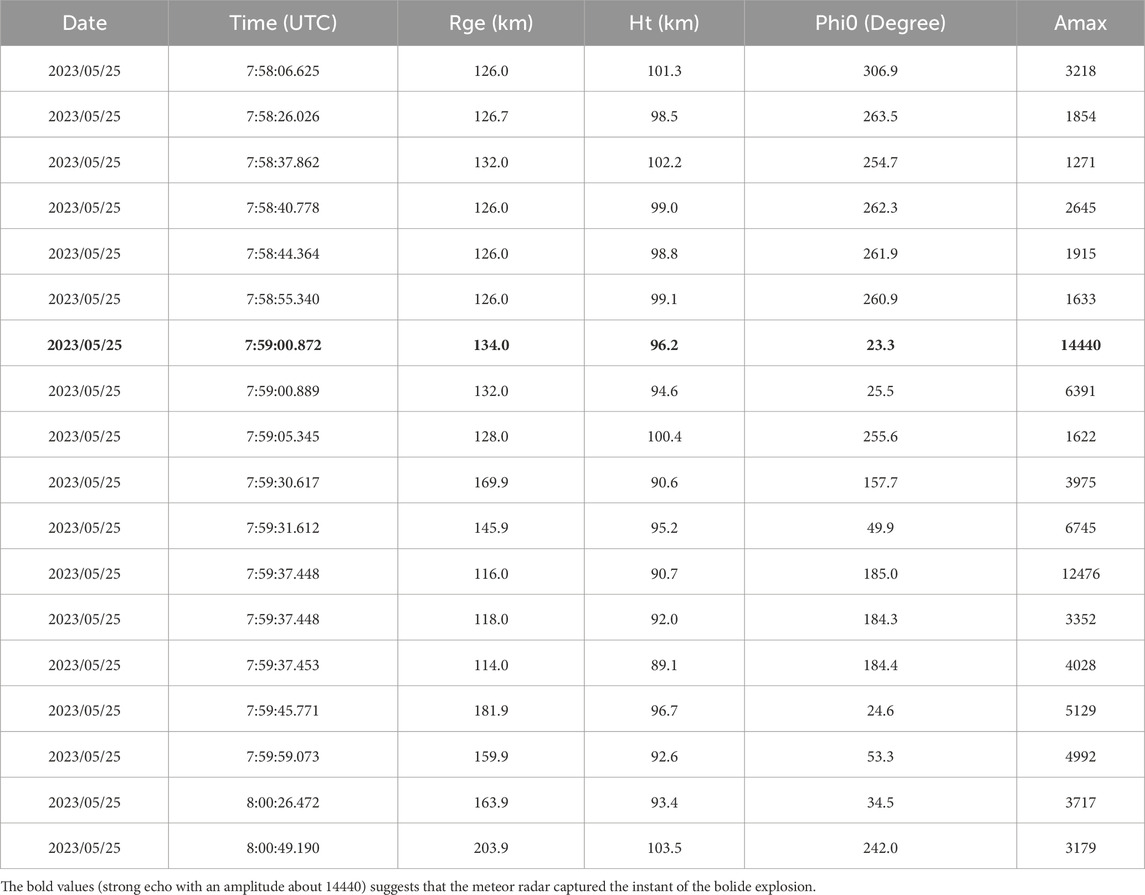
Table 2. Parameters of meteor radar echoes recorded between 07:58:06.625 UT and 08:00:49.190 UT.
Figure 3 presents the azimuthal and zenithal distribution of meteors observed between 07:58:06.625 UT and 08:00:49.190 UT. The figure presents echoes with amplitude (Amax) greater than 1,200. As shown by the figure, the meteor radar echoes were predominantly observed along two specific directions. This directional pattern is probably linked to the timing of the meteor explosion, which occurred at 07:59:00.872 UT. The strong echo detected by the SKiYMET radar at this precise moment, at an altitude of 96.2 km, provides evidence that the radar probably captured the exact instant of the bolide explosion. The correspondence between recorded meteor echoes and the explosion’s timing demonstrate the SKiYMET meteor radar system’s capability to accurately identify not only week but major meteor events occurring in the upper atmosphere.
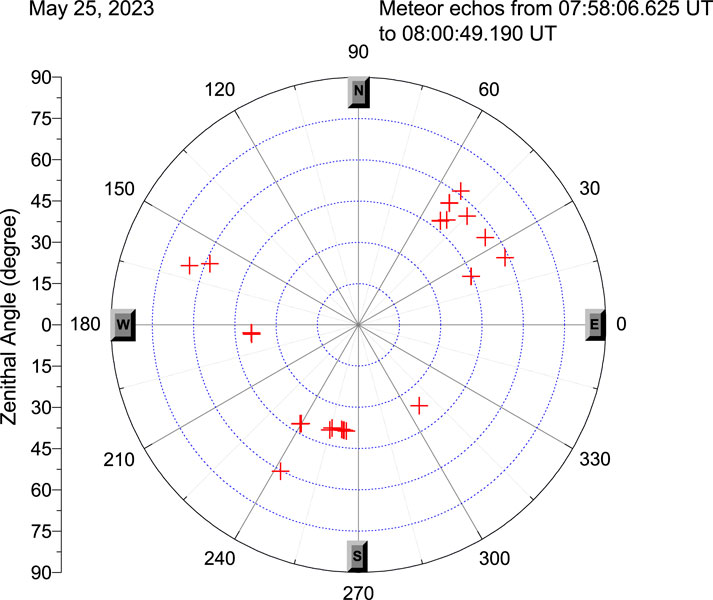
Figure 3. The azimuthal and zenithal distribution of meteors echoes recorded on 25 May 2023, during the period from 07:58:06.625 UT to 08:00:49.190 UT.
Figure 4 shows the magnitude for both zonal and meridional wind in the MLT region (background wind) during the night May 24–25, 2023, from 00:00 UT to 09:00 UT obtained with the meteor radar (SKiYMET system), installed at Cachoeira Paulista observatory. The radar operates automatically, 24 h per day and the number of useful meteor detections is typically between 1,000 and 3,000, making it possible to obtain hourly wind values in 3 km bins from 82 to 100 km. In Figure 4, plot (A) represents zonal wind, negative to westward and (B) meridional wind, negative to southward. The dotted vertical white bars indicate the time of the meteor’s explosion in the upper atmosphere that probably occur at 07:59:00.872 UT. We can see that the magnitude of the zonal wind around the time of the meteor explosion has speed range of 25–75 m/s to westward in the height of 93–99 km. On the other hand, in the same height, the meridional wind blows northward with speeds between 25 m/s and 35 m/s, heading towards São José dos Campos (SJC), where we have a dual beam sodium/potassium lidar.

Figure 4. Horizontal winds for the night of May 24–25, 2023, obtained by SkiYMET meteor radar at Cachoeira Paulista observatory, 102 km far from sodium Lidar. (A) Zonal wind, negative to westward and (B) Meridional wind, negative to southward. The dotted vertical white bars indicate the time of the meteor’s explosion in the upper atmosphere.
Another scientific instrument used in this study was a dual beam sodium/potassium lidar that can detect chemical elements, such as, sodium (Na) and potassium (K) atoms directly, by projecting short bursts resonance radiations from a ground installation through the respective layers and recording the signals backscattered as a function of range. A new dual-beam Na/K lidar system was installed in São José dos Campos (23.1°S, 45.9°W), Brazil, on 20 November 2016, and has been operating continuously since its installation. Based on resonance fluorescence scattering mechanisms and using two laser beams centered at 589 nm and 770 nm, this lidar can obtain simultaneous measurements of Na and K atoms signals from the MLT region. Original signals from 1,000 laser pulses are integrated into sodium and potassium layer profile (for a corresponding temporal resolution of 20 s and height resolution of 96 m). Details of the system and data acquisition can be found in Jiao et al. (2018).
Figure 5 shows the height-time evolution of the potassium (panel A) and sodium (panel B) layers on May 24–25, 2023, from 01:00 UT to 08:35 UT, using a dual-beam sodium/potassium lidar system. The color bars in these panels were compressed and adjusted to show all relevant variations throughout the observations. After 08:01:16 UT it is possible to observe a short-lived sudden increase in the sodium and potassium layers, in an altitude range between 96 km and 99 km due to the meteor ablation/explosion (indicated by the yellow arrows). The panels A1 and B1 show a zoom in the period which there was short-lived (∼9 min) sudden increase in the sodium and potassium layers (sporadic layers) in an altitude range between 96 km and 99 km (also indicated by the yellow arrows). Since the initial observation of a sporadic sodium layer by Clemesha et al. (1978), later termed the “Sudden Sodium Layer” by von Zahn et al. (1987), extensive research has been conducted to investigate their origin and behavior. They are often observed to appear in a matter of minutes, but can persist for as long as a few hours, and then disappear rapidly. Occur often at altitudes between 90 km and 110 km and the ratio of the sporadic layer to the background layer have concentrations between 2 and 20 times (Cox and Plane, 1998; Simonich and Clemesha, 2008). von Zahn et al. (1988) defined a parameter called “strength factor” to characterize the sporadic layers. It is the ratio of maximum peak number density of sporadic layer to the number density of the background layer at the altitude of the peak of the sporadic layer. As shown in Figure 5, panels B1, the ratio of maximum peak number density of sporadic sodium layer to the number density of the background layer (strength factor) was about 4.7. On the other hand, as shown in panel A1, the ratio of maximum peak number density of sporadic potassium layer to the background layer (strength factor) was about 4.5. In addition, our results showed a maximum ratio between sodium and potassium atoms due to meteor ablation/explosion of ∼18 times.
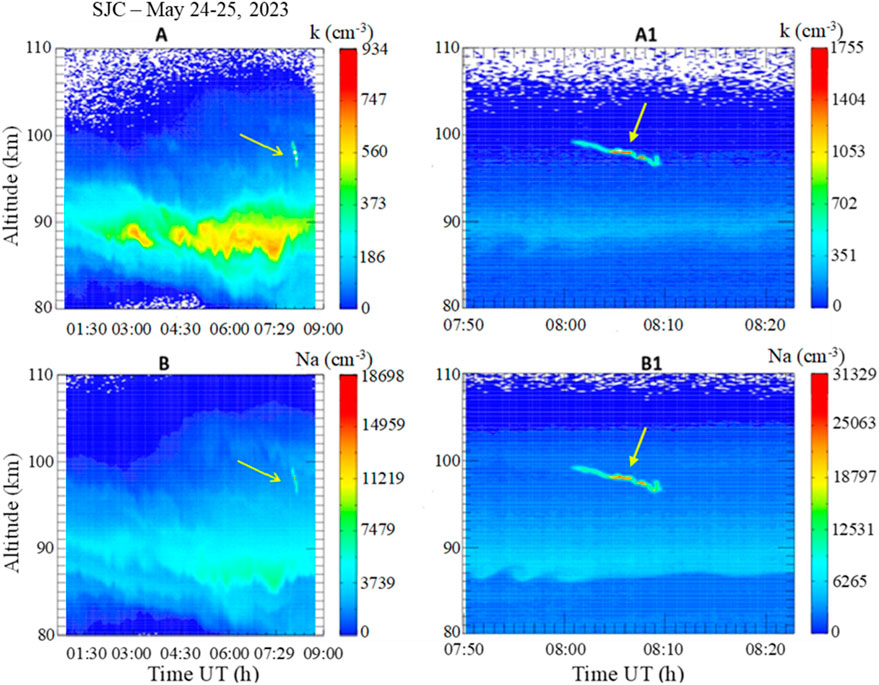
Figure 5. The height-time evolution of potassium (A) and sodium (B) layers observed from 01:00 UT to 08:35 UT on May 24–25, 2023, using a dual-beam sodium/potassium lidar system. After 08:01:16 UT is possible to observe increases in the sodium and potassium layers in an altitude range between 96 km and 99 km due to the meteor ablation/explosion, as indicated by the yellow arrows. The (A1,B1) show a zoom in the period which there was a short-lived (∼9 min) sudden increase in the sodium and potassium layers, in an altitude range between 96 km and 99 km due to the meteor ablation/explosion (also indicated by the yellow arrows).
Curiously, as shown in Figure 6, during the interval from 08:01:16 UT to 08:04:44 UT, the ratio of sporadic layers to background layers for both sodium [panels (A1), (B1), (C1)] and potassium [panels (A), (B), (C)] remains below approximately 2.8. After 08:05:46 UT, the ratio of sporadic layers to background layers for both sodium and potassium layers increases to values greater than 4. These differences in sodium and potassium concentrations detected by lidar suggest that the sodium/potassium cloud, crossing the lidar field of view, may be related to different mechanisms of atomization during the super bolide event, that possibly were: 1. atomization due to sputtering/fragmentation and 2. atomization due to evaporation/explosion. Perhaps the sodium and potassium atoms detected by lidar before 08:05:04 UT (spikes with relatively lower magnitudes) are due to the super bolide sputtering/fragmentation (mechanism 1) before the explosion. On the other hand, the maximum densities (photon counts) were reached after 08:05:46 UT for both metals, as shown in red color profiles “B” and “B1”. These maximum concentrations of sodium and potassium clouds would be related to the evaporation/explosion (mechanism 2) of the meteor over the Atlantic Ocean. This second mechanism probably deposits a greater concentration of atoms at the explosion site. According to Lebedinets and Shushkova (1970), two mechanisms may account for the atomization of meteoroids in the upper atmosphere: evaporation, which predominantly drives ablation in larger meteoroids, and sputtering, which is primarily responsible for the ablation of very small meteoroids (micrometeorites). Regarding our study, we are considering the contribution of both mechanisms in the sodium/potassium concentrations measured by lidar.
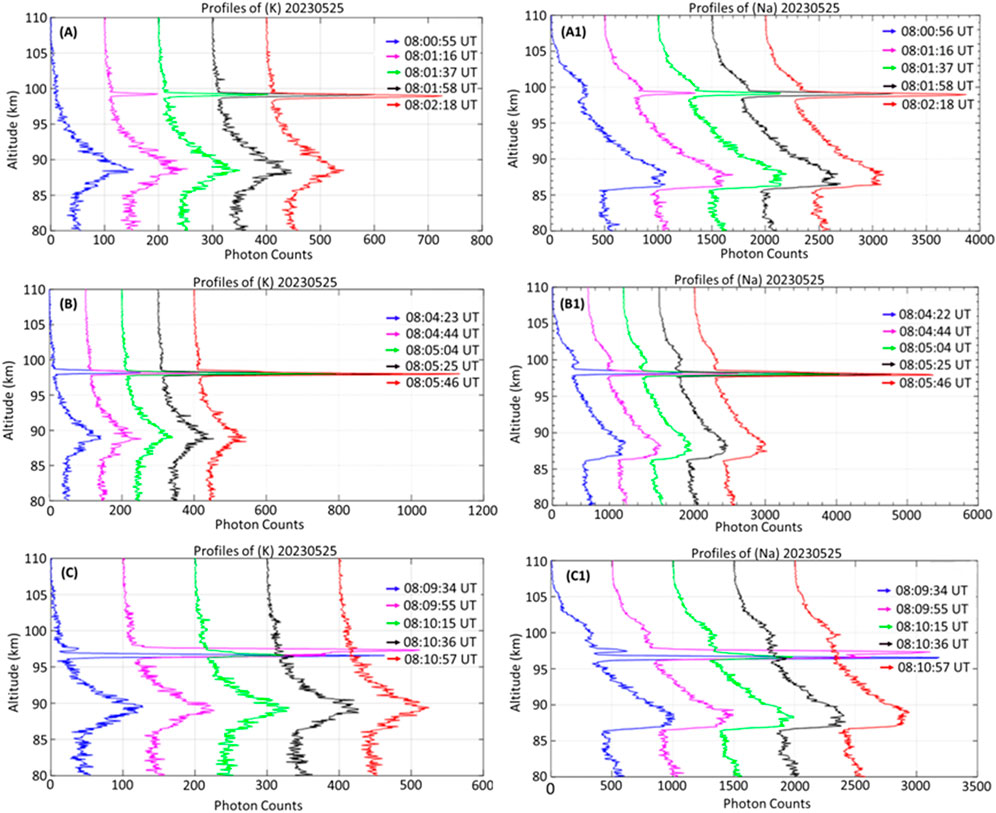
Figure 6. Photon counts time series (density profiles) of potassium [panels (A),(B),(C)] and sodium [panels (A1),(B1),(C1)] values prior to, during, and after the meteor explosion event on 25 May 2023. The lidar has a range resolution of 96 m and took 20 s time integrations. The spike in both sodium/potassium layers (sporadic layers), in altitude range of 96–99 km is due to advection of single bolide train across of the lidar field of view (FOV).
Based on the interval between the bolide explosion at 07:59:00 UT, recorded by all-sky imaging and meteor radar, and the subsequent increases in sodium and potassium densities detected by lidar at 08:05:46 UT, and estimating the distance from the explosion site to the lidar as approximately 200 km, we infer that the sodium/potassium cloud associated with the horizontal high-speed component arrived at SJC with an average speed of roughly 535 m/s. This speed estimate closely aligns with our prior findings derived from all-sky imaging and meteor radar data. It supports the interpretation that sodium/potassium lidar identified two distinct dynamic mechanisms for atom release in the upper atmosphere: one associated with sodium/potassium clouds formed through sputtering/fragmentation, and another occurring after the bolide evaporation/explosion. In addition, in many works where there are only measurements with lidar for soundings in the MLT region, a fundamental question with respect to sporadic sodium/potassium layers that appear on the background layers is whether they represent additional atoms, or whether they are the result of the redistribution of the background layers. Although we believe in the existence of multiple mechanisms for explaining the sporadic neutral layers in the MLT region, in the present work, our observations leave no doubt that the strong meteor explosion in the upper atmosphere added sodium and potassium atoms on both background layers and the consequent enhancements in mesospheric sodium and potassium densities.
Observations show that sporadic neutral metal layers and sporadic-E layers often coexist, especially above 95 km. To account for the extended time scales, ranging from several minutes to hours, over which sporadic-E occurs, it has been widely acknowledged that metallic ions play a principal role in its formation. The sporadic-E layer
Figure 7 illustrates the sudden appearance of a sporadic-E layer at approximately 130 km altitude during 25 May 2023, observed between 08:00 UT and 08:10 UT. Possibly, the metals atoms which evaporated initially with a speed like that of the parent meteoroid undergo hyperthermal collisions with air molecules which led to ionization. Borovička, J. (1994), has pointed out that all meteor spectra consist of 2 different components: the main spectrum characterized by a temperature of about 4,500 k and a second spectrum that usually reaches 10,000 k. The second component originates in the front wave where high energy collisions can produce the excitation of atoms, thus, increasing the ionization of the meteoroid components. Vondrak et al. (2008) estimated that the fraction on sodium atoms which ionize when ablating from a meteoroid traveling at 15 km/s is ∼35%, compared with 90% at 70 km/s. Meteoroid heating is governed by a complex interaction of variables such as velocity, size, shape, bulk density, material composition, atmospheric density, and entry angle. Each of these factors influence the rates of energy absorption, ablation, and thermal heating, ultimately determining whether the meteoroid will be entirely incinerated or endure reaching Earth’s surface. Generally, heating begins in the ionosphere, in the lower part of the F-region (∼150 km). There are some exceptions, such as the very high speeds for both “Leonid” and “Eta Aquarids” meteor shower, whose particles start to heat up and subsequently produce luminosity at altitudes as high as 200 km (Popova et al., 2001; Popova, 2005).

Figure 7. Sudden appearance of a sporadic-E layer around 130 km height during the event 25 May 2023, between 08:00 UT and 08:10 UT.
Meteor ionization has been a subject of speculation and considerable study for a very long time, in fact long before even the wind shear theory was first developed (Pierce, 1938; Mathews, 1998). Lebedinets and Shushkova, (1970), have suggested that meteor showers may play a substantial role in the formation of sporadic-E layers. Furthermore, our research provides substantial evidence that additional mechanisms should be explored to explain the generation of sporadic-E layers, one of which is the prompt ions production resulting from the ablation of sporadic meteors, as in the case of the bolide presented in this work. In this case, the metal ions are produced during this sporadic meteoric ablation, and these ionic species tend to dominate above 100 km in the E region for a short period, as shown in Figure 7.
3 Results and discussions
Above 80 km, the meteors are considered the main source of the metallic layer in the mesosphere and lower thermosphere and play an important role in dynamical and chemistry in this region (Plane et al., 2015). The explosion of a meteor in the Earth atmosphere can reveals its physical and chemical properties through observation of the energy release, mass deposition, and resulting emission spectrum. On the other hand, infrasound signals can be emitted during explosions caused by natural sources (such as earthquakes, volcanoes, meteors, storms, and waterfalls) or anthropogenic sources (such as space debris, rocket launches, aircraft, and nuclear or conventional explosions). These signals generally fall within the frequency range of 0.001 Hz to approximately 20 Hz. As the combined effect of atmospheric spreading and absorption losses is proportional to the square of the airwave frequency (f2), the losses are least in the lower frequencies. In this way, infrasound waves propagate over very long distances with little attenuation and consequently can be used for monitoring explosives sources, including extraterrestrial bodies impacting the Earth’s atmosphere. However, in data analysis, we must be careful because dispersion, attenuation, non-linear influences, and other propagation effects pose a great challenge when attempting to determine the source of the event.
3.1 Estimation of the energy injected into the upper atmosphere during the meteor explosion
The kinetic energy of an incident meteoroid colliding with the Earth’s atmosphere is several orders of magnitude larger than the energy required to completely vaporize the meteoroid (Zinn et al., 2004). It is estimated that the kinetic energy lost by meteoroids is deposited in the form of heat, light and ionization. Some studies suggest that the kinetic energy of the meteoroid when entering the upper atmosphere is converted such that only 0.1% goes towards ionization, 1% towards light and the rest towards heating the surrounding atmosphere (Romig, 1965). Recently, measurements carried out in the laboratory and modelling of meteoroid ablation indicate that the percentage of energy distributed in the production of light for fireballs may be somewhat larger, of order a few percent (Ceplecha and ReVelle, 2005; Weryk and Brown, 2013).
Estimating the source energy for a large impulsive atmospheric infrasonic source generally relies on empirical relations derived from sources with known provenance. The most often cited for fireballs is the relation first described by ReVelle (1997), derived from infrasonic measurements of ground level nuclear explosions. These relations were later modified to be utilized for estimating energy produced by bolides (ReVelle, 1997; Ceplecha et al., 1998; Cheng et al., 2021). The only modification was the removal of the radiation term, as a much greater fraction of the bolide’s energy is available for shock production than in the case of a nuclear explosion, where nearly half of the total energy is lost as radiation (Glasstone and Dolan, 1977). This relation makes use of the “period at maximum amplitude”, which deforms less to propagation effects than amplitude only and can be express as:
where, E is the total energy injected in the atmosphere by the meteor explosion (in kilotons of TNT), T is the period (in seconds) at maximum amplitude of the infrasound waveform, and the factor 1/2 is present because these relations were originally derived for nuclear explosions, where ∼50% of the source energy was presumed lost into radiation.
We perform a spectrogram of the acoustic waves in the infrasound frequency spectrum to check if the event on 25 May 2023, at 07:59:00.872 UT produced detectable fluctuation in Total Electron Content (TEC). For this purpose, we use phase measurements from dual-frequency Global Navigation Satellite Systems (GNSS) receivers to estimate the ionospheric TEC. According to Hofmann-Wellenhof et al. (2007), TEC is calculated using the following equation:
where,
where
To obtain the impulsive perturbation signature associated with the meteor explosion from the vTEC, we apply a bandpass filter using the Fast Iterative Filtering (FIF) method (Cicone and Zhou, 2021), with a bandpass of 1 mHz–34 mHz. FIF can be used to decompose non-stationary and non-linear signals into simpler oscillatory components, referred to as Intrinsic Mode Functions (IMFs), which is characterized by a quasi-stationary frequency (Verhulst et al., 2022). Summing the modes within the desired frequency range at each time step, we were able to extract the detrended TEC (dTEC). To check if there were other types of infrasound sources (other than the bolide explosion) in the TEC data due to natural events, we analyzed, for example, if there was a geomagnetic storm before of fireball period. The AE and DST indices showed that geomagnetic activity was quiet.
To aid in the visualization of the infrasound signature due to the fireball event we use a continuous wavelet transform (CWT) of the TEC time series to analyze the peak frequency, which highlights spectral features as it evolves with time. For the CWT analysis presented in this study we used a Morlet wavelet with an upper frequency limit of 34 mHz and lower limit of 1 mHz. Figure 8 shows that the principal impulsive frequency signal occurred around 33.3 mHz with an amplitude of 0.19 TECU and delay of 292 s (4.86 min) after the fireball event. After that, to highlight the period at maximum amplitude, Figure 8A zoomed in the period from 254 to 356 s, as shown in Figure 8B. The period observed at maximum amplitude shown in Figure 8B can be related to the empirical Equation 1 to infer the energy injected by the bolide in the upper atmosphere/ionosphere. In this figure, the two vertical red dot bars demarcate the period at the maximum amplitude of impulsive atmospheric infrasonic source (assuming that the original signal around 96–99 km high has not been significantly deformed), which in the present event was 12 s. In addition, it is possible to see that the signal exhibits two prominent and complete cycles, with peak-to-peak amplitude well above background noise. The waveform presented in Figure 8B has a similar shape to the meteor infrasound taxonomic class II, proposed by Silber and Brown (2014). So, using Equation 1, the estimated energy in the altitude range of 250–350 km obtained using the “period at maximum amplitude” on the infrasound signal was 21.08 kt of equivalent TNT (∼8.83 × 10¹³J), being instantaneously released. The energy released by this super bolide event in the upper atmosphere/ionosphere was equivalent to the atomic bomb detonated at an altitude of approximately 550 m over the Nagasaki city, Japan, during World War II.
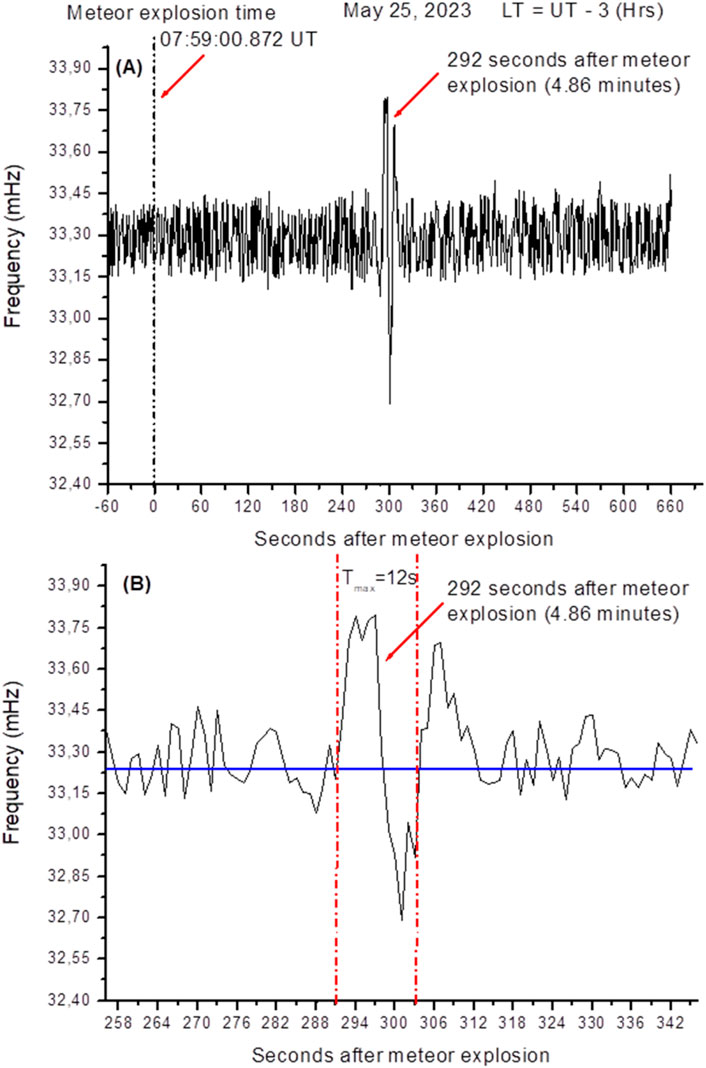
Figure 8. (A) An impulsive frequency signal was detected at approximately 33.3 mHz, occurring with a delay of 292 s (4.86 min) following the fireball event. (B) Period at maximum amplitude (zoomed in the range from 254 s to 356 s) after the super bolide explosion. The period observed at maximum amplitude was applied to the empirical Equation 1 to infer the energy injected by the super bolide in the upper atmosphere/ionosphere. In this figure, the two vertical red dot bars demarcate the period at the maximum amplitude of impulsive atmospheric infrasonic source, which in the present event was 12 s.
3.2 Thermospheric neutral density variations due to the meteor explosion–a possible implication for very low earth orbit (VLEO) satellites
In this section, we present results obtained from Swarm Satellite B (altitude ∼530 km) related to the super bolide explosion focusing on thermospheric neutral density values before, during, and after 25 May 2023. It should be noted that Swarm Satellite B was chosen primarily because it was the only satellite in the constellation that passed close to the explosion site a few hours after the event. It is well known that the Ionosphere/Thermosphere System is driven by internal dynamics and external forcing from outside of solar system, Sun, magnetosphere and lower atmosphere. Therefore, thermosphere density exhibits complicated temporal variability across a board range of time scales, including solar cycle, seasonal, diurnal, geomagnetic storm-time variations and spatial variations with latitude, longitude and altitude (Forbes, 2007). The neutral density in this region is a critical parameter in determining the atmospheric drag on Very Low Earth Orbit (VLEO, 250–350 km) and the resulting stability. Variability of the neutral density in the upper atmosphere due to strong impulsive disturbances, such as the strong meteor explosions, possibly can affect the operations of such satellites. Our experimental results described in the previous section showed that the super bolide explosion in the altitude range ∼96–99 km injected ∼8.83 × 10¹³J (∼21.08 kt of equivalent TNT) in altitude range of 250–350 km (obtained with GNSS network) that is the representative altitude range of the F-region peak. However, regarding neutral density, a key question is: “what were the neutral density variations in very low Earth orbit (VLEO) due to this strong energy injection? The relationship between energy deposited and neutral density increase is not simply linear, as it involves complex atmospheric dynamics, but empirical estimates and models provide useful ranges. Wang et al. (2020) used CHAMP and GRACE satellites data to infer energy injected in the thermosphere during geomagnetic storms. According to them a moderate storm injects energy range of 1012–1013 J and possibly increases neutral density by 50%–100% at ∼ 400 km height. Although the Swarm B satellite’s orbit is higher (530 km) than the meteor explosion region (96–99 km), neutral densities along the Swarm orbit can show if this impulsive event produced detectable fluctuation in the VLEO. The trajectory of Swarm B satellite during the event on 25 May 2023, is illustrated in Figure 9A by the solid blue line/arrow whereas the red star indicates the region of meteor explosion. Figure 9B shows the thermospheric neutral density values inferred from Swarm Satellite B at 530 km from 24 May 2023, to 26 May 2023. The neutral density peak on 25 May 2023, at ∼ 12 UT (red dotted vertical line), after the meteor explosion (∼4.5 h later), reached approximately 0.574 × 10⁻¹² kg/m3, 15% above the average density value of about 0.510 × 10⁻¹² kg/m3 (blue dotted horizontal line), prior to event. The response of the thermosphere ∼4.5 h later agrees with Wilson et al. (2006), that using Weimer Joule heating model and the Air Force High Accuracy Satellite Drag Model (HASDM) to study the response of the thermosphere to Joule heating, found that the thermosphere responds globally in just 3–6 h to an increase in energy input.

Figure 9. Neutral densities along the Swarm B satellite. (A) The solid blue line/arrow indicates the satellite track whereas the red star indicates the region of meteor explosion. (B) Shows the thermospheric neutral density values inferred at 530 km from 24 May 2023, to 26 May 2023. The gray vertical line indicates the moment of the meteor explosion, the red dotted vertical line shows neutral density peak on 25 May 2023, at ∼ 12 UT, 15% above the average density value prior to event, indicated by blue dotted horizontal line.
The upper atmosphere is a region where many spacecrafts orbit the Earth. For example, on 3 February 2022, SpaceX launched 49 Starlink satellites. After launch, the satellites entered a “lower parking orbit” at an altitude around 280–350 km and were intended to gradually raise their altitude to 550 km using ion thruster. However, 38 of them re-entered the atmosphere on or around 7 February 2022, due to an unexpectedly high atmospheric drag (Fang et al., 2022). Regarding the strong meteor explosion event in the upper atmosphere on 25 May 2023, we can ask the following question: Could the meteor explosion, which injected energy on the order of ∼8.83 × 10¹³ J, have disturbed satellites in LEO/VLEO? This strong sporadic and localized explosion possibly would affect only satellites passing through region shortly after the explosion that might experience noticeable perturbations. However, we did not obtain any information regarding problems with VLEO satellites during this period. Nevertheless, for satellites in orbits as low as 350 km that passed through the region where the meteor exploded, the impact of atmospheric drag is already quite significant. If an increase in neutral density of 15% was observed at 530 km, as shown in Figure 9B, then the neutral density variations at altitudes between 250 and 350 km were likely much greater.
The amount of drag is directly related to the density of the thermosphere. As the density increases, the drag on the satellite increases, which can cause it to deorbit faster or alter its trajectory. Over time, this increase in drag could reduce a satellite’s operational lifetime, requiring more frequent boosts or maneuvers to maintain its desired orbit. Berger et al. (2022) used both models and direct measurements of the atmospheric density during “The 2022 Starlink Incident” to show that density values were enhanced by 20%–30% at the 210 km staging altitude relative to values prior to the geomagnetic storm onset. They recommend improving our ability to model the upper atmosphere response to geomagnetic storms to provide accurate forecasts and actionable “nowcasts” of conditions in low Earth orbit to launch controllers, space traffic managers, and satellite operators. Although we are comparing different phenomena with regard energy injection into the upper atmosphere/ionosphere (geomagnetic storm x meteor explosion), what influences the orbits of LEO/VLEO satellites is the drag due to the atmospheric neutral density variations. Although we do not have data for the neutral atmosphere at VLEO altitudes during the event 25 May 2023, increases in neutral density of the order of 15% at 530 km suggest much larger increases in the altitude range of 250–350 km. Unlike magnetic storms, predicting strong sporadic meteor explosions is still a very difficult challenge. However, such phenomena could explain spurious disturbances that sometimes perturb the orbits of LEO/VLEO satellites, such as the event presented in this study.
4 Summary and conclusion
We think that the data presented on this super bolide event are quite unique for their completeness. This observations of large bolide was detected by all-sky images system with a filter in near infrared (NIR) band from 715 to 930 nm, operating at Cachoeira Paulista (22.7°S, 45°W) and lidar observations of the mesospheric sodium and potassium layers, operating at São José dos Campos (23.1°S, 45.9°W), both observatories in Brazil. The all-sky images system showed the meteor explosion in the mesosphere and a subsequent long-lived meteor train which lasted for more than 14 min through the NIR band. On the other hand, the lidar showed that the meteor explosion occurred in an altitude range from 96 to 99 km with the consequent sodium and potassium atoms enhancement on the background layers. Shortly after the meteor explosion a digisonde operating at Cachoeira Paulista detected a sudden appearance of a sporadic-E layer. Using GNSS data, the analysis of the generation of infrasonic pressure waves excited during the meteor explosion showed some particularities of this event. This was the largest fireball observed in the Brazilian sector on record (equivalent to 21 kilotons of TNT). Neutral density variations measured by the Swarm B satellite were analyzed to see if there were implications for VLEO satellites and showed 15% above the average density prior to event.
Our major conclusions include:
1. The all-sky images were used to determine the trajectory and location of the bolide explosion. Calculating the spatial displacements of the bright region (airglow emission increase) occurring during successive images, we inferred that the average horizontal high-speed component, which was superimposed on the background wind, was approximately 470 m/s ± 50 m/s. This result indicates that there is a high-speed component present resulting from explosion of the super bolide in the upper atmosphere and that along the time the movement decelerates to typical wind velocities in the MLT region. The all-sky images also showed that the horizontal displacement of the metallic atoms, deposited by the super bolide in the upper atmosphere are carried by the horizontal winds, indicating that it will be visible in locations other than the initial formation, and its dimensions will depend on this location. So, the probability of seeing the cloud of metallic atoms with another scientific instrument, for example, a lidar, would depend mainly on the area which the cloud sweeps out as it is carried along by the horizontal winds. In addition, during the explosion of the super bolide fragmentations occurred (luminosity spikes in the fireball) that probably threw part of the original mass in specific directions.
2. The lidar showed a short-lived sudden increase (∼9 min) in both sodium and potassium layers, in an altitude range between 96 km and 99 km due to the super bolide ablation/explosion. The ratio between sodium and potassium atoms was ∼18 times. From the time lags between the moment of the super bolide explosion at 07:59:00 UT, observed by meteor radar/all-sky images and the increases densities observed by the sodium/potassium lidar at 08:05:46 UT and estimating the distance between the explosion site and the lidar location to be ∼200 km, we inferred that the sodium/potassium cloud reached SJC with an average speed of roughly 535 m/s (the horizontal high speed component). This speed estimate closely aligns with our prior findings derived from all-sky imaging and meteor radar data. Although we believe in the existence of multiple mechanisms for explaining the sporadic neutral layers in the MLT region, in the present work, our observations leave no doubt that the super bolide explosion in the upper atmosphere added sodium and potassium atoms on both background layers and the consequent enhancements in mesospheric sodium and potassium densities. Therefore, the formation and decay of both sporadic sodium and potassium layers observed during the event, which persisted for about 9 min, was due to advection of sodium/potassium cloud across the lidar field of view (FOV).
3. It is widely accepted that wind shear-induced Lorentz forces generate and maintain the sporadic-E layer
4.We perform a spectrogram of the acoustic waves in the infrasound frequency spectrum to check if the event on 25 May 2023, at 07:59:00 UT produced detectable fluctuation in Total Electron Content (TEC). To estimate the energy injected by the fireball in the upper atmosphere/ionosphere, we extracted from the spectrogram only the frequency with period at maximum amplitude. The results show that the principal impulsive frequency signal occurred around 33.3 mHz with delay of 292 s (4.86 min) after the fireball event. So, using Equation 1, the estimated energy obtained using the “period at maximum amplitude” on the infrasound signal was 21.08 kt of equivalent TNT (∼8.83 × 10¹³J), being instantaneously released. The energy released by this super bolide event in the upper atmosphere/ionosphere was equivalent to the atomic bomb detonated at an altitude of approximately 550 m over the Nagasaki city, Japan during World War II.
5. Thermospheric neutral density values obtained with Swarm Satellite B prior to, during, and after 25 May 2023, showed a neutral density peak on 25 May 2023, at ∼ 12 UT, after the super bolide explosion (∼4.5 h later), and reached approximately 0.574 × 10⁻¹² kg/m3, 15% above the average density value prior to event. This strong sporadic and localized explosion possibly would affect only satellites passing through region shortly after the explosion that might experience noticeable perturbations. However, we did not obtain any information regarding problems with VLEO satellites during this period. But for satellites in orbits as low as 350 km, passing through the region where the meteor exploded, the impact of drag is already quite significant. If at 530 km we had an increase in neutral density of 15%, as shown Figure 9B, the neutral density variations at 250–350 km was probably much greater. Unlike other phenomena that inject significant energy into the upper atmosphere, such as magnetic storms, predicting sporadic and powerful meteor explosions remains a difficult challenge. However, such phenomena may explain spurious perturbations that interfere with the orbits of LEO/VLEO satellites, such as the strong event presented in this study.
Data availability statement
The all-sky images, sodium/potassium lidar and digisonde data used in this work can be found in the https://embracedata.inpe.br.
Author contributions
AP: Conceptualization, Data curation, Formal Analysis, Funding acquisition, Investigation, Methodology, Project administration, Resources, Software, Supervision, Validation, Visualization, Writing – original draft, Writing – review and editing. OA: Software, Methodology, Writing – review and editing. CW: Software, Writing – review and editing. RJ: Software, Writing – review and editing. AS: Software, Writing – review and editing. PB: Writing – review and editing. VA: Software, Writing – review and editing. PF: Writing – review and editing. EK: Writing – review and editing. SS: Writing – review and editing. OO: Writing – review and editing.
Funding
The authors declare that financial support was received for the research and/or publication of this article. AP declare that received financial support from the following agencies: 1. São Paulo Research Foundation (FAPESP), Brazil, for the support received through Grant 2022/10144-9 and 2023/04783-1; 2. Brazilian Ministry of Science, Technology and Innovation and the Brazilian Space Agency for the support received through Grant 20VB0009172430; 3. National Council for Scientific and Technological Development–CNPq, Brazil, for the support received through Grant 409888/2023.
Acknowledgements
The authors would like to express their sincere gratitude to the São Paulo Research Foundation (FAPESP), Brazil, for its support provided via Grant 2022/10144-9 and Grant 2023/04783-1. We acknowledge the valuable support provided by the Brazilian Ministry of Science, Technology and Innovation, as well as the Brazilian Space Agency. The authors would like to express their sincere appreciation to the National Council for Scientific and Technological Development (CNPq), Brazil, for the support provided through Grant 409888/2023. The authors also are grateful to the following data providers: Brazilian Network for Continuous Monitoring of GNSS Systems (IBGE) for the TEC data. We wish to extend our sincere appreciation to the European Space Agency (ESA) for their valuable provision of SWARM satellite data.
Conflict of interest
The authors declare that the research was conducted in the absence of any commercial or financial relationships that could be construed as a potential conflict of interest.
Generative AI statement
The authors declare that no Generative AI was used in the creation of this manuscript.
Any alternative text (alt text) provided alongside figures in this article has been generated by Frontiers with the support of artificial intelligence and reasonable efforts have been made to ensure accuracy, including review by the authors wherever possible. If you identify any issues, please contact us.
Publisher’s note
All claims expressed in this article are solely those of the authors and do not necessarily represent those of their affiliated organizations, or those of the publisher, the editors and the reviewers. Any product that may be evaluated in this article, or claim that may be made by its manufacturer, is not guaranteed or endorsed by the publisher.
References
Berger, T. E., Dominique, M., Lucas, G., Pilinski, M., Ray, V., Sewell, R., et al. (2022). Incident and the threat of geomagnetic storms to low Earth orbit space operations. Space Weather. doi:10.1029/2022SW004350
Borovička, J. (1994). Two components in meteor spectra. Planet. Space Sci. 42, 145–150. doi:10.1016/0032-0633(94)90025-6
Borovička, J., and Betlem, H. (1997). Spectral analysis of two perseid meteors. Planet. Space Sci. 45, 563–575. doi:10.1016/s0032-0633(97)00024-x
Brown, P., Ceplecha, Z., Hawkes, R. L., Wetherill, G. W., Beech, M., and Mossman, K. (1994). The orbit and atmospheric trajectory of the peekskill meteorite from video records. Nature 367, 624–626. doi:10.1038/367624a0
Campbell-Brown, M. D., and Koschny, D. (2004). Model of the ablation of faint meteors. Astronomy and Astrophysics 418, 751–758. doi:10.1051/0004-6361:20041001
Ceplecha, Z., and ReVelle, D. O. (2005). Fragmentation model of meteoroid motion, mass loss, and radiation in the atmosphere. Meteorit. and Planet. Sci. 40, 35–54. doi:10.1111/j.1945-5100.2005.tb00363.x
Ceplecha, Z., Borovička, J., Elford, W. G., ReVelle, D. O., Hawkes, R. L., Porubcan, V., et al. (1998). Meteor phenomena and bodies. Space Sci. Rev. 84, 327–471. doi:10.1023/A:1005069928850
Cheng, W., Teng, P., Lyu, J., and Dai, Y. (2021). Infrasound detection and altitude estimation associated with the December 22, 2020 yushu fireball. Geosci. Lett. 8, 26. doi:10.1186/s40562-021-00196-6
Cicone, A., and Zhou, H. (2021). Numerical analysis for iterative filtering with new efficient implementations based on FFT. Numer. Math. 147 (1), 1–28. doi:10.1007/s00211-020-01165-5
Clemesha, B. R., Kirchhoff, V., Simonich, D. M., and Takahashi, H. (1978). Evidence of an extra-terrestrial source for the mesospheric sodium layer. Geophys. Res. Lett. 5 (10), 873–876. doi:10.1029/gl005i010p00873
Cox, R. M., and Plane, J. M. C. (1998). An ion-molecule mechanism for the formation of neutral sporadic Na layers. J. Geophys. Res. 103, 6349–6359. doi:10.1029/97JD03376
Edwards, W. N., Brown, P., and ReVelle, D. O. (2006). Estimates of meteoroid kinetic energies from observations of infrasonic airwaves. J. Atmos. Sola-Terrestrial Phys. 68, 1136–1160. doi:10.1016/j.jastp/2006.02.010
Fang, T.-W., Kubaryk, A., Goldstein, D., Li, Z., Fuller-Rwell, T., Millward, G., et al. (2022). Space weather environment during the SpaceX starlink satellite loss in February 2022. Space Weather 20 (11), e2022SW003193. doi:10.1029/2022SW003193
Forbes, J. M. (2007). Dynamics of the thermosphere. J. Meteorological Soc. Jpn. Ser. II (85), 193–213. doi:10.2151/jmsj.85B.193
Garcia, J. F., Taylor, J. M., and Kelley, M. C. (1997). Two-dimensional spectral analysis of mesospheric airglow image data. Appl. Opt. 36 (29), 7374–7385. doi:10.1364/ao.36.007374
Glasstone, S., and Dolan, P. J. (1977). The effects of nuclear weapons in Prepared and published by United State department of defense (Washington, DC (USA): Department of Energy).
Hocking, W. K., Fuller, B., and Vandepeer, B. (2001). Real-time determination of meteor-related parameters utilizing modern digital technology. J. Atmos. Sola-Terrestrial Phys. 63, 155–169. doi:10.1016/S1364-6826(00)00138-3
Hofmann-Wellenhof, B., Lichtenegger, H., and Wasle, E. (2007). GNSS–global navigation satellite systems: GPS, GLONASS, galileo, and more. Springer Science and Business Media.
Hughes, D. (1993). “Meteoroids: an overview,” in In meteoroids and their parent bodies, proceedings of the international astronomical symposium. Editors J. Stolh, and I. P. Williams (Bratislava).
Jiao, J., Yang, G., Cheng, X. U., Zhengkuan, L., Jihong, W., Zhenzhong, Y., et al. (2018). Simultaneous lidar observation of peculiar sporadic K and Na layers at são josé dos campos (23.1°S, 45.9°W), Brazil. Adv. Space Res. 61, 1942–1951. doi:10.1016/j.asr.2017.12.002
Klobuchar, J. A. (1987). Ionospheric time-delay algorithm for single-frequency GPS users. IEEE Trans. Aerosp. Electron. Syst. (3), 325–331. doi:10.1109/taes.1987.310829
Laštovička, J., Boška, J., Burešová, D., and Kouba, D. (2012). High historical values of foEs–Reality or artefact? J. Atmos. Sola-Terrestrial Phys. 74, 51. doi:10.1016/j.jastp.2011.10.008
Lebedinets, V. N., and Shushkova, V. B. (1970). Meteor ionization in the E-layer. Planet. Space Sci. 11, 1659–1663. doi:10.1016/0032-0633(70)90040-1
Mathews, J. D. (1998). Sporadic E: current views and recent progress. J. Atmos. Solar-Terrestrial Phys. 60, 413–435. doi:10.1016/S1364-6826(97)00043-6
Pierce, J. A. (1938). Abnormal ionization in the E region of the ionosphere. Proc. IRE 26, 892–908. doi:10.1109/JRPROC.1938.228426
Pimenta, A. A., Fagundes, P. R., Bittencourt, J. A., Sahai, Y., Gobbi, D., Medeiros, A. F., et al. (2001). Ionospheric plasma bubble zonal drift: a methodology using OI 630 nm all-sky imaging systems. Adv. Space Res. 27, 1219–1224. doi:10.1016/S0273-1177(01)00201-0
Pimenta, A. A., Batista, P. P., Andrioli, V. F., Fagundes, P. R., and Batista, I. S. (2022). Possible relationship of meteor disintegration in the mesosphere and enhancement of sodium atoms: a case study on July 05, 2013. Adv. Space Res. 69, 1344–1350. doi:10.1016/j.asr.2021.11.028
Plane, J. M. C., Feng, W., and Dawkins, E. C. M. (2015). The mesosphere and metals: chemistry and changes. Chem. Rev. 115, 4497–4541. doi:10.1021/cr500501m
Popova, O. (2005). Meteoroid ablation models. Earth, Moon, Planets 95, 303–319. doi:10.1007/1-4020-5075-5_32
Popova, O., Sidneva, S., Strelkov, A., and Shuvalov, V. (2001). “Formation of the disturbed area around fast meteor body,” in Proceedings of the meteoroids 2001, 237–245.
ReVelle, D. O. (1997). Historical detection of atmospheric impacts by large bolides using acoustic-gravity wavesa. Ann. N.Y. Acad. Sci. 822, 284–302. doi:10.1111/j.1749-6632.1997.tb48347.x
ReVelle, D. O., and Whitaker, R. W. (1999). Infrasonic detection of a leonid bolide: 1998 November 17. Meteorit. and Planet. Sci. 34, 995–1005. doi:10.1111/j.1945-5100.1999.tb01419.x
Silber, E. A., and Brown, P. G. (2014). Optical observations of meteors generating infrasound-I: acoustic signal identification and phenomenology. J. Atmos. Sola-Terrestrial Phys. 63, 116–128. doi:10.1016/j.jastp.2014.07.005
Silber, E. A., ReVelle, D. O., Brown, P. G., and Edwards, W. N. (2009). An estimate of the terrestrial influx of large meteoroids from infrasonic measurements. J. Geophys. Res. Planets 144 (E8). doi:10.1029/2009JE003334
Simonich, D. M., and Clemesha, B. R. (2008). Sporadic sodium layers and the average vertical distribution of atmospheric sodium: comparison of different nas layer strengths. Adv. Space Res. 42, 229–233. doi:10.1016/j.asr.200.8.03.027
Tagliaferri, E., Spalding, R., Jacobs, C., Worden, S. P., and Erlich, A. (1994). “Detection of meteoroid impacts by optical sensors in Earth orbit,” in Hazards due to comets and asteroids. Editor T. Gehrels (Tucson, Arizona: University of Arizona Press), 199–220.
Verhulst, T. G., Altadill, D., Barta, V., Belehaki, A., Burešová, D., Cesaroni, C., et al. (2022). Multi-instrument detection in Europe of ionospheric disturbances caused by the 15 January 2022 eruption of the Hunga volcano. J. Space Weather Space Clim. 12, 35. doi:10.1051/swsc/2022032
von Zahn, U., von der Gathen, P., and Hansen, G. (1987). Forced release of sodium from upper atmospheric dust particles. Geophys. Res. Lett. 14, 76–79. doi:10.1029/gl014i001p00076
von Zahn, U., Hansen, G., and Kurzawa, H. (1988). Observations of the sodium layer at high latitudes in summer. Nature 331, 594–596. doi:10.1038/331594a0
Vondrak, T., Plane, J. M. C., Broadley, S., and Janches, D. (2008). A chemical model of meteoric ablation. Atmos. Chem. Phys. 8, 7015–7031. doi:10.5194/acp-8-7015-2008
Wang, X., Miao, J., Aa, E., Ren, T., Wang, Y., Liu, J., et al. (2020). Statistical analysis of joule heating and thermosphere response during geomagnetic storms of different magnitudes. J. Geophys. Res. Space Phys. 111, e2020JA027966. doi:10.1029/2020JA027966
Weryk, R. J., and Brown, P. G. (2013). Simultaneous radar and video meteors—Ii: photometry and ionisation. Planet. Space Sci. 81, 32–47. doi:10.1016/j.pss.2013.03.012
Wilson, G. R., Weimer, D. R., Wise, J. O., and Marcos, F. A. (2006). Response of the thermosphere to joule heating and particle precipitation. J. Geophys. Res. Space Phys. 111. doi:10.1029/2005JA011274
Keywords: mesosphere/thermosphere, ionosphere, all-sky images, lidar, meteor radar, infrasound, bolide
Citation: Pimenta AA, Adebayo OM, Wrasse CM, de Jesus R, Santos AM, Batista PP, Andrioli VF, Fagundes PR, Kherani EA, Savio SA and Olajide OF (2025) Super bolide explosion in the upper atmosphere and possible implications for very low earth orbit satellites: a case study on May 25, 2023. Front. Astron. Space Sci. 12:1689801. doi: 10.3389/fspas.2025.1689801
Received: 20 August 2025; Accepted: 03 November 2025;
Published: 03 December 2025.
Edited by:
Andrés Calabia, University of Alcalá, SpainReviewed by:
John Meriwether, New Jersey Institute of Technology, United StatesYanlin Li, Miami University, United States
Copyright © 2025 Pimenta, Adebayo, Wrasse, de Jesus, Santos, Batista, Andrioli, Fagundes, Kherani, Savio and Olajide. This is an open-access article distributed under the terms of the Creative Commons Attribution License (CC BY). The use, distribution or reproduction in other forums is permitted, provided the original author(s) and the copyright owner(s) are credited and that the original publication in this journal is cited, in accordance with accepted academic practice. No use, distribution or reproduction is permitted which does not comply with these terms.
*Correspondence: A. A. Pimenta, YWxleGFuZHJlLnBpbWVudGFAaW5wZS5icg==