 Victoria Da Poian1,2,3*
 Sarah M. Hörst3
 Eric I. Lyness1,2Xiang Li1
 Ryan M. Danell1,4
 William B. Brinckerhoff1
 Bethany P. Theiling1
- 1Planetary Environments Laboratory, NASA Goddard Space Flight Center, Greenbelt, MD, United States
- 2Tyto Athene LLC, Reston, VA, United States
- 3Earth and Planetary Sciences, Johns Hopkins University, Baltimore, MD, United States
- 4Danell Consulting Inc., Winterville, NC, United States
Mass spectrometers are powerful instruments that aim to identify unknown compounds via their mass-to-charge ratio and perform quantitative and semi-quantitative analysis. These instruments have been essential to space missions over the past several decades (e.g., Pioneer Venus, Viking, Galileo, Cassini, Mars Science Laboratory) with several more en route (e.g., JUpiter ICy moons Explorer (JUICE), Europa Clipper) or under development (e.g., Rosalind Franklin, Dragonfly). However, future missions targeting remote planetary bodies increasingly face limited data transmission rates and volumes, which limit the amount of information that can be sent back to Earth. These challenges highlight the need for onboard science autonomy to optimize science return. Machine learning (ML) and data science tools can significantly contribute to the development of science autonomy by enabling rapid interpretation and prioritization of science data. Yet, these efforts for planetary science applications are hindered by the scarcity of representative datasets for training models, especially for complex flight instruments. In this work, we build on our earlier science autonomy work using the Mars Organic Molecule Analyzer (MOMA) instrument for the Rosalind Franklin (ExoMars) mission as a proof-of-concept. We investigate the generation of artificial mass spectra through “manual” augmentation techniques and evaluate their performance on mass spectrometer (MS) data using the laser desorption/ionization mass spectrometry (LDMS) mode of the flight-like MOMA engineering test unit (ETU). We implement basic transformation-based augmentation methods such as peak intensity randomization, peak shifting (by limited and realistic m/z values), etc. We assess their scientific integrity in collaboration with instrument experts and investigate how the inclusion of generated data affects the performance of ML algorithms for mass spectral analysis. We compare the performance of supervised learning models on predicting the chemical categories of new input mass spectra, both with and without augmented data, to evaluate the impact of these techniques. Our work provides guidelines for developing realistic augmented mass spectra without compromising scientific validity, while also contributing to the development of a mature framework for ML tools in MS data analysis, advancing science autonomy for existing and future planetary missions.
1 Introduction
1.1 Planetary science challenges–need for autonomy
As space exploration missions target more distant planetary bodies in our solar system–including Ocean Worlds (e.g., Titan, Europa, Enceladus), comets (e.g., 67P/Churyumov-Gerasimenko), and asteroids (e.g., Bennu, Ryugu, Psyche) – it is becoming clear that onboard autonomy will play an increasingly critical role in optimizing the science achieved. The Planetary and Astrobiology Decadal Survey (National Aeronautics and Space Administration, 2022) states that “missions targeting remote planetary bodies will face limited data rates and volumes and will require onboard science autonomy to optimize science return.” Future missions to ever more distant targets will be severely limited by stringent communication constraints including narrow communication time windows, long latencies, and restrictive bandwidth, which renders prohibitive any ambitious missions that rely on current operation models based on pre-programmed data acquisition interleaved with ground-in-the-loop interactions. In addition, these future missions would be further constrained in their ability to respond optimally to uncertain and new environments and events under such a constrained cadence.
Groundbreaking planetary missions such as Dragonfly targeting Titan in the 2030s (Barnes et al., 2021; Turtle et al., 2020), Europa Clipper on its way to Europa (Phillips and Pappalardo, 2014), Rosalind Franklin destined for Mars (Vago et al., 2017) and the Enceladus Orbilander (identified as a priority in National Academies of Sciences Engineering and Medicine (2022), Mackenzie et al. (2021)), include advanced science instruments able to collect greater data volumes than can be sent back to Earth. These missions aim to conduct in situ compositional analysis on planetary bodies where data downlink is highly constrained. Mass spectrometers (MS) are powerful instruments onboard Dragonfly, Clipper, and Rosalind Franklin (and potentially included on Orbilander), that aim to identify unknown compounds via their mass-to-charge ratio and perform quantitative analysis of these compounds. MS instruments have been essential to space missions over the past several decades (e.g., Pioneer Venus, Viking, Galileo, Cassini, Mars Science Laboratory) with several more en route (e.g., JUpiter ICy moons Explorer (JUICE), Europa Clipper) or under development (e.g., Rosalind Franklin, Dragonfly) (Chou et al., 2021). Instruments currently being developed for future missions are capable of generating even more data (Arevalo et al., 2019) with sampling rates already increasing from 50 samples per second for the quadrupole mass spectrometer Sample Analysis at Mars (SAM) onboard Curiosity, to 50,000 samples per second for the MOMA ion trap mass spectrometer on ExoMars, and expected to reach millions per second for next-generation orbitrap mass spectrometers. This rapid growth far exceeds the data transmission rates to Earth which are limited by physics and communications technologies, emphasizing a widening gap between the volume of data that can acquired compared to what can be transmitted back to Earth. Therefore, major advancements essential to support future mission operations and data collection could be enabled with more autonomy.
Given how autonomy could enhance and enable space exploration missions, we investigate the concept of science autonomy–the ability of a science instrument to analyze its own data, make decisions about what data to send back to Earth, and learn to adapt itself to improve the next measurements–for a Mars exploration mission as an initial proof-of-concept. Machine learning (ML) is a promising tool to enable time-efficient data triage and classification required by onboard science autonomy (Chien and Morris, 2014; Thompson et al., 2015; Chien et al., 2017). In this context, autonomy depends on the ability to prioritize, filter, and interpret instrument data so that the most informative data are transmitted to Earth and used to guide subsequent operations. We leverage our previous work with the MOMA instrument on the Rosalind Franklin (ExoMars) mission (Da Poian et al., 2022b) using ML and data science tools to further investigate the application of science autonomy on mass spectrometry data for space missions. While full science autonomy would ultimately require algorithms onboard, our initial implementation focuses on supporting the science team’s decision-making process on Earth during operations on Mars by enhancing data interpretation–a step toward developing and validating approaches that can eventually transition to onboard use. Achieving this level of autonomy could highly benefit from robust ML algorithms as they offer a promising solution for scientific data analysis during constrained space operations. However, the development of reliable ML models in this context is limited by the scarcity of representative training datasets. Mass spectrometers on space missions are optimized for their specific target environments, making them unique and expensive to build and operate, with typically only two or three instances of the instrument built per mission. This limited availability restricts opportunities to collect diverse and statistically significant datasets for ML models development. To address this limitation, our work investigates the use of data augmentation techniques to generate scientifically consistent mass spectra to expand the limited available dataset volumes without introducing bias. By carefully, designing and validating these generated data products in collaboration with instrument experts, we aim to create training datasets that are both relevant for the purpose of ML model development and suitable to advance future onboard autonomy.
1.2 Data science and machine learning in planetary science
Data science is an interdisciplinary field that extracts insights and knowledge from data using various techniques such as statistical analysis and data mining (Cao, 2017). Data science uses mathematical and statistical theory (often in combination with programming) to describe data relationships and trends. ML is a subset of artificial intelligence (AI) that focuses on algorithm development to enable computers to learn and improve from experience (Figure 1). ML algorithms can mainly be divided into unsupervised ML techniques, aiming at finding unbiased patterns and similarities in the input dataset to group similar data into clusters (e.g., dimensionality reduction and clustering algorithms), and supervised ML techniques, aiming at using input labels to train the model to predict a specific output (e.g., classification and regression algorithms) (Carbonell et al., 1983; Ayodele, 2010).
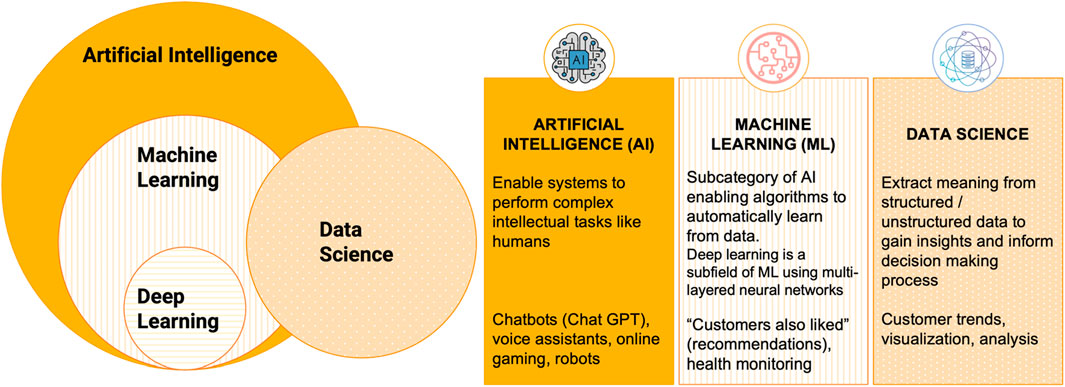
Figure 1. Relationship between artificial intelligence (AI), machine learning (ML), deep learning (DL), and data science and basic definitions.
ML and data science have become widely investigated and adopted across both the science community and the space sector. These methods are tackling many challenges, from the limited communication bandwidth and delayed data transmission, to the ever-expanding volumes of scientific and engineering data. For instance, ML algorithms are used for autonomous navigation and hazard avoidance on planetary surfaces (e.g., Mars rovers (González et al., 2020), real-time anomaly detection onboard spacecraft (Hundman et al., 2018), onboard science event detection (Wagstaff et al., 2019), and mission planning optimization (Wang et al., 2022). Deep learning approaches have opened new frontiers in space exploration such as in the classification of Martian terrains (Rothrock et al., 2016) as well as in the automatic detection of exoplanets from Kepler and TESS light curves (Malik et al., 2022). Collectively, these applications highlight the growing importance and critical role of ML algorithms in enabling more autonomous space exploration. Building on this trend, a natural step is to extend ML-driven autonomy to science instruments themselves. In the case of MS, ML methods could enable onboard science autonomy by triaging large datasets, prioritizing scientifically valuable features for downlink, and adapting measurement strategies in near-real time to maximize mission science return. As the development of such onboard capabilities through ML algorithms is constrained by the scarcity of representative training data from flight-like instruments, our work investigates data augmentation approaches to generate realistic, scientifically valid MS data to expand limited datasets without introducing bias.
1.3 Application to the Rosalind Franklin MOMA instrument
In this work, we focus on advancing ML applications for mass spectrometry data from Mars by leveraging datasets from the engineering test unit (ETU) of the Mars Organic Molecule Analyzer (MOMA) instrument planned to be onboard the Rosalind Franklin (ExoMars) rover mission (Goesmann et al., 2017; Brinckerhoff et al., 2013) (Figure 2). MOMA is a dual-ionization source mass spectrometer instrument designed to detect and characterize a broad range of organic molecules in surface and subsurface samples. MOMA is centered around a linear ion trap mass spectrometer (ITMS) interfaced with two complementary “front-end” analytical techniques: laser desorption/ionization (LDI) and gas chromatography (GC). This dual capability enables MOMA to target a broad range of organic molecules (with masses up to 1,000 Da), from volatile to nonvolatile compounds. Here we only focus on laser desorption/ionization mass spectrometry (LDMS) mode data as it is particularly valuable for the detection of nonvolatile complex organics over a wide range of molecular weights, providing insights into potential biosignatures or prebiotic chemistry on Mars (Li et al., 2017). By leveraging this LDMS dataset, we aim to advance analytical techniques to maximize scientific return.
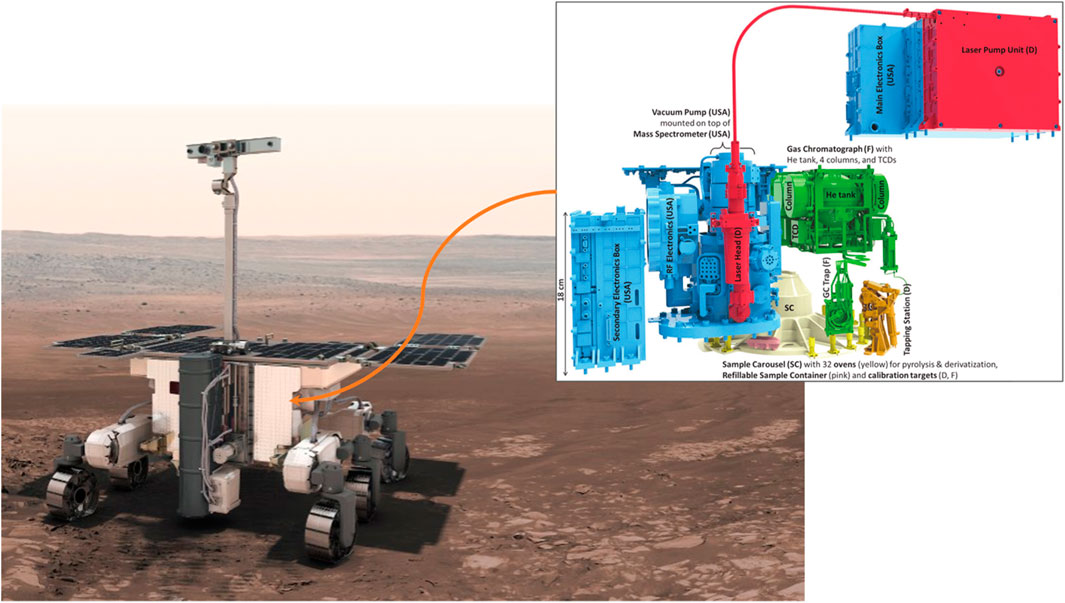
Figure 2. Representation of the Rosalind Franklin ExoMars rover (credits: European Space Agency (ESA)) and diagram of the Mars Organic Molecule Analyzer (MOMA) instrument onboard (credits: MOMA team and ESA).
Our work aims to mature the proof-of-concept science autonomy approaches we previously developed (Da Poian et al., 2022a; Do et al., 2024) and refine ML techniques on this LDMS dataset to enhance MOMA’s scientific return. Our ML task focuses on clustering similar spectra and on the classification of mass spectra into main chemical families (10 different families/labels defined by MOMA scientists) and predicting chemical sample composition (67 labels) of new, previously unmeasured mass spectra during Mars exploration. This work provides a data analysis pipeline and internal tools to allow the MOMA science team to efficiently assess the chemical composition of Martian samples. The pipeline aims to enable scientists to quickly analyze new mass spectra, guiding operational decisions such as performing tandem mass spectrometry (i.e., MS/MS), isolating peaks of interest, adjusting laser desorption/ionization parameters, and determining if a gas chromatography mass spectrometry (GCMS) follow-up experiment is worthwhile, ultimately accelerating scientific processing in time-limited mission operations.
By using the MOMA instrument as a proof-of-concept, we are demonstrating initial capabilities that, while currently developed for Earth-based spectral analysis and interpretation, represent critical steps toward enabling science autonomy on future planetary missions. These methods could be generalized and applied to other planetary mission concepts to enable different levels of autonomy based on the mission needs and instruments capabilities (Azari et al., 2021). A major challenge in developing such ML-based autonomy lies in the limited availability of representative training data from flight-like instruments. Here, we specifically investigate techniques to increase the amount of data available for ML algorithms training and evaluate how dataset volumes impact ML algorithms performance. At this stage, all ML model training in our research is performed on Earth, where computational resources enable to systematically explore how data augmentation affects learning. However, our long-term vision is to extend these approaches toward in situ adaptability–where models deployed onboard a spacecraft could be retrained or fine-tuned using newly acquired data. Such capabilities would enable context-aware decision-making and instrument optimization during resource-limited missions operations. In this context, exploring shorter training durations (fewer epochs) serves not as an operational constraint but mimics constrained learning conditions due to flight-like conditions, allowing us to assess how augmentation enhances model generalization when data or training iterations are limited. By systematically evaluating how these generated datasets affect ML performance, we lay the groundwork for more robust and scalable ML solutions that can ultimately support autonomous MS operations in future planetary science missions.
2 Dataset and augmentation techniques
The development of reliable ML models to enable the analysis and prediction of chemical compositions using MS data is challenged by the limited availability of representative training data–a consequence of the high cost and constraints of conducting tests on flight-like instruments. If the volume of data is insufficient to provide enough representative data, the best solution would be to collect more data in the laboratory or in the field. However, this process is time-consuming, resource intensive, and expensive, so we explore data augmentation and data generation techniques to expand the available input dataset. The two main approaches to increasing data volume are: 1) using a real data point and applying algorithms (classic algorithms or more complex ones like neural network (NN) techniques) to augment existing real data points (Figure 3), and 2) generating entirely synthetic data based on simulations with varying input parameters.
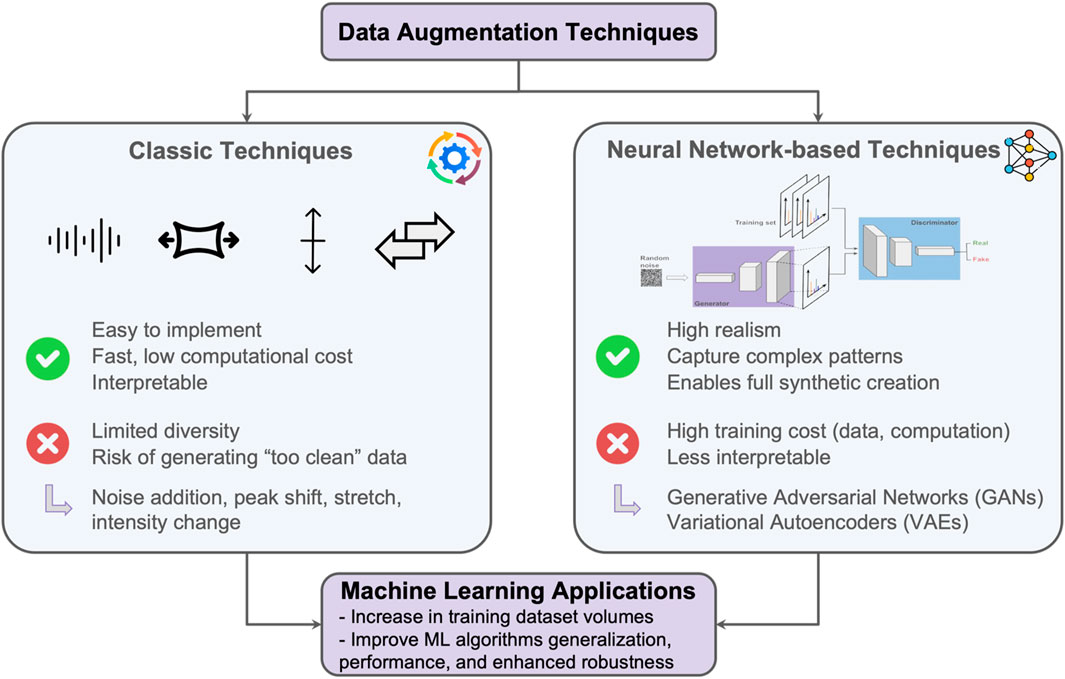
Figure 3. Data augmentation techniques definition, pros and cons, and examples: classic techniques (applied in this work) and neural networks-based techniques (that will be investigated in future work).
In mass spectrometry applications, modification strategies for mass spectra have traditionally focused on preprocessing steps such as baseline correction, noise reduction treatment, normalization, and peaks alignment (Ràfols et al., 2018). With the evolution of chemometrics and ML studies, data augmentation techniques including noise injection, peak intensity modification are being explored with particular attention to preserving chemical plausibility (Bjerrum et al., 2017). Building on these concepts, recent studies have explored realistic spectral variations that mimic physical and/or instrumental effects. For instance, Wang et al. (2024) analyzed some carefully-designed augmentation strategies, such as noise injection and peaks values modifications (e.g., through peak averaging and square-root transformations) for deep learning models for aerosol particle classification under conditions of limited and imbalanced single-particle MS data. Their results highlight the value of specific augmentation in improving model generalization when experimental data are limited or heterogeneous. Similar approaches have long been used in other domains, such as for image analysis, where data augmentation techniques consist in applying geometric transformations such as flipping, cropping, rotating, modifying colors, and injecting noise to augment the data volume (Shorten, C. and Khoshgoftaar, T.M., 2019). Similar strategies are being adapted for MS data through both algorithmic and NN-based techniques (Figure 3). Other ML-based techniques such as Generative Adversarial Networks (GANs), a NN technique that can generate synthetic but realistic data (Goodfellow et al., 2020), are promising and will be explored in the future. In this study, we focus on traditional data augmentation techniques to increase our training dataset by introducing slight modifications to existing data, with the goal of improving the ML model’s generalization performance, reducing overfitting, and enhancing performance on novel data.
2.1 Available dataset
Our work leverages mass spectral data from the ETU of the MOMA instrument (Figure 2) (Li et al., 2017). The ETU is a form, fit, and functional duplicate of the flight model (FM) that permits analysis of a wide range of standard and Mars analog samples into a proxy carousel for direct LDMS analysis using a UV (266 nm) pulsed laser. The analysis performed on the ETU represents a high-fidelity analog of MOMA operation and data production. This instrument is a critical flight resource for the Rosalind Franklin mission and is thus tracked closely and maintained in a controlled configuration and high level of cleanliness, with significant operator support requirements; as such, the range and scope of new samples analyzed by the ETU is limited. To date, several hundred samples have been analyzed on the ETU, each producing thousands of individual mass spectra on average.
Our original dataset is composed of about ∼30,000 LDMS spectra collected on the ETU by the science team for scientific purposes (Da Poian et al., 2022b), with engineering test data excluded and archived separately in an internal NASA database. The data augmentation we investigate here involves processes to artificially increase the available dataset by introducing statistically plausible variations to the original data. While data augmentation techniques are commonly applied to image and signal processing domains (Shorten and Khoshgoftaar, 2019; Wang and Perez, 2017), augmentation for MS data, especially in planetary science context, requires careful consideration to preserve the underlying scientific validity of the data. Several challenges arise when designing augmentation strategies for MS data such as:
- The preservation of scientific validity: as each peak represents a specific ion or fragment, the alteration of a peak intensity or position could lead to the wrong interpretation of the chemical signature.
- The domain-specific variability: as MS patterns depend on the instrument type and the instrument characteristics (e.g., ionization method, type of mass spectrometer, instrument and sample cleanliness, etc.), augmentation techniques should not introduce bias toward a specific “wrong” instrument behavior.
- The complex relationship between peaks: as MS peaks represent fragmentation patterns and isotopic relationships, augmentation techniques must maintain internal consistency of these complex molecular fragmentation patterns.
- The balance between scientific validity and the creation of a diverse dataset: the goal of augmentation techniques is to increase the diversity of the dataset while respecting the instrument and science fidelity.
To mitigate these challenges, we developed traditional augmentation techniques that carefully constrain modifications of MS data within chemically meaningful ranges, ensuring that the generated spectra remain representative of the true instrument behavior. For instance, intensity changes were applied globally rather that to specific isolated peaks, shifts were bounded within instrument resolution limits, and noise additions were derived from experimental runs. Our augmentation strategies maintain fidelity to the scientific constraints of LDMS data while still producing a more diverse and robust dataset for input to ML algorithms.
2.2 Traditional augmentation techniques
We developed scripts for various data augmentation techniques (Table 1) designed to mimic realistic mass spectral variability due to instrumental or environmental factors. These scripts include techniques to shift peaks by shifting m/z values (i.e., the x-axis values) and the relative intensity values (i.e., the y-axis values), as well as adding noise (focusing on random noise). We also investigate a stretch transformation and the shift of some peaks. Each technique is assessed by MOMA scientists for its consistency with the physical principles underlying LDMS data and more specifically MOMA-related chemistry. The goal of scientific validity is to ensure that the transformations do not introduce artifacts inconsistent with MS science. This augmentation strategy aims to enhance the ML model generalization and robustness while preserving the scientific validity of the augmented mass spectra. We introduce below the various augmentation techniques we implement in a Python script on the original MOMA dataset.
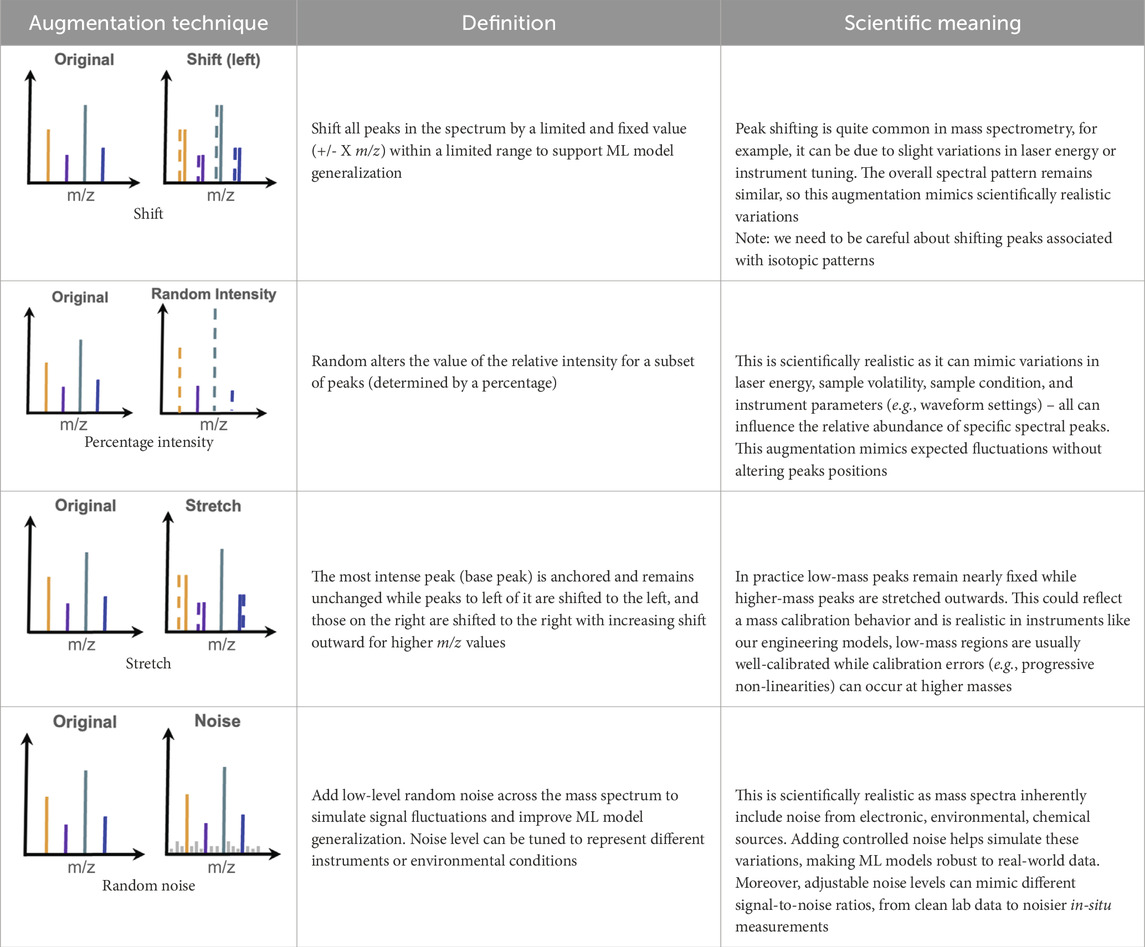
Table 1. Summary of the various classic data augmentation techniques investigated in this work, with schematics of each technique, their definition and their scientific meanings, and their limits for mass spectrometry data.
2.2.1 Shift
This technique applies a uniform shift to all m/z values in a spectrum by a small, random offset (e.g., +/- 1.5 m/z) (Table 1, raw 1). The entire mass spectrum is shifted to the left or right along the x-axis (i.e., m/z axis) while relative intensity values for each peak (i.e., y-axis) remain unchanged. Scientifically, in mass spectrometry, especially for laser-based MS instruments like MOMA, small m/z shifts across entire spectra commonly occur due to instrumental variations such as laser energy fluctuations, timing offsets in the waveform, or calibration shift in the mass analyzer. These global shifts are common, particularly during warm-up. This augmentation technique, using a very limited m/z range, simulates the calibration drifts and helps ML models learn the spectral patterns independent of exact alignment with precise m/z values.
A variant approach was also tested, in which a specified percentage of randomly selected peaks were shifted by a random value within +/- 2 m/z, while the rest of the peaks remain untouched. However, this method does not reflect any physical processes in most MS, since the peaks positions are governed by the ion flight path and timing calibration, which affects all ions systematically rather than individually. As a result, we removed this augmentation and instead employed a stretch-like augmentation technique, which is more physically plausible.
2.2.2 Stretch
Here, the most intense peak in a spectrum, also called “base peak” is anchored and remains unchanged (green peak in schematics of Table 1, raw 2) The peaks to the left (lower m/z) are shifted slightly toward lower m/z values, while peaks to the right of the base peak (high m/z) are shifted towards higher m/z values, with magnitude increasing with distance. This creates a “stretched” effect from the anchored base peak outward (Table 1, raw 2). Specifically for linear ion trap devices such as the MOMA instrument, spectral stretching simulates calibration drift caused by factors like RF amplitude nonlinearity, space charge effects, and variable ion ejection timing due to scan rate dependencies. In practice, low-mass calibration in MOMA is usually more susceptible to space charge effects, whereas higher-mass peaks may appear stretched due to amplifier nonlinearity or frequency drifts. This augmentation is valuable when simulating the progressive mass calibration drift commonly observed when analyzing samples with high ion density or over longer periods of time and under different environmental conditions.
2.2.3 Intensity change
In this technique, we randomly selected a fraction of peaks (e.g., 30%) and scale their intensity up or down within a given factor (e.g., 0.7x - 1.3x) (Table 1, raw 3). The peak positions (i.e., m/z values) on the x-axis remain unchanged.
This simulates real-world variability in relative peak intensities caused by laser focus or pulse-to-pulse stability, sample heterogeneity, or ionization efficiency. For example, in cesium iodide (CsI) samples (the MOMA calibration sample), the parent ion at m/z 133 is not always the most intense peak, and ion clusters like m/z 393 (i.e., Cs2I) may dominate. This augmentation mimics the variability and encourages ML models to rely on relative patterns, not on the absolute intensity.
2.2.4 Noise addition
Here we added different types of noise to the intensity values of each peak (i.e., y-axis) (Table 1, raw 4). We investigated random noise, where we added uniform noise to the mass spectrum and where the intensity of each data point was modified by a random value from a non-Gaussian distribution. Random noise is a plausible example of non-ideal environmental noise, simulating chemical and instrument noise and could mimic the laser shot-to-shot variations combined with electronic noise from the detector. As the noise addition mimics both the instrument and chemical noise, it can increase the robustness of ML models to artifacts and complex real-world spectra.
2.3 Scientific consistency
Once the augmented MS data were created, we implemented a validation process in close collaboration with the MOMA science team to ensure their scientific consistency related to the MOMA instrument. The MOMA science team reviewed and analyzed the augmented spectra using similar diagnostic process as for flight data analysis. They specifically focused on:
- the peak shapes, consistent with the MOMA instrument,
- the relative peak intensities,
- the m/z distributions and shifts introduced by augmentation, to ensure the shifts stayed within MOMA’s known calibration uncertainties,
- the noise levels, to ensure they remained within realistic instrument behavior and did not introduce non-desired artifacts or implausible features.
These criteria were assessed through manual expert review process using visualization tools applied to MOMA ETU data. This process was iterative to refine data augmentation characteristics to ensure that the augmented datasets maintained the science integrity and could be used to support the ML model development without introducing bias, artifacts or misleading features.
3 Methodology and neural network performance metrics
3.1 Experimental setup and methodology
In this work, we build upon earlier efforts that developed ML-based analyses of MOMA LDMS mass spectra (Da Poian et al., 2021). The original dataset consists of LDMS spectra collected from the MOMA ETU model during laboratory experiments using both individual chemical standards and complex mixtures representative of analog materials relevant to Mars exploration. These laboratory experiments covered a range of molecular families expected during MOMA flight operations, providing a diverse and representative training set for ML model development (Da Poian et al., 2022a). In collaboration with the MOMA science team, each mass spectrum was labeled using two different ways: a category label, representing the chemical family of the tested compound (e.g., “pure mineral”, “pure organic standard”), and a sample label, representing the specific physical sample analyzed (e.g., “hematite”). The dataset is moderately imbalanced with calibration spectra being the most frequent class due to repeated tuning and performance checks on the ETU model. Each mass spectrum is represented as a one-dimensional intensity array, with both associated experimental metadata and labels compiled in a unified CSV file referred to here as the “original dataset”.
The various data augmentation methods were applied to this original dataset in custom (Table 1) generating new mass spectra based on the original data. We then combine these generated spectra with the original data to form multiple training configurations with various percentages (10%, 30%, 50%, 70%, and 90%) of augmented data. In addition to varying the amount of augmented data, we also vary the proportion of calibration data (cesium iodide) used in the input data – 0%, 50%, or 100%. These various input datasets create multiple training configurations. Finally, we varied the number of training epochs–the number of times the entire training dataset is passed through the model during learning–using 5, 10, 50, 100, and 200 epochs across all configurations of input data. The various options for the combinations of input data (i.e., amount of calibration data and amount of augmented data) and the various epochs values are represented in Figure 4.
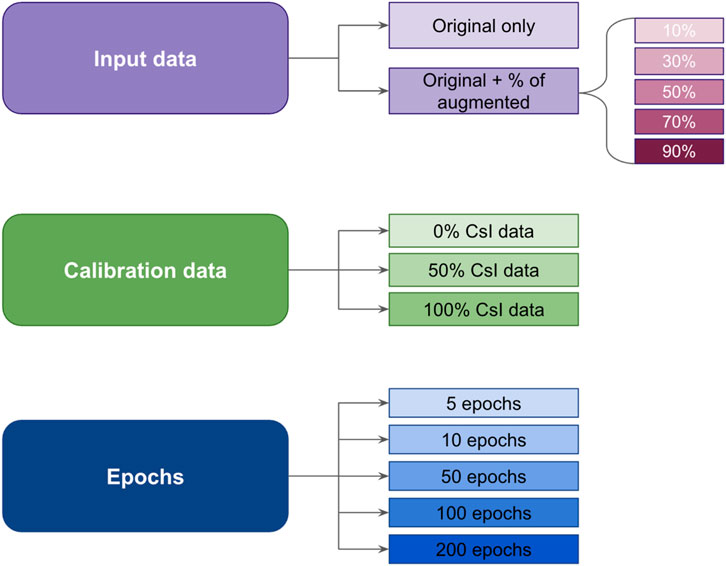
Figure 4. Summary of the parameters we vary to create different configurations for the input dataset (i.e., percentage of augmented spectra and percentage of calibration data) and various training epochs.
To evaluate the impact of augmented data on the model performance, we leverage the NN framework previously developed in Da Poian et al. (2022b) that uses open-source Python libraries including Scikit-Learn, TensorFlow, and Keras, on the various combinations of input datasets (Figure 5). In brief, this NN uses a fully connected feed-forward architecture designed to classify mass spectra into predefined chemical categories called “category labels”. Each spectrum is represented as a unidimensional array by indexing data to rounded, “integerized” (transformed into integers corresponding to the nominal unit mass) values ranging from 1 to 2,000. In this work focusing on the investigation of data augmentation on ML model performance, this previously-developed NN is trained independently on each dataset combination (e.g., original, augmented) to predict the category label. By comparing model performance across these configurations, we quantify how augmentation strategies influence the NN’s ability to generalize to unseen data and to robustly identify scientifically meaningful features in mass spectra, using standard classification metrics.
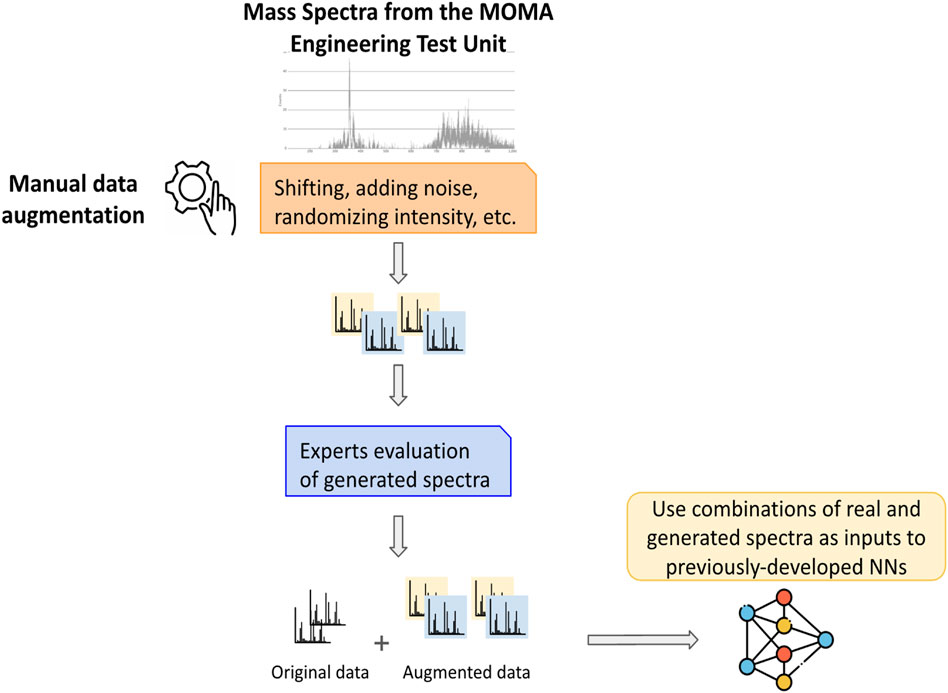
Figure 5. Pipeline from original data collection, to data augmentation process (scripts and checks with the subject matter experts), and neural network algorithm training for performance comparison.
3.2 Performance metrics description
When developing a ML classification model–such as predicting the chemical composition of samples from planetary bodies–it is essential to select and use appropriate performance metrics to evaluate the quality of the model’s predictions that reflect both statistical accuracy and scientific relevance. In the context of planetary MS data, these metrics help evaluate how reliably the model can distinguish between different chemical compound labels. In our case, a false positive, for instance, could represent a spectrum incorrectly classified as organic when it is not–potentially leading to an unnecessary activation of follow-up experiments (e.g., GCMS experiment) or in the future an incorrect prioritization of data for downlink. On the other side, a false negative could correspond to a missed detection of a scientifically significant compound, leading to lost science opportunities. Understanding these errors is critical for future autonomous decision-making frameworks. We summarize the most commonly used classification performance metrics below:
- Accuracy: the ratio of correctly predicted instances to the total instances in the dataset. While accuracy is a straightforward and widely reported metric, it could be misleading in the presence of class imbalance–a situation where some categories are represented by many more samples than others–or for specific tasks where the detections of false positives and false negatives carry different consequences.
- Precision: the ratio of correctly predicted positive (true positive) observations to the total predicted positive observations. Precision focuses on the accuracy of the positive predictions. It assesses how many of the predicted positive instances are actually correct, therefore it minimizes false positives and ensures that when a positive instance is predicted, it is highly reliable.
- Macro average precision (equal class treatment): the average precision calculated independently for each class, then averaged. This is useful to avoid false positives across all classes equally but treats all chemical classes the same, which overemphasize rare classes.
- Weighted average precision (accounts for class imbalance): precision computed for each class and weighted by the number of true instances per class. It reflects the model’s ability to avoid false positives while taking into account class distribution, but good performance on dominant chemical classes could mask poor performance on minor classes.
- Recall (or Sensitivity): the ratio of correctly predicted positive observations (true positive) to all actual positive observations. This metric measures the model’s ability to identify all relevant instances of a particular class, therefore it minimizes false negatives and ensures that most actual positive instances are correct.
- Macro average recall (equal class treatment): the average recall calculated per class, then averaged. This measures the model’s performance at detecting all instances of each chemical class.
- Weighted average recall (accounts for class imbalance): recall computed for each class and weighted by the number of true instances per class. This metric measures the ability to detect correct instances across all classes, weighted by the frequency of each class. Rare and important classes may not significantly impact this metric.
- F1-score: the harmonic mean of precision and recall. This metric provides a balanced assessment of a model’s performance, especially when there is a trade-off between minimizing false positives and false negatives.
- Macro average f1-score (equal class treatment): the harmonic mean of macro precision and macro recall. It provides a balanced view of how well the model avoids false positives and false negatives across all chemical classes equally but can obscure performance for frequent classes.
- Weighted average f1-score (accounts for class imbalance): f1-score for each class is calculated and weighted by the support of that class. It is a good overall performance measure when the distribution of chemical classes matters but might still mask underperformance on rare but scientifically critical chemical compositions.
- Confusion matrix: this is a tabular representation summarizing the classification model’s outcomes, showing the number of true positives, true negatives, false positives, and false negatives. It provides a comprehensive view of how the model performs across different classes.
As our dataset is moderately imbalanced–with some chemical classes (e.g., calibration sample) represented by many more spectra than others–single-number metrics (such as overall accuracy) can be misleading. To provide a meaningful assessment of the overall performance, the choice of the metrics needs to account for both class imbalance and scientific priorities.
4 Results and discussion
4.1 Comparison of performance between original and augmented datasets
The choice of evaluation metrics to use depends on the specific task to accomplish, the available dataset (e.g., class distribution), and the scientific or operational priorities of the task (e.g., relative importance of false positives and false negatives in the problem’s context). In our case, we are particularly interested in minimizing the number of false positives, as incorrectly predicting the presence of certain chemical compounds could lead to misleading scientific interpretations or mission operations decisions. At the same time, detecting rare but scientifically significant compounds–such as potential biosignatures or key chemical markers–is critical. For this reason, we use macro recall to evaluate the model’s ability to detect all classes equally, including low-frequency compounds, and macro f1-score to provide a balanced measure of precision and recall across all classes. Additionally, we carefully look at the weighted f1-score to capture overall model performance despite the presence of class imbalance while still reflecting the trade-off between false positives and false negatives in a way that aligns with planetary science and astrobiology science goals. All the plots for these three metrics for all the configurations are summarized in Figure 6.
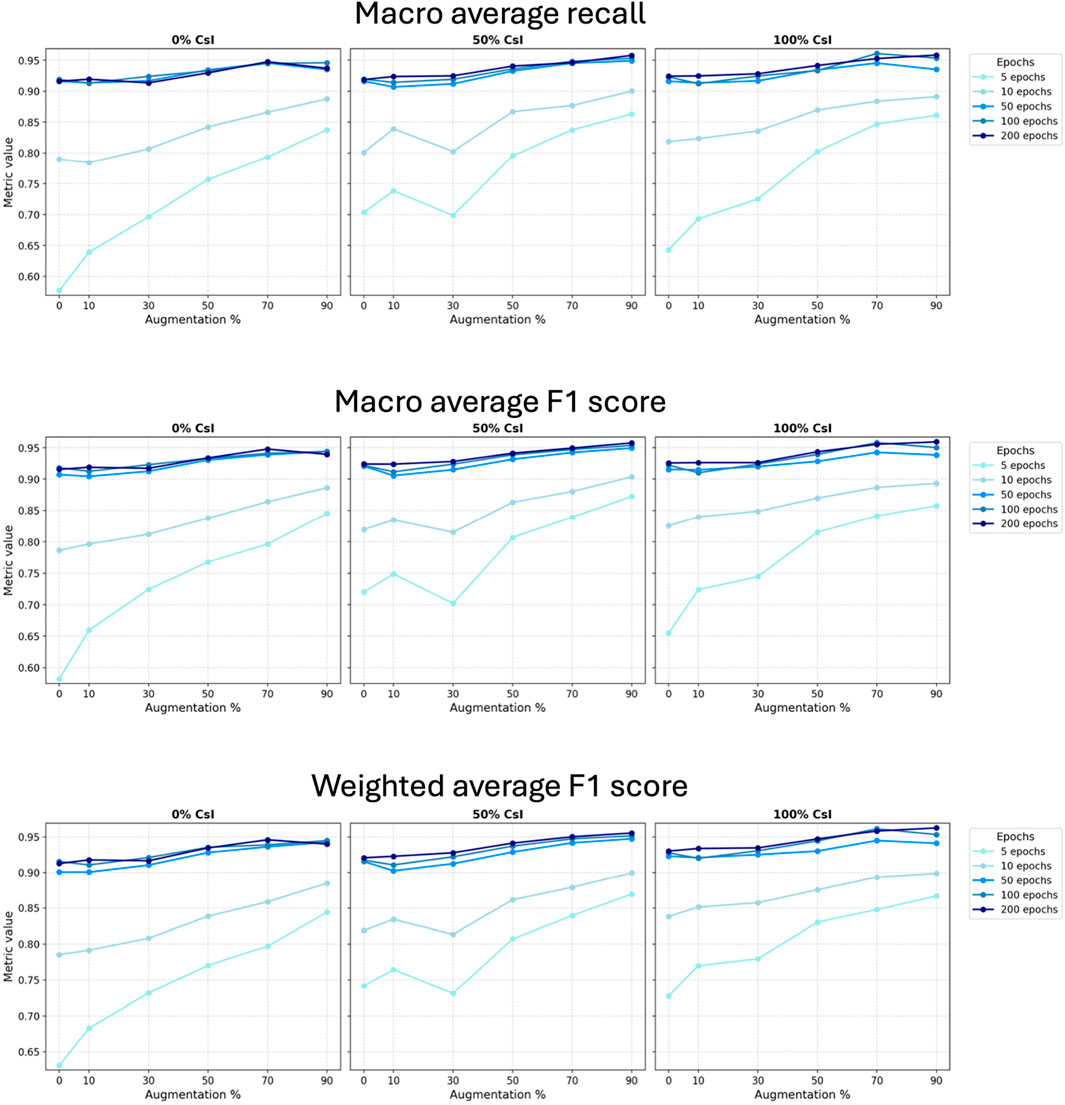
Figure 6. Main three performance metrics (macro average recall, macro average f1-score, weighted average f1-score) for all NN training combinations, varying the number of epochs (each color: 5,10, 50, 100, and 200), the amount of CsI included (plots from left to right:0, 50%, 100%), and the amount of augmentation data (x-axis: 10%, 30%, 50%, 70%, 90%).
4.1.1 Effect of augmentation percentage in the input dataset:
High-level analysis: For low epochs (5 and 10), adding a substantial fraction of augmented data to the input data (i.e., ∼50% and 70%) substantially improves all three performance metrics, confirming that augmentation can effectively compensate for limited training time. However, beyond 70% of augmented data, the gains plateau or slightly drop in some configurations–especially at higher epochs. At 200 epochs, the difference between using 70% and 90% augmented data is usually small or negative.
Looking more closely, very low level of augmentation (10%) result in only marginal improvements, if any, compared to training with the original dataset alone (0%). Moderate augmentation (30%–50%) consistently enhances performance, especially at lower epoch counts and with reduced CsI data, highlighting its value in resource-limited training scenarios. The largest performance boosts typically occur with higher augmentation levels (70%–90%), particularly when training extends beyond 50 epochs (i.e., macro recall values exceed 0.95). Yet, even in these cases, the benefits of 90% augmentation are not guaranteed to surpass those of 70%, indicating a threshold beyond which additional synthetic data may not contribute meaningfully. Overall, augmentation boosts ML model learning under specific limitations, especially when the number of epochs is constrained.
4.1.2 Effect of number of epochs
High-level analysis: The main increase in performance occurs between 5 and 10 epochs across all configurations, with still a subsequent gain from 10 to 50 epochs. Beyond 50 epochs, the increase in performance between 50, 100, and 200 epochs diminishes (Figure 6). This confirms that training time is indeed a limiting factor early in the learning phase, but its relevance diminishes with higher epochs values. We notice that 50, 100, and 200 epochs are often close in performance, suggesting 50 epochs are sufficient to train our NN algorithm within a reasonable time while attaining acceptable performance.
Although all training in this study is performed on Earth–where computational resources do not constrain training duration–the number of epochs is treated here as a controlled variable to emulate conditions of limited retraining opportunities that would happen in resource-limited environments such as onboard a spacecraft. In future in situ applications, models may need to be fine-tuned using newly acquired data under limited time and computational constraints. While training duration is not a constraint on Earth, evaluating performance across various training durations provides valuable insight on the effects of data augmentation in model generalization when learning time would be limited in future in situ scenarios.
4.1.3 Effect of amount of calibration data (CsI)
Overall, we observe that across almost all augmentation/epochs configurations, including more CsI (100%) creates better performance. This effect is larger at low epochs/low amount of augmentation data, and smaller once the NN has both high augmentation and many epochs. Moreover, having some CsI data (50%) already gives a large benefit, and going to full 100% CsI yields smaller incremental gains.
Including CsI is most valuable for low epochs and low augmentation percentage, once the configuration uses high-data (larger augmentation percentage) and higher epochs value, the benefit is marginal.
4.2 Computational training time
Obviously, epochs are the dominant driver of computational cost represented by the training time (Figure 7). Augmenting the training rounds from 5 epochs to 200 epochs, increases the training time by about ∼102 min. Moreover, augmenting the size of the input dataset (through the augmentation % variable) substantially increases runtime as well. A jump from the original dataset (0% augmentation) to 90% augmentation increases the training time by about ∼60 min. Finally, including CsI in the input dataset has negligible impact on the training time.
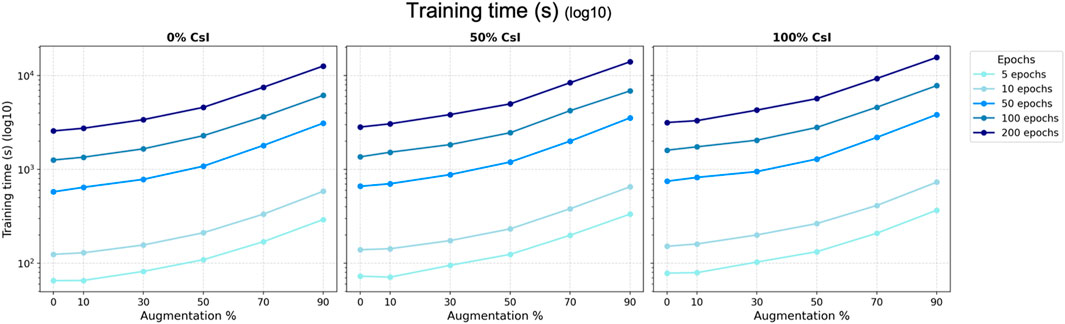
Figure 7. Comparison of the computational time for the different configurations (training time in seconds, represented on a log10 scale).
As augmentation increases both the NN performance and its training time (i.e., computational cost), we can optimize it for Pareto efficiency described in the following section.
4.3 Pareto frontier
The Pareto frontier (or Pareto front) is used in multi-objective optimization and aims at describing the set of solutions that are optimal and non-dominated, i.e., improving one objective results in a loss in another (Navon et al., 2021). In our case, the two objectives are to maximize the NN performance (i.e., highest macro recall, macro f1-score, weighted f1-score) while minimizing the computational cost (i.e., training time). As shown in Figure 8, some of our configurations achieve excellent performance, but require long training times. The Pareto front identifies the configurations that offer the best trade-offs between speed and performance. Not only are specific configurations more efficient in terms of performance vs. training time, but theyalso provide insight into the generalization and robustness of the trained NN. In ML problems, generalization is the ability of a model to maintain high performance on unseen data, and robustness is the ability to remain stable across different data distributions or noise conditions.
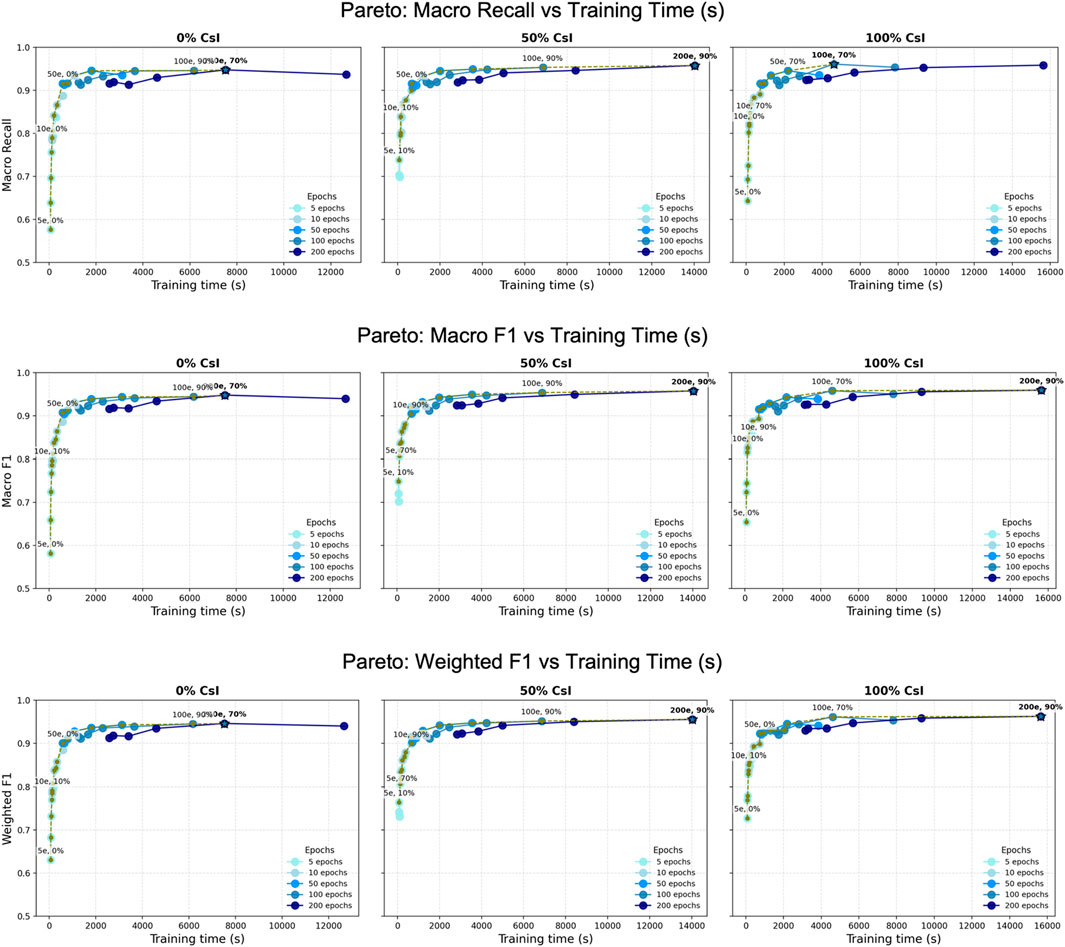
Figure 8. Pareto front analysis of three main metrics (macro recall, macro f1-score, weighted f1-score) versus training time (in seconds) for NN model trained with 0%, 50%, and 100% CsI. Each panel shows individual runs (dots) with different training epochs (5, 10, 50, 100, or 200) and various augmentation percentages, and the corresponding Pareto-optimal solutions (solid lines) for each epoch. The dashed olive line marks the optimal Pareto trade-offs between the epoch numbers and the amount of augmented data. The blue star with the bold label marks the top-performing configuration.
Figure 8 shows that runs with few epochs and no augmentation complete rapidly but reach lower performance. Interestingly, for the 0% CsI experiment, the model trained with 50 epochs and no augmentation (denoted as “50e, 0%” on Figure 8) lies on the Pareto front and achieves near-optimal performance across the three metrics. For the 50% and 100% CsI experiments, the optimal Pareto solutions are for models trained with moderate augmentation (50%–70%) and 50 to 100 epochs. This suggests that a combination of high-quality calibration and controlled augmentation yields to a more efficient model. Finally, more extreme configurations (e.g., 200 epochs with 90% augmentation) reach marginal performance gains while requiring a large computational cost (e.g., 3–5 h).
Table 2 summarizes all the effects from varying a single variable (augmentation % in input dataset, CsI %, or number of epochs), from the interactions between two of these three variables, and effects of changes with the three variables.
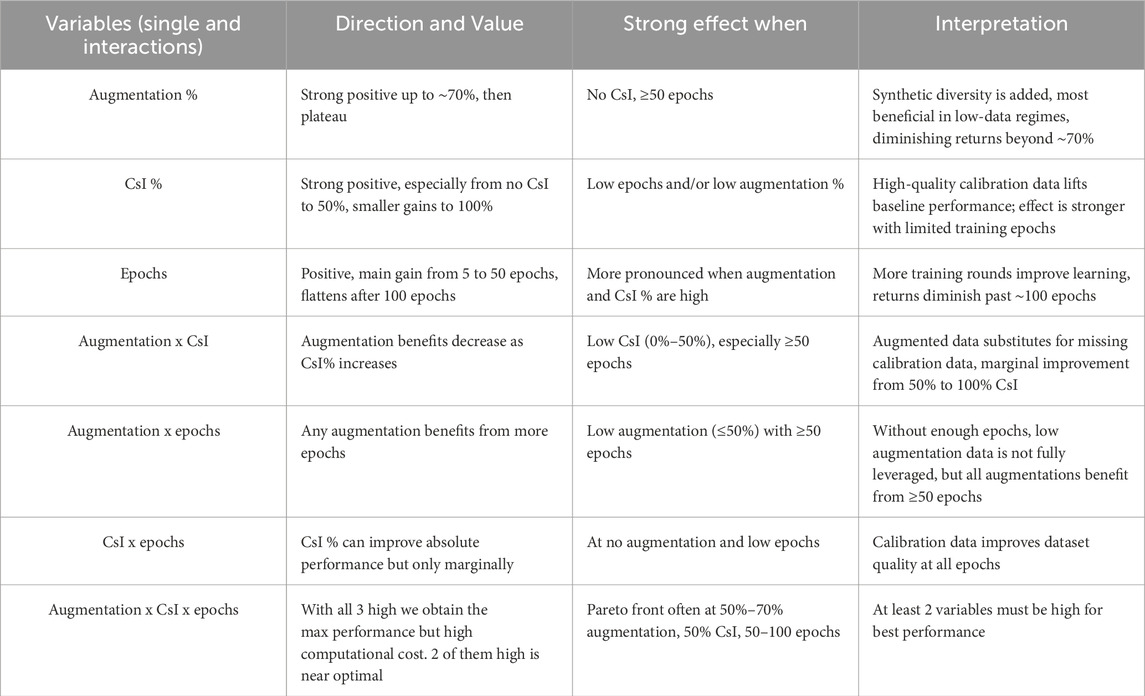
Table 2. Effects of main performance metrics from single variable change (variables: augmentation %, CsI %, epochs values), from interactions between 2 variables, and interactions with all 3 variables.
In our study, high augmentation improves the generalization by exposing the NN to a broader variety of training examples, reducing the risk of overfit to the original dataset. In contrast, high CsI percentage (high-quality calibration data) helps the model’s robustness without overwhelming the computational cost. More epochs allow the model to refine the decision boundaries for the feature–label relationships, but the model tends to overfit after ∼100 epochs.
The Pareto front highlights the trade-off between classification performance and computational cost. In our configurations, the Pareto frontier between performance and training cost tends to be for configurations with 50%–70% augmentation, 50–100 epochs, and ≥50% CsI.
5 Conclusion
5.1 Summary of findings
Our study aimed at investigating data augmentation techniques for MS data with the goal of preserving scientific interpretability to help in NN learning for planetary science applications. This work directly addresses one of the main barriers to enable ML-driven science autonomy–the scarcity of representative training data from flight-like instruments. We first investigated various ways to augment our original dataset, and we established their scientific validity through a verification process conducted in close collaboration with instrument domain experts. We then assessed how these augmented spectra, calibration data, and training duration affect NN performance for our specific MS classification task.
Across all metrics, the use of augmented data consistently improved generalization, but the magnitude of improvement depended on the training regime. The strongest gains happened for lower epochs where augmentation effectively compensates for the limited training time. For intermediate epochs values (50 epochs), the improvement was moderate, and performance gains plateaued at higher epochs (100 epochs and above). Augmentation most effectively boosts NN learning under specific conditions, namely, when computational resources and training time are limited.
Similarly, the amount of calibration data used in the training set also had a measurable effect on the NN performance: including some (50%) or all (100%) of the CsI generally improved all metrics, especially for higher augmentation levels. Finally, training for more epochs increased performance with the most noticeable improvements from 5 epochs to 50 epochs. Our Pareto front analysis shows that beyond ∼100 epochs, the training time increases while the performance returns are plateauing, especially for high augmentation and all CsI included. These findings demonstrate that scientifically consistent augmentation data can meaningfully boost the ML model learning and robustness for planetary science MS data, particularly in sparse-data regimes. By addressing the challenge of limited training data, this work lays a critical foundation for developing reliable ML models to support science autonomy development in future planetary missions.
5.2 Future work
Our main goal is to support the science team with their analysis and decision-making process using data science and ML tools during operations of the MOMA instrument on Mars. As such, our work was built on a solid collaboration to fully address the science team’s needs and develop the most suitable tools while respecting mission operations constraints. Our multidisciplinary team composed of MS experts (to guide the science evaluation of the analysis tools), data science and ML experts (to develop the tools using computer science techniques), and software engineers (to develop the user interface for the tools) closely worked together from the problem statement, through the data collection and processing, to the model evaluation and deployment.
A key focus of this research was the systematic investigation of data augmentation to improve model generalization and robustness. Our findings provide concrete, data-driven recommendations for configuring NN in planetary mission contexts with scientifically validated augmentation data. Building on this research, future work will expand toward NN-based data augmentation methods, such as Generative Adversarial Networks (GANs; Goodfellow et al., 2020) and Variational Autoencoders (VAEs) to produce high-fidelity and scientifically-reliable mass spectra. GANs, for instance, use two NNs – one generating synthetic but realistic data points and the other distinguishing real from synthetic data points–to create highly realistic data, while VAEs learn latent representations that can be sampled to generate plausible new spectra. Although these techniques are computationally intense and more complex to implement, they hold significant potential to enrich training datasets, particularly in scenarios where data are sparse. Rigorous validation by domain experts will remain essential to ensure that any synthetically generated spectra preserve the science integrity required for MS data in planetary science applications.
Our team is also investigating the deployment of these ML prediction algorithms on high performance space computing (HPSC) boards from Microchip to test whether the MOMA flight software and the NN models can operate in parallel. This will include assessing inference performance from the NN models on newly collected data, as well as evaluating execution time, memory capabilities, and power consumption under flight-relevant conditions.
Beyond immediate applications to the MOMA instrument onboard ExoMars, our work directly benefits future missions such as Dragonfly, targeting Titan in the 2030s which will be equipped with DraMS a mass spectrometer instrument based on MOMA heritage, as well as missions targeting the Ocean Worlds Europa and Enceladus. Moreover, our multidisciplinary team (MS experts, Mars and Titan science experts, and computer scientists) validates the importance of collaboration between missions’ science team and data scientists in order to develop the most efficient approach for the analysis of MS data for space missions. This collaborative approach can be leveraged for future applications to other planetary instruments by identifying common challenges (such as data processing, decision-making support, anomaly/outlier detection, data prioritization) and producing general algorithms applicable to new instrument types.
Data availability statement
The datasets presented in this article are not readily available because The ExoMars MOMA instrument is not launched yet, the data is still proprietary to the MOMA Science team. Requests to access the datasets should be directed to Victoria Da Poian, dmljdG9yaWEuZGFwb2lhbkBuYXNhLmdvdg==; Eric Lyness, ZXJpYy5pLmx5bmVzc0BuYXNhLmdvdg==; Xiang Li, eGlhbmcubGlAbmFzYS5nb3Y=.
Author contributions
VD: Conceptualization, Data curation, Formal Analysis, Funding acquisition, Investigation, Methodology, Project administration, Resources, Software, Supervision, Validation, Visualization, Writing – original draft, Writing – review and editing. SH: Conceptualization, Resources, Supervision, Writing – review and editing. EL: Conceptualization, Funding acquisition, Investigation, Methodology, Resources, Supervision, Validation, Writing – review and editing. XL: Conceptualization, Data curation, Formal Analysis, Funding acquisition, Investigation, Methodology, Resources, Supervision, Validation, Writing – review and editing. RD: Formal Analysis, Investigation, Methodology, Validation, Writing – review and editing. WB: Funding acquisition, Resources, Supervision, Validation, Writing – review and editing. BT: Conceptualization, Data curation, Formal Analysis, Funding acquisition, Investigation, Methodology, Project administration, Resources, Supervision, Visualization, Writing – review and editing.
Funding
The authors declare that financial support was received for the research and/or publication of this article. This research was funded through a NASA Goddard Space Flight Center Internal Research and Development (IRAD) proposal.
Acknowledgements
The authors thank the reviewers and the editors for providing thoughtful feedback, which greatly improved the clarity and quality of this manuscript. We are grateful to the NASA Planetary Environment Lab (PEL) science team members, particularly Luoth Chou and David Burtt, for their guidance, support, and valuable discussions on scientific consistency throughout this investigation. We also acknowledge the contributions of the software development team—Joe Avolio, Nick Dobson, and Brad Tse—whose expertise was essential to this project. The authors further thank colleagues from the Horst’s research group at Johns Hopkins University for their stimulating discussions and continuous support. Finally, this project used the high-performance computing resources provided by the NASA Center for Climate Simulation (NCCS) at NASA Goddard Space Flight Center.
Conflict of interest
Authors VD and EL were employed by Tyto Athene LLC.
Author RD was employed by Danell Consulting Inc.
The remaining authors declare that the research was conducted in the absence of any commercial or financial relationships that could be construed as a potential conflict of interest.
Generative AI statement
The authors declare that Generative AI was used in the creation of this manuscript. to brainstorm ideas to generate figures (especially Figures 2, 4, 8)
Any alternative text (alt text) provided alongside figures in this article has been generated by Frontiers with the support of artificial intelligence and reasonable efforts have been made to ensure accuracy, including review by the authors wherever possible. If you identify any issues, please contact us.
Publisher’s note
All claims expressed in this article are solely those of the authors and do not necessarily represent those of their affiliated organizations, or those of the publisher, the editors and the reviewers. Any product that may be evaluated in this article, or claim that may be made by its manufacturer, is not guaranteed or endorsed by the publisher.
References
Arevalo, R., Ni, Z., and Danell, R. M. (2019). Mass spectrometry and planetary exploration: a brief review and future projection. J. Mass Spectrom. 55 (e4454), e4454. doi:10.1002/jms.4454
Ayodele, T. O. (2010). Machine learning overview. New Adv. Mach. Learn. 2 (9–18), 16. doi:10.5772/9374
Azari, A. R., Biersteker, J. B., Dewey, R. M., Doran, G., Forsberg, E. J., Harris, C. D. K., et al. (2021). Integrating machine learning for planetary science: perspectives for the next decade. 53. doi:10.3847/25c2cfeb.aa328727
Barnes, J. W., Turtle, E. P., Trainer, M. G., Lorenz, R. D., MacKenzie, S. M., Brinckerhoff, W. B., et al. (2021). Science goals and objectives for the Dragonfly Titan rotorcraft relocatable lander. The Planetary Science Journal 2 (4), 130. doi:10.3847/PSJ/abfdcf
Bjerrum, E. J., Glahder, M., and Skov, T. (2017). Data augmentation of spectral data for convolutional neural network (CNN) based deep chemometrics. Available online at: https://arxiv.org/abs/1710.01927.
Brinckerhoff, W. B., Pinnick, V. T., van Amerom, F. H. W., Danell, R. M., Arevalo, R., and Atanassova, M. S. (2013). “Mars organic molecule Analyzer (MOMA) mass spectrometer for ExoMars 2018 and beyond,” in Proceedings of the IEEE aerospace conference (IEEE), 1–8. doi:10.1109/AERO.2013.6496942
Cao, L. (2017). Data science: a comprehensive overview. ACM Comput. Surv. 50 (3), 1–42. doi:10.1145/3076253
Carbonell, J. G., Michalski, R. S., and Mitchell, T. M. (1983). “An overview of machine learning,” in Machine learning. Editors R. S. Michalski, J. G. Carbonell, and T. M. Mitchell (Los Altos, CA: Morgan Kaufmann), 3–23. doi:10.1016/B978-0-08-051054-5.50005-4
Chien, S., and Morris, R. (2014). Space applications of artificial intelligence. AI Mag. 35 (4), 3–6. doi:10.1609/aimag.v35i4.2551
Chien, S. A., Doubleday, J., Thompson, D. R., Wagstaff, K. L., Bellardo, J., Francis, C., et al. (2017). Onboard autonomy on the intelligent payload experiment CubeSat mission. J. Aerosp. Inf. Syst. 14 (6), 307–315. doi:10.2514/1.I010386
Chou, L., Mahaffy, P., Trainer, M., Eigenbrode, J., Arevalo, R., Brinckerhoff, W., et al. (2021). Planetary mass spectrometry for agnostic life detection in the solar system. Front. Astronomy Space Sci. 8, 755100. doi:10.3389/fspas.2021.755100
Da Poian, V., Lyness, E., Brinckerhoff, W., Danell, R., Li, X., and Trainer, M. (2021). Science autonomy and the ExoMars mission: machine learning to help find life on Mars. Computer 54 (10), 69–77. doi:10.1109/MC.2021.3070101
Da Poian, V., Lyness, E., Danell, R., Theiling, B., and Brinckerhoff, W. (2022a). Application to the ExoMars mission [abstract]. In Lunar and Planetary Science Conference. Houston, TX: Lunar and Planetary Institute, 53. Available online at: https://www.hou.usra.edu/meetings/lpsc2022/pdf/1952.pdf
Da Poian, V., Lyness, E., Danell, R. M., Li, X., Theiling, B., Trainer, M., et al. (2022b). Science autonomy and space science: application to the ExoMars mission. Front. Astronomy Space Sci. 9, 848669. doi:10.3389/fspas.2022.848669
Do, S., Da Poian, V., Lyness, E., Danell, R., Li, X., and Brinckerhoff, W. (2024). “Machine learning on Mars mass spectrometry data: unlocking insights for autonomous planetary exploration poster no. 1097,” in 55th Lunar and Planetary Science Conference. Houston, TX: Lunar and Planetary Institute. Available online at: https://www.hou.usra.edu/meetings/lpsc2024/pdf/1097.pdf.
Goesmann, F., Brinckerhoff, W. B., Raulin, F., Goetz, W., Danell, R. M., Getty, S. A., et al. (2017). The mars organic molecule analyzer (MOMA) instrument: characterization of organic material in Martian sediments. Astrobiology 17 (6–7), 655–685. doi:10.1089/ast.2016.1551
González, R., Apostolopoulos, D., and Iagnemma, K. (2020). Slippage and immobilization detection for planetary exploration rovers via machine learning and proprioceptive sensing. Journal of Field Robotics. doi:10.1002/rob.21736
Goodfellow, I., Pouget-Abadie, J., Mirza, M., Xu, B., Warde-Farley, D., Ozair, S., et al. (2020). Generative adversarial networks. Commun. ACM 63 (11), 139–144. doi:10.1145/3422622
Hundman, K., Constantinou, V., Laporte, C., Colwell, I., and Soderstrom, T. (2018). “Detecting spacecraft anomalies using LSTMs and nonparametric dynamic thresholding,” in Proceedings of the 24th ACM SIGKDD international conference on knowledge discovery and data mining (KDD ’18) (New York, NY: Association for Computing Machinery), 387–395. doi:10.1145/3219819.3219845
Li, X., Danell, R. M., Pinnick, V. T., Grubisic, A., van Amerom, F., Arevalo, R. D., Jr., et al. (2017). Mars organic molecule analyzer (MOMA) laser desorption/ionization source design and performance characterization. Int. J. Mass Spectrom. 422, 177–187. doi:10.1016/j.ijms.2017.03.010
MacKenzie, S. M., Neveu, M., Davila, A. F., Lunine, J. I., Craft, K. L., Cable, M., et al. (2021). The enceladus orbilander mission concept: balancing return and resources in the search for life. The Planetary Science Journal 2 (2), 77. doi:10.3847/PSJ/abe4da
Malik, A., Moster, B. P., and Obermeier, C. (2022). Exoplanet detection using machine learning. Mon. Notices R. Astronomical Soc. 513 (4), stab3692–stab5516. doi:10.1093/mnras/stab3692
National Academies of Sciences, Engineering, and Medicine (2022). Origins, worlds, and life: a decadal strategy for planetary science and astrobiology 2023–2032. Washington, DC: The National Academies Press. doi:10.17226/26522
National Aeronautics and Space Administration (2022). NASA 2022 strategic plan. Washington, DC: NASA.
Navon, A., Shamsian, A., Fetaya, E., and Chechik, G. (2021). “Learning the pareto front with hypernetworks,” in 9th International Conference on Learning Representations (ICLR 2021) (Virtual). OpenReview / International Conference on Learning Representations (ICLR), Online/Virtual Conference. Available online at: https://arxiv.org/abs/2010.04104.
Phillips, C. B., and Pappalardo, R. T. (2014). Europa clipper mission concept: exploring Jupiter’s ocean moon. EGU General Assem. 95, 165–167. doi:10.1002/2014eo200002
Ràfols, P., Vilalta, D., Brezmes, J., Cañellas, N., del Castillo, E., Yanes, O., et al. (2018). Signal preprocessing, multivariate analysis and software tools for MA(LDI)-TOF mass spectrometry imaging for biological applications. Mass Spectrom. Rev. 37 (3), 281–306. doi:10.1002/mas.21527
Rothrock, B., Kennedy, R., Cunningham, C., Papon, J., Heverly, M., and Ono, M. (2016). “SPOC: Deep learning-based Terrain classification for Mars Rover Missions (AIAA SPACE 2016 Conference Paper No. 2016-5539),” in Proceedings of the American Institute of Aeronautics and Astronautics. doi:10.2514/6.2016-5539
Shorten, C., and Khoshgoftaar, T. M. (2019). A survey on image data augmentation for deep learning. J. Big Data 6, 60. doi:10.1186/s40537-019-0197-0
Thompson, D. R., Altinok, A., Bornstein, B., Chien, S. A., Doubleday, J., Bellardo, J., et al. (2015). Onboard machine learning classification of images by a cubesat in Earth orbit. AI Matters 1 (4), 38–40. doi:10.1145/2757001.2757010
Turtle, E. P., Trainer, M. G., Barnes, J. W., Lorenz, R. D., Hibbard, K. E., Adams, D. S., et al. (2009). “Dragonfly: in situ exploration of Titan’s organic chemistry and habitability,” in 51st Lunar and Planetary Science Conference. (United States: The Woodlands), 184–213. Available online at: https://insu.hal.science/insu-04459771/document.
Vago, J. L., Westall, F., Coates, A. J., Jaumann, R., Korablev, O., Ciarletti, V., et al. (2017). Habitability on early Mars and the search for biosignatures with the ExoMars rover. Astrobiology 17 (6-7), 471–510. doi:10.1089/ast.2016.1533
Wagstaff, K. L., Doran, G., Davies, A., Anwar, S., Chakraborty, S., Cameron, M., et al. (2019). “Enabling onboard detection of events of scientific interest for the europa clipper spacecraft,” in Proceedings of the 25th ACM SIGKDD international conference on knowledge discovery and data mining (KDD ’19) (New York, NY: Association for Computing Machinery), 2191–2201. doi:10.1145/3292500.3330656
Wang, J., and Perez, L. (2017). The effectiveness of data augmentation in image classification using deep learning. Convolutional Neural Netw. Vis. Recognit. 11 (2017), 1–8. doi:10.48550/arXiv.1712.04621
Wang, D., Russino, J. A., Basich, C., and Chien, S. (2022). “Analyzing the efficacy of flexible execution, replanning, and plan optimization for a planetary lander,” in Proceedings of the 32nd international conference on automated planning and scheduling (ICAPS 2022) (Palo Alto, CA: Association for the Advancement of Artificial Intelligence (AAAI Press)). doi:10.1609/icaps.v32i1.19838
Wang, G., Ruser, H., Schade, J., Passig, J., Zimmermann, R., Dollinger, G., et al. (2024). “Rapid classification of aerosol particle mass spectra using data augmentation and deep learning,” in Proceedings of the 2024 IEEE Conference on Artificial Intelligence (CAI), Piscataway, NJ: IEEE 1167–1172. doi:10.1109/CAI59869.2024.00208
Keywords: machine learning, planetary science, data augmentation, mass spectrometry, ExoMars, sparse dataset, data science, spaceflight instrumentation
Citation: Da Poian V, Hörst SM, Lyness EI, Li X, Danell RM, Brinckerhoff WB and Theiling BP (2025) Augmenting sparse spaceflight mass spectra datasets for machine learning applications. Front. Astron. Space Sci. 12:1706125. doi: 10.3389/fspas.2025.1706125
Received: 15 September 2025; Accepted: 31 October 2025;
Published: 18 December 2025.
Edited by:
Stavro Ivanovski, National Institute of Astrophysics (INAF), ItalyReviewed by:
Jan Lisec, Federal Institute for Materials Research and Testing (BAM), GermanyJames Marshall, Mars Petcare, United Kingdom
Copyright © 2025 Da Poian, Hörst, Lyness, Li, Danell, Brinckerhoff and Theiling. This is an open-access article distributed under the terms of the Creative Commons Attribution License (CC BY). The use, distribution or reproduction in other forums is permitted, provided the original author(s) and the copyright owner(s) are credited and that the original publication in this journal is cited, in accordance with accepted academic practice. No use, distribution or reproduction is permitted which does not comply with these terms.
*Correspondence: Victoria Da Poian, dmljdG9yaWEuZGFwb2lhbkBuYXNhLmdvdg==