Abstract
Background and Objectives:
Arterial stiffness is a recognized marker of vascular ageing and is associated with adverse cardiovascular outcomes. However, routine assessment of pulse wave velocity (PWV) remains limited in many clinical and home settings. This study investigated the feasibility of extracting arterial stiffness-related information from Korotkoff sounds recorded during cuff-based blood pressure measurement using feature analysis and machine learning.
Materials and methods:
Korotkoff sounds were collected from 123 young (25.9 ± 2.2 years) participants and 112 older (67.5 ± 6.7 years) participants using a custom-developed device as a proof-of-concept for age-related vascular differences. In addition, 81 hospital participants with measured brachial-ankle PWV (baPWV) were enrolled and grouped according to baPWV to further evaluate clinical feasibility. Time- and frequency-domain features were extracted, and both traditional feature-based models and deep learning approaches were applied for classification.
Results:
Extracted features including center of mass, skewness, and peak frequency showed significant differences between the age-stratified groups. Two deep learning models achieved classification accuracies of 89.3% and 93.7%, respectively, outperforming traditional feature-based analysis. In the baPWV-defined classification task, model performance was moderate (accuracy 87.5% and 81.3%). In the baPWV-measured cohort, Korotkoff sound-derived features showed a statistically significant but modest association with measured baPWV.
Conclusion:
Korotkoff sounds contain measurable information related to vascular ageing and arterial stiffness, and machine learning can leverage these signals for group discrimination. Given that the primary comparison used age as a surrogate label and clinical outcomes were not assessed, the present data do not establish incremental value for cardiovascular risk stratification beyond age and blood pressure. Larger studies with standardized PWV measurements, ideally carotid-femoral PWV (cfPWV), and prospective validation are required before prognostic or risk-stratification claims can be made.
Introduction
As the ageing population increases globally, the prevention of cardiovascular disease (CVD) faces more severe challenges (1). By 2030, about 20% of the population will be aged 65 years or older, and in this age group, CVD will be the leading cause of death, accounting for 40% of deaths (2). Arterial stiffening is a key manifestation of vascular ageing and is associated with higher cardiovascular morbidity and mortality (3–9). Accordingly, assessment of arterial stiffness has attracted growing interest as a means to characterize vascular health and potentially refine prevention strategies (10–12).
Pulse wave velocity (PWV) is widely used for non-invasive assessment of arterial stiffness (13–16). Importantly, carotid-femoral PWV (cfPWV), which reflects aortic (large elastic artery) stiffness, is regarded as the reference-standard measure for arterial stiffness assessment in clinical practice and research, and standardization of its measurement has been emphasized in expert consensus documents (17). However, cfPWV measurement often requires dedicated equipment and trained operators, which limits access in routine primary care and home settings. Recent hypertension guidelines underscore the need for pragmatic approaches that can be implemented broadly across care settings (18).
In contrast to dedicated PWV devices, Korotkoff sounds are already routinely generated during cuff-based blood pressure measurement. Although their precise genesis remains debated, both arterial wall mechanics (compliance-related vibration) (19, 20) and hemodynamic factors (flow patterns) (21–23) are believed to contribute, suggesting that Korotkoff sounds may contain information related to vascular properties. Evidence in recent years (24–26) has increasingly supported the concept that Korotkoff sounds encode physiologically meaningful signatures beyond systolic/diastolic pressure, motivating efforts to extract vascular information from these signals.
Korotkoff sounds are complex, non-stationary biosignals, posing analytical challenges similar to heart sounds and other physiological waveforms. Conventional approaches typically rely on engineered time- and frequency-domain features, whereas deep learning can learn high-dimensional representations directly from time–frequency maps. Transfer learning with convolutional neural networks (CNNs) has proven effective in biosignal classification when domain-specific labeled datasets are limited (27–30).
In this study, we investigated whether machine-learning analysis of Korotkoff sounds can capture stiffness-related information. We performed (i) a proof-of-concept analysis comparing young and older adults (age-defined groups expected to differ in vascular ageing), and (ii) an additional clinical feasibility analysis in a separate cohort with measured PWV, to examine whether Korotkoff sound–derived features and models relate to PWV. Because age itself (and estimated PWV derived from age and blood pressure) can be used for risk estimation, the present work focuses on feasibility rather than establishing incremental prognostic value beyond conventional variables (31).
Methods
The overall methodology of this study is outlined in Figure 1. In brief, Korotkoff sound signals were acquired from participants using a self-developed device. Participants were categorized for two complementary analyses: (i) an age-stratified proof-of-concept comparison between an older group and a young group (age used as a surrogate of vascular ageing rather than a direct stiffness diagnosis), and (ii) in a separate clinical feasibility cohort with measured brachial-ankle pulse wave velocity (baPWV), a comparison between high-baPWV and low-baPWV groups based on measured baPWV values. Furthermore, the correlation between baPWV and the acoustic features was investigated to explore clinical relevance of the proposed method.
Figure 1
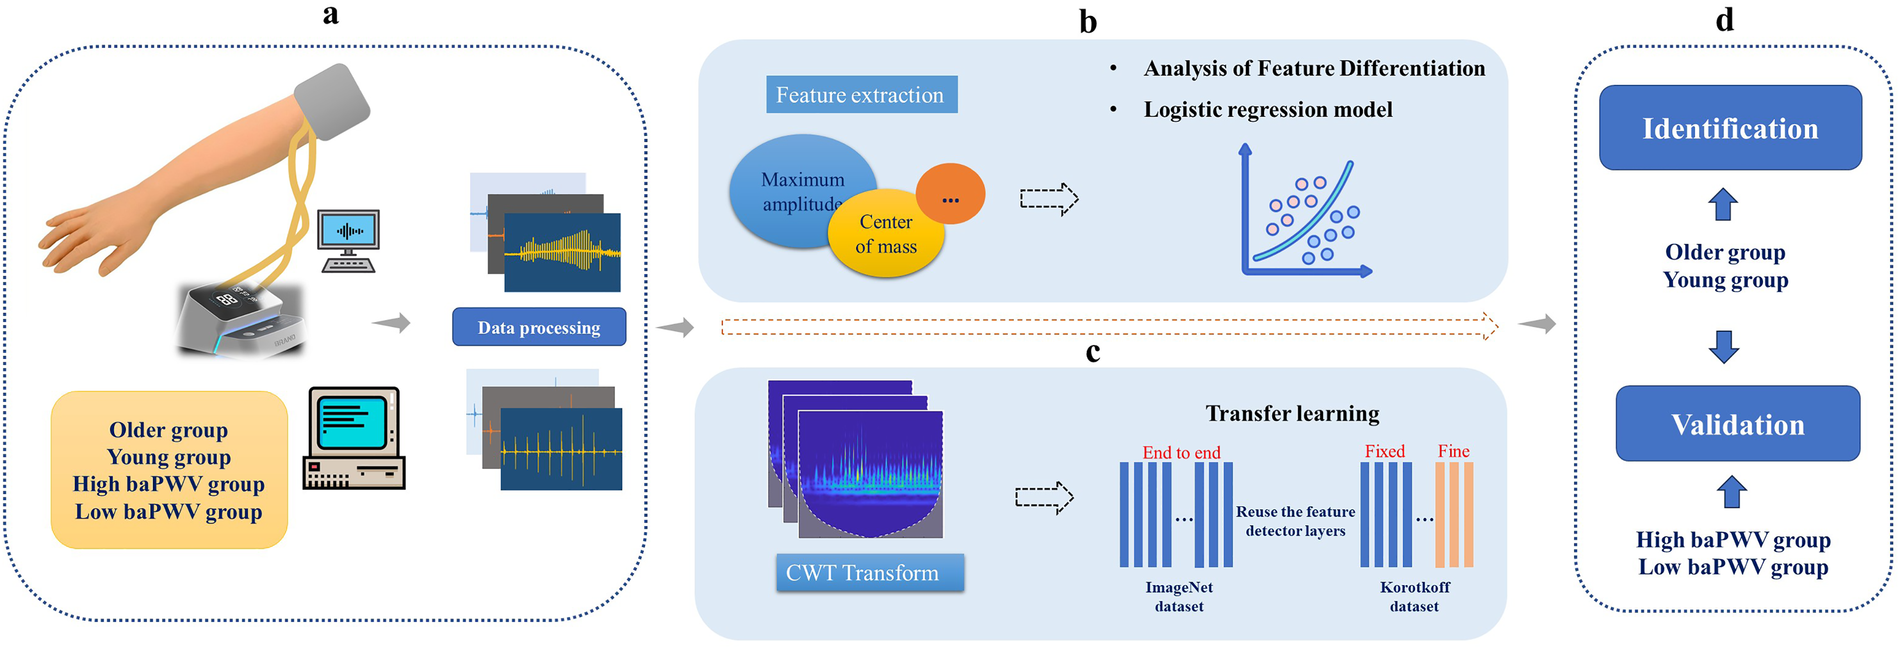
Schematic diagram of the study methodology. baPWV, brachial-ankle pulse wave velocity. CWT, continuous wavelet transforms. (a) Data Acquisition and Preprocessing: Korotkoff sound signals were collected and preprocessed. Participants were stratified into older group vs. young group (age-stratified), and into high-baPWV group vs. low-baPWV group. (b) Traditional Feature Analysis: Time- and frequency-domain features were extracted from the signals and compared between the older group and young group to identify significant differences. A logistic regression model was subsequently developed for classification. (c) Deep Learning-Based Classification: Time-frequency images were generated via CWT, and convolutional neural networks were trained using a transfer learning approach. (d) Clinical Feasibility: The Korotkoff sound–based approach was further evaluated against measured baPWV data.
Hardware device
Signal acquisition was performed using a custom-developed Korotkoff sound acquisition device (Figure 2A), which comprised three primary components: a hardware unit, an inflatable cuff, and a sensor integrated into the cuff for Korotkoff sound detection. The hardware unit contained a pump for cuff inflation and deflation, an STM32H750 microprocessor with 24-bit AD sampling for data acquisition and system control, and a Bluetooth module for communication with a computer. To balance performance and cost, a CM-01B sensor was utilized for collecting Korotkoff sound signals (32), while an MPS20N0040D-S sensor was employed to acquire the cuff pressure signal. All Korotkoff sound signals were sampled at a frequency of 1,000 Hz.
Figure 2
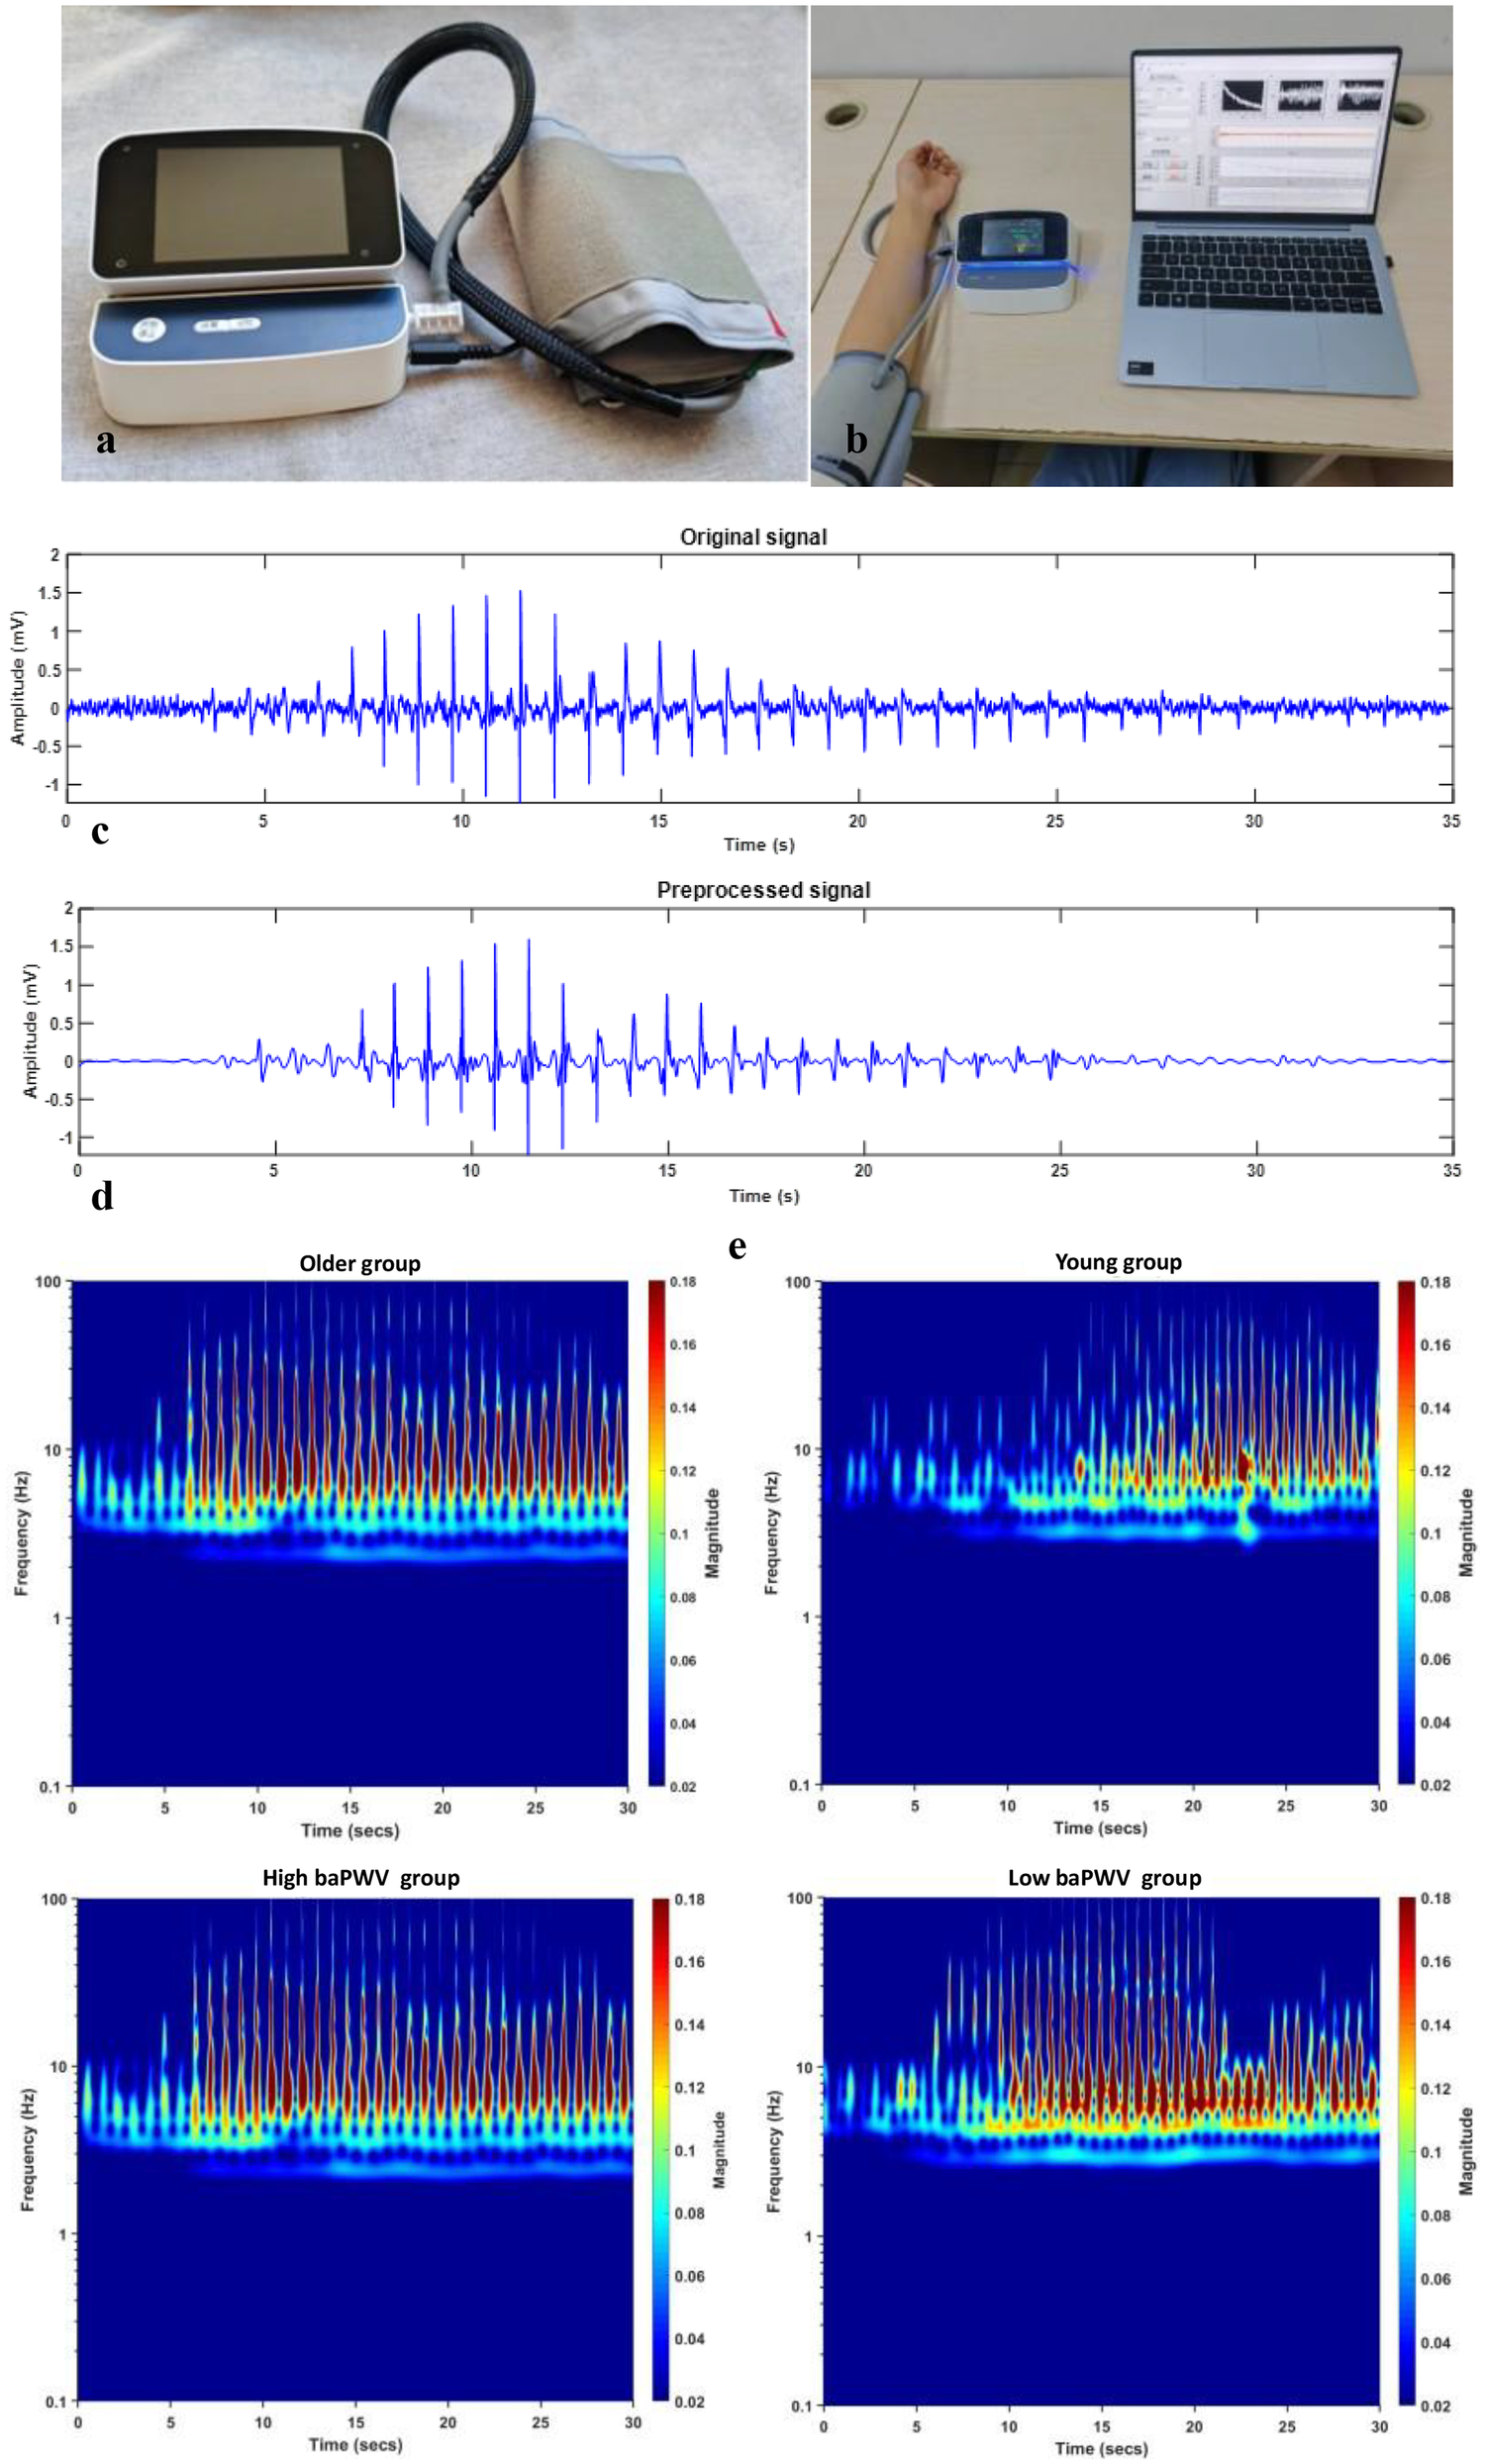
baPWV, brachial-ankle pulse wave velocity. (a) The self-developed Korotkoff sound signal acquisition device. (b) The process of collecting signals. (c) The original Korotkoff sound signal. (d) The preprocessed Korotkoff sound signal. (e) The time-frequency RGB images after continuous wavelet transform (older group vs. young group, high-baPWV group vs. low-baPWV group).
In the clinical feasibility cohort, baPWV was measured as the comparator PWV index using an automatic waveform analyzer (BP-203 RPE III, Omron Health Medical, Dalian, China). baPWV was used as the comparator PWV measure because it is widely implemented in clinical workflows and population studies and can be obtained with high operational efficiency (33–36).
Data acquisition
Arterial structure and function change with age, resulting in progressive arterial stiffness (13). This well-established relationship, demonstrated by Gomez-Sanchez et al. in a Spanish adult cohort without overt CVD (10), provided the rationale for using age as a primary grouping variable in the proof-of-concept analysis. An a priori power analysis was conducted to ensure sufficient statistical power, defined as an 80% probability of detecting a true effect at a significance level (α) of 0.05. Based on a reference effect size from a similar study (26), the total required sample size was estimated to be 200. Therefore, we collected Korotkoff sound signals from 112 older adults (67.5 ± 6.7 years) and 123 young adults (25.9 ± 2.2 years), as the older and young groups, respectively. To evaluate clinical feasibility using a measured arterial stiffness index, Korotkoff sound and concurrent baPWV data were additionally collected from 81 hospital participants. Based on the median baPWV value of this cohort, participants were stratified into two groups (high baPWV vs. low baPWV) for PWV-defined classification and association analyses.
Participants for the primary comparison (older vs. young groups) were recruited from the community. Korotkoff sound recordings were obtained with the participant seated and the test arm supported such that the cuff on the mid-upper arm was positioned at heart level. The cuff was applied directly on the bare upper arm (participants removed thick clothing from the measurement arm) to minimize signal attenuation and artifacts. The sensor was positioned over the brachial artery pulse point. Following cuff inflation to achieve complete arterial occlusion, signals were acquired during a controlled deflation period. All participants provided written informed consent and completed a questionnaire covering demographics (age, sex, height, weight), medication use, medical history, and smoking status. Blood pressure and heart rate were obtained during the study visit using standardized measurements performed by trained staff and were recorded alongside the Korotkoff sound acquisition. The inclusion criteria for the young and older groups were: age 20–30 or 60–79 years, respectively; a body mass index (BMI) of 20–25 kg/m²; good general health without a history of major diseases; non-smoking status; and normal blood pressure and heart rate. Representative Korotkoff sound recordings from older and young subjects are provided in the Supplementary Material Audio.
The data for the high-baPWV and low-baPWV groups were collected at a hospital. All the participants provided informed consent and completed a detailed questionnaire (as described above). Subjects aged 20–79 years with no serious diseases (including cardiovascular diseases, malignant tumors, severe primary liver or kidney diseases, or chronic lung diseases) were included. Participant characteristics are summarized in Table 1 (age-stratified cohort) and Table 2 (baPWV-measured hospital cohort).
Table 1
| Variables | Older (n = 112) | Young (n = 123) | P |
|---|---|---|---|
| Age in years, M (SD) | 67.5 (6.7) | 25.9 (2.2) | <0.001 |
| Gender, n (%) | 0.112 | ||
| Male | 44 (39.4) | 57 (46.3) | |
| Female | 68 (60.7) | 66 (53.7) | |
| BMI, M(SD) | 23.4 (1.5) | 22.8 (1.1) | 0.115 |
| Blood pressure, M(SD) | |||
| SBP | 120 (11) | 118 (6) | 0.083 |
| DBP | 79 (6) | 77 (5) | 0.091 |
| Heart rate, M (SD) | 78.2 (11.4) | 76.0 (9.2) | 0.129 |
Statistical information for older and young study participants.
BMI, body mass index; SBP, systolic blood pressure; DBP, diastolic blood pressure; M, mean; SD, standard deviation. Participants were categorized into the older group and young group based on age as a well-established surrogate for arterial stiffness. Data are presented as mean (SD) for continuous variables and number (percentage) for categorical variables. Group differences were assessed using independent samples t-tests for continuous variables and chi-square tests for categorical variables. A p-value < 0.05 was considered statistically significant. All participants in the age-stratified community cohort were non-smokers and reported no major medical history per inclusion criteria.
Table 2
| Variables | High baPWV (n = 45) | Low baPWV (n = 36) |
|---|---|---|
| Age in years, M (SD) | 51.8 (14.2) | 36.7 (9.7) |
| Gender, n (%) | ||
| Male | 25 (55.6) | 11 (30.6) |
| Female | 20 (44.4) | 25 (69.4) |
| BMI, M(SD) | 26.0 (4.1) | 23.0 (3.4) |
| Blood pressure, M(SD) | ||
| SBP | 136 (13) | 118 (12) |
| DBP | 81 (9) | 69 (11) |
| Heart rate, M (SD) | 74.2 (10.6) | 72.0 (11.5) |
| Diabetes, n (%) | 8 (17.8) | 7 (19.4) |
| Smoking, n (%) | 8 (17.8) | 3 (8.3) |
| Past medical history, n (%) | 27 (60.0) | 7 (19.4) |
Statistical information for study participants with brachial-ankle pulse wave velocity data included.
baPWV, brachial-ankle pulse wave velocity; BMI, body mass index; SBP, systolic blood pressure; DBP, diastolic blood pressure; M, mean; SD, standard deviation. Participants were stratified into high-baPWV and low-baPWV groups. Data are presented as mean (SD) for continuous variables and number (percentage) for categorical variables. Past medical history” refers to non-severe chronic conditions (e.g., hypertension, dyslipidemia) and does not include the excluded serious diseases.
Signal processing and feature extraction
All data processing was performed using MATLAB (version 2019a). The acquired Korotkoff sound signals were first processed to eliminate baseline drift using filtering techniques. Subsequently, high-frequency noise was attenuated employing wavelet transform, which offers superior time-frequency localization for non-stationary signals. Figures 2c,d display representative original and preprocessed Korotkoff sound signals, respectively.
For the preprocessed signals, we introduced the concept of “center of mass” to integrate amplitude and temporal location information. A set of six time-domain features was extracted, including maximum amplitude, kurtosis, skewness, peak factor, pulse factor, and form factor. Additionally, three frequency-domain features were obtained: peak frequency, center of gravity frequency, and mean square frequency. Detailed mathematical descriptions of the preprocessing steps and feature extraction formulas are provided in the Supplementary Material.
Statistical analysis
All statistical analyses were performed using SPSS (version 27, IBM Corp.). Normality of continuous variables was assessed using the Kolmogorov–Smirnov test. For comparisons of acoustic features between groups, independent-samples t-tests were used to compare mean values. Homogeneity of variance was evaluated using Levene's test; when variances were unequal, Welch's t-test was applied. To account for multiple comparisons across the ten extracted features, statistical significance for the univariate feature comparisons was set at p < 0.005 (Bonferroni correction).
To address potential confounding factors in the correlation analyses between Korotkoff sound features and arterial stiffness (as measured by baPWV), multivariable linear regression analyses were conducted. Candidate covariates for adjustment were pre-specified based on prior literature and clinical plausibility, and their distributions and intercorrelations were also examined in the current dataset. Age, diabetes, obesity (BMI) and systolic blood pressure (SBP) were included as established determinants of baPWV (37–40). Separate regression models were built for each Korotkoff sound feature that demonstrated a significant univariate association with baPWV. In each model, baPWV served as the dependent variable, while the Korotkoff sound feature and covariates (age, diabetes, BMI, SBP) were entered as independent variables. Variance inflation factors (VIFs) were examined to assess multicollinearity (all VIF < 5).
Machine learning methods
Time-frequency images were obtained using a continuous wavelet transform (CWT). These representations were utilized as input for two CNN models, GoogLeNet and SqueezeNet, which were trained following a transfer learning paradigm to obtain stiffness-related information. A comprehensive description of the machine learning hyperparameters is available in the Supplementary Material.
Results
Participant characteristics
Time- and frequency-domain features
The statistical results for the ten extracted features are summarized in Table 3. No significant difference was observed in the maximum amplitude value between the older and young groups. This lack of difference may be attributed to the sensitivity of the maximum amplitude to factors such as sensor placement, variations in tissue layer thickness and density, and individual differences in blood flow. Although the sensor is aligned with the relative position of the brachial artery during signal acquisition, it is inevitably influenced by the properties of the lateral tissue of the brachial artery and differences in blood flow through the brachial artery. In contrast, the proposed center of mass feature demonstrated a statistically significant difference between the two groups. This finding suggests that while individual anatomical and physiological factors may influence absolute amplitude values, they exert a comparatively minor effect on the temporal location of the maximum amplitude, supporting the robustness of this feature.
Table 3
| Indicates | Young | Older | P | T | Cohen's d |
|---|---|---|---|---|---|
| Maximum amplitude | 1.095 (0.446) | 1.059 (0.555) | 0.679 | 0.414 | 0.072 |
| Kurtosis | 14.199 (5.364) | 17.094 (4.202) | 0.070 | −1.828 | −0.316 |
| Skewness | 0.231 (0.689) | −0.802 (1.371) | <0.001 | 5.632 | 0.973 |
| Peak factor | 6.941 (1.504) | 6.526 (2.421) | 0.228 | 1.211 | 0.209 |
| Pulse factor | 12.860 (3.511) | 12.978 (6.127) | 0.298 | 1.045 | 0.181 |
| Form factor | 1.726 (0.238) | 1.777 (0.305) | 0.279 | −1.087 | −0.188 |
| Center of mass | 0.971 (1.605) | −0.643 (1.574) | <0.001 | 5.785 | 0.999 |
| Peak frequency | 3.707 (1.478) | 2.653 (0.441) | <0.001 | 5.411 | 0.935 |
| Center of gravity frequency | 28.330 (5.798) | 32.417 (13.206) | 0.018 | −2.388 | −0.412 |
| Mean square frequency | 7.771 (1.596) | 9.514 (5.595) | 0.017 | −2.427 | −0.419 |
Statistical results of older and young groups.
Values are presented as mean (SD). Group differences were assessed using independent-samples t-tests (Welch's correction applied when variances were unequal). Cohen's d is provided as a standardized effect size. To account for multiple comparisons across 10 features, statistical significance was set at p < 0.005 (Bonferroni correction).
In addition, skewness differed significantly between groups (Table 3), suggesting group-level differences in the Korotkoff sound envelope: the envelope distribution was left-skewed in older adults and right-skewed in young adults. Peak-frequency–related results suggested that spectral energy was concentrated at different frequency ranges between groups, with peak frequency showing a significant shift (Table 3). Center of gravity frequency and mean-square frequency showed nominal between-group differences (p < 0.05) but did not remain significant after Bonferroni correction.
All the features were entered into an exploratory logistic regression model. The model demonstrated a good fit per the Hosmer-Lemeshow test (p > 0.05) and achieved a classification accuracy of 83.7%. The specific information is shown in Table 4.
Table 4
| Features | Coef. | SE | Wald χ2 | P | OR | 95% CI |
|---|---|---|---|---|---|---|
| Maximum amplitude | 1.399 | 0.648 | 4.663 | 0.031 | 4.050 | [1.138,14.412] |
| Kurtosis | 0.050 | 0.097 | 0.264 | 0.608 | 1.051 | [0.869,1.272] |
| Skewness | −1.543 | 0.521 | 8.768 | 0.003 | 0.214 | [0.077,0.594] |
| Peak factor | 1.051 | 0.632 | 2.768 | 0.096 | 2.861 | [0.829,9.873] |
| Pulse factor | −0.528 | 0.294 | 3.212 | 0.073 | 0.590 | [0.331,1.051] |
| Form factor | 0.333 | 1.578 | 0.044 | 0.833 | 1.395 | [0.063,30.735] |
| Center of mass | −0.879 | 0.237 | 13.768 | <0.001 | 0.415 | [0.261,0.660] |
| Peak frequency | −1.516 | 0.495 | 9.372 | 0.002 | 0.220 | [0.083,0.580] |
| Center of gravity frequency | −0.041 | 0.048 | 0.707 | 0.400 | 0.960 | [0.874,1.055] |
| Mean square frequency | 0.135 | 0.201 | 0.455 | 0.500 | 1.145 | [0.773,1.697] |
| Hosmer-Lemeshow test | χ² | P | ||||
| 6.601 | 0.580 | |||||
| Accuracy | 83.7% | |||||
Logistic regression analysis results.
Coef., coefficient; SE, standard error; OR, odds ratio; CI, confidence interval. Binary logistic regression was performed to predict the likelihood of being in the older group (coded as 1) vs. the young group (coded as 0). The Hosmer-Lemeshow test yielded a χ² statistic of 6.601 (p = 0.580), indicating a good model fit. An OR > 1 indicates higher odds of being classified into the older group (coded as 1), whereas an OR < 1 indicates lower odds.
Although the conventional feature-based analysis demonstrated some ability to distinguish the age-defined groups/stiffness-related signatures, its classification accuracy remained limited. A principal challenge lies in the manual curation of the most discriminative features or identifying optimal multi-dimensional feature combinations to enhance the model's capability for assessing pathological signals. In contrast, deep learning networks possess a superior ability to automatically learn complex, high-dimensional feature hierarchies and approximate the optimal mapping function through iterative parameter optimization. To enable more automated and scalable screening of vascular stiffness-related signatures, we therefore developed and implemented deep learning models.
Verification
To evaluate clinical relevance, correlations between Korotkoff sound features and baPWV were analyzed (Table 5). Notably, several features (including center of mass, peak frequency, and skewness) showed modest correlations with measured baPWV, supporting the hypothesis that these acoustic characteristics are sensitive to vascular property differences. Nevertheless, the correlation coefficients were modest, indicating limited effect size; thus, these findings should be interpreted as preliminary evidence requiring replication in larger and independent cohorts.
Table 5
| Indicates | P | r | 1-β |
|---|---|---|---|
| Maximum amplitude | 0.049 | 0.218 | 0.228 |
| Kurtosis | 0.182 | 0.103 | 0.205 |
| Skewness | 0.031 | 0.181 | 0.233 |
| Peak factor | 0.745 | 0.037 | 0.056 |
| Pulse factor | 0.442 | −0.087 | 0.084 |
| Form factor | 0.048 | −0.240 | 0.326 |
| Center of mass | 0.005 | −0.310 | 0.506 |
| Peak frequency | 0.011 | −0.254 | 0.360 |
| Center of gravity frequency | 0.195 | 0.146 | 0.148 |
| Mean square frequency | 0.847 | −0.022 | 0.052 |
Statistical analysis of the correlation between the characteristics of the korotkoff sound signals and the baPWV values of 81 subjects.
baPWV, brachial-ankle pulse wave velocity; P, significance level; r, correlation coefficient; 1-β, statistical power. The correlations between features of Korotkoff sound signals and baPWV values were assessed using Pearson's correlation analysis. The correlation coefficient (r) indicates the strength and direction of the linear relationship, where values around 0.1, 0.3, and 0.5 are typically considered small, medium, and large effects, respectively. Statistical power (1-β) represents the probability of correctly rejecting a false null hypothesis, with values above 0.8 considered desirable. The modest correlation coefficients and variable statistical power observed here suggest that these preliminary findings should be validated in larger-scale studies.
To assess whether Korotkoff sound features provide information beyond established covariates, multivariable linear regression analyses were performed adjusting for age, diabetes status, BMI, and systolic blood pressure. After adjustment, skewness (β = 0.166, p = 0.030), center of mass (β = −0.310, p = 0.018), and peak frequency (β = −0.331, p = 0.029) remained significantly associated with baPWV. The negative coefficients indicate that higher values of center of mass and peak frequency are associated with lower baPWV (i.e., less stiffness), consistent with the between-group differences observed in the age-defined task. The relatively high adjusted R² values primarily reflect the contribution of established covariates (especially age and blood pressure), while the persistence of the acoustic features suggests a small independent association. Full model details are provided in the Supplementary Material Tables S3–S5.
CNN models
Figure 3 illustrates the progression of training accuracy and loss for the CNN models, indicating stable learning convergence. The corresponding classification performance is quantified using confusion matrices in Figure 4. Evaluation of the age-based group classification (older vs. young) revealed that both CNN architectures showed high performance in the age-defined task (Figure 4A). GoogLeNet correctly identified 84.0% of older-group cases (sensitivity) and 95.6% of young-group cases (specificity), with an overall accuracy of 89.3%. SqueezeNet exhibited a slightly higher sensitivity of 91.3% and a specificity of 92.3%, leading to an accuracy of 93.7% (see Supplementary Material Table 6).
Figure 3
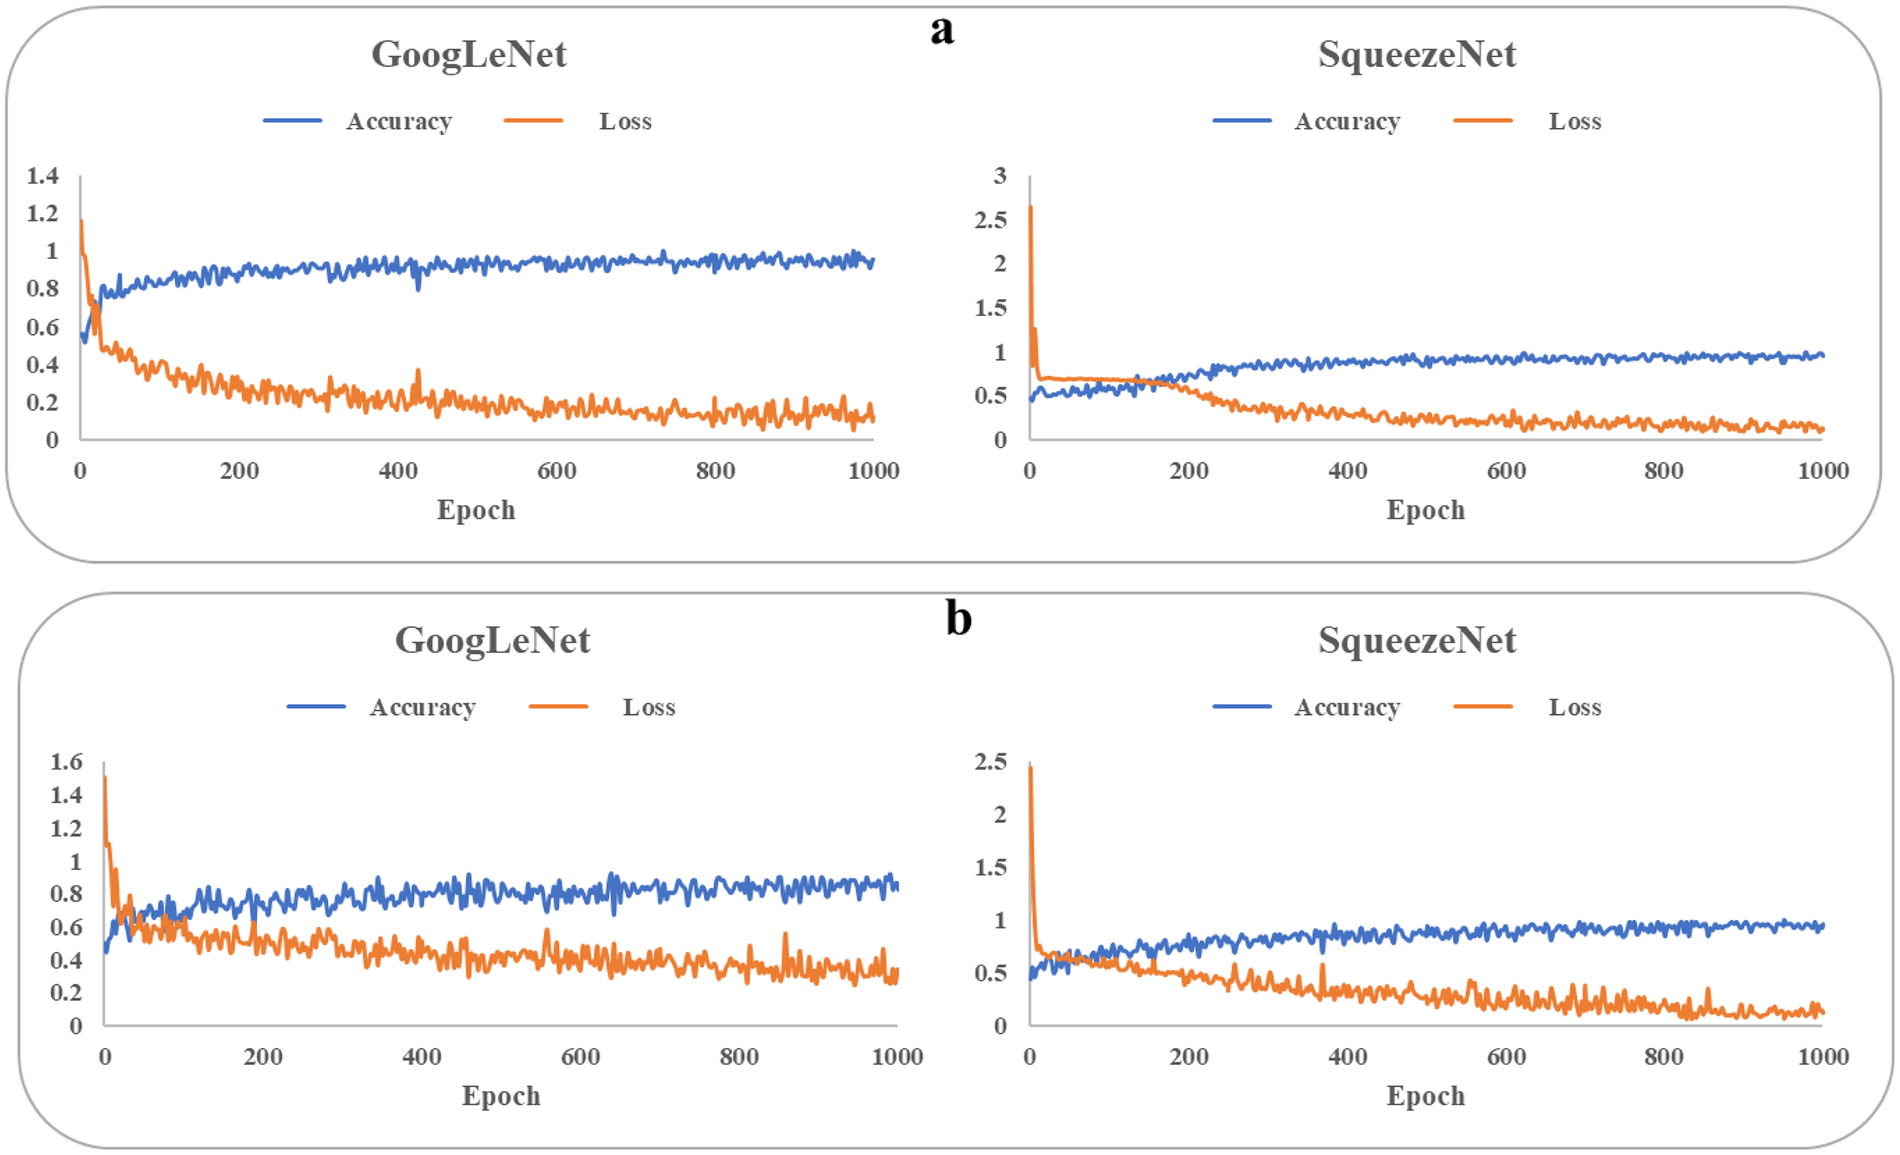
Training accuracy and loss of googLeNet and squeezeNet. baPWV, brachial-ankle pulse wave velocity. (a) older and young groups. (b) High-baPWV and low-baPWV groups.
Figure 4
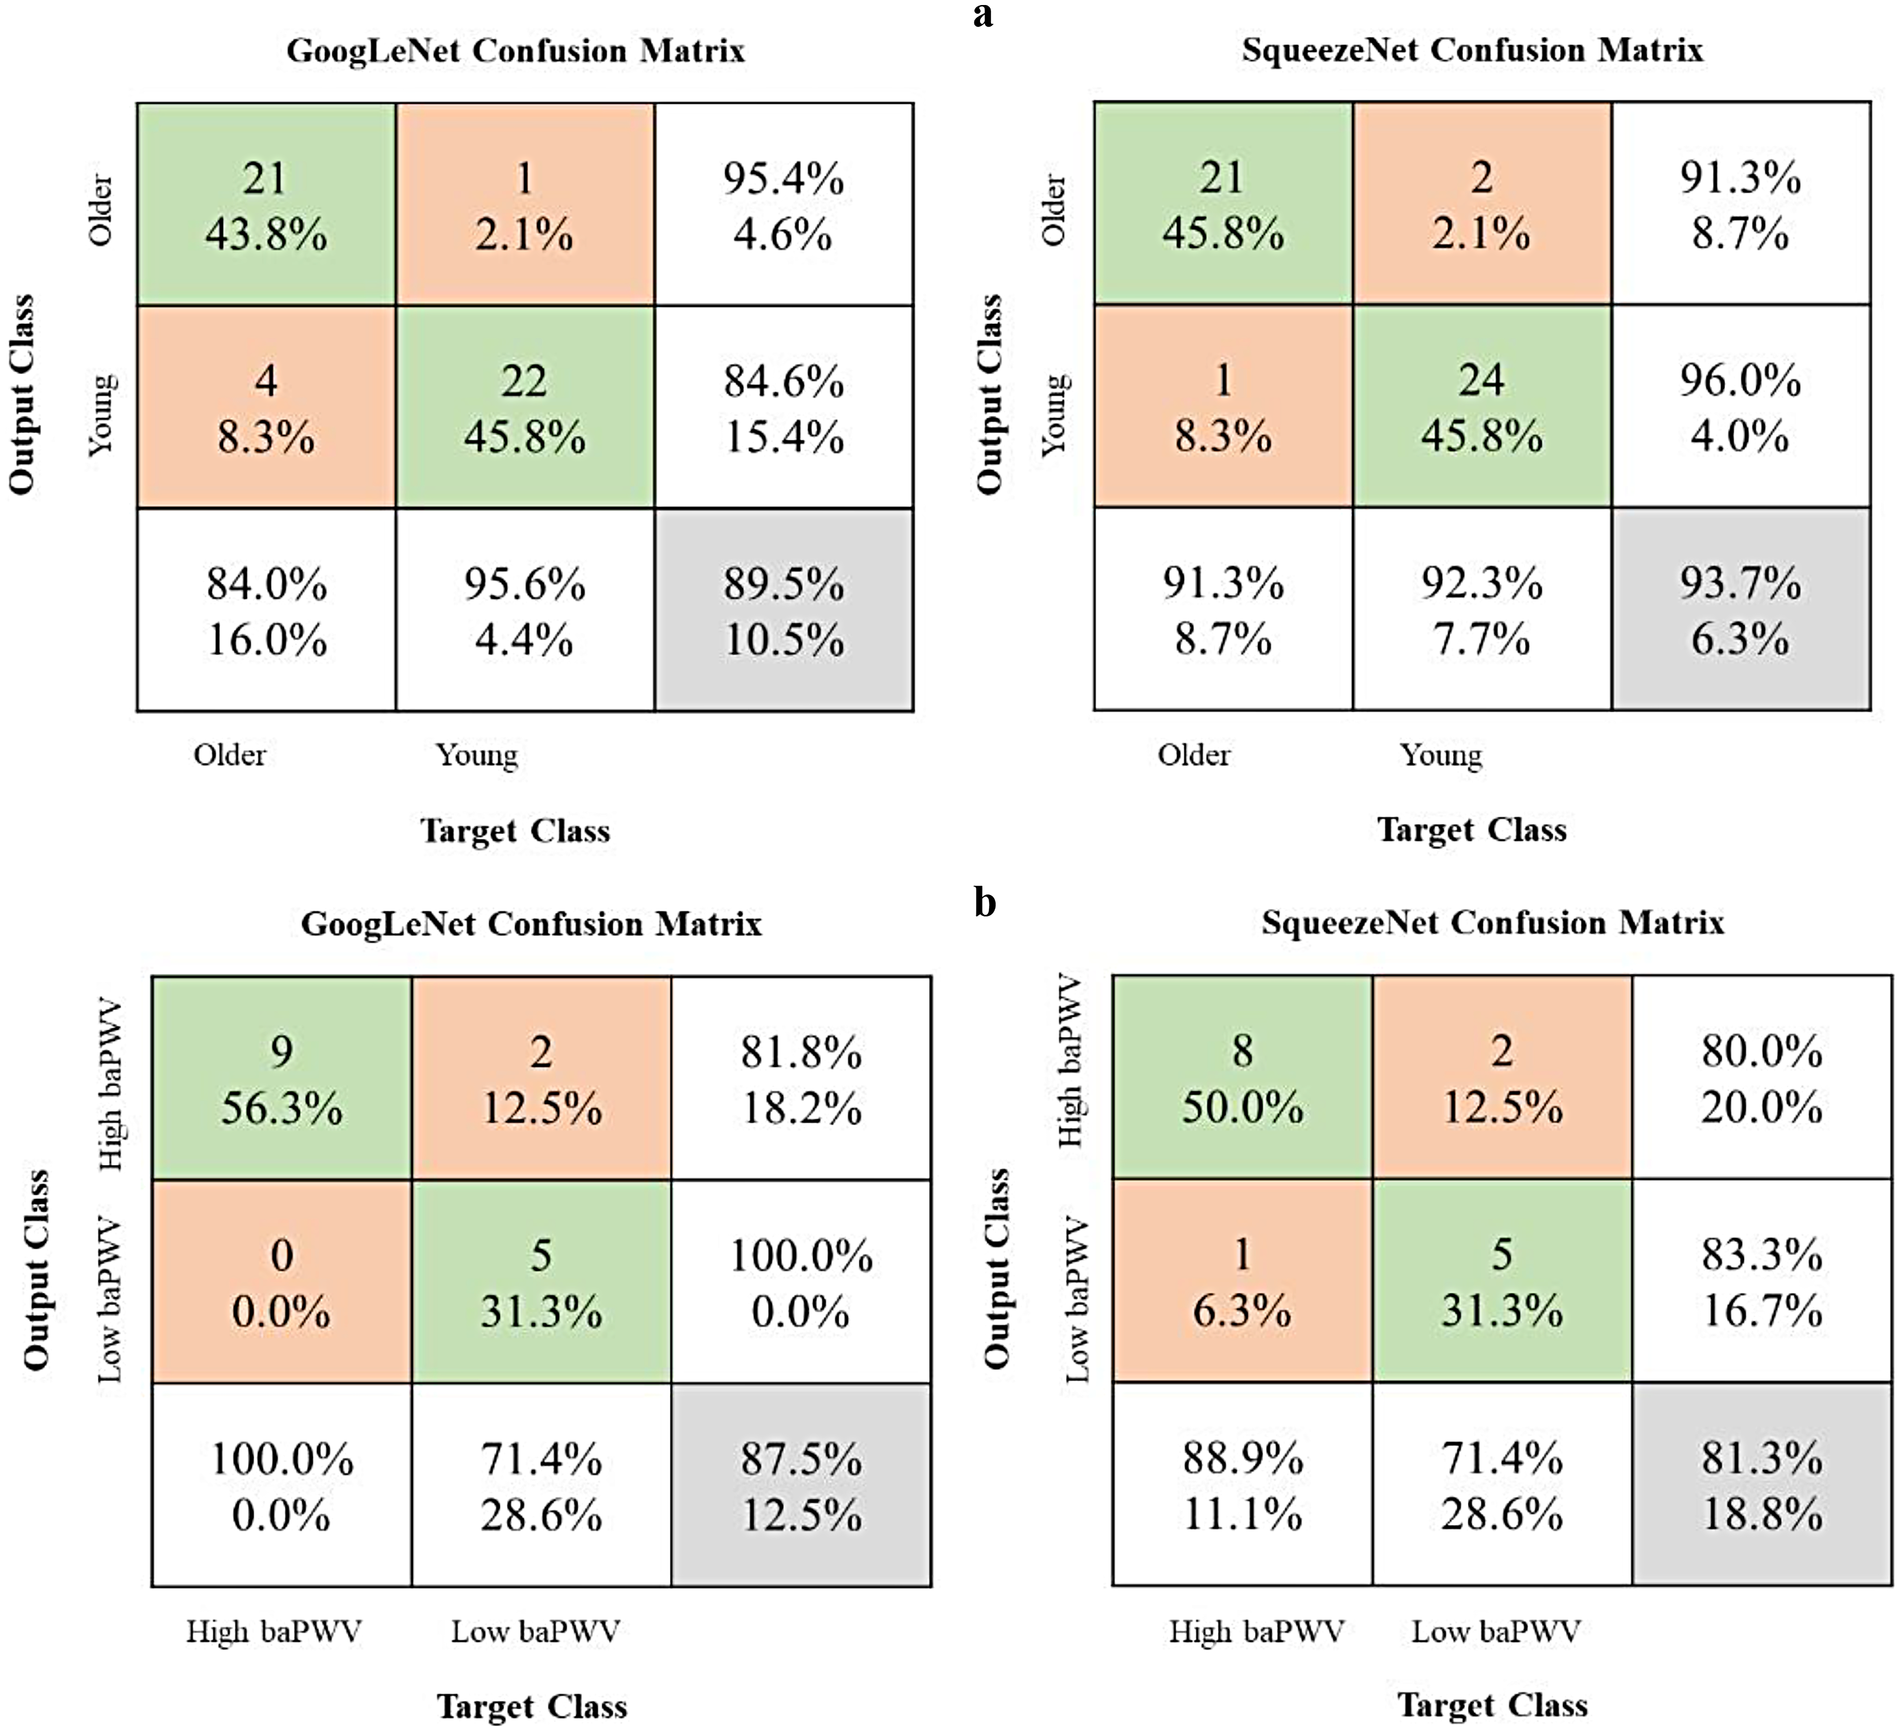
Model performance evaluation using confusion matrices. baPWV, brachial-ankle pulse wave velocity. The matrices present results for two binary classification tasks: (a) older group vs. young group and (b) high-baPWV group vs. low-baPWV group. Rows indicate the true labels, and columns indicate the predicted labels. The third row aggregates the total instances per true class and shows the Recall (Sensitivity) for each class. The third column aggregates the total instances per predicted class and shows the Precision for each class. The bottom-right cell shows the overall accuracy. Values in the main 2 × 2 cells represent counts and their percentage relative to the true class (row total).
In the independent baPWV-defined classification task (high baPWV vs. low baPWV; Figure 4B), both models showed moderate performance (Supplementary Table 7). While this suggests that the networks capture stiffness-related information not restricted to the age-defined labels, performance was lower than in the age-defined task and should be interpreted cautiously given the limited sample size and potential spectrum differences between cohorts.
Discussion
The assessment of arterial stiffness is closely linked to cardiovascular risk and is widely used to characterize vascular ageing and subclinical organ damage (17, 41, 42). However, the complexity, cost, and need for specialized operators limit widespread implementation of PWV, particularly in primary care workflows and in-home monitoring. This study therefore investigated the feasibility of extracting stiffness-related information from Korotkoff sounds recorded during routine cuff-based blood pressure measurement using engineered feature analysis and machine learning.
This study provides proof-of-concept evidence that Korotkoff sound analysis can differentiate between young and older individuals, groups expected to differ in vascular ageing and arterial stiffness based on the well-established association between age and PWV (43–45). Importantly, PWV was not directly measured in these two groups; therefore, these findings should be interpreted as discrimination of age-defined vascular characteristics rather than direct stiffness quantification or clinical risk stratification. In the separate hospital cohort with measured baPWV, selected features showed statistically significant associations with baPWV, providing supportive evidence for feasibility.
From a biological perspective, the link between vascular ageing and arterial stiffening is driven by integrated molecular and cellular processes across the vascular wall. A geroscience framework emphasizes that endothelial dysfunction (including impaired nitric oxide bioavailability), increased oxidative stress, chronic low-grade inflammation (“inflammaging”), mitochondrial dysfunction, impaired proteostasis, and the accumulation of senescent vascular cells with a senescence-associated secretory phenotype (SASP) contribute to progressive adverse vascular remodeling. In parallel, extracellular matrix changes, such as elastin fragmentation, increased collagen content and cross-linking, altered mechanotransduction, and, in some contexts, medial calcification, reduce arterial compliance and increase PWV. These processes provide a biologically plausible basis for why younger and older adults are expected to differ in vascular mechanical properties, even in the absence of overt cardiovascular disease, supporting the rationale for using age as a surrogate label in an initial feasibility comparison (46, 47).
Mechanistically, Korotkoff sounds are thought to arise from a combination of arterial wall vibration and hemodynamic phenomena during partial arterial compression, although the precise genesis remains an active area of research (19, 24). Recent experimental and modeling work has reinforced that both vessel wall mechanics and flow-related instabilities can contribute to sound generation and that the time–frequency characteristics are shaped by the coupled dynamics of pulsatile flow, arterial wall motion, cuff pressure, and vibration transmission through surrounding tissue (24). Increased arterial stiffness may alter the coupling between pulsatile flow, arterial wall vibration, and cuff-induced compression, which can plausibly shift the temporal asymmetry of the envelope and redistribute spectral energy. In this context, our observation that skewness and peak-frequency–related features differ between age-stratified groups is biologically plausible, because ageing-related arterial remodeling and reduced compliance can shift the dynamic response of the arterial wall to external compression and pulsatile flow (13, 48, 49).
Our findings are also consistent with prior efforts to derive vascular information from Korotkoff sounds. Earlier work reported age-related differences in Korotkoff sound characteristics as a proxy for vascular compliance (26), and recent studies have demonstrated that deep learning can extract clinically relevant information from Korotkoff sounds beyond conventional blood pressure estimation (25). Our approach emphasizes waveform- and time- frequency-derived acoustic descriptors combined with transfer-learning CNNs, offering an alternative pathway to extract stiffness-related signatures from routine cuff measurements.
Notably, the associations between individual Korotkoff sound features and baPWV were statistically significant but modest in magnitude. This is not unexpected because baPWV is influenced by multiple determinants including age, blood pressure, metabolic factors, and peripheral arterial properties, while Korotkoff sounds are additionally affected by cuff pressure dynamics, tissue characteristics, and sensor positioning. These differences in physiological territory and measurement determinants can attenuate correlations and reduce classification performance when labels are defined by baPWV rather than by age. In addition, the limited sample size of the baPWV cohort and potential spectrum differences between cohorts may constrain generalizability and performance. Therefore, the current results should be interpreted as feasibility evidence that Korotkoff sounds encode stiffness-related information, rather than as proof that these signals can replace standardized PWV measurement or provide substantial incremental risk stratification beyond age and blood pressure. Quantifying incremental value, head-to-head against estimated PWV derived from age and blood pressure, as well as multivariable clinical models, should be a central aim of future work (31).
To enable a more automated analysis, we applied transfer-learning CNNs (GoogLeNet and SqueezeNet) to classify Korotkoff sound time-frequency representations. Both architectures achieved high performance in distinguishing age-defined groups, outperforming traditional feature-based analysis. Considering potential implementation in mobile or portable devices (e.g., electronic sphygmomanometers), lightweight networks such as SqueezeNet may be advantageous in terms of computational efficiency. Because the primary labels were age-defined, these CNN results should be interpreted as proof-of-concept, and future studies should evaluate robustness across devices, measurement conditions, and populations.
Finally, while our findings support feasibility, establishing clinical utility will require additional validation steps. Larger cohorts spanning a wider range of vascular ageing should be studied with standardized PWV measurements, ideally cfPWV, to better characterize how Korotkoff sound–derived representations relate to arterial stiffness and whether they provide incremental value beyond conventional variables. Korotkoff sounds may also encode hemodynamic information beyond stiffness, but such applications remain speculative and will require dedicated study designs with appropriate labels and clinical endpoints (24).
Limitations
Several limitations of this study should be acknowledged. First, the primary comparison (older vs. young) used age as a surrogate for arterial stiffness rather than direct PWV measurement. Although this approach is supported by prior literature and complemented by the secondary analysis in a baPWV-measured cohort, standardized direct PWV measurements within the same individuals are needed to confirm the relationship. In addition, cfPWV (reference-standard aortic stiffness) was not measured; baPWV was used as a pragmatic comparator. Future studies should therefore incorporate direct cfPWV measurements for definitive validation (17). Second, the analyzed acoustic features were selected based on a priori knowledge; expanding feature diversity through a more comprehensive search may yield biomarkers that better capture stiffness-related information. Third, the generalizability and model performance may be constrained by the limited sample size and cohort differences, potentially limiting further gains in accuracy and robustness. Fourth, incremental value beyond age and blood pressure was not quantified; this is required before any risk-stratification claims can be made.
Clinical implications and future perspectives
Importantly, the current work should be interpreted as a feasibility and proof-of-concept study. The approach should be considered an adjunct rather than a substitute for established PWV assessment, and its incremental value beyond conventional variables remains to be determined. Future studies should: (i) validate performance against standardized direct PWV (preferably cfPWV) within the same individuals, (ii) evaluate test-retest reproducibility, (iii) quantify incremental value beyond conventional clinical variables, and (iv) examine associations with prospective cardiovascular outcomes to determine clinically meaningful thresholds and utility.
Conclusion
This study supports the feasibility of using machine-learning analysis of Korotkoff sounds to capture signals related to arterial stiffness and vascular ageing. The approach discriminated age-defined groups and demonstrated a statistically significant but modest association with baPWV in a baPWV-measured clinical cohort. Further validation against standardized direct PWV measurements (ideally cfPWV) and prospective outcome studies are needed before clinical risk-stratification or prognostic claims can be made.
Statements
Data availability statement
The raw data supporting the conclusions of this article will be made available by the authors, without undue reservation.
Ethics statement
The studies involving humans were approved by the Ethics Committee of Beihang University (17th June, 2,021/BM20210119). The studies were conducted in accordance with the local legislation and institutional requirements. Written informed consent for participation was not required from the participants or the participants' legal guardians/next of kin in accordance with the national legislation and institutional requirements.
Author contributions
SR: Writing – review & editing, Conceptualization, Investigation, Methodology, Software, Writing – original draft, Validation, Data curation, Visualization. WZ: Conceptualization, Data curation, Resources, Visualization, Software, Writing – review & editing. CY: Visualization, Data curation, Conceptualization, Methodology, Writing – original draft. XD: Supervision, Validation, Writing – review & editing, Methodology, Resources. ZC: Conceptualization, Validation, Writing – review & editing. LW: Software, Data curation, Writing – review & editing, Methodology. LX: Data curation, Software, Resources, Writing – original draft. YY: Conceptualization, Methodology, Writing – original draft. AS: Resources, Project administration, Writing – review & editing, Methodology, Funding acquisition. YF: Writing – review & editing, Resources, Project administration, Supervision.
Funding
The author(s) declared that financial support was received for this work and/or its publication. This work was supported by National Natural Science Foundation of China, No. 12172033, T2288101, 11872096, 12332019, U20A20390 (to AS) and CAMS Innovation Fund for Medical Sciences (CIFMS) under Grant 2019-I2M-5-016, (AS).
Conflict of interest
The author(s) declared that this work was conducted in the absence of any commercial or financial relationships that could be construed as a potential conflict of interest.
Generative AI statement
The author(s) declared that generative AI was not used in the creation of this manuscript.
Any alternative text (alt text) provided alongside figures in this article has been generated by Frontiers with the support of artificial intelligence and reasonable efforts have been made to ensure accuracy, including review by the authors wherever possible. If you identify any issues, please contact us.
Publisher’s note
All claims expressed in this article are solely those of the authors and do not necessarily represent those of their affiliated organizations, or those of the publisher, the editors and the reviewers. Any product that may be evaluated in this article, or claim that may be made by its manufacturer, is not guaranteed or endorsed by the publisher.
Supplementary material
The Supplementary Material for this article can be found online at: https://www.frontiersin.org/articles/10.3389/fcvm.2026.1654162/full#supplementary-material
References
1.
Garcia-Rios A Ordovas JM . Chronodisruption and cardiovascular disease. Clin Investig Arterioscler. (2022) 34(Suppl 1):S32–7. 10.1016/j.arteri.2021.12.004
2.
North BJ Sinclair DA . The intersection between aging and cardiovascular disease. Circ Res. (2012) 110(8):1097–108. 10.1161/circresaha.111.246876
3.
Wu S Jin C Li S Zheng X Zhang X Cui L et al Aging, arterial stiffness, and blood pressure association in Chinese adults. Hypertension. (2019) 73(4):893–9. 10.1161/HYPERTENSIONAHA.118.12396
4.
Lee JG Joo SJ . Arterial stiffness and cardiovascular risk. Korean J Intern Med. (2019) 34(3):504–6. 10.3904/kjim.2019.110
5.
Chirinos JA Segers P Hughes T Townsend R . Large-artery stiffness in health and disease. J Am Coll Cardiol. (2019) 74(9):1237–63. 10.1016/j.jacc.2019.07.012
6.
Townsend RR Anderson AH Chirinos JA Feldman HI Grunwald JE Nessel L et al Association of pulse wave velocity with chronic kidney disease progression and mortality. Hypertension. (2018) 71(6):1101–7. 10.1161/hypertensionaha.117.10648
7.
Banegas JR Townsend RR . Arterial stiffness and reference values. Rev Esp Cardiol (Engl Ed). (2020) 73(1):11–3. 10.1016/j.rec.2019.07.004
8.
Laurent S Boutouyrie P Asmar R Gautier I Laloux B Guize L et al Aortic stiffness is an independent predictor of all-cause and cardiovascular mortality in hypertensive patients. Hypertension. (2001) 37(5):1236–41. 10.1161/01.hyp.37.5.1236
9.
Meaume S Benetos A Henry OF Rudnichi A Safar ME . Aortic pulse wave velocity predicts cardiovascular mortality in subjects >70 years of age. Arterioscl Throm Vas. (2001) 21(12):2046–50. 10.1161/hq1201.100226
10.
Gomez-Sanchez M Patino-Alonso MC Gomez-Sanchez L Recio-Rodríguez JI Rodríguez-Sánchez E Maderuelo-Fernández JA et al Reference values of arterial stiffness parameters and their association with cardiovascular risk factors in the Spanish population. The EVA study. Rev Esp Cardiol (Engl Ed). (2020) 73(1):43–52. 10.1016/j.rec.2019.04.016
11.
Mattace-Raso FUS van der Cammen TJM Hofman A van Popele NM Bos ML Schalekamp MA et al Arterial stiffness and risk of coronary heart disease and stroke. Circulation. (2006) 113(5):657–63. 10.1161/circulationaha.105.555235
12.
Zuo Y Chen S Tian X Wu S Wang A . Changes in baPWV and the risk of clinical outcomes: a cohort study of Chinese community-based population. J Hum Hypertens. (2024) 38(5):460–6. 10.1038/s41371-024-00902-9
13.
Janic M Lunder M Sabovic M . Arterial stiffness and cardiovascular therapy. Biomed Res Int. (2014) 2014:621437. 10.1155/2014/621437
14.
Tomiyama H Yamashina A . Non-invasive vascular function tests: their pathophysiological background and clinical application. Circ J. (2010) 74(1):24–33. 10.1253/circj.cj-09-0534
15.
Sethi S Rivera O Oliveros R Chilton R . Aortic stiffness: pathophysiology, clinical implications, and approach to treatment. Integr Blood Press Control. (2014) 7:29–34. 10.2147/IBPC.S59535
16.
Jung JY Lee YB Kang CK . Novel technique to measure pulse wave velocity in brain vessels using a fast simultaneous multi-slice excitation magnetic resonance sequence. Sensors (Basel). (2021) 21(19):6352. 10.3390/s21196352
17.
Van Bortel LM Laurent S Boutouyrie P Chowienczyk P Cruickshank JK De Backer T et al Expert consensus document on the measurement of aortic stiffness in daily practice using carotid-femoral pulse wave velocity. J Hypertens. (2012) 30(3):445–8. 10.1097/HJH.0b013e32834fa8b0
18.
Kreutz R Brunström M Burnier M Grassi G Januszewicz A Muiesan ML et al 2024 European society of hypertension clinical practice guidelines for the management of arterial hypertension. Eur J Intern Med. (2024) 126:1–15. 10.1016/j.ejim.2024.05.033
19.
Babbs CF . The origin of Korotkoff sounds and the accuracy of auscultatory blood pressure measurements. J Am Soc Hypertens. (2015) 9(12):935–50.e3. 10.1016/j.jash.2015.09.011
20.
Tanishiro H Funakubo A Fukui Y . An experimental study on the relationship between artificial Korotkoff sounds and self-excited oscillation using a circulatory simulator. Cardiovas Eng. (2003) 3(3):85–91. 10.1023/B:CARE.0000015100.72439.f0
21.
Chungcharoen D . Genesis of Korotkoff sounds. Am J Physiol. (1964) 207(1):190–4. 10.1152/ajplegacy.1964.207.1.190
22.
Lange RL Hecht HH . Genesis of pistol-shot and Korotkoff sounds. Circulation. (1958) 18(5):975–8. 10.1161/01.cir.18.5.975
23.
Erlanger J . Studies in blood pressure estimation by indirect methods. Am J Physiol. (1916) 40(1):82–125. 10.1152/ajplegacy.1916.40.1.82
24.
Baranger J Villemain O Goudot G Dizeux A Le Blay H Mirault T et al The fundamental mechanisms of the Korotkoff sounds generation. Sci Adv. (2023) 9(40):eadi4252. 10.1126/sciadv.adi4252
25.
Lin W Jia S Chen Y Shi H Zhao J Li Z et al Korotkoff sounds dynamically reflect changes in cardiac function based on deep learning methods. Front Cardiovasc Med. (2022) 9:940615. 10.3389/fcvm.2022.940615
26.
Ramakrishnan D . Using Korotkoff sounds to detect the degree of vascular compliance in different age groups. J Clin Diagn Res. (2016) 10(2):CC04–7. 10.7860/JCDR/2016/16225.7198
27.
Chen W Sun Q Chen X Xie G Wu H Xu C . Deep learning methods for heart sounds classification: a systematic review. Entropy (Basel). (2021) 23(6):667. 10.3390/e23060667
28.
Khan KN Khan FA Abid A Olmez T Dokur Z Khandakar A et al Deep learning based classification of unsegmented phonocardiogram spectrograms leveraging transfer learning. Physiol Meas. (2021) 42(9). 10.1088/1361-6579/ac1d59
29.
Weimann K Conrad TOF . Transfer learning for ECG classification. Sci Rep. (2021) 11(1):5251. 10.1038/s41598-021-84374-8
30.
Zhuang F Qi Z Duan K Xi D Zhu Y Zhu H et al A comprehensive survey on transfer learning. Proc IEEE. (2021) 109(1):43–76. 10.1109/jproc.2020.3004555
31.
Vishram-Nielsen JKK Laurent S Nilsson PM Linneberg A Sehested TSG Greve SV et al Does estimated pulse wave velocity add prognostic information? Hypertension. (2020) 75(6):1420–8. 10.1161/hypertensionaha.119.14088
32.
Li X Im JJ . Development of an automatic blood pressure device based on Korotkoff sounds. Int J Adv Smart Converg. (2019) 8(2):227–36. 10.7236/IJASC.2019.8.2.227
33.
Lu Y Pechlaner R Cai J Yuan H Huang Z Yang G et al Trajectories of age-related arterial stiffness in Chinese men and women. J Am Coll Cardiol. (2020) 75(8):870–80. 10.1016/j.jacc.2019.12.039
34.
Baier D Teren A Wirkner K Loeffler M Scholz M . Parameters of pulse wave velocity: determinants and reference values assessed in the population-based study LIFE-adult. Clin Res Cardiol. (2018) 107(11):1050–61. 10.1007/s00392-018-1278-3
35.
Tanaka H Munakata M Kawano Y Ohishi M Shoji T Sugawara J et al Comparison between carotid-femoral and brachial-ankle pulse wave velocity as measures of arterial stiffness. J Hypertens. (2009) 27(10):2022–7. 10.1097/HJH.0b013e32832e94e7
36.
Lu Y Zhu M Bai B Chi C Yu S Teliewubai J et al Comparison of carotid-femoral and brachial-ankle pulse-wave velocity in association with target organ damage in the community-dwelling elderly Chinese: the northern Shanghai study. J Am Heart Assoc. (2017) 6(2):e004168. 10.1161/jaha.116.004168
37.
Choi HY Park SK Yun GY Choi AR Lee JE Ha SK et al Glycated albumin is independently associated with arterial stiffness in non-diabetic chronic kidney disease patients. Medicine (Baltimore). (2016) 95(16):e3362. 10.1097/md.0000000000003362
38.
Avolio AP Deng FQ Li WQ Luo YF Huang ZD Xing LF et al Effects of aging on arterial distensibility in populations with high and low prevalence of hypertension: comparison between urban and rural communities in China. Circulation. (1985) 71(2):202–10. 10.1161/01.Cir.71.2.202
39.
Mackey RH Sutton-Tyrrell K Vaitkevicius PV Sakkinen PA Lyles MF Spurgeon HA et al Correlates of aortic stiffness in elderly individuals: a subgroup of the cardiovascular health study. Am J Hypertens. (2002) 15(1):16–23. 10.1016/s0895-7061(01)02228-2
40.
Sengstock DM Vaitkevicius PV Supiano MA . Arterial stiffness is related to insulin resistance in nondiabetic hypertensive older adults. J Clin Endocrinol Metab. (2005) 90(5):2823–7. 10.1210/jc.2004-1686
41.
Wang F Zheng R Li L Xu M Lu J Zhao Z et al Novel subgroups and chronic complications of diabetes in middle-aged and elderly Chinese: a prospective cohort study. Front Endocrinol (Lausanne). (2022) 12:802114. 10.3389/fendo.2021.802114
42.
Song Y Raed A Bhagatwala J Pollock NK Parikh SJ Huang Y et al Dose responses of vitamin D3 supplementation on arterial stiffness in overweight African Americans with vitamin D deficiency: a placebo controlled randomized trial. PLoS One. (2017) 12(12):1–13. 10.1371/journal.pone.0188424
43.
Gomez-Marcos MA Martinez-Salgado C Gonzalez-Sarmiento R Hernandez-Rivas JM Sanchez-Fernandez PL Recio-Rodriguez JI et al Association between different risk factors and vascular accelerated ageing (EVA study): study protocol for a cross-sectional, descriptive observational study. BMJ Open. (2016) 6(6):e011031. 10.1136/bmjopen-2016-011031
44.
Zeng X Jia N Liu D Wang L Xu Z Zhang Y et al A cross-sectional study of the ambulatory central artery stiffness index in patients with hypertension. Medicine (Baltimore). (2019) 98(26):e16053. 10.1097/md.0000000000016053
45.
Nilsson PM Khalili P Franklin SS . Blood pressure and pulse wave velocity as metrics for evaluating pathologic ageing of the cardiovascular system. Blood Press. (2013) 23(1):17–30. 10.3109/08037051.2013.796142
46.
Ungvari Z Tarantini S Donato AJ Galvan V Csiszar A . Mechanisms of vascular aging. Circ Res. (2018) 123(7):849–67. 10.1161/CIRCRESAHA.118.311378
47.
Pierce GL . Mechanisms and subclinical consequences of aortic stiffness. Hypertension. (2017) 70(5):848–53. 10.1161/hypertensionaha.117.08933
48.
Briet M Boutouyrie P Laurent S London GM . Arterial stiffness and pulse pressure in CKD and ESRD. Kidney Int. (2012) 82(4):388–400. 10.1038/ki.2012.131
49.
Shaikh AY Wang N Yin X Larson MG Vasan RS Hamburg NM et al Relations of arterial stiffness and brachial flow–mediated dilation with new-onset atrial fibrillation. Hypertension. (2016) 68(3):590–6. 10.1161/hypertensionaha.116.07650
Summary
Keywords
arterial stiffness, artificial intelligence, blood pressure, cardiovascular disease, machine learning, pulse wave velocity
Citation
Ren S, Zhao W, Yi C, Deng X, Chen Z, Wang L, Xu L, Yang Y, Fan Y and Sun A (2026) Assessing arterial stiffness using characteristics of Korotkoff sounds. Front. Cardiovasc. Med. 13:1654162. doi: 10.3389/fcvm.2026.1654162
Received
26 June 2025
Revised
09 January 2026
Accepted
19 January 2026
Published
10 February 2026
Volume
13 - 2026
Edited by
Grzegorz K. Jakubiak, Medical University of Silesia, Poland
Reviewed by
Dominika Blachut, Medical University of Silesia, Poland
Ahmed Gdoura, University of Giessen, Germany
Updates
Copyright
© 2026 Ren, Zhao, Yi, Deng, Chen, Wang, Xu, Yang, Fan and Sun.
This is an open-access article distributed under the terms of the Creative Commons Attribution License (CC BY). The use, distribution or reproduction in other forums is permitted, provided the original author(s) and the copyright owner(s) are credited and that the original publication in this journal is cited, in accordance with accepted academic practice. No use, distribution or reproduction is permitted which does not comply with these terms.
* Correspondence: Anqiang Sun saq@buaa.edu.cn
†These authors have contributed equally to this work
Disclaimer
All claims expressed in this article are solely those of the authors and do not necessarily represent those of their affiliated organizations, or those of the publisher, the editors and the reviewers. Any product that may be evaluated in this article or claim that may be made by its manufacturer is not guaranteed or endorsed by the publisher.