 Weikai Li
 Xiaowen Xu
 Zhengxia Wang
 Liling Peng2
 Peijun Wang
 Xin Gao
- 1School of Information Science and Engineering, Chongqing Jiaotong University, Chongqing, China
- 2Shanghai Universal Medical Imaging Diagnostic Center, Shanghai, China
- 3Department of Medical Imaging, Tongji Hospital, Shanghai, China
- 4Tongji University School of Medicine, Tongji University, Shanghai, China
- 5School of Computer Science and Cyberspace Security, Hainan University, Hainan, China
Mild cognitive impairment (MCI) is generally considered to be a key indicator for predicting the early progression of Alzheimer’s disease (AD). Currently, the brain connection (BC) estimated by fMRI data has been validated to be an effective diagnostic biomarker for MCI. Existing studies mainly focused on the single connection pattern for the neuro-disease diagnosis. Thus, such approaches are commonly insufficient to reveal the underlying changes between groups of MCI patients and normal controls (NCs), thereby limiting their performance. In this context, the information associated with multiple patterns (e.g., functional connectivity or effective connectivity) from single-mode data are considered for the MCI diagnosis. In this paper, we provide a novel multiple connection pattern combination (MCPC) approach to combine different patterns based on the kernel combination trick to identify MCI from NCs. In particular, sixty-three MCI cases and sixty-four NC cases from the ADNI dataset are conducted for the validation of the proposed MCPC method. The proposed method achieves 87.40% classification accuracy and significantly outperforms methods that use a single pattern.
Introduction
As the most concerning neurodegenerative disease, Alzheimer’s disease (AD) comes to be the most common causes of dementia (Gaugler et al., 2016). In particular, AD can seriously interfere with patient’s daily lives, and eventually lead to deaths. Thus, a natural ambition is to delay the progression of AD during its early stages via pharmacological and behavioural interventions. In particular, mild cognitive impairment (MCI) is often considered an early indicator of potential progression to AD (Wee et al., 2012). Nearly 10–15% of patients with MCI progress to AD per year (Misra et al., 2009). Therefore, the accurate diagnosis of MCI has attracted considerable attention.
Recently, functional magnetic resonance imaging (fMRI) comes to a popular technique to reveal brain activities and patterns for the MCI diagnosis (Kevin et al., 2008). However, due to the random and asynchronous spontaneous brain activity between the subject and the scanner, it is still a challenge to identify MCI patients and normal controls (NC) based on fMRI alone. In contrast, the connectome-based methods provide a new stable biomarker which potentially helps us to understand brain information (Stam, 2014). Specifically, several studies have illustrated that several neurological diseases, such as AD (Chen et al., 2016), MCI (Gao et al., 2020), autism spectrum disorder (Li et al., 2017), and Parkinson’s disease (Abós et al., 2017) are highly related to the functional brain connections.
Notably, the exiting works are highly dependent on the estimated networks or connections. Thus, several efforts have been devoted to estimating the ideal network by incorporating additional biological priors into BCs to improve the discriminative ability of the networks, e.g., sparsity (Lee et al., 2011), scale-free priors (Li et al., 2017), modularity (Qiao et al., 2016; Li et al., 2020c; Li et al., 2020a), and group sparsity (Liang et al., 2018; Zhang et al., 2019). Moreover, the data noisy prior (Li et al., 2019) and domain knowledge prior (Li et al., 2020d) can also be adopted. However, these approaches may still be insufficient to identify MCI from NCs, since they focus only on a single connection pattern, which fails in combining the information from the multiple connections for neurological disorder diagnosis.
In this paper, we provide a simple yet valuable approach, i.e., multiple connection pattern combination (MCPC), which combines the information from multiple connection patterns to achieve a better diagnostic performance of neurological disorders. In particular, a multi-kernel support vector machine (MK-SVM) trick is employed as a naive attempt to combine the multiple connection patterns for the MCI diagnosis. Further, an MCI identification task is explored to verify the performance of the proposed MCPC method. The highlights of this paper are as follows.
1) To our best knowledge, MCPC is the first attempt that combines the multiple connection patterns to identify MCIs from NCs. The experimental results also confirm that the proposed MCPC scheme significantly outperforms single-pattern methods.
2) We identify hubs and consensus connections based on the proposed multiple connection patterns. Analyses of graph theory attributes and critical functional connectivity are performed to discriminate individuals with MCI from NCs and identify the pathological mechanism of MCI.
Materials and Methods
Data Preparation
The publicly available neuroimaging data from the Alzheimer’s disease Neuroimaging Initiative (ADNI)1 database (Jack et al., 2010) is adopted. Notably, 127 participants, including sixty-three MCIsand 64 NCs were included in this experiment. The SPM8 toolbox2 is used to pre-process the fMRI data according to a commonly adopted pipeline for fMRI. Finally, the pre-processed BOLD time series signals were partitioned into 116 ROIs, based on the Automated Anatomical Labeling (AAL) atlas.
Construction of Multiple Brain Connection
We adopted the commonly-used BC estimation model to discover the connection patterns, including Pearson’s correlation (PC), sparse representation (SR) and Granger causality mapping (GCM). Let
Pearson’s Correlation
Pearson’s correlation (PC) is among the most simplicity and intuitiveness scheme for the BC estimation. The edge weights of the PC-based BC
where
Partial Correlation With Sparse Representation
Due to the cofounding effect caused by the PC-based method, the partial correlation method involves regressing complex factors from other ROIs that naturally come into being (Huang et al., 2010). Inspired by the sparsity nature of the brain connection, one popular solution is to incorporate an additional
where
Granger Causality Mapping
Granger causality mapping (GCM) models the effective connectivity, i.e., causality relations among nodes, which connection is thereby nonsymmetric (Goebel et al., 2003). Specifically, given two-time
where
Combination of Multiple Connection Patterns
The simplest way to combine the information for multiple connection patterns is to concatenate all of the data directly. However, this approach is quite inappropriate in cases with high-dimension curves and small samples. To achieve this, this paper provided Multiple Connection Pattern Combination (MCPC), which is given in Figure 1. Specifically, an MK-SVM model is adopted to combine multiple information. Notably, this is the first attempt, which combines the information from different connectomes derived from single-mode data. Here, the primal problem of MK-SVM is given as follows: (Rakotomamonjy et al., 2007)
where
where
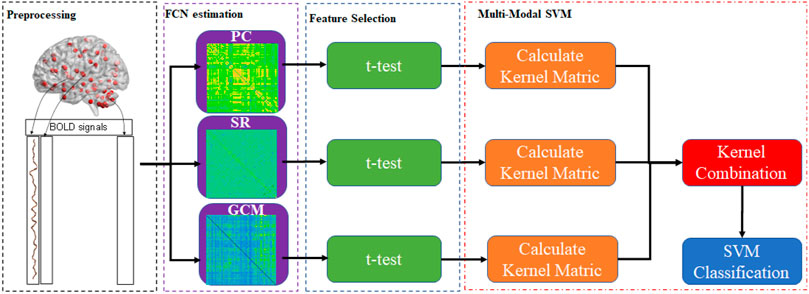
FIGURE 1. The entire framework of the proposed method for combining multiple connection patterns.
Results
Multiple Brain Connection Matrix Estimation From Single-Mode Data
The PC-based and SR-based BC is estimated by BrainNetClass (Zhou et al., 2020). Note that there exists a hyperparameter
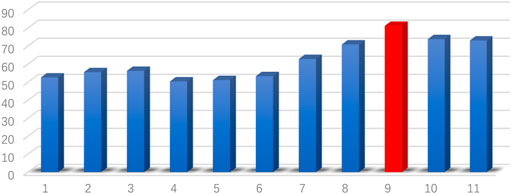
FIGURE 2. The accuracy of different hyperparameters
We visualized the BC adjacency matrices3 of PC, SR and GCM methods in Figure 3. In Figure 3, the brain connections obtained by different BC estimation methods are completely different in their topology, since these methods model different statistical information or relation across ROIs.
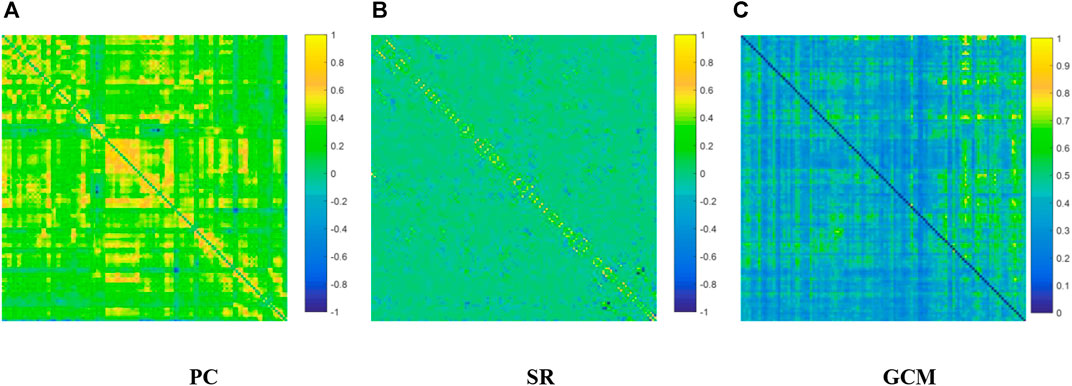
FIGURE 3. The connection networks obtained by the (A) PC, (B) SR and (C) GCM methods.
Classification
Due to the limited sample size, we adopt the nest LOOCV strategy for evaluating the performance of the MCI classification. Specifically, to determine the optimal parameters (i.e., the optimal value of the hyperparameter
Here, TP (TruePositive) is the number of the positive subjects that are correctly classified in the ASD identification task. Similarly, TN (TrueNegative), FP (FalsePostive) and FN (FalseNegative) are the numbers of their corresponding subjects, respectively.
The classification results based on single connection patterns are given in Table 1, which results are achieved by a single linear kernel SVM classifier. In addition, the results based on combining the partial connection patterns (e.g., PC + SR, PC + GCM and SR + GCM) are also reported. The ROC curve is given in Figure 4.
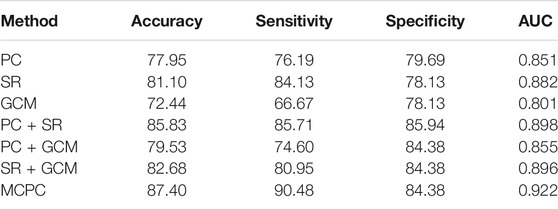
TABLE 1. The Classification results of different methods.
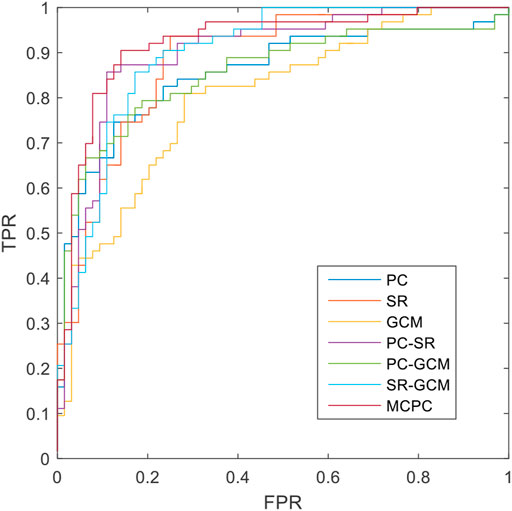
FIGURE 4. The ROCs of different methods.
From these results in Table 1 and Figure 4, we can easily observe that the performance of MCPC achieves much better results than that of the single-kernel SVM. The results indicate the rationality of the proposed MCPC. To investigate the significance of model performance improvement, differences between various AUCs were compared by using a Delong test (Delong et al., 1988), the proposed MCPC methods are significantly superior to results of the single pattern, e.g., PC, SR, GCM under 95% confidence interval with p-value equals to 0.0251, 0.041 and 0.005, respectively. The superior performance illustrated that the proposed MCPC approach can significantly improve the classification performance with only single modal data. In addition, although the MCPC only use single-mode data, it can still significantly improve the accuracy of the MCI diagnosis.
Distribution of Hubs
The hub nodes (the top 5% degree of brain nodes) of the MCI and NC groups based on three different BC network estimation methods are obtained. As shown in Tables 2-5, the distribution of hub nodes of the networks estimated by the PC, SR and GCM methods are similar. Most hubs are mainly distributed in the parietal lobes, temporal, and frontal, which correspond to the default mode network (DMN) and frontoparietal task control (FTC) network. Furthermore, the results suggest that hub nodes in the NC group are mainly located in the DMN. In comparison, the distribution of hub nodes in patients with MCI covers a relatively wide range of brain connection distributions, such as the frontoparietal task control network and visual network, in addition to the DMN.
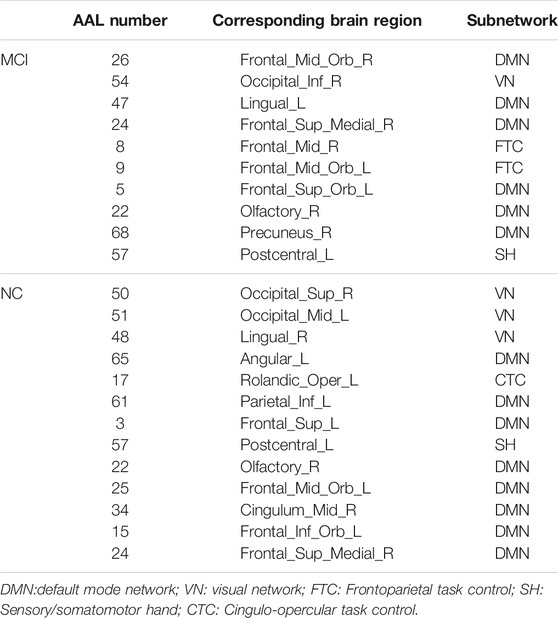
TABLE 2. Hubs of the MCI and NC groups based on the PC method.
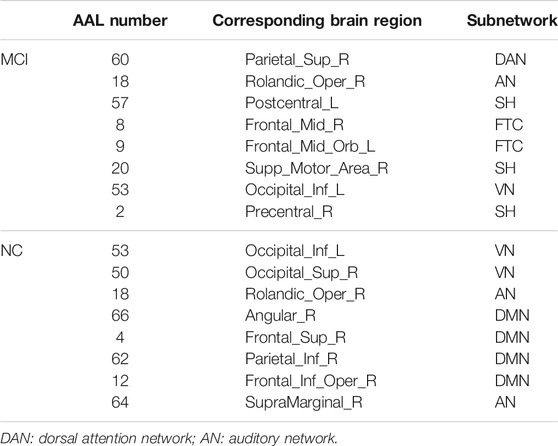
TABLE 3. Hubs of the MCI and NC groups based on the SR method.
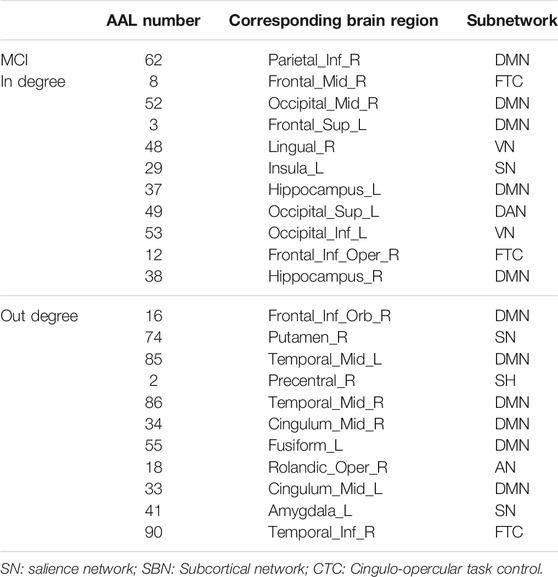
TABLE 4. Hubs of the MCI group based on the GCM method.
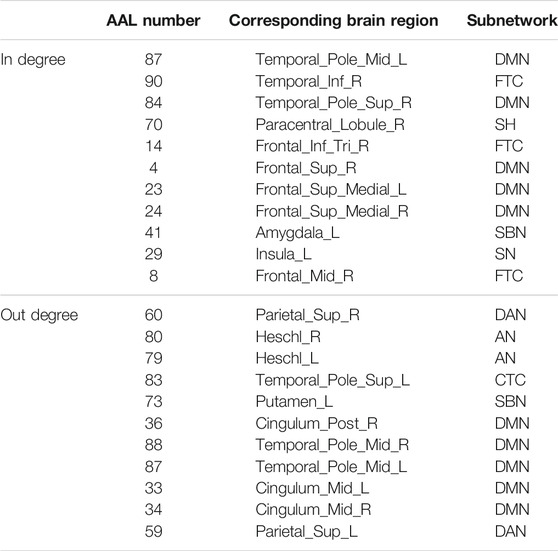
TABLE 5. Hubs of the NC group based on the GCM method.
Consensus Connections
In this study, the nested cross-validation scheme was adopted to evaluate the performance of the proposed MCPC. In particular, the selected connections in each validation loop might vary due to the validation resampling. Thus, we record the consensus connections and regard them as the most discriminative features for differentiating individuals with MCI from NCs (Li et al., 2020b). The consensus connections based on different connection pattern methods are shown in Figure 5. In addition, the degrees of consensus connection for different patterns are given in Tables 6-8. As shown in Tables 6-8, among the three BC estimation methods, the brain connection based on the PC method exhibits the maximum number of consensus connections. It is worth noting that the consensus connections with significant differences between MCI individuals and NCs are associated with multiple brain regions: the frontal lobe, occipital lobe, cingulate gyrus, hippocampus, and thalamus. Moreover, these brain regions corresponding to subnetworks are mainly distributed in the DMN, visual network, and subcortical network.
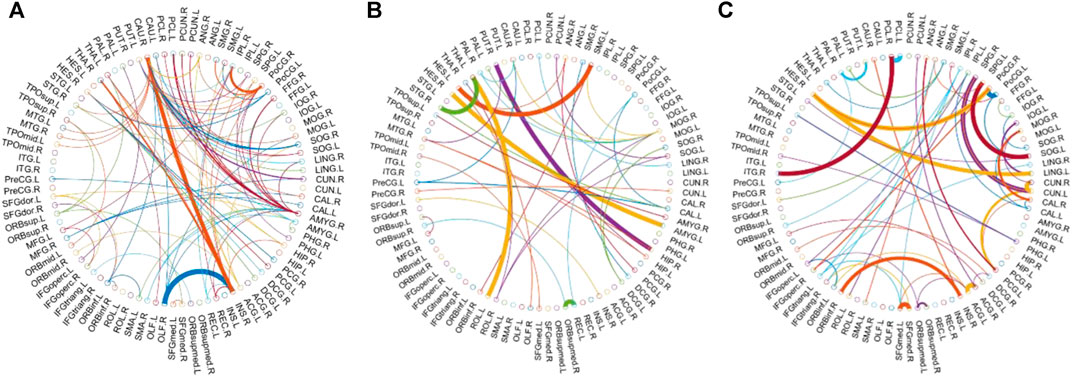
FIGURE 5. Consensus connections obtained by the (A) PC, (B) GCM and (C) SR methods.
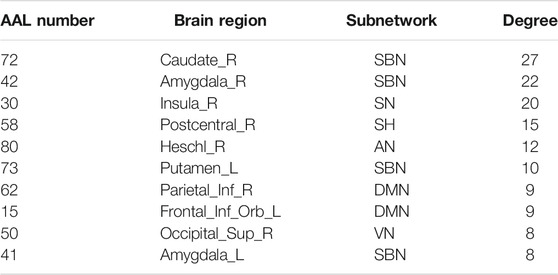
TABLE 6. Top-10 brain regions corresponding to consensus degree based on the PC methods.
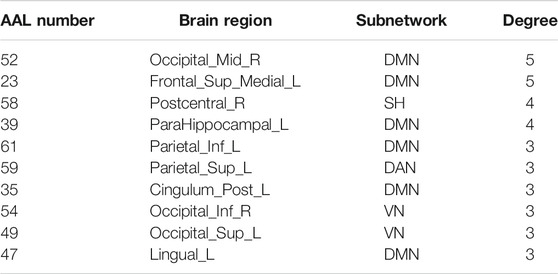
TABLE 7. Top-10 brain regions corresponding to consensus degree based on the SR method.
TABLE 8. Top-10 brain regions corresponding to consensus connections based on the GCM method.
Discussion
Classification With Different Network Estimation Methods
From the classification results in Table 1, the SR method exhibited the highest accuracy compared to the PC and GCM methods. Although the PC method obtained more consensus connections, GCM considered more graph theory information with directions, SR achieves the best results in the single-pattern methods. These results indicated that the SR approach can effectively overcome the limitations of the PC approach. Moreover, the MCPC achieved a much better performance than the results which only utilize the single connection patterns, indicating that the proposed MCPC approach can significantly improve the diagnosis performance of MCI. Notably, different connection patterns can provide different discriminative information for diagnosis. In addition, the MCPC method outperforms the results which only considers two patterns; this result further confirms the superiority of the proposed method. Overall, as was mentioned in previous studies (Xu et al., 2020a; Xu et al., 2020b), multiple connection patterns can be combined with an MK-SVM to effectively consider the weights of different information types and differentiate MCI patients from NCs.
The Distribution of Discriminative Features
The hub nodes of the consensus connections obtained from the three different BC estimation methods (PC, SR and GCM) are given in Tables 6-8. It can be significantly found that the most discriminative brain regions and functional connections between the MCI and NC groups were mainly distributed in the temporal, frontal and parietal lobes, which correspond to the DMN, FTC, VN, and AN. Previous studies have verified that these subnetworks correspond to various cognitive functions, such as attention, execution, and spatial positioning (Rolle et al., 2017; Bi et al., 2018). Our results suggest that patients with MCI may have altered subnetworks and corresponding cognitive functions. In particular, the DMN exhibited the most significant discriminative ability, which was consistent with previous studies of brain connections involving MCI and NC groups (Gao et al., 2020). In fact, the DMN has always been regarded as the key role for cognitive function (Anticevic et al., 2012; Liu et al., 2019). In addition, we found abnormalities in the subcortical network involving the thalamus, putamen, and amygdala in MCI. In recent years, several studies have indicated that the individuals in the early stages of AD, including subjective cognitive decline and MCI, exhibit abnormalities in subcutaneous nuclei, e.g., basal forebrain, basal ganglia, and thalamus (Fernández-Cabello et al., 2020; Xu et al., 2021). In a follow-up study, we intend to use a more detailed brain atlas than that used in this study to further explore subcortical nuclei in the early stage of AD.
Conclusion
In this paper, we attempt to improve the performance of MCI identification by single-mode data by generating multi-view information. Specifically, we utilized the information associated with multiple brain connection patterns, which are derived from the fMRI data. The MKSVM is selected to identify the MCI from the NCs as a naive attempt, which successfully combines the information from the multiple brain connection patterns. The experimental results reveal that the MCPC strategy can significantly improve the diagnosis performance than the single pattern. Further analysis of the hub nodes and consensus connections among brain connections emphasize the importance of the DMN in the pathological mechanism associated with the early stage of AD.
Data Availability Statement
The original contributions presented in the study are included in the article/Supplementary Material, further inquiries can be directed to the corresponding authors.
Authors Contributions
XX and WL drafted the intial manuscript. LP and XG collected and pre-processed the funcitonal MRI data. ZW and XX designed experiments and analyzed the final results. XG and PJW revised the manuscript.
Funding
This work was partially supported by the Key research and development program of Hainan province (ZDYF2021GXJS017); The Fundamental Research Funds for the Central Universities (22120190219); Natural Science Foundation of Hainan Province (620RC558); The National Natural Science Foundation of China (81830059, 82102023, 81771889, 82160345); The Clinical Research Plan of SHDC (No. SHDC2020CR1038B); Science and Technology Commission of Shanghai Municipality (No. 19411951400); Shanghai Municipal Commission of Health and Family Planning Science and Research Subjects (201740010,202140464) and Scientific Research Subjects of Shanghai Universal Medical Imaging Technology Limited Company (UV 2020Z02, UV 2021Z01).
Conflict of Interest
The authors declare that the research was conducted in the absence of any commercial or financial relationships that could be construed as a potential conflict of interest.
Publisher’s Note
All claims expressed in this article are solely those of the authors and do not necessarily represent those of their affiliated organizations, or those of the publisher, the editors and the reviewers. Any product that may be evaluated in this article, or claim that may be made by its manufacturer, is not guaranteed or endorsed by the publisher.
Footnotes
2http://www.fil.ion.ucl.ac.uk.spm.
3For the convenience of comparison among PC and SR methods, all the weights are normalized to the interval [−1, 1].
References
Abós, A., Baggio, H. C., Segura, B., García-Díaz, A. I., Compta, Y., Martí, M. J., et al. (2017). Discriminating Cognitive Status in Parkinson's Disease through Functional Connectomics and Machine Learning. Sci. Rep. 7 (1), 1–13. doi:10.1038/srep45347
Anticevic, A., Cole, M. W., Murray, J. D., Corlett, P. R., Wang, X.-J., and Krystal, J. H. (2012). The Role of Default Network Deactivation in Cognition and Disease. Trends Cognitive Sciences 16, 584–592. doi:10.1016/j.tics.2012.10.008
Bi, X.-A., Sun, Q., Zhao, J., Xu, Q., and Wang, L. (2018). Non-linear ICA Analysis of Resting-State fMRI in Mild Cognitive Impairment. Front. Neurosci. 12, 413. doi:10.3389/fnins.2018.00413
Chen, G., Shu, H., Chen, G., Ward, B. D., Antuono, P. G., Zhang, Z., et al. (2016). Staging Alzheimer's Disease Risk by Sequencing Brain Function and Structure, Cerebrospinal Fluid, and Cognition Biomarkers. Jad 54, 983–993. doi:10.3233/jad-160537
Delong, E. R., Delong, D. M., and Clarke-Pearson, D. L. (1988). Comparing the Areas under Two or More Correlated Receiver Operating Characteristic Curves: a Nonparametric Approach. Biometrics 44, 837–845. doi:10.2307/2531595
Fernández-Cabello, S., Kronbichler, M., VAN Dijk, K. R. A., Goodman, J. A., Spreng, R. N., Schmitz, T. W., et al. (2020). Basal Forebrain Volume Reliably Predicts the Cortical Spread of Alzheimer's Degeneration. Brain 143, 993–1009. doi:10.1093/brain/awaa012
Gaugler, J., James, B., Johnson, T., Scholz, K., and Weuve, J. (2016). 2016 Alzheimer's Disease Facts and Figures. Alzheimers Dement 12, 459–509. doi:10.1016/j.jalz.2016.03.001
Goebel, R., Roebroeck, A., Kim, D.-S., and Formisano, E. (2003). Investigating Directed Cortical Interactions in Time-Resolved fMRI Data Using Vector Autoregressive Modeling and Granger Causality Mapping. Magn. Reson. Imaging 21, 1251–1261. doi:10.1016/j.mri.2003.08.026
Gao, X., Xu, X., Hua, X., Wang, P., Li, W., and Li, R. (2020). Group Similarity Constraint Functional Brain Network Estimation for Mild Cognitive Impairment Classification. Front. Neurosci. 14, 165. doi:10.3389/fnins.2020.00165
Huang, S., Li, J., Sun, L., Ye, J., Fleisher, A., Wu, T., et al. (2010). Learning Brain Connectivity of Alzheimer's Disease by Sparse Inverse Covariance Estimation. Neuroimage 50, 935–949. doi:10.1016/j.neuroimage.2009.12.120
Hyekyoung Lee, H., Dong Soo Lee, D. S., Hyejin Kang, H., Boong-Nyun Kim, B. N., and Chung, M. K. (2011). Sparse Brain Network Recovery under Compressed Sensing. IEEE Trans. Med. Imaging 30, 1154–1165. doi:10.1109/tmi.2011.2140380
Jack, C. R., Bernstein, M. A., Fox, N. C., Thompson, P., Alexander, G., Harvey, D., et al. (2010). The Alzheimer's Disease Neuroimaging Initiative (ADNI): MRI Methods. J. Magn. Reson. Imaging 27, 685–691. doi:10.1002/jmri.21049
Kevin, W., Doug, W., Matthias, S., and Gerhard, S. (2008). Correspondence of Visual Evoked Potentials with FMRI Signals in Human Visual Cortex. Brain Topogr 21, 86–92. doi:10.1007/s10548-008-0069-y
Liang, X., Vaughan, D. N., Connelly, A., and Calamante, F. (2018). A Novel Group-Fused Sparse Partial Correlation Method for Simultaneous Estimation of Functional Networks in Group Comparison Studies. Brain Topogr 31, 364–379. doi:10.1007/s10548-017-0615-6
Liao, W., Wu, G.-R., Xu, Q., Ji, G.-J., Zhang, Z., Zang, Y.-F., et al. (2014). DynamicBC: a MATLAB Toolbox for Dynamic Brain Connectome Analysis. Brain connectivity 4, 780–790. doi:10.1089/brain.2014.0253
Li, W., Xu, X., Jiang, W., Wang, P., and Gao, X. (2020c). Functional Connectivity Network Estimation with an Inter-similarity Prior for Mild Cognitive Impairment Classification. Aging (Albany NY) 12, 17328–17342. doi:10.18632/aging.103719
Li, W.-K., Chen, Y.-C., Gao, X., and Wang, X. (2020a). Functional Brain Network Estimation with Human-Guided Modularity Representation. IFAC-PapersOnLine 53, 786–791. doi:10.1016/j.ifacol.2021.04.173
Li, W., Geng, C., and Chen, S. (2020b). Leave Zero Out: Towards a No-Cross-Validation Approach for Model Selection. Available At: https://arxiv.org/abs/2012.13309.
Li, W., Qiao, L., Zhang, L., Wang, Z., and Shen, D. (2019). Functional Brain Network Estimation with Time Series Self-Scrubbing. IEEE J. Biomed. Health Inform. 23, 2494–2504. doi:10.1109/jbhi.2019.2893880
Li, W., Wang, Z., Zhang, L., Qiao, L., and Shen, D. (2017). Remodeling Pearson's Correlation for Functional Brain Network Estimation and Autism Spectrum Disorder Identification. Front. Neuroinform. 11, 55. doi:10.3389/fninf.2017.00055
Li, W., Zhang, L., Qiao, L., and Shen, D. (2020d). Toward a Better Estimation of Functional Brain Network for Mild Cognitive Impairment Identification: A Transfer Learning View. IEEE J. Biomed. Health Inform. 24, 1160–1168. doi:10.1109/jbhi.2019.2934230
Liu, C., Yen, C. C., Szczupak, D., Ye, F. Q., Leopold, D. A., and Silva, A. C. (2019). Anatomical and Functional Investigation of the Marmoset Default Mode Network. Nat. Commun. 10, 1975–1978. doi:10.1038/s41467-019-09813-7
Misra, C., Fan, Y., and Davatzikos, C. (2009). Baseline and Longitudinal Patterns of Brain Atrophy in MCI Patients, and Their Use in Prediction of Short-Term Conversion to AD: Results from ADNI☆. NeuroImage 44, 1415–1422. doi:10.1016/j.neuroimage.2008.10.031
Qiao, L., Zhang, H., Kim, M., Teng, S., Zhang, L., and Shen, D. (2016). Estimating Functional Brain Networks by Incorporating a Modularity Prior. Neuroimage 141, 399–407. doi:10.1016/j.neuroimage.2016.07.058
Rakotomamonjy, A., Bach, F., Canu, S., and Grandvalet, Y. (2007). More Efficiency in Multiple Kernel Learning. Proceedings of the 24th international conference on Machine learning, 20 June 2007, 775–782. doi:10.1145/1273496.1273594
Rolle, C. E., Anguera, J. A., Skinner, S. N., Voytek, B., and Gazzaley, A. (2017). Enhancing Spatial Attention and Working Memory in Younger and Older Adults. J. Cogn. Neurosci. 29, 1483–1497. doi:10.1162/jocn_a_01159
Stam, C. J. (2014). Modern Network Science of Neurological Disorders. Nat. Rev. Neurosci. 15, 683–695. doi:10.1038/nrn3801
Wee, C.-Y., Yap, P.-T., Zhang, D., Denny, K., Browndyke, J. N., Potter, G. G., et al. (2012). Identification of MCI Individuals Using Structural and Functional Connectivity Networks. Neuroimage 59, 2045–2056. doi:10.1016/j.neuroimage.2011.10.015
Xu, X., Li, W., Tao, M., Xie, Z., Gao, X., Yue, L., et al. (2020b). Effective and Accurate Diagnosis of Subjective Cognitive Decline Based on Functional Connection and Graph Theory View. Front. Neurosci. 14, 577887. doi:10.3389/fnins.2020.577887
Xu, X., Li, W., Mei, J., Tao, M., Wang, X., Zhao, Q., et al. (2020a). Feature Selection and Combination of Information in the Functional Brain Connectome for Discrimination of Mild Cognitive Impairment and Analyses of Altered Brain Patterns. Front. Aging Neurosci. 12, 28. doi:10.3389/fnagi.2020.00028
Xu, X., Wang, T., Li, W., Li, H., Xu, B., Zhang, M., et al. (2021). Morphological, Structural, and Functional Networks Highlight the Role of the Cortical-Subcortical Circuit in Individuals with Subjective Cognitive Decline. Front. Aging Neurosci. 13, 394. doi:10.3389/fnagi.2021.688113
Zhang, Y., Zhang, H., Chen, X., Liu, M., Zhu, X., Lee, S.-W., et al. (2019). Strength and Similarity Guided Group-Level Brain Functional Network Construction for MCI Diagnosis. Pattern Recognition 88, 421–430. doi:10.1016/j.patcog.2018.12.001
Zhou, Z., Chen, X., Zhang, Y., Hu, D., Qiao, L., Yu, R., et al. (2020). A Toolbox for Brain Network Construction and Classification (BrainNetClass). Hum. Brain Mapp. 41, 2808-2826. 10.1002/hbm.24979.
Keywords: functional connectivity, effective connectivity, multiview, multimodal, mild cognitive impairment
Citation: Li W, Xu X, Wang Z, Peng L, Wang P and Gao X (2021) Multiple Connection Pattern Combination From Single-Mode Data for Mild Cognitive Impairment Identification. Front. Cell Dev. Biol. 9:782727. doi: 10.3389/fcell.2021.782727
Received: 24 September 2021; Accepted: 29 October 2021;
Published: 22 November 2021.
Edited by:
Zhuqing Jiao, Changzhou University, ChinaReviewed by:
Mou-Xiong Zheng, Yueyang Hospital, Shanghai University of Traditional Chinese Medicine, ChinaXu-Yun Hua, Shanghai University of Traditional Chinese Medicine, China
Copyright © 2021 Li, Xu, Wang, Peng, Wang and Gao. This is an open-access article distributed under the terms of the Creative Commons Attribution License (CC BY). The use, distribution or reproduction in other forums is permitted, provided the original author(s) and the copyright owner(s) are credited and that the original publication in this journal is cited, in accordance with accepted academic practice. No use, distribution or reproduction is permitted which does not comply with these terms.
*Correspondence: Peijun Wang, dG9uZ2ppcGp3YW5nQHZpcC5zaW5hLmNvbQ==; Xin Gao, Z2FveGluQHV2Y2xpbmljLmNu
†These authors have contributed equally to this work.