 Judith Brock
 Marcel Hörning*
- Institute of Biomaterials and Biomolecular Systems, University of Stuttgart, Stuttgart, Germany
As a reliable alternative to animal testing in cardiovascular research, it is crucial to improve differentiation of immortalized cell lines. In this study, we focused on optimizing the differentiation efficiency of the H9c2 cell line into cardiomyocytes using a high-throughput, automated image processing approach. While previous studies used protocols involving retinoic acid to enhance cardiac differentiation, we applied a simplified medium composition that results in higher differentiation rates. Along that line, we differentiated H9c2 cells into cardiomyocytes, which not only showed sarcomere-characteristic striation but also periodic intracellular calcium signaling for the first time. As a second step, we examined the potential application of polyacrylamide hydrogels (
1 Introduction
Cardiovascular diseases have been the leading cause of death worldwide for decades. The necessity to find and improve methods of treatment and to conduct research in the field of cardiac regenerative medicine is thus immense. Typical functional cardiac diseases are hypertrophy, arrhythmias and cardiomyopathies (Ravi et al., 2021). Primary heart cells, particularly cardiomyocytes, are often used to gain knowledge about fundamental heart conditions (Nakayama et al., 2007; Giguère et al., 2018; Hörning et al., 2012). As alternative cell systems, biomedical studies regularly investigate embryonic stem cells (ESCs) and induced pluripotent stem cells (iPSCs), which can differentiate into distinct cell types including cardiac cells (Boheler et al., 2002; Ohno et al., 2013; Narazaki et al., 2008). While both primary and stem cells exhibit similar morphology and behavior as in-vivo cells, they also have downsides like ethical concerns, tumor formation, or high expenses (Peter et al., 2016; Nori et al., 2015). Therefore, immortalized cardiac cell lines, such as HL-1, AC16, or H9c2, still serve as essential tools in research (White et al., 2004; Davidson et al., 2005; Kimes and Brandt, 1976).
H9c2 cells were originally isolated from embryonic rat ventricular tissue and are of special interest because they can differentiate into both skeletal and cardiac muscle cells (Kimes and Brandt, 1976; Ménard et al., 1999; Branco et al., 2015). The differentiation into cardiomyocytes is triggered by the addition of retinoic acid to medium with a low serum concentration. So far, this cell line has been used to investigate cardiotoxicity (Daubney et al., 2015; Witek et al., 2016), cardiac hypertrophy, (Watkins et al., 2011; Xu et al., 2020), oxidative stress (Pesant et al., 2006), and calcium channels (Ménard et al., 1999; Hescheler et al., 1991). However, even though these cells express cardiogenic markers like alpha actinin, myosin light chain 2, and cardiac Troponin T, they lack the formation of sarcomeric structures and do not show contractility (Suhaeri et al., 2015). Additionally, differentiation of these cells is complex, and the H9c2 cell line might even resist differentiation, as previously suggested (Patten et al., 2017). Finding supplementary or optimized ways for differentiation is therefore necessary to use this cell line more reliably as a model for cardiomyocytes and to potentially learn more about heart diseases.
For the optimization of H9c2 differentiation the extracellular matrix (ECM) is one starting point, which has not been sufficiently investigated. However, numerous studies have identified the crucial influence between cellular dynamics and the properties of the ECM (Lukashev and Werb, 1998; Reilly and Engler 2010; Chaudhuri et al., 2020). The ECM serves as a three-dimensional scaffold which initiates mechanical and biochemical cues cells need during adhesion, proliferation, migration, and differentiation (Frantz et al., 2010; Lukashev and Werb, 1998; Chaudhuri et al., 2020). During all of these cellular dynamics an interplay between matrix properties, i.e., elasticity, topography, and several proteins, takes place. Regarding cell differentiation, the rigidity of the ECM guides the cells, evoking a higher differentiation efficiency on substrates with tissue-like stiffness (Engler et al., 2004). Mesenchymal stem cells, for example, differentiate into varying cell types in connection to the stiffness of the substrate. On soft hydrogels they form neurons, on hydrogels with medium rigidity, they transform to myocytes and on hard substrates to osteocytes (Smith et al., 2018; Engler et al., 2006). As cells are sensitive to their surroundings, they can likewise detect the topography of the ECM and are able to orient and align themselves in accordance to micro and nanostructures like patterns, pillars, grooves, and channels (Hume et al., 2012; Connon and Gouveia, 2021; Yamamoto et al., 2008). These topographical structures can be applied either by roughening the surface of the substrate or by applying a predesigned pattern and aim to mimic the natural environment cells rely on during differentiation (Cui et al., 2021). In this connection, an advanced myogenic maturation and sarcomere formation compared to control cells plated on unpatterned gels has been exemplified for myoblasts plated on micro patterned hydrogels (Denes et al., 2019; Bettadapur et al., 2016; Engler et al., 2004). Similarly, the presence of fibrous ECM proteins, like laminin, elastin, collagen, and fibronectin, plays a vital role in differentiation by enhancing the amount of cells that turn into a desired cell type and by affecting the switch between proliferation and differentiation (García et al., 1999; Li et al., 2024). C2C12 cells, for instance, display a relation between the fibronectin concentration and the amount of myogenic differentiation markers (Salmerón-Sánchez et al., 2011) and adhesion area (Brock et al., 2022).
The aim of this study is to improve H9c2 differentiation efficiency. For that we first investigated cells on glass focusing on the culture conditions, such as medium exchange and composition, to ensure the comparability to former studies. Applying high-throughput, automated image processing analysis, we found that normal growth medium with 10% FBS led to the highest amount of cells that differentiated into cardiomyocytes after 2 weeks. In contrast, medium with different RA concentration failed to induce differentiation in a similar manner. The cardiac phenotype was confirmed by an independent test using of the cardiac Troponin T marker. Additionally, we observed muscle-characteristic striation with the sarcomeric alpha actinin marker, and an intracelluar calcium response to extracellular, electrical stimulation. Using the best culture conditions found on glass substrates, we further examined influence of polyacrylamide hydrogels (
2 Materials and methods
2.1 Glass preparation
Round and square-shaped glass cover slips (
2.2 Hydrogel preparation
For the polyacrylamide hydrogels, a 2% bisacrylamide solution (bAAm, Carl Roth, 3,039.2) was added to a 40% acrylamide solution (AAm, Carl Roth, 7,748.1) in distilled water at a crosslinker ratio of 2%. The polymerization of this solution was initiated by 10% ammonium persulfate (APS, Sigma, A3678) and N,N,N,N-tetramethyl ethylenediamine (TEMED, Carl Roth, 2,367.3). For the plane hydrogels, 20 µL of this polymerizing solution was then sandwiched between a vinyl-silanized glass cover slip (
2.3 Mechanical testing
The E-modulus of the hydrogels were measured by nanoindentation using an atomic force microscope (AFM, NanoWizard, JPK Instruments, Berlin, Germany). A silicon nitride cantilever with an attached spherical colloidal probe (CP-PNP-BSG; 0.08 N/m; R = 5 μm, Olympus Optical) was used. The spring constant of the cantilevers was obtained through thermal noise measurements. The indentation curves were measured with an approach speed of 1 μm/s. The data were analyzed using nonlinear least-squares fitting to the Hertz model (Sneddon, 1965; Domke and Radmacher, 1998) with a customized (MATLAB, 2023) routine. Statistical significance was ensured by the quantification of the Young’s modulus E at 50 independent indentation sites in two
2.4 Surface functionalization
The hydrogels were functionalized by 3,4-Dihydroxy-L-phenylalanine (L-DOPA, Sigma-Aldrich, D9628) Brock et al. (2022). Briefly, L-DOPA was dissolved in freshly prepared TRIS buffer (10 mM, pH 10, Roth 4,855.2) at a concentration of 2 mg/mL for 30 min in the dark on a tube roller and sterilized through a 0.2 µm filter (Filtropur S0.2, Sarstedt 83.1826.001). Followed by a washing with TRIS buffer, 250 µL of this solution was added onto each hydrogel and incubated for 30 min in the dark at RT. To remove unbound L-DOPA, the samples were washed twice with PBS and finally incubated with human plasma fibronectin (Sigma, F2006) at different concentrations for at least 2 h at 37°C.
2.5 Cell culture
Rat cardiomyoblasts (H9c2 (2–1),
2.6 Cardiomyocyte isolation
The primary heart tissues were prepared following a method described in (Hörning et al., 2017b; Hörning et al., 2012; Erhardt et al., 2024). Briefly, hearts of 1-3-day-old Wistar rats were isolated and consecutively cleaned, minced, and enzymatically digested in five cycles using collagenase type I (Gibco, 17100017). The isolated cells from the last four cycles were pre-plated for 1 h in plastic dishes to reduce the fraction of fibroblasts. Cells were plated at a density of
2.7 Fluorescence staining
Cells were washed with PBS and fixed with 4% formaldehyde in PBS (Thermo Scientific Chemicals, J60401.AK) for 10–20 min at RT. For F-actin staining, cells were then washed 3 times with 0.1% Tween 20 (Carl Roth, 9,127.1) in PBS for 10 min each, labeled with rhodamine phalloidin (0.25 U/mL in methanol, Alexa fluor 546, Invitrogen, A22283) and DAPI (1 μg/mL in PBST, Sigma D9542) for 1 h at RT in the dark, subsequently washed 3 times with 0.1% PBST for 10 min, and covered with ProLong Gold antifade reagent (Invitrogen, P10144) until observation. For antibody staining, after fixation, the samples were blocked with 400 µL 0.1% BSA (Sigma Aldrich, A9418) in 0.1% Saponin (Sigma, S1252) for 30 min, then incubated with 200 μL mouse monoclonal anti-sarcomeric alpha actinin (1:200; Invitrogen, MA1-22863) or cardiac troponin T monoclonal antibody (1:200; Invitrogen, MA5-12960) in 0.1% BSA in 0.1% Saponin for 1 h at RT, followed by 200 µL secondary antibody, Alexa Fluor 488 goat anti-mouse IgG (1:200; Invitrogen, A11001), rhodamine phalloidin, and DAPI in 0.1% BSA in 0.1% Saponin for 1 h at RT. ProLong Gold antifade reagent (Invitrogen, P10144) was used to preserve the samples until observation.
2.8 Image acquisition of fluorescent cells
Fluorescence was observed by an AxioObserver SD confocal microscope (Carl Zeiss Microscopy GmbH Jena, Germany) equipped with a Yokogawa CSU-X1 spinning disk unit at
2.9 Observation of calcium transients
For the observation of calcium transients, the differentiated H9c2 cells were incubated with 200 µL of the fluorescence dye Fluo8 (8.3 µM in PBS, AAT Bioquest) at room temperature (RT) in the dark for 30–60 min. Then, the observation was conducted at RT in Tyrode’s solution (136.9 mM NaCl, 1 mM MgCl2, 2.7 mM KCl, 1.8 mM CaCl2, 0.4 mM NaH2PO4 and 5.5 mM glucose (Sigma-Aldrich, T2145)) with additional 2.7 mM KCl (final concentration of 5.4 mM) and 5 mM HEPES (Roth, 9,105.2). The pH level was adjusted to 7.4 using NaOH. The calcium transients were observed by a customized microscope setup (ThorLabs) equipped with a Kinetix sCMOS high-speed camera (Photometrics, 140 FPS and
2.10 Actin quantification analysis (AQuA)
The quantification of actin filaments in muscle cells using AQuA has been described before using customized routines in MATLAB (2023) (Zemel et al., 2010; Inoue et al., 2015; Hörning et al., 2017a; Erben et al., 2020; Brock et al., 2022). Briefly, the Laplacian filter
and
Thereafter, from Equation 2
2.11 Calcium transient analysis
The recorded movies were pre-processed by background subtraction, averaged in time (10 frames), and filtered in space with Gaussian blur (10 px) using a customized macro in ImageJ (1.54f) (Loppini et al., 2022; Erhardt et al., 2024). Further analysis was performed using customized routines in MATLAB (2023). The calcium transients were analyzed at a normalized calcium intensity of 50% of each individual wave to obtain the individual calcium transient duration (CTD) and calcium transient intervals (CTI). From the CTDs and CTIs, the mean values and standard deviation was calculated for each calcium transient.
The normalized calcium transients were calculated by the improved signal oversampling analysis (Erhardt et al., 2024). The periodic signals were pixelwise-stacked by equidistant time intervals, and the CTD was computed from the stacked period-2 calcium transient, as
where
2.12 Fourier transformation imaging (FFI)
FFI was applied to the raw unprocessed fluorescence recordings, as introduced before (Hörning et al., 2017a; Loppini et al., 2022; Erhardt et al., 2024). Briefly, the images were decomposed pixelwise and transformed to the mathematically complex Fourier space,
3 Results
The H9c2 rat cardiomyoblast cell line presents a special challenge for differentiation since it can form both cardiac and skeletal muscle cells. In this connection, several studies described that both a reduction of fetal bovine serum (FBS) to 1% and supplementation with retinoic acid (RA) is necessary to obtain cardiomyocytes instead of skeletal muscle cells (Ménard et al., 1999; Branco et al., 2012; Pereira et al., 2011). However, the added RA concentrations range anywhere between 10 and 1000 nM, and the frequency of medium and RA exchange varies from study to study (Ménard et al., 1999; Pereira et al., 2011; Suhaeri et al., 2015; Campero-Basaldua et al., 2023). Therefore, it is still unclear which condition leads to the optimal differentiation output.
3.1 Optimal differentiation condition
In order to identify the optimal differentiation condition, six differentiation medium compositions were tested and statistically analyzed (Figures 1A–G). For all conditions, cells were plated at the same density on glass substrates and left to reach confluence in DMEM containing 10% FBS for 3 days to ensure comparability. After this point of time, which was defined as
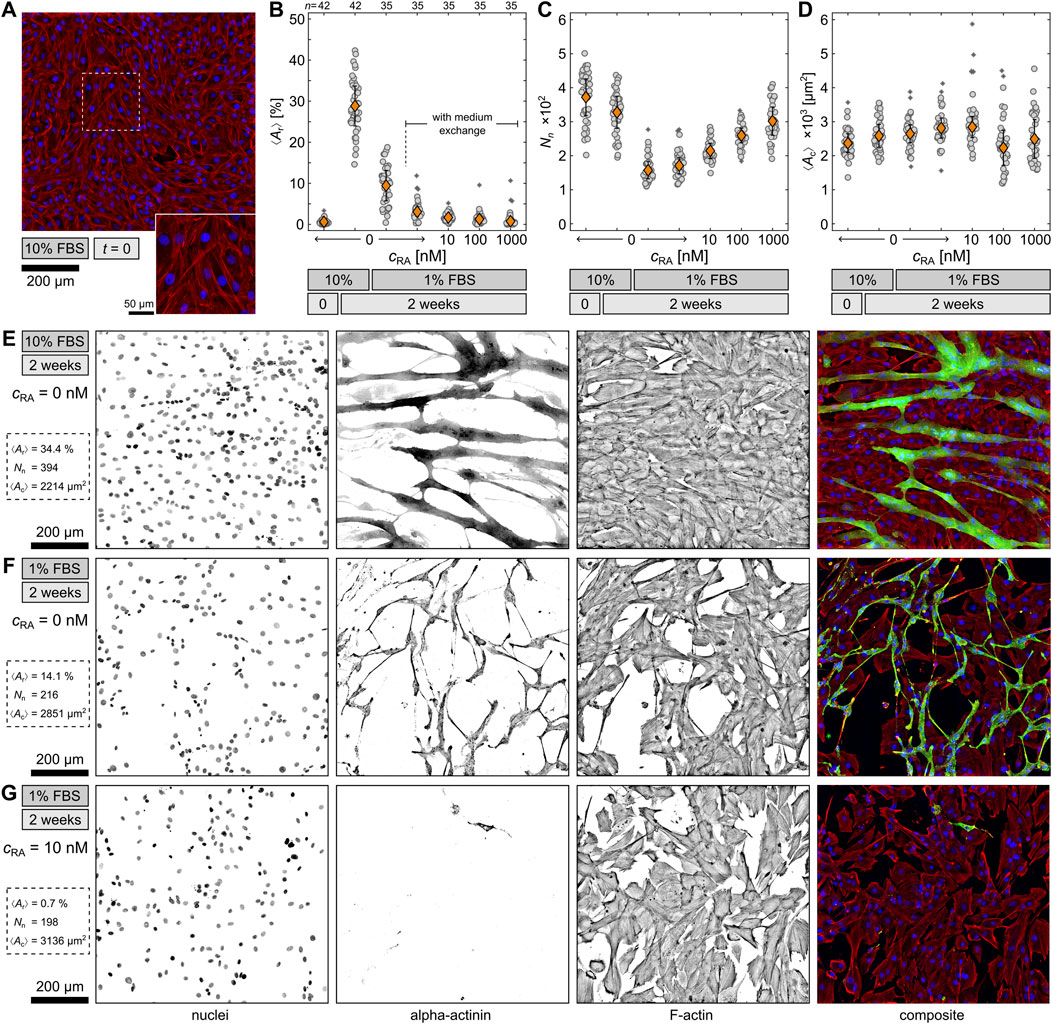
Figure 1. Comparison of differentiation conditions. (A) Example of undifferentiated H9c2 cells at
For the comparison of the conditions, cells were fluorescence stained and observed on large
Nevertheless, an opposite trend for the RA conditions is observed for the total number of nuclei
To illustrate the above-mentioned results further, Figures 1E–G feature three typical examples of fluorescence-stained H9c2 cells after 2 weeks under the 10% FBS, 1% FBS, and 1% FBS with 10 nM RA conditions. The nuclei and F-actin channels demonstrate the difference in
3.2 Phenotype determination
As indicated above, the influence of both differentiation conditions, i.e. 10% and 1% FBS, without RA and medium exchange was examined to determine whether the cells are cardiac or skeletal myocytes. In addition to αA, the cells were fluorescence stained with a cardiac Troponin T (cTT) antibody to distinguish heart and skeletal muscle cells. The cTT is highly specific for cardiac cells and only reacts with differentiated myocytes but not with undifferentiated myoblasts. Therefore, it also serves as an additional differentiation marker. Figure 2A compares
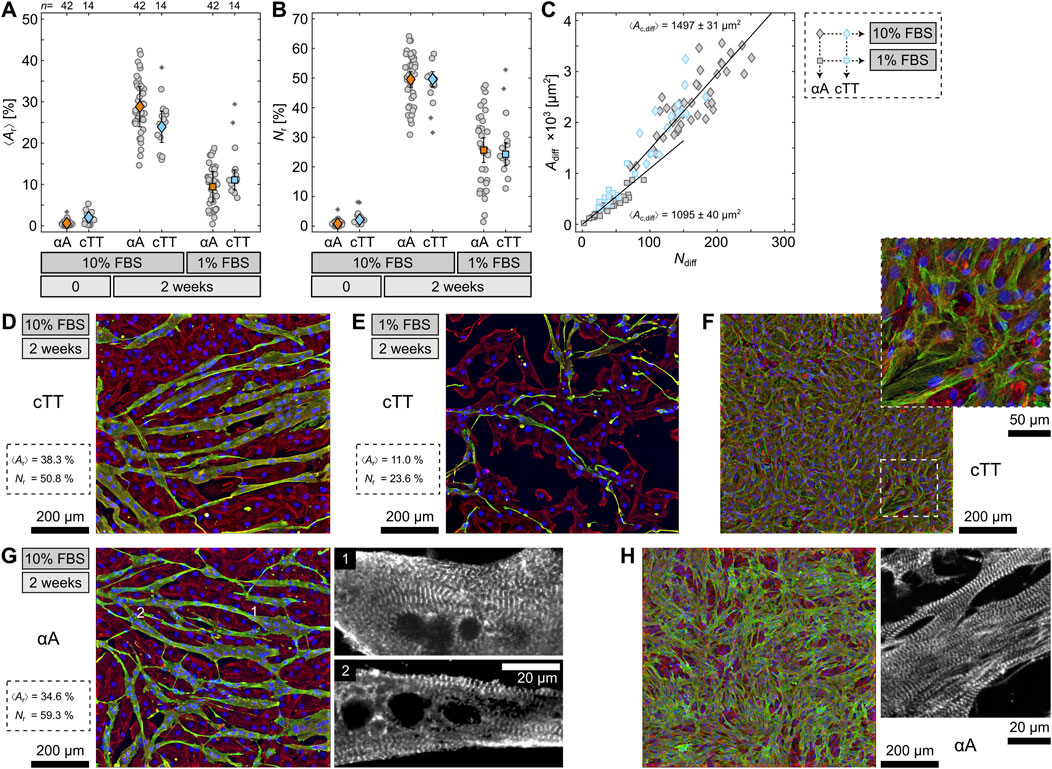
Figure 2. Quantification of sarcomeric alpha actinin (αA) and cardiac Troponin T (cTT) in differentiated H9c2 cells. (A, B) Comparison of the area
Additionally, differentiation with 10% FBS not only increases the differentiation rate as quantified by
Another relation to primary cells appears when examining the differentiated 10% FBS cells more closely. Some cells developed sarcomere-characteristic striation (Figure 2G). While the striation is hard to detect in the orthogonally projected images, it can be seen clearer when going through the individual focal heights (see enlargements in Figure 2G). This finding strongly contradicts preceding studies which could not identify striation and even implied that differentiated H9c2 cells lack striation altogether (Suhaeri et al., 2015). In contrast to those studies, we used a differentiation condition that has not been considered before but led to a significantly improved differentiation. Comparing the 10% FBS cells with primary cardiomyocytes as regards αA again reveals strong likeness between the two (Figure 2H). This even implies that differentiated H9c2 cells might be functioning cardiomyocytes.
3.3 Cardiac cell dynamics
Due to the similarity of differentiated H9c2 cells to primary cardiomyocytes, the 10% and 1% FBS cells were examined for their calcium response, since it is part of the regulation of various functions such as contractility, hypertrophy, and gene expression (Aronsen et al., 2016). The differentiated cells were stained with the fluorescent dye Fluo-8 and stimulated by an electric field of about 10 V/cm to investigate the free intracellular Ca2+ concentration (Figure 3A). The monophasic stimulation applied by an stimulation duration
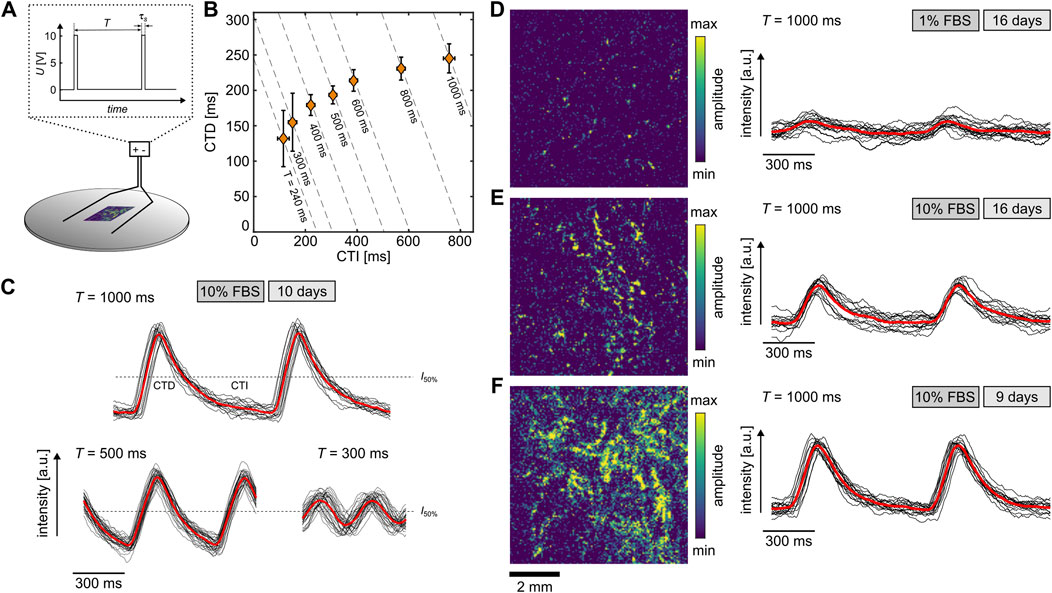
Figure 3. Calcium transients of differentiated H9c2 cells. (A) Scheme of experimental setup. The electric field of 10 V/cm is applied with a monophasic stimulation period
For the 1% FBS condition, no wave conduction was detected either, and the calcium transients exhibited weaker signals, i.e., lower signal-to-noise ratio. Figure 3D illustrates such an example along with a normalized amplitude of a
3.4 Optimal extracellular matrix condition
As glass does not represent the optimal extracellular matrix (ECM) condition for muscle cells, artificial ECMs, such as hydrogels, were used in the past. They better mimic natural ECM conditions (Hörning et al., 2012; Engler et al., 2006; Engler et al., 2004; Brock et al., 2022) and influence differentiation (Engler et al., 2004; Smith et al., 2018; Denes et al., 2019). In order to identify the optimal ECM condition for H9c2 cells, the response of single cells to polyacrylamide hydrogels with an E-modulus of
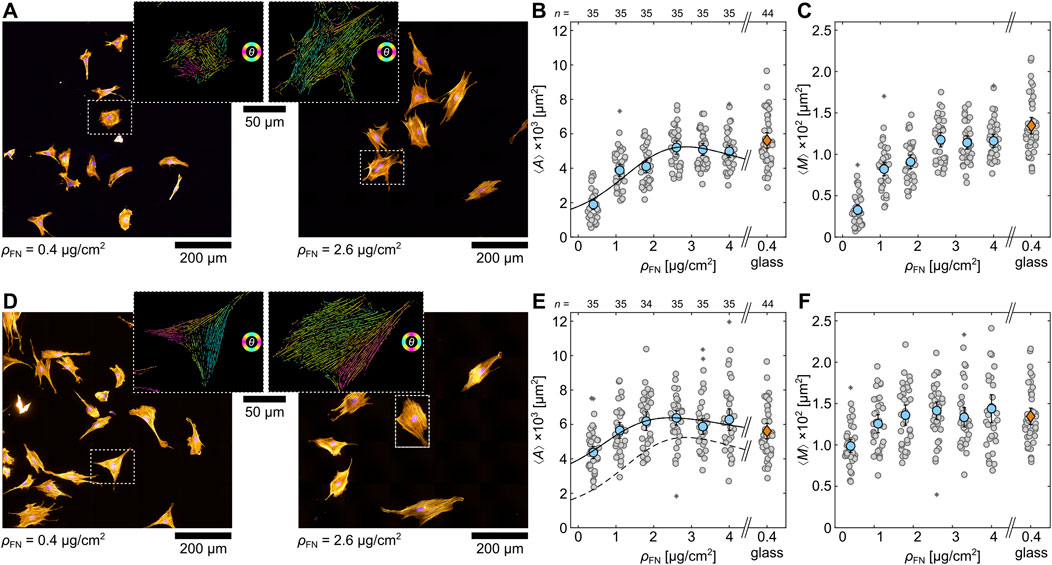
Figure 4. Single H9c2 cells on soft hydrogels coated with different fibronectin densities
To compare the morphological cell response, the mean projected cell area
where
Since plane substrates do not promote the formation of confluent tissue, hydrogels (
3.5 Differentiation on soft hydrogels
For the investigation of the differentiation dynamics of H9c2 cells on hydrogels, the optimum ECM condition, i.e., roughened hydrogel with
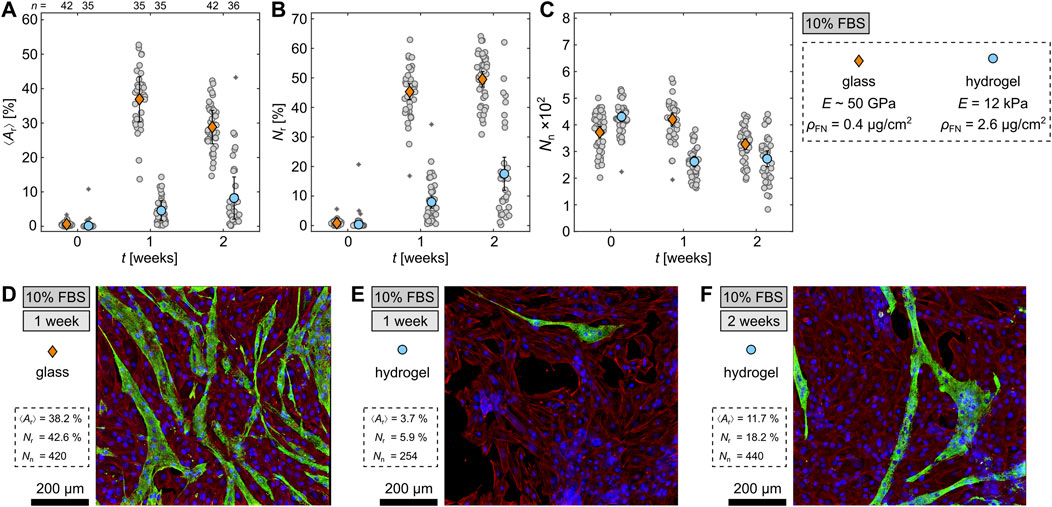
Figure 5. Differentiation of H9c2 cells on hydrogels. (A–C) Comparison of differentiated cells on glass and hydrogel with
Regarding the total nuclei number
To visually illustrate the difference between the differentiation ratios on glass and hydrogels, Figures 5D–F show fluorescence-stained cells after 1 week on glass (Figure 5D) and hydrogel (Figure 5E), as well as, after 2 weeks on hydrogel (Figure 5F). There are fewer differentiated cells on both hydrogels compared to glass and also some holes between the cells on the hydrogels which matches the lower
4 Conclusion
Based on the statistical analysis, we showed that H9c2 cells differentiate most efficiently when left in 10% FBS medium for 1 week, whereas, sarcomeric striation was detected only after 2 weeks. Unlike other studies that propose serum reduction and addition of retinoic acid for successful differentiation, this study indicates the use of the 10% FBS medium composition to be advantageous. It is also easier to apply, reduces workload and is more cost-efficient since no medium change or supplements are necessary. Moreover, all cells that differentiated in only 10% and 1% FBS medium were positive for the cardiac Troponin T marker indicating differentiation to cardiac cells without the addition of RA, which again stands in contrast with results of previous studies (Ménard et al., 1999; Branco et al., 2015; Pereira et al., 2011). RA even seemed to inhibit cell differentiation, resulting in a significantly lower differentiation ratio for the three tested RA concentrations. This matches the results of another study with human myoblast cells that found an inhibition of RA on the expression of muscle differentiation markers such as Troponin T or myogenin, as well as, an upkeep of myoblast cells in an undifferentiated state (El Hadad et al., 2017). Similarly, another study recently discovered that differentiation of H9c2 cells into the cardiac phenotype is rather influenced by differentiation time than by addition of RA (Campero-Basaldua et al., 2023). In this connection, it should be noted that the passage number is also relevant for successful differentiation. For passages larger than 15, we observed that fewer cells appear morphologically differentiated, i.e., no elongated form and fewer cells with multiple nuclei. This might account for some studies, e.g., Patten et al. (2017), being unsuccessful in differentiation.
While other studies could not detect striation in the myocytes or even claimed that the H9c2 cell line does not exhibit striation (Suhaeri et al., 2015), the formation of striated myocytes for the 10% FBS condition was demonstrated in this study. It seems that a high serum level influences differentiation positively and provides the cells with nutrients or other factors that are necessary for striated muscle formation. As we identified striation in the differentiated cells, we tested the calcium response of differentiated H9c2 cells and demonstrated that these cells exhibit calcium dynamics similar to primary heart cells. This strongly suggests that the differentiated cells are functional heart cells. However, more investigation is necessary on this feature. Further cardiac characteristics could be examined, for instance, the membrane potential and contractility. Nonetheless, this result supports previous studies that found functional similarities to cardiac cells, such as the expression of cardiac-typical L-type calcium channels (Ménard et al., 1999; Hescheler et al., 1991) and cardiac-like responses to stimuli that cause hypertrophy (Watkins et al., 2011).
Finally, the use of hydrogels, that were expected to provide the cells with a more natural extracellular matrix, did not improve cell differentiation. One reason might be that the proliferation and differentiation dynamics are stronger than the adhesion forces and consequently lead to cell clustering and detachment. Nevertheless, we demonstrated that not only single C2C12 myoblasts (Brock et al., 2022) but also single H9c2 myoblasts prefer a fibronectin density of 2.6 μg/cm2. For confluent, proliferating cells, however, plane and even surface roughened hydrogels are not sufficient to maintain differentiating cell cultures. Thus, more sophisticated cell platforms are necessary. Promising approaches are 3D printed and generated surfaces that provide stronger adhesion properties, as exemplified before (Erben et al., 2020; Mei et al., 2019; Shabankhah et al., 2024).
Data availability statement
The raw data supporting the conclusions of this article will be made available by the authors, without undue reservation.
Author contributions
JB: Data curation, Investigation, Methodology, Writing–original draft, Writing–review and editing. MH: Conceptualization, Data curation, Formal Analysis, Methodology, Project administration, Software, Supervision, Visualization, Writing–original draft, Writing–review and editing.
Funding
The author(s) declare that no financial support was received for the research, authorship, and/or publication of this article.
Acknowledgments
We would like to thank Julia Erhardt, Theresa Kühn, and Nadine Oder for the insightful discussions. Our thanks also go to Joachim Spatz and Cornelia Miksch for providing access to the Atomic Force Microscope (AFM) at the Max Planck Institute for Intelligent Systems, Stuttgart, Germany. We are also grateful to Stephan Eisler and Melanie Noack for their support and assistance with microscopic imaging at the Stuttgart Research Center of Systems Biology (SRCSB), University of Stuttgart.
Conflict of interest
The authors declare that the research was conducted in the absence of any commercial or financial relationships that could be construed as a potential conflict of interest.
Generative AI statement
The author(s) declare that no Generative AI was used in the creation of this manuscript.
Publisher’s note
All claims expressed in this article are solely those of the authors and do not necessarily represent those of their affiliated organizations, or those of the publisher, the editors and the reviewers. Any product that may be evaluated in this article, or claim that may be made by its manufacturer, is not guaranteed or endorsed by the publisher.
Supplementary material
The Supplementary Material for this article can be found online at: https://www.frontiersin.org/journals/cell-and-developmental-biology/articles/10.3389/fcell.2024.1501540/full#supplementary-material
References
Aronsen, J. M., Louch, W. E., and Sjaastad, I. (2016). Cardiomyocyte Ca2+ dynamics: clinical perspectives. Scand. Cardiovasc. J. SCJ 50, 65–77. doi:10.3109/14017431.2015.1136079
Bettadapur, A., Suh, G. C., Geisse, N. A., Wang, E. R., Hua, C., Huber, H. A., et al. (2016). Prolonged culture of aligned skeletal myotubes on micromolded gelatin hydrogels. Sci. Rep. 6, 28855. doi:10.1038/srep28855
Boheler, K. R., Czyz, J., Tweedie, D., Yang, H.-T., Anisimov, S. V., and Wobus, A. M. (2002). Differentiation of pluripotent embryonic stem cells into cardiomyocytes. Circulation Res. 91, 189–201. doi:10.1161/01.RES.0000027865.61704.32
Branco, A. F., Pereira, S. P., Gonzalez, S., Gusev, O., Rizvanov, A. A., and Oliveira, P. J. (2015). Gene expression profiling of H9c2 myoblast differentiation towards a cardiac-like phenotype. PLoS ONE 10, e0129303. doi:10.1371/journal.pone.0129303
Branco, A. F., Sampaio, S. F., Moreira, A. C., Holy, J., Wallace, K. B., Baldeiras, I., et al. (2012). Differentiation-Dependent doxorubicin toxicity on H9c2 cardiomyoblasts. Cardiovasc. Toxicol. 12, 326–340. doi:10.1007/s12012-012-9177-8
Brock, J., Erhardt, J., Eisler, S. A., and Hörning, M. (2022). Optimization of mechanosensitive cross-talk between matrix stiffness and protein density: independent matrix properties regulate spreading dynamics of myocytes. Cells 11, 2122. doi:10.3390/cells11132122
Campero-Basaldua, C., Herrera-Gamboa, J., Bernal-Ramírez, J., Lopez-Moran, S., Luévano-Martínez, L.-A., Alves-Figueiredo, H., et al. (2023). The retinoic acid response is a minor component of the cardiac phenotype in H9c2 myoblast differentiation. BMC Genomics 24, 431. doi:10.1186/s12864-023-09512-0
Chaudhuri, O., Cooper-White, J., Janmey, P. A., Mooney, D. J., and Shenoy, V. B. (2020). Effects of extracellular matrix viscoelasticity on cellular behaviour. Nature 584, 535–546. doi:10.1038/s41586-020-2612-2
Connon, C. J., and Gouveia, R. M. (2021). Milliscale substrate curvature promotes myoblast self-organization and differentiation. Adv. Biol. 5, 2000280. doi:10.1002/adbi.202000280
Cui, L., Yao, Y., and Yim, E. K. F. (2021). The effects of surface topography modification on hydrogel properties. Apl. Bioeng. 5, 031509. doi:10.1063/5.0046076
Daubney, J., Bonner, P. L., Hargreaves, A. J., and Dickenson, J. M. (2015). Cardioprotective and cardiotoxic effects of quercetin and two of its in vivo metabolites on differentiated H9c2 cardiomyocytes. Basic and Clin. Pharmacol. and Toxicol. 116, 96–109. doi:10.1111/bcpt.12319
Davidson, M. M., Nesti, C., Palenzuela, L., Walker, W. F., Hernandez, E., Protas, L., et al. (2005). Novel cell lines derived from adult human ventricular cardiomyocytes. J. Mol. Cell. Cardiol. 39, 133–147. doi:10.1016/j.yjmcc.2005.03.003
Denes, L. T., Riley, L. A., Mijares, J. R., Arboleda, J. D., McKee, K., Esser, K. A., et al. (2019). Culturing C2C12 myotubes on micromolded gelatin hydrogels accelerates myotube maturation. Skelet. Muscle 9, 17. doi:10.1186/s13395-019-0203-4
Domke, J., and Radmacher, M. (1998). Measuring the elastic properties of thin polymer films with the atomic force microscope. Langmuir 14, 3320–3325. doi:10.1021/la9713006
El Hadad, M., Notarnicola, C., Evano, B., El Khatib, N., Blaquière, M., Bonnieu, A., et al. (2017). Retinoic acid maintains human skeletal muscle progenitor cells in an immature state. Cell. Mol. Life Sci. 74, 1923–1936. doi:10.1007/s00018-016-2445-1
Engler, A. J., Griffin, M. A., Sen, S., Bönnemann, C. G., Sweeney, H. L., and Discher, D. E. (2004). Myotubes differentiate optimally on substrates with tissue-like stiffness: pathological implications for soft or stiff microenvironments. J. Cell. Biol. 166, 877–887. doi:10.1083/jcb.200405004
Engler, A. J., Sen, S., Sweeney, H. L., and Discher, D. E. (2006). Matrix elasticity directs stem cell lineage specification. Cell. 126, 677–689. doi:10.1016/j.cell.2006.06.044
Erben, A., Hörning, M., Hartmann, B., Becke, T., Eisler, S. A., Southan, A., et al. (2020). Precision 3D-printed cell scaffolds mimicking native tissue composition and mechanics. Adv. Healthc. Mater. 9, 2000918. doi:10.1002/adhm.202000918
Erhardt, J., Ludwig, S., Brock, J., and Hörning, M. (2024). Native mechano-regulative matrix properties stabilize alternans dynamics and reduce spiral wave stabilization in cardiac tissue. Front. Netw. Physiology 4, 1443156. doi:10.3389/fnetp.2024.1443156
Frantz, C., Stewart, K. M., and Weaver, V. M. (2010). The extracellular matrix at a glance. J. Cell. Sci. 123, 4195–4200. doi:10.1242/jcs.023820
García, A. J., Vega, M. D., and Boettiger, D. (1999). Modulation of cell proliferation and differentiation through substrate-dependent changes in fibronectin conformation. Mol. Biol. Cell. 10, 785–798. doi:10.1091/mbc.10.3.785
Giguère, H., Dumont, A.-A., Berthiaume, J., Oliveira, V., Laberge, G., and Auger-Messier, M. (2018). ADAP1 limits neonatal cardiomyocyte hypertrophy by reducing integrin cell surface expression. Sci. Rep. 8, 13605. doi:10.1038/s41598-018-31784-w
Hescheler, J., Meyer, R., Plant, S., Krautwurst, D., Rosenthal, W., and Schultz, G. (1991). Morphological, biochemical, and electrophysiological characterization of a clonal cell (H9c2) line from rat heart. Circulation Res. 69, 1476–1486. doi:10.1161/01.res.69.6.1476
Hörning, M., Blanchard, F., Isomura, A., and Yoshikawa, K. (2017a). Dynamics of spatiotemporal line defects and chaos control in complex excitable systems. Sci. Rep. 7, 7757. doi:10.1038/s41598-017-08011-z
Hörning, M., Kidoaki, S., Kawano, T., and Yoshikawa, K. (2012). Rigidity matching between cells and the extracellular matrix leads to the stabilization of cardiac conduction. Biophysical J. 102, 379–387. doi:10.1016/j.bpj.2011.12.018
Hörning, M., Nakahata, M., Linke, P., Yamamoto, A., Veschgini, M., Kaufmann, S., et al. (2017b). Dynamic mechano-regulation of myoblast cells on supramolecular hydrogels cross-linked by reversible host-guest interactions. Sci. Rep. 7, 7660. doi:10.1038/s41598-017-07934-x
Hume, S. L., Hoyt, S. M., Walker, J. S., Sridhar, B. V., Ashley, J. F., Bowman, C. N., et al. (2012). Alignment of multi-layered muscle cells within three-dimensional hydrogel macrochannels. Acta Biomater. 8, 2193–2202. doi:10.1016/j.actbio.2012.02.001
Inoue, S., Frank, V., Hörning, M., Kaufmann, S., Yoshikawa, H. Y., Madsen, J. P., et al. (2015). Live cell tracking of symmetry break in actin cytoskeleton triggered by abrupt changes in micromechanical environments. Biomaterials Sci. 3, 1539–1544. doi:10.1039/C5BM00205B
Kern Puotinen, W., Kern, W., and Puotinen, D. A. (1970). Cleaning solutions based on hydrogen peroxide for use in silicon semiconductor technology. RCA Rev. 31, 187–206.
Kimes, B. W., and Brandt, B. L. (1976). Properties of a clonal muscle cell line from rat heart. Exp. Cell. Res. 98, 367–381. doi:10.1016/0014-4827(76)90447-X
Li, S., Harrison, D., Carbonetto, S., Fässler, R., Smyth, N., Edgar, D., et al. (2024). Matrix assembly, regulation, and survival functions of laminin and its receptors in embryonic stem cell differentiation
Loppini, A., Erhardt, J., Fenton, F. H., Filippi, S., Hörning, M., and Gizzi, A. (2022). Optical ultrastructure of large mammalian hearts recovers discordant alternans by in silico data assimilation. Front. Netw. Physiology 2, 866101. doi:10.3389/fnetp.2022.866101
Lukashev, M. E., and Werb, Z. (1998). ECM signalling: orchestrating cell behaviour and misbehaviour. Trends Cell. Biol. 8, 437–441. doi:10.1016/S0962-8924(98)01362-2
MATLAB (2023). MATLAB version: 9.14.0 (R2023b). Natick, MA: The MathWorks Inc. Available at: https://www.mathworks.com.
Mei, C., Chao, C.-W., Lin, C.-W., Li, S. T., Wu, K.-H., Yang, K.-C., et al. (2019). Three-dimensional spherical gelatin bubble-based scaffold improves the myotube formation of H9c2 myoblasts. Biotechnol. Bioeng. 116, 1190–1200. doi:10.1002/bit.26917
Ménard, C., Pupier, S., Mornet, D., Kitzmann, M., Nargeot, J., and Lory, P. (1999). Modulation of L-type calcium channel expression during retinoic acid-induced differentiation of H9C2 cardiac cells. J. Biol. Chem. 274, 29063–29070. doi:10.1074/jbc.274.41.29063
Nakayama, H., Chen, X., Baines, C. P., Klevitsky, R., Zhang, X., Zhang, H., et al. (2007). Ca2+- and mitochondrial-dependent cardiomyocyte necrosis as a primary mediator of heart failure. J. Clin. Investigation 117, 2431–2444. doi:10.1172/JCI31060
Narazaki, G., Uosaki, H., Teranishi, M., Okita, K., Kim, B., Matsuoka, S., et al. (2008). Directed and systematic differentiation of cardiovascular cells from mouse induced pluripotent stem cells. Circulation 118, 498–506. doi:10.1161/CIRCULATIONAHA.108.769562
Nori, S., Okada, Y., Nishimura, S., Sasaki, T., Itakura, G., Kobayashi, Y., et al. (2015). Long-term safety issues of iPSC-based cell therapy in a spinal cord injury model: oncogenic transformation with epithelial-mesenchymal transition. Stem Cell. Rep. 4, 360–373. doi:10.1016/j.stemcr.2015.01.006
Ohno, Y., Yuasa, S., Egashira, T., Seki, T., Hashimoto, H., Tohyama, S., et al. (2013). Distinct iPS cells show different cardiac differentiation efficiency. Stem Cells Int. 2013, e659739. doi:10.1155/2013/659739
Otsu, N. (1979). A threshold selection method from gray-level histograms. IEEE Trans. Syst. Man, Cybern. 9, 62–66. doi:10.1109/TSMC.1979.4310076
Ott, C., and Jung, T. (2023). The MyoPulser field stimulator, a do it yourself programmable electronic pacemaker for contracting cells and tissues. Sci. Rep. 13, 2461. doi:10.1038/s41598-023-29145-3
Patten, V. A., Chabaesele, I., Sishi, B., and Van, V. D. (2017). Cardiomyocyte differentiation: experience and observations from 2 laboratories. SA Heart 14, 96–107. doi:10.24170/14-2-2498
Pereira, S. L., Ramalho-Santos, J., Branco, A. F., Sardão, V. A., Oliveira, P. J., and Carvalho, R. A. (2011). Metabolic remodeling during H9c2 myoblast differentiation: relevance for in vitro toxicity studies. Cardiovasc. Toxicol. 11, 180–190. doi:10.1007/s12012-011-9112-4
Pesant, M., Sueur, S., Dutartre, P., Tallandier, M., Grimaldi, P. A., Rochette, L., et al. (2006). Peroxisome proliferator-activated receptor delta (PPARdelta) activation protects H9c2 cardiomyoblasts from oxidative stress-induced apoptosis. Cardiovasc. Res. 69, 440–449. doi:10.1016/j.cardiores.2005.10.019
Peter, A. K., Bjerke, M. A., and Leinwand, L. A. (2016). Biology of the cardiac myocyte in heart disease. Mol. Biol. Cell. 27, 2149–2160. doi:10.1091/mbc.E16-01-0038
Ravi, V., Jain, A., Taneja, A., Chatterjee, K., and Sundaresan, N. R. (2021). Isolation and culture of neonatal murine primary cardiomyocytes. Curr. Protoc. 1, e196. doi:10.1002/cpz1.196
Reilly, G. C., and Engler, A. J. (2010). Intrinsic extracellular matrix properties regulate stem cell differentiation. J. Biomechanics 43, 55–62. doi:10.1016/j.jbiomech.2009.09.009
Salmerón-Sánchez, M., Rico, P., Moratal, D., Lee, T. T., Schwarzbauer, J. E., and García, A. J. (2011). Role of material-driven fibronectin fibrillogenesis in cell differentiation. Biomaterials 32, 2099–2105. doi:10.1016/j.biomaterials.2010.11.057
Shabankhah, M., Moghaddaszadeh, A., and Najmoddin, N. (2024). 3D printed conductive PCL/GO scaffold immobilized with gelatin/CuO accelerates H9C2 cells attachment and proliferation. Prog. Org. Coatings 186, 108013. doi:10.1016/j.porgcoat.2023.108013
Smith, L. R., Cho, S., and Discher, D. E. (2018). Stem cell differentiation is regulated by extracellular matrix mechanics. Physiology 33, 16–25. doi:10.1152/physiol.00026.2017
Sneddon, I. N. (1965). The relation between load and penetration in the axisymmetric boussinesq problem for a punch of arbitrary profile. Int. J. Eng. Sci. 3, 47–57. doi:10.1016/0020-7225(65)90019-4
Suhaeri, M., Subbiah, R., Van, S. Y., Du, P., Kim, I. G., Lee, K., et al. (2015). Cardiomyoblast (H9c2) differentiation on tunable extracellular matrix microenvironment. Tissue Eng. Part A 21, 1940–1951. doi:10.1089/ten.tea.2014.0591
Watkins, S. J., Borthwick, G. M., and Arthur, H. M. (2011). The H9C2 cell line and primary neonatal cardiomyocyte cells show similar hypertrophic responses in vitro. Vitro Cell. and Dev. Biol. - Animal 47, 125–131. doi:10.1007/s11626-010-9368-1
White, S. M., Constantin, P. E., and Claycomb, W. C. (2004). Cardiac physiology at the cellular level: use of cultured HL-1 cardiomyocytes for studies of cardiac muscle cell structure and function. Am. J. Physiology-Heart Circulatory Physiology 286, H823–H829. doi:10.1152/ajpheart.00986.2003
Witek, P., Korga, A., Burdan, F., Ostrowska, M., Nosowska, B., Iwan, M., et al. (2016). The effect of a number of H9C2 rat cardiomyocytes passage on repeatability of cytotoxicity study results. Cytotechnology 68, 2407–2415. doi:10.1007/s10616-016-9957-2
Xu, X., Ruan, L., Tian, X., Pan, F., Yang, C., and Liu, G. (2020). Calcium inhibitor inhibits high glucose-induced hypertrophy of H9C2 cells. Mol. Med. Rep. 22, 1783–1792. doi:10.3892/mmr.2020.11275
Yamamoto, D. L., Csikasz, R. I., Li, Y., Sharma, G., Hjort, K., Karlsson, R., et al. (2008). Myotube Formation on micro-patterned glass: intracellular organization and protein distribution in C2C12 skeletal muscle cells. J. Histochem. and Cytochem. 56, 881–892. doi:10.1369/jhc.2008.951228
Keywords: H9c2, cardiomoycytes, ECM, differentiation, calcium signaling, retinoic acid, hydrogels
Citation: Brock J and Hörning M (2024) Optimization of H9c2 differentiation leads to calcium-active and striated cardiac cells without addition of retinoic acid. Front. Cell Dev. Biol. 12:1501540. doi: 10.3389/fcell.2024.1501540
Received: 04 October 2024; Accepted: 08 November 2024;
Published: 22 November 2024.
Edited by:
Shamik Sen, Indian Institute of Technology Bombay, IndiaReviewed by:
Viviana Claudia Blank, University of Buenos Aires, ArgentinaMahesh Agarwal, University of California, Los Angeles, United States
Copyright © 2024 Brock and Hörning. This is an open-access article distributed under the terms of the Creative Commons Attribution License (CC BY). The use, distribution or reproduction in other forums is permitted, provided the original author(s) and the copyright owner(s) are credited and that the original publication in this journal is cited, in accordance with accepted academic practice. No use, distribution or reproduction is permitted which does not comply with these terms.
*Correspondence: Marcel Hörning, bWFyY2VsLmhvZXJuaW5nQGJpby51bmktc3R1dHRnYXJ0LmRl