 Matthew D. Bourn
 Lauren F. Daly
 Jim F. Huggett
 Julian Braybrook
 Jeanne F. Rivera
- National Measurement Laboratory, LGC Ltd., Teddington, United Kingdom
Morphological cell analysis offers a means of identification and classification of key morphological measurement parameters linked to cell bioactivity and cell health and, as such, it is of great interest to academic and industrial research sectors. Widespread adoption of this approach has yet to occur, partially due to the lack of alignment in analysis methodologies and output metrics, limiting data comparability. Work within the cell metrology and wider multidisciplinary community aims to reduce data variability through the improved alignment of image acquisition and analysis methodologies. Furthermore, to improve data comparability, research has also focused on the identification of a minimal set of morphological measurands, often termed critical quality attributes (CQAs), which are traceable to standardised (SI) units of measurement. Whilst efforts in defining CQAs have progressed significantly for healthcare applications, there are still numerous measurement challenges associated with image analysis of cultured cells due, in part, to their complex heterogenous nature. This review evaluates the various automated image analysis tools developed for morphological analysis of four commonly considered cell morphological features: the nucleus, actin cytoskeleton, mitochondria, and the cell membrane. The measurement methodologies and outputs from each tool have been evaluated and coinciding outputs have been highlighted as potential CQAs.
1 Introduction
Morphological cell analysis utilises the data from cell microscopy images to generate quantitative data which portrays key information about the cells structure and cell bioprocesses (Chandrasekaran et al., 2021; Vincent et al., 2022; Stirling et al., 2021). This practice, often referred to as cell profiling, involves the analysis of key morphological features of differing cell populations and organelles, which generally consists of analysing fluorescent intensity, shape features, and co-localisation of signals (Piccinini et al., 2017). Cell profiling is often used for high-throughput investigations during drug development to identify mechanisms of drug uptake and toxicity, by comparing cell morphologies of treated cells with those of untreated cells (Kang et al., 2016; Ziegler et al., 2021; Scheeder et al., 2018). Furthermore, advances in imaging technologies allow for analysis of complex cell models, such as organoids, for disease characterisation, and optimisation of immunotherapies - bridging the gap between preclinical and clinical research (Silva-Pedrosa et al., 2023). The consideration of cell morphology overcomes limitations of alternative analysis methods such as plate-based viability assays or cytometry-based expression assays, which are unable to discriminate subtle morphological variations (Chen et al., 2016). Although morphological cell analysis is a desirable technique which provides extensive information about the state of various cell populations, there are still numerous challenges within the workflow of cell profiling that need to be addressed to facilitate its adoption by the wider scientific community. A particular application for image-based cell profiling is during drug development process, due to its high-throughput potential to assess large datasets and improve analysis efficiency. However, discrepancies on the quality of training data sets influence the unbiased strategy of image-based profiling. The definition of good quality data for training sets remains unclear, though some QC guidelines for tools like Cell Painting assays for well-characterized cell lines (e.g., A549) and data preprocessing methods in CellProfiler enhance image-based profiles (Garcia-Fossa et al., 2023; Assefa et al., 2023). Furthermore, continuous improvements in experimental workflows are also increasingly being published, that should address challenges associated with morphological perturbations (Cimini et al., 2023).
Cellular analysis through evaluation of morphology derived from bio-imaging techniques is an important emerging area of cell metrology (Faruqui et al., 2020). Metrology is the science of measurement and its application to cell analysis (cell metrology) aims to improve the accuracy of methods for cell measurement. Central to cell-based measurement is an accurate definition of the identity of the cells being analysed. This also represents an expanding area of science as cell measurements advance. For example, the identification of a set of morphological attributes, often referred to as critical quality attributes (CQAs), associated with cellular bioactivity is key to advancing morphological cell analysis (Lin-Gibson et al., 2016). Furthermore, the establishment of material standards to allow metrological traceability would greatly improve the reproducibility of measurements.
Whilst identification of CQAs would aid cell measurements, the lack of workflow standardisation relating to cell organelle staining, image acquisition, analysis tools, and mathematical analysis models currently contributes to undetermined variations in morphological measurement data. Efforts to remove and reduce these challenges have been made throughout the field of digital pathology where the analysis methods of images derived from histological samples have been developed significantly to enable precise characterisation and improve clinical diagnostic practices. Furthermore, ISO (International Organisation of Standardisation) standards related to the use of AI and image analysis are currently under development (ISO/AWI 24051–2 Part 2: Digital pathology and artificial intelligence-based image analysis under ISO/TC212 (Bankhead, 2022; ISO, 2025a). However, these analytical methods cannot be applied to cell culture-based images due to their morphological complexity and heterogeneous nature. Documentary standards such as ‘ISO/CD23511: Biotechnology-General requirements and considerations for cell line authentication under ISO/TC276’ are beginning to identify and address the challenges in this field (ISO, 2025b). These efforts highlight the critical need for precise methodologies to improve measurement confidence, support global efforts in biotechnology, and enable increased translation of research evidence into practice.
Development of a set of robust, validated methods and a concise set of high-confidence measurement parameters is reported to be pivotal for the functionality of morphological cell profiling and would further facilitate its utilisation throughout the research and biomanufacturing sectors (Plant et al., 2014; Plant et al., 2018; Faruqui et al., 2020). The ability to accurately measure viable cell count, classify the number of proliferating, senescent and quiescent cells, and to identify apoptotic cells using morphological cell analysis offers a means of improving quality control in cell therapeutic product manufacturing, viral vector manufacturing, and protein production (Lin-Gibson et al., 2016; Simon et al., 2016; Sarkar et al., 2017; Huang et al., 2021; Pierce et al., 2021). Morphological cell profiling could provide complementary data to existing biological techniques such as molecular profiling, protein biomarker detection and plate-based assays and provide a link across multiple analysis methodologies. For example, morphological profiling of mesenchymal stem cells (MSCs) may provide a means of characterising their functional heterogeneity and quantifying their therapeutic potency (Phinney, 2012). In another example, Treiser et al. have previously demonstrated the ability of actin cytoskeleton morphological analysis to predict the fate of MSCs grown on differing substrates (Treiser et al., 2010). ISO have established a dedicated committee (Biotechnology ISO/TC 276/SC1) that primarily aims to publish standard documents outlining general guidance and key considerations for cell counting methodologies and evaluation of CQAs. These include, but not limited to, ‘the determination of the intended use of the cells’ and ‘awareness of the cell morphology under the microscope’ and are currently working towards further guidance for cellular morphological analysis (Huang et al., 2021; Allocca et al., 2024).
The Cells Analysis Working Group (CAWG), under the Consultative Committee for Amount of Substance (CCQM) metrological organisation, is also working towards improving the global comparability of cell-based measurements and identification of CQAs by performing interlaboratory comparison studies across international metrological research institutes (CCQM, 2021). Together, these organisations are facilitating measurement comparability of morphological cell profiling. The benefits of measurement standardisation can be observed in other cell-based techniques such as flow cytometry, where efforts from international comparative studies resulted in the development of candidate reference materials for CD4+ cell counting for HIV/AIDS diagnosis. These studies documented measurement uncertainty, a critical biomarker for these cell type of interest (WHO BS/10.2153) and proficiency testing through providers such as the National External Quality Assessment Scheme (NEQAS). NEQAS aims to improve global diagnostic testing for improved quality of care by providing flow cytometry programmes (Stebbings et al., 2015; Rajagopal et al., 2020; NEQASUK, 2024). Similar types of material standards may offer an additional route needed to guide morphological cell analysis.
Since cell imaging focuses on morphological features such as cell nuclei, actin cytoskeletons, mitochondria networks and cell membranes, these will be the primary cell components considered throughout this review. The method by which images are analysed likely exhibits the greatest amount of variation across this field, and multiple tools and analysis packages have been developed to accommodate a range of purposes. This review will highlight cell staining and imaging strategies focusing primarily on compiling and assessing the various tools developed for the analysis of each cellular component and adjacent bioprocesses. The metric outputs from each analytical tool will be discussed with reference to the identification of a minimal set of CQAs that encompass key measurements related to cell bioactivity. Reducing the number of potentially redundant measurands would streamline cell characterisation and link measurements directly to the cell products intended use. Thus, a set of CQAs may consist of singular measurements of cell structures along with measurements of the relationship between structures, to fully describe the confirmational changes occurring within each cell. This review will discuss potential CQAs in reference to their ability to be expressed in standardised units (SI) of measurement. This is an essential characteristic for any potential CQA as it enables traceability back to a reference material, therefore facilitating data comparability across multiple instruments and laboratories. Such metrological considerations are often overlooked when developing analysis tools and methodologies, which can hinder adoption across the wider scientific community.
2 Cell imaging strategies
2.1 Imaging technologies
Several types of fluorescence microscopes can be used for morphological profiling with confocal fluorescent microscopy being one of the most utilised. Confocal microscopes are widely available and possess the ability to produce detailed three-dimensional (3D) Z-stacks of cells across multiple fluorescent channels. The primary drawbacks of capturing Z-stacks involve the slow acquisition times and phototoxicity effects when imaging live cells (Ojha and Ojha, 2021; Douthwright and Sluder, 2017). Live cell imaging allows for continuous observation of cell morphologies as the bioprocesses occur, providing that temperature and CO2 conditions are maintained. However, limitations associated with phototoxicity and stain incompatibility with live cells often renders live cell imaging unfeasible (Purschke et al., 2010). Cell fixation can instead be used to preserve cells in a life-like state, allowing for a snapshot of cellular morphology to be acquired. Fixation is advantageous for many antibody-based assays, as, when combined with permeabilisation, allows for access to intracellular structures (Fischer et al., 2008).
Widefield fluorescent microscopy allows for faster image acquisition at the cost of reduced image detail from 2D images. Profiling of large numbers of cells within a population is a key requirement for many morphological analysis studies, such as high content screening, therefore acquisition time is a key concern when choosing a methodology. Spinning disc confocal microscopy (SDCM) offers an alternative to conventional confocal microscopy, due to its ability to overcome the time constraints of Z-stack acquisition (McKayed and Simpson, 2013). The widespread adoption of SDCM is evident by the increasing number of publications and applications using this type of microscopy leading to standardisation efforts in quality assessment in light microscopy (Faklaris et al., 2022; Ahmadian et al., 2024; Poole and Mostaço-guidolin 2021). Despite this, laser scanning confocal microscopes currently remain more commonly used particularly throughout the research community (Patil-Takbhate et al., 2024; McKayed and Simpson, 2013).
The choice of imaging system is also dependent on the analytical tool being used for image analysis. Complex analysis tools that investigate the intricate networks formed by actin cytoskeletons or mitochondria, often require 3D images with finely sliced Z-stacks to accurately determine linkages in the Z-axis (Harwig et al., 2018; Sahu et al., 2024). The minimum magnification required to produce a sufficiently detailed image for morphological cell analysis is dependent on the feature of interest, staining quality, image gain, and background noise levels. The processing of images post-acquisition also introduces downstream morphological measurement uncertainties. Deconvolution, the process of improving the contrast and resolution of images using mathematical algorithms, is commonly used to remove out of focus light present in fluorescent images due to point spread function (PSF) effects (Wallace et al., 2025). Deconvolution tools are often incorporated into microscopy acquisition software, as intrinsic optical properties of the hardware, such as the numerical aperture, refractive indices, and quality of optical components are known. Several types of standalone, open-source deconvolution tools are also available such as DeconvolutionLab2 and Deconwolf (Wernersson et al., 2024; Sage et al., 2017). A range of algorithms can be implemented to perform image deconvolution, and can broadly be categorized into deblurring algorithms, which aim to remove out of focus light from images, and restorative algorithms which aim to reassign out of focus light in 3D images to the appropriate in-focus location in the Z-axis (Wallace et al., 2025). This tool is particularly useful for co-localisation studies where chromatic aberrations from differing fluorophores can lead to misalignment between acquisition channels (Mascalchi and Cordelieres, 2019). From a metrological perspective, the impact of these operations on the intensity and shape features determined from morphological cell analysis is yet to be fully investigated. Overall, this range of cell imaging strategies introduces a high degree of data variability, which presents further challenges in the alignment of cell morphological analysis methodologies.
Whilst some guidelines have been produced in ISO 21073:2019 that details standards on performance of microscopes for biological imaging and address challenges in reproducibility, further work is still required to address the additional challenges outside the scope of the guideline (ISO, 2019). This is further compounded by the lack of universally adopted microscope quality controls and instrument characterisation, when compared to other instrumentation such as flow cytometry, where reference standards and best practice guidelines now exist (DeRose et al., 2008; Cossarizza et al., 2021). Laser illumination power, field uniformity, axial resolution, and chromatic aberration have all been identified as key factors which must be characterised to facilitate the production of reproducible, quantifiable fluorescent image data (Montero Llopis et al., 2021). To address this need, the Quality Assessment and Reproducibility for Instruments and Images in Light Microscopy (QUAREP-LiMi) working group was formed and a set of ISO standards published describing the best practices for acquiring these measurands (Nelson et al., 2021; Hammer et al., 2021). It is recommended that a comprehensive set of image metadata should accompany published images and associated data, using what is known as the Open Microscopy Environment (OME) model (Hammer et al., 2021; Goldberg et al., 2005). Community-developed guidelines have also been published which aid authors in increasing the clarity and reproducibility of image figures (Schmied et al., 2023). Whilst this will undoubtedly improve the dependability and reproducibility of image quantification, many labs and users, specifically in academia, may be hesitant to adopt such exhaustive quality controls, due to time constraints and the advanced training required.
2.2 Morphological features as CQAs
Morphological profiling refers to the critical analysis of cells to identify quantifiable phenotypic metrics such as size, shape, intensity distributions and subcellular components. These features can be indicative of key bioprocesses such as apoptosis, proliferation, senescence and quiescence, that underpin cell health and function. Moreover, features such as blebbing, nuclear fragmentation and cell shrinkage can be utilised to enumerate cells undergoing these specific processes within a population (Ziegler and Groscurth, 2004; Yang et al., 2022). Identification of candidate CQAs is paramount to accelerate the translation of cell therapies. Whilst cell morphology demonstrates a potential candidate CQA, selecting a specific morphological feature can be challenging due to the measurement uncertainties associated with each cell characteristic. Furthermore, variation in image capture settings and analysis, due to several key methodology steps: cell type, staining method, imaging strategy, analysis method and output parameters, can also present further measurement challenges for biotechnology. A summary of the commonly used stains and reagents used for the visualisation of the nucleus, cell membrane, actin cytoskeleton, and mitochondria is given in Table 1.
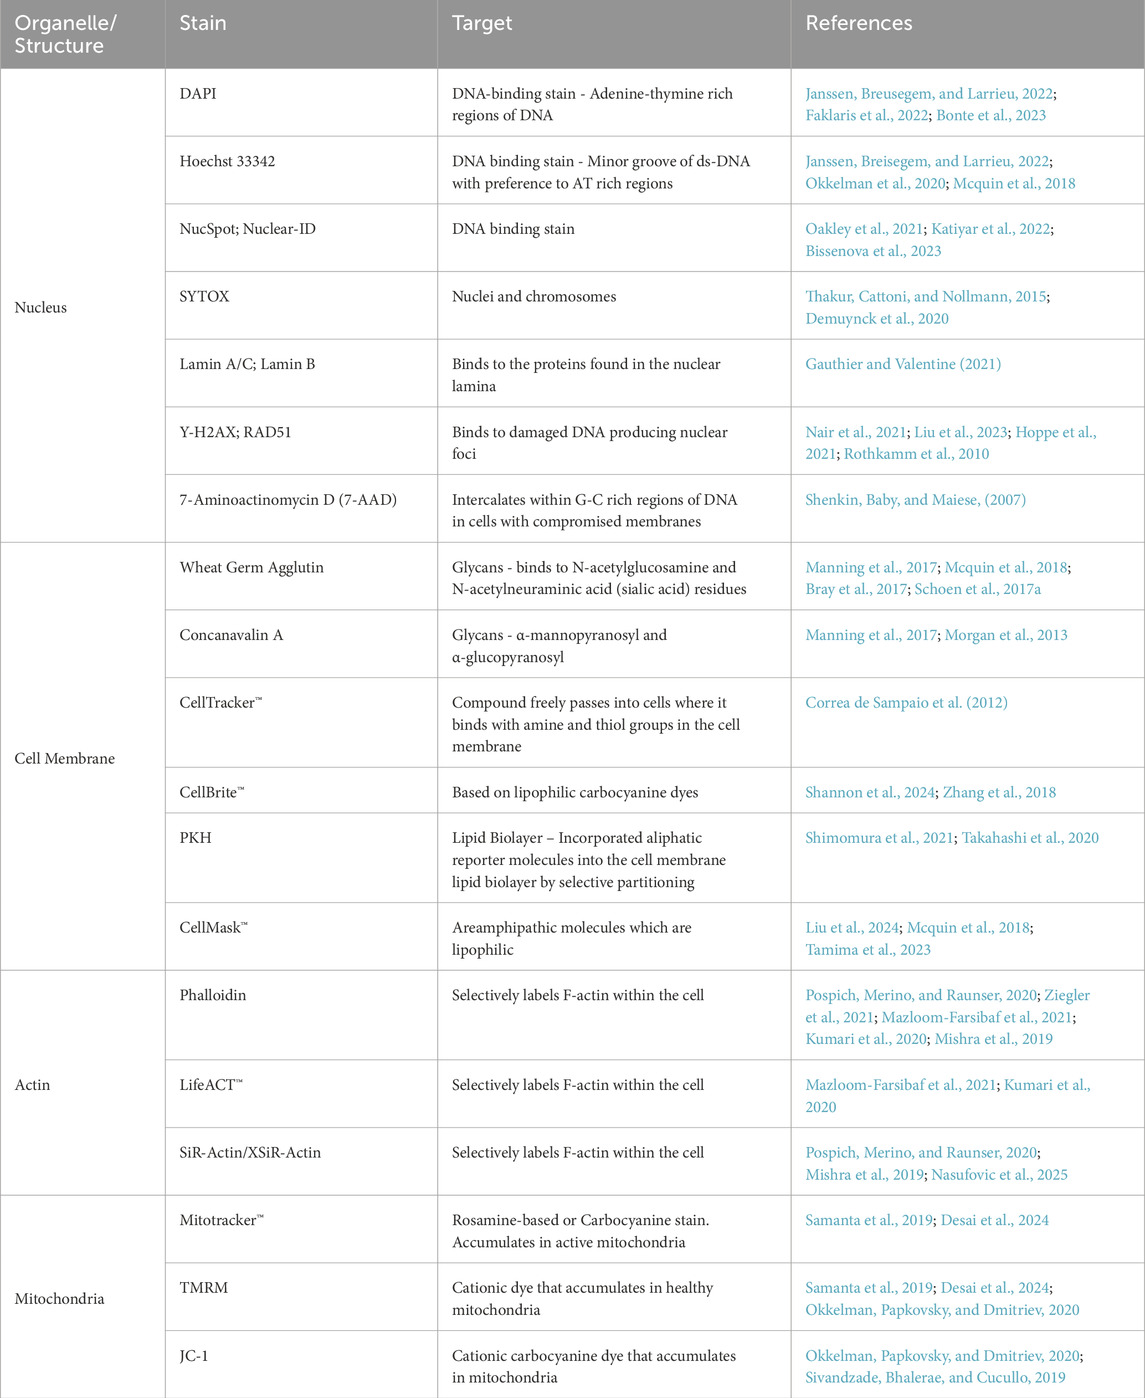
Table 1. Summary table of common stains for each cell organelle/structure described throughout this review. Stain target/mechanism of action is described alongside notable references employing the use of each stain.
2.2.1 Nuclear morphology
The nucleus is one of the most commonly studied cellular organelles, with the responsibility of compartmentalising the cell’s genetic material and regulation of gene expression. The morphology of the nucleus can vary between cell types and can change depending on the overall health of the cell. The nuclear structure is made up of the nuclear envelope (NE) and the nuclear matrix. The NE is a double membrane, which regulates the transportation of molecules from in and out of the nucleus (Fischer, 2020). The most common aberrations of the nucleus include abnormal sizing, blebbing, and NE invaginations which all indicate signs of poor cell health and the development of disease (Fischer, 2020; Schoen et al., 2017a; Gauthier and Valentine, 2021; Janssen et al., 2022). As well as nuclear morphology being symptomatic of disease, their morphology can also be indicative of current cell cycle status. For instance, cells undergoing mitosis lose their nuclear envelope and exhibit nuclear fragmentation whereas, cells undergoing cell cycle arrest present a flattened nucleus with increased surface area (Ziegler and Groscurth, 2004; Smoyer and Jaspersen, 2014; Pathak et al., 2021).
As nuclear morphology can be indicative of cellular health and specific biological processes, it is an ideal candidate for cellular profiling and is a commonly considered organelle for cell morphological analysis. A range of nuclear and DNA stains and antibodies are available for visualisation of the nucleus such as Hoechst 33342, DAPI, NucSpot, and Lamin A/C. Many stains are cell impermeable, allowing for live/dead cell discrimination as only cells with a compromised nuclear membrane show fluorescence.
2.2.2 Cell membrane
The structure of a cell membrane can provide a wealth of information on the bioprocesses occurring within a cell (Denz et al., 2017; Zhukov and Popov, 2023). The membrane provides information on the overall size and surface area of the cells and can be used to classify cells in various cellular processes. For example, the area of the cell can be utilised to classify cells undergoing proliferation due to an increase in size and apoptosis due to cellular shrinkage (Zhang et al., 2018). The analysis of cell membrane morphologies also allows for the characterisation of subtle morphological changes visible using microscopy, which are often unable to be identified when using analysis methods such as flow cytometry and plate-based assays. The complete staining of membranes also facilitates cell segmentation in confluent cell monolayers as cell membrane staining is often more intense at the periphery. This can be a valuable tool when aiming to separate individual cell cytoskeletons or mitochondrial networks, which can provide further information on the bioprocesses occurring.
Analysis of cell membrane morphologies can provide a range of quantitative information depending on the method by which membranes are stained. In addition to morphology, several membrane impermeant stains, such as Propidium Iodide and 7-AAD, which allow for the membrane integrity of the cell to be probed. In general, these stains function by fluorescing only when bound to DNA inside the cell, thus identifying non-viable cells with compromised membranes. These staining strategies provide quantifiable mean intensity readouts and, when combined with morphological-focused stains, allow for complete morphological profiles of cells to be established.
2.2.3 Actin cytoskeleton
The actin cytoskeleton provides internal structure to a cell and participates in various cellular processes including mitosis, migration, contraction and elongation, and adhesion (Povea-Cabello et al., 2017; Gosak et al., 2022). The two forms of actin: filamentous (f-) and globular (g-) actin, exist in a state of flux that is regulated by actin binding proteins (Kumari et al., 2020). The extent and structure of the actin filament polymerisation within a cell is dependent on the bioprocesses occurring. During cytokinesis, the final stage of mitosis, actin cytoskeletons from a contractile ring, which contracts to cleave the cell in two. During apoptosis, caspase activation can also induce cells to show similar contractile ring structures as part of programmed cell death (Ren et al., 2021). Actin plays a crucial role in each of these distinct processes which result in comparable morphological change. This highlights the potential of morphological cell profiling to identify cell bioprocesses, however, a complete set of morphological data is required to accurately do so (Zhang et al., 2023). Characterisation of the cytoskeletal morphology can inform on cell status and provide a useful tool for cell profiling (Leemreis et al., 2006). In addition to morphological profiling, several alternative methods of determining cytoskeletal function exist in the form of techniques which look to probe cell stiffness using deformation. Optical tweezers, atomic force microscopy, and microfluidic deformation have all previously been used to probe cell membrane stiffness and infer the functionality of the actin cytoskeleton (Jokhadar et al., 2021; Daniel et al., 2023; Su et al., 2022). Whilst these techniques are informative, many suffer from low throughput cell analysis and are not easily multiplexed with additional analysis targets, such as other cell organelles, and do not allow for direct observation of the actin cytoskeleton morphology. Nevertheless, the quantifiable output from these analysis methods can serve as a means of validating actin morphology observations and aid in the identification of morphological CQAs associated with actin functionality.
Actin and cell membrane profiling generate many overlapping outputs related to cell status which can aid in the development of multiparameter outputs for each of the cellular processes mentioned above. Multiparameter outputs increase cell profiling robustness and reduce the impact of staining artefacts on cell characterisation. Analysis of mammalian cytoskeletons will be the primary focus here; however, it should be noted that other sophisticated analysis tools have been developed with the aim of analysing plant actin cytoskeletons due to their complex morphologies. For the visualisation of actin, Phalloidin is typically regarded as the gold standard in actin staining. However, well characterised compounds such as SiR-actin, Lifeact peptide and recently developed SiR-XActin offer alternative fluorescent probes that overcome the fixation limitations of phalloidin for live cell imaging (Nasufovic et al., 2025; Takagi et al., 2021; Mazloom-Farsibaf et al., 2021). This has facilitated the real-time imaging of actin cytoskeleton and visualisation of confirmational changes using live cell, time-lapse imaging.
2.2.4 Mitochondria
Mitochondria are maternally inherited membrane-bound organelles conserved within all eukaryotic cells. Their main function is to perform aerobic respiration and provide the cell with chemical energy in the form of ATP. As such, mitochondria are responsible for the homeostatic maintenance of many cellular processes including programmed cell death, mitosis, reactive oxygen species production and calcium signalling (Brand et al., 2016). Due to their dynamic roles, the morphology and quantity of mitochondria can vary within the cell based on the cell’s viability, function, and energy requirements–presenting an ideal target for cell profiling. Structurally, the mitochondria are defined by their compartmentalised structure consisting of an inner and outer membrane that shift from small, fragmented units to larger, elongated, interconnected networks. The assembly and disassembly of the intracellular networks are controlled and regulated through two opposing processes, fission (disassembly), and fusion (assembly). The morphology of the mitochondrial networks is directly related to the energy demands within the cell, and in turn, be used as an indicator of specific cellular processes. (Herrera et al., 2018; Otera and Mihara, 2012).
Due to the importance of mitochondrial morphology in characterising and studying cell health and biogenesis, high quality imaging is required for successful phenotyping. Several different mitochondrial stains can be utilised depending on the morphological information required for the study. Quantification of mitochondrial morphology has proven to be challenging, and early efforts were based on unreliable and inconsistent qualitative descriptors. For example, mitochondrial morphologies are commonly classified as elongated, fragmented, or collapsed and their heterogeneity within the cell were not taken into consideration. This may lead to subjective results and inconsistencies with inter-laboratory comparison studies. To coincide with the quantification of mitochondrial morphology CQAs, mitochondrial functionality in relation to cell health can be assessed through several plate-based assays. These assays can measure; ATP, reactive oxygen species (ROS), cell oxygen consumption, and Ca2+ content (Yin and Shen, 2022). Whilst these assays allow for a determination of mitochondrial activity, they are typically end-point assays which are not easily multiplexed with additional measurements such as morphology. Furthermore, on their own, they may not reflect accurately with cell viability and proliferative status due to mitochondrial hyperactivity (Rai et al., 2018).
3 Analytical tools for morphological analysis
Numerous open-source image analysis software tools are available for cell-based image analysis, with differing capabilities and limits. Examples include Icy, CellProfiler, ILASTIK, and ImageJ with a host of user-developed tools for the analysis of specific cellular processes, such as mitochondrial fission/fusion and actin cytoskeletal rearrangement (Wiesmann et al., 2015). In addition to the variability introduced by numerous software sources, morphology can be unique to a particular cell type which creates further difficulties in analysis. Bray et al. aimed at addressing these issues by developing a ‘Cell Painting’ assay (Bray, Singh, et al., 2017); which outlined detailed methodologies for staining, imaging and analysis of cell morphologies using CellProfiler (Singh et al., 2014; Bray et al., 2017; Mcquin et al., 2018; Stirling et al., 2021). This assay marked a step towards the standardisation of cell morphological assessment, however challenges related to image acquisition and microscope standardisation still remain. Furthermore, whilst versatile, CellProfiler is limited in the measurement and quantification of specific organelle morphologies. This section will highlight analytical tools developed for the measurement of specific organelles and evaluate their outputs in relation to CQAs for each organelle. As it will be seen, the range of applications and analysis tools available for morphological cell profiling presents challenges in the determination of concise morphological parameters, which are comparable and traceable to a standard set of measurement values (Marklein et al., 2018).
3.1 Nuclei image analysis methodologies and tools
A broad range of automated image analysis tools and methods are available to researchers performing morphological cell analysis. A key feature of any nucleic analysis tool, is the accurate detection and segmentation of individual cell nuclei. Nuclei are frequently used as initial seed points for the detection of associated cell organelles in multi-parameter fluorescent images, meaning nuclei segmentation inaccuracies can propagate significant uncertainties throughout the analysis pipeline. Several factors such as cell type, confluency, stain homogeneity, and imaging methodology all influence the complexity of effective nuclei segmentation and present measurement challenges that need to be addressed. This is further complicated in particular cell types that commonly display polynucleation, such as HeLa cells, which has led to over-segmentation of individual cells. Furthermore, in densely populated cultures where cells often overlap, simplistic methods of analysis are often insufficient in accurately identifying individual nuclei. Several computational methodologies have been developed to address this issue, which employ the use of graph-cut, convex-concave, and contour analysis to segment overlapping or closely associated nuclei. These methodologies have been found to produce results which align more closely to manually identified nuclei counts (Zhou et al., 2019; Yi et al., 2019; Qi, 2014). Recent advances of incorporating deep learning algorithms into analytical tools have further enabled the automation of image analysis (Hollandi et al., 2022). This reduction in user input aids in the reduction of user analysis bias and improves interlaboratory comparability. However, the choice of input parameters and mathematical models used can impact AI-driven analysis, and further work is needed before fully unsupervised analysis can be fully relied upon.
Tools range in their complexity, from simplistic tools which require significant user input and quality control, to sophisticated tools which employ the use of machine-learning and training datasets. CellProfiler, a commonly used tool, employs minimum cross-entropy or OTSU thresholding methodologies combined with local maxima declumping to segment nuclei. These methods are effective for sparse cells with uniformly stained nuclei, however the declumping algorithms are limited when nuclei become closely associated in confluent cell samples. This inhibits the development of standardised pipelines due to the requirement for user quality assurance. Ilastik, an interactive machine-learning based tool, bridges the gap between pure user defined, and pure AI-driven analysis tools by allowing the user to define pixel classes and input examples of each class (Berg et al., 2019). Ilastik then assigns each pixel to a class using a Random Forest classifier. However, since pixel classification is computed from a spherical neighbourhood of pixels, object level shape characteristics are not considered, preventing segmentation of closely associated nuclei. Users are able to input segmentations obtained outside of Ilastik to overcome this limitation. Cellpose 2.0 presents a tool in which users can use either pre-trained or user-trained models to achieve cell and nuclei segmentation (Berg et al., 2019). A neural network is used to segment images based off as little as 100-200 user defined regions of interest, a significant reduction in the number of features generally required for the training of such complex models. The application of pre-trained models presents a potential means of standardising segmentation methodologies across multiple laboratories, provided that prior staining and imaging parameters remain constant. Ershov et al. have also developed an automated tracking software, TrackMate 7, which incorporates popular segmentation and analysis tools (MorphoLibJ, Weka, Ilastik, StarDist, and CellPose) into a complete FIJI plugin. This allows users to use complex segmentation and analysis approaches in a tool which is freely available and able to be continuously developed by users (Arganda-Carreras et al., 2017; Stevens et al., 2022; Legland et al., 2016; Jacquemet et al., 2020).
Typically, measurements outputs from nucleic analysis tools include shape (area, diameter, perimeter, and eccentricity) and intensity (mean, edge, integrated, and granularity). Measurements of shape are generally traceable to the S.I unit of meter, aside from circularity values, whereas intensity metrics are primarily expressed in arbitrary units which require comparison with reference material intensity values to produce standardised measurements. Principle component analysis (PCA) can be used to determine the relationship between each measurement to reduce the number of necessary metrics to a minimum essential set. These metrics are often sufficient for many purposes, such as the identification of condensed DNA in mitotic cells and fragmented DNA in apoptosis (Jevtić et al., 2014; Janssen et al., 2022). Simplistic shape and intensity measurements can, however, often overlook subtle variations in nucleic morphology which may allude to variations in bioactivity. As a result, analysis, and quantification of NE morphology has been of particular interest in morphological cell profiling (Schoen et al., 2017a). Janssen et al. has reviewed in further detail the current quantification methods for several nuclear abnormalities (Janssen et al., 2022b).
To overcome challenges associated with variations in nucleic morphology, Phillip et al. have developed the Visually Aided Morpho-Phenotyping Image Recognition (VAMPIRE) software tool for the quantification of cell nuclei and membrane morphologies (Phillip et al., 2021). This tool uses unsupervised, machine-learning based analysis and classification based on the fitting of equidistant points along cell and nuclear contours. This program demonstrated the potential of machine-learning to accurately identify, quantify, and classify nuclear shape through the use of contours. However, this quantification approach revealed that metrics such as solidity, aspect ratio, and shape factor are often insufficient in identifying morphological heterogeneity in cell nuclei and membranes. Moreover, VAMPIRE is unable to segment individual cells in an image, so it is reliant on additional analysis tools to perform this pre-processing. The accuracy of the data output from VAMPIRE is therefore heavily reliant on the effectiveness of the segmentation tool used and presents additional measurement uncertainty (Phillip et al., 2021). Driscoll et al. also developed a custom MATLAB code which analysed the mean negative curvature (MNC) of the nuclear shape using an active contour-based boundary extraction algorithm. This tool allows identification of irregular nuclei shapes caused by a disease which induced mutant Lamin A scaffolding and exhibit and outlines of blebbed and normal nuclei alongside measurement outputs of mean negative curvature analysis (Figure 1) (Driscoll et al., 2012). As with VAMPIRE, this approach presented a further limitation on impact variations in pixel size and smoothing have on the calculation of MNC. This presents additional challenges when looking to perform an interlaboratory comparison with multiple microscopes, highlighting the need for the standardisation of imaging methodologies.
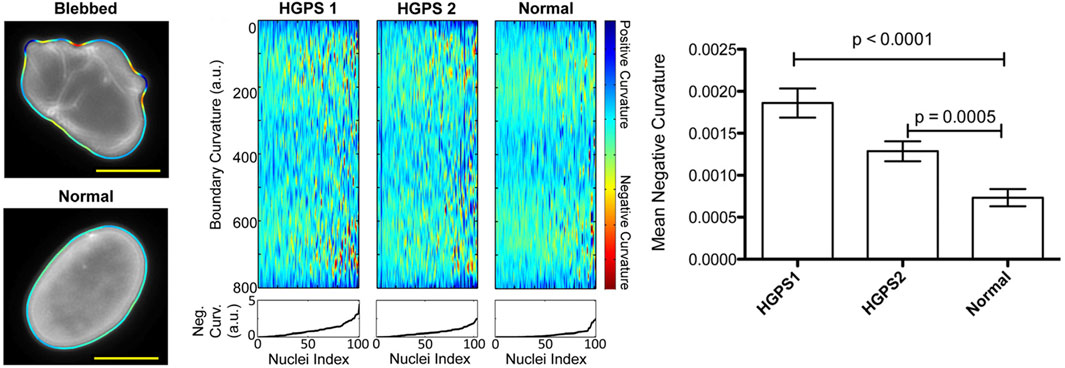
Figure 1. Overview of Driscoll’s mean negative curvature analysis showing identification of nuclei curvature for a blebbed, HGPS nucleus and normal, oval-shaped nucleus. Plots of boundary curvature are shown as heat maps with each vertical line corresponding to a single nuclear measurement. Mean negative curvatures for each type of nucleus are shown in the bar chart (Driscoll et al., 2012). Figures have been adapted from publications with permissions.
Automated image analysis tools have also been developed to quantify the degree of DNA damage within a nucleus. McDonough et al. developed a tool, which segments and classifies cell nuclei based on DNA fluorescence imaging with DNA damage-stained cells used as a training dataset (Mcdonough and Vadivazhagu, 2020). Outputs of this tool were separated into shape-based and texture-based features to determine the accuracy of each set of these features in the classification of cells with DNA damage. Haralick features are textural measurements based on grey-level intensities of pixels of an image, such as contrast, sum variance, difference variance, correlation, and entropy were all found to score highly as features which are capable of distinguishing between cellular classes (Haralick et al., 1979; Candelero et al., 2020). These features present metrics which may be considered as potential CQAs which could accompany shape-based features such as nuclei area and curvature measurements. This analysis technique, as a quantitative method for characterisation of 3D dosimetric distributions derived from clinical samples, demonstrates a potential application of texture-based image analysis. Overall, it is apparent that nuclear morphology can be analysed and quantified using a range of differing analysis tools which produce output metrics which vary in their complexity. The standardisation of measurement methodologies and reported values will be achieved through coordination between academic, industrial, and metrological research sectors.
3.2 Cell membrane image analysis methodologies and tools
In comparison with other cell structures, cell membrane morphological analysis can largely be performed without the use of specialised analysis tools. However, as with nuclei analysis, segmentation of cell membrane boundaries is key to achieving precise measurements of membrane morphology. Aforementioned tools, such as Cellpose 2.0, may also be required to segment cell membranes in densely populated images. Output metrics from cell membrane analysis consist of properties such as area, perimeter, and circularity, intensity, and edge intensity values (Mcquin et al., 2018; Schindelin et al., 2009; Berg et al., 2019). Laan et al. recently developed a CellProfiler-based pipeline for the analysis of cell nuclei, membrane, and organelles, known as OrganelleProfiler (Laan et al., 2023). Figure 2 depicts the image analysis workflow which uses tiered identification to identify primary (nuclei), secondary (cell), and tertiary (organelle) objects. Analysis of endothelial colony forming cells (ECFCs) exposed to cytoskeletal drugs demonstrated the pipelines’ ability to quantify variations in cell morphology through the analysis of multiple cell organelles. However, as described previously, CellProfiler is user-dependent and often requires manual inspection of output images to determine pipeline performance.
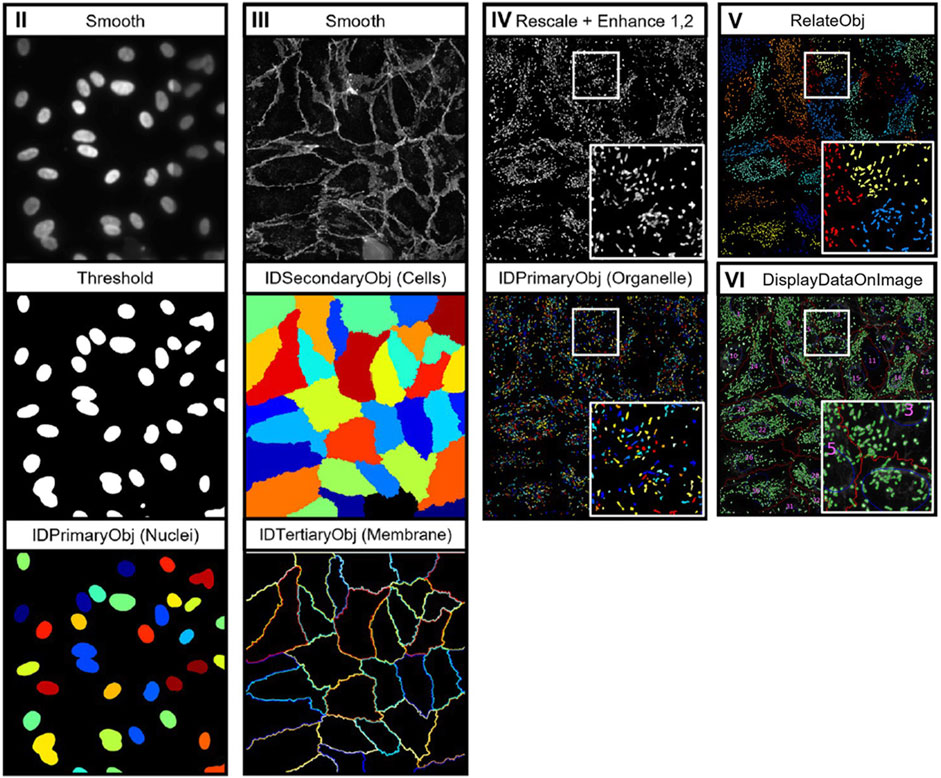
Figure 2. Depiction of the image analysis workflow for OrganelleProfiler. Individual organelle images are smoothed and thresholded, then primary (nuclei), secondary (cells), and tertiary (organelle) objects are identified using the associated CellProfiler modules. Tertiary objects are then related to individual cells as shown in image pane (V) (Laan et al., 2023). Images reproduced from publications with permissions.
Specialised membrane morphological analysis tools such as Automated Cell Morphology Extractor (ACME) and MorphoGraphX have been developed for the reconstruction of cell membrane images taken of larger tissue structures (Mosaliganti et al., 2012; Reuille et al., 2015). ACME was shown to accurately segment and reconstruct cell membrane shapes from both 2D and 3D dense tissue images. The analysis algorithms used in ACME were inspired by those used in MRI and CT imaging to detect blood vessels, implementing Hessian-based filters to identify eigenvectors associated with cell boundaries. Cell size and shape metrics output from this tool demonstrated improved quantification when compared to manual segmentation methods.
VAMPIRE, the previously discussed nucleic analysis tool, is also capable of analysing cell membrane morphologies and produces measurements of membrane curvature using the same methodology. PCA analysis is used to determine a minimum set of measurands which describe cell shape features. K-means clustering is then used to classify cells into several shape modes, resulting in the identification of distinctive membrane morphologies (Phillip et al., 2021). Chen et al. also explored the classification of cell membrane morphologies using a machine learning-based methodology to identify individual bone marrow stromal cell (BMSC) phenotypes (Chen et al., 2016). Twenty-2 cell shape metrics were evaluated across three categories were quantified and correlation coefficients were calculated for each metric. Support vector machine (SVM) classification was then used to find the optimal classification boundary that separates data points in the multidimensional shape metric space. This method allowed for reduction in the number of shape metrics required to fully ascertain differing cell phenotypes, effectively identifying key critical quality attributes associated with cell membrane morphology. Furthermore, the impact of single-cell morphological heterogeneity was minimised by training the SVM classifier using averaged shape metrics taken from a randomly selected subset of cells known as ‘supercell’ averaging. Together, this analysis methodology identifies phenotypic changes in BMSCs in response to a range of microenvironmental cues. Despite this, VAMPIRE and SVM-based classification tools lack the ability to segment individual cells in densely populated cultures. These techniques present a potential opportunity to combine analysis methodologies from ACME to produce a more comprehensive tool for the in-depth analysis of cell membrane morphologies.
In addition to standalone image analysis software, several microscopes offer built-in software analysis tools capable of analysing cell membrane morphologies such as Imaris (Oxford Instruments), Incucyte software (Sartorius), and NIS-Elements (Nikon) (Gautier and Ginsberg, 2021; Roddy et al., 2016; Walton, Hofmeyr, and Van Der Horst, 2013). One advantage of built-in software is the ability to automatically consider cell imaging modalities and directly report image metadata alongside morphological outputs. Imaris, in particular, offers sophisticated analysis capabilities, such as the ability to segment closely associated cellular membranes, track cell lineage, and visualise cell surfaces. Whilst advantageous to Imaris users, a comparison study between instrument and standalone analysis tools would be required to determine the variability of output parameters. This evaluation would elucidate limitations of each analytical technique for complex cell analysis. Several studies have begun such efforts, with commercially available tools such as Imaris have been compared to manual tools such as ImageJ and independently developed research tools (Nguyen and Thompson-Peer, 2021; Gautier and Ginsberg, 2021; Rose et al., 2023).
Distillation of the necessary values for cell membrane characterisation is dependent on the organelle stains being co-stained alongside cell membranes. When combined with nuclei and actin measurements, cell area and edge intensity are valuable outputs when aiming to classify apoptotic or mitotic cells, due to the confirmational membrane changes that occur during each of those processes. Circularity, the measurement of how close a cell is to a true circle, and eccentricity, the measurement of membrane curvature deviations from circularity, are additional key outputs that provide information regarding cell membrane invaginations and extensions. These values reflect cellular response to external stimuli (López-Hernández, 2021; Lee et al., 2023). Measurements of curvature (rads/m) are traceable to S.I units and circularity, whilst dimensionless, can be measured with respect to reference materials with a known circularity, such as spherical beads of a similar size. It has also been shown by Phillip et al., that nuclei curvature measurements combined with cell classification offers a single concise measurement parameter that encompasses the morphological information described by circularity and eccentricity measurements, therefore distilling the number of potential CQAs related to cell membrane morphology (Phillip et al., 2021).
3.3 Actin image analysis methodologies and tools
Effective identification of individual cell actin cytoskeletons is typically reliant on first identifying cell nuclei which then act as seed points for the identification and segmentation of actin cytoskeletons. Propagation segmentation methods simply propagate out from the seed points and stop at intensity boundaries - this can be acceptable for cells which are generally uniform and circular. For cells which show irregular cytoskeletal morphologies, such as fibroblasts or smooth muscle cells, it is more appropriate to use Watershed or Laplacian of Gaussian (LoG) segmentation methods which use edge detection methods to segment images. Watershed algorithms determine cell boundaries using Sobel transformed images which compute a gradient intensity image function that seeks to emphasise edge detection. In contrast, LoG algorithms first smooth an image with a Gaussian filter to reduce noise. A Laplacian operator is then performed that computes the second spatial derivative of an image to enhance edge detection. Several analysis workflows have been developed that primarily aim to improve cell segmentation using watershed-based methods (Kucharski and Fabijańska, 2021; Wang, 2019).
Analysis of actin morphologies using CellProfiler is limited due to the simplistic measurement output values. Metrics such as actin area, edge and integrated intensity, eccentricity, and granularity provide generalised measurements of actin morphologies, however, more specific measurements of filament distribution, branching, and bundling are unable to be acquired. Nevertheless, the use of primary nuclei objects and option of further tertiary objects such as stained cell membranes allow for the quantification of object relationships which may produce information on cell bioactivity using known relationships. For example, a cell undergoing mitosis which show condensed, bright nuclei along with a rounded, contracted actin cytoskeleton.
Several specialised analysis pipelines for the analysis of actin cytoskeletons have been developed that are capable of producing unique morphological indices. Alioscha-Perez et al. presented an actin analysis framework which focuses on individual filament morphological analysis (Alioscha-Perez et al., 2016). A three-step method was used to extract filament data which decomposed images into filament and texture components, then multi-scale line detector algorithm is applied to detect overlapping fibre segments from the basal and cap actin structures. Finally, filament segments were merged by overlapping segments with the same orientation connecting straight line segments according to their orientation difference up to a curvature threshold. This framework provides position, orientation, and length measurements of individual actin filaments. Figure 3a displays example images of the identification of individual, overlapping actin filaments using this analysis methodology.
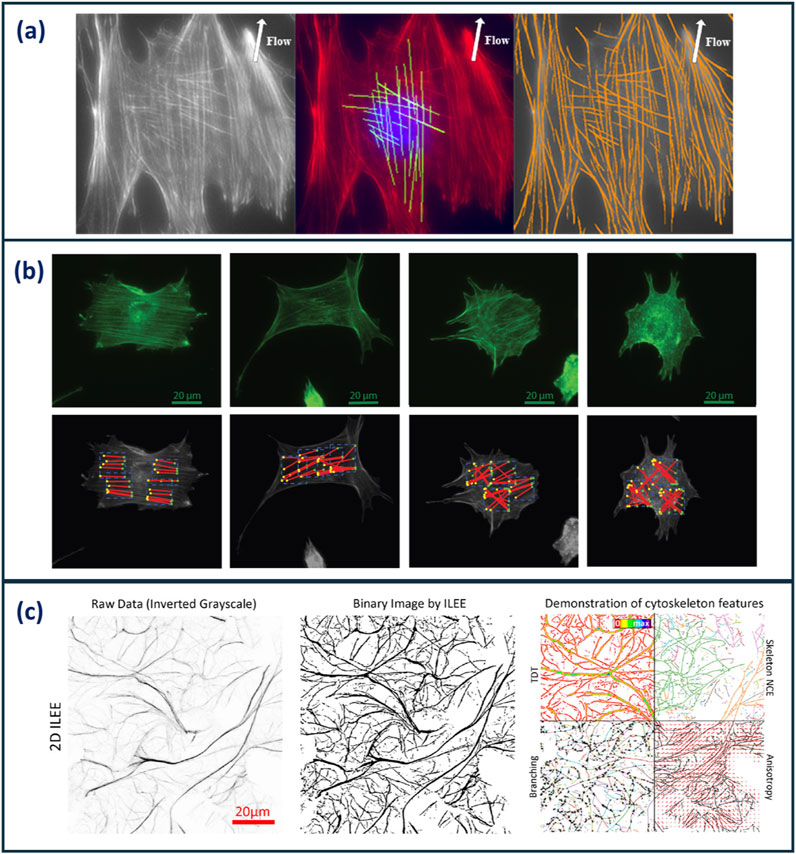
Figure 3. (a) Images demonstrating the identification of individual, overlapping actin filaments in Osteoblast cells using the actin analysis framework developed by Alioscha-Perez et al. Cells were grown under fluid shear stress to observe alignment of actin filaments (Alioscha-Perez et al., 2016) (b) Example images cells analysed using IRAQ. The red lines highlight actin filament detection in cells exposed to increasing concentrations of latrunculin B (left to right) (Liu, Mollaeian, and Ren, 2018). (c) Images demonstrating the analysis workflow of ILEE. The raw image is binarised, then a range of 3D and 3D cytoskeletal features are computed (Li et al., 2023). Images reproduced with permissions from respective publications.
Liu et al. (2018) developed an image-recognition based actin cytoskeleton quantification (IRAQ) methodology that uses edge, line, and brightness detection algorithms (Liu et al., 2018). Canny Edge and Sobel Edge detection algorithms are used to skeletonise actin images resulting in the output of three morphological parameters based on the orientation of the actin filaments: partial actin-cytoskeletal deviation (PAD), total actin-cytoskeletal deviation (TAD), and the average actin-cytoskeletal intensity (AAI). Figure 3b demonstrates fluorescent images of cells (top exposed to increasing concentrations of latrunculin B; a compound capable of perturbing the cytoskeleton). Below, actin filaments identified using IRAQ, demonstrates the ability of this tool to identify and quantify actin filament disruption. Weichsel et al. developed a similar actin analysis MATLAB-based code that quantifies stress fibres and the cortex at cell boundaries using a value known as Coherency. This value is defined through the structure tensor, which evaluates the local orientation in a small region of an image. This analysis tool particularly focuses on cell boundaries due to the limitations of optical microscopy in the identification of single actin fibres across an entire cell. This, in turn, allowed for high-throughput cell analysis resulting in robust statistical data (Weichsel et al., 2010).
Furthermore, Li et al. (2023) have recently developed an actin analysis algorithm employing the use of Implicit Laplacian of Enhanced Edge (ILEE) thresholding (Li et al., 2023). This sophisticated, unguided tool overcomes analysis limitations such as information loss from dimensional reduction, sample bias from manual user thresholding, and varying image performance from image quality. This algorithm is based on native brightness, first-order gradient derivative, and second-order Laplacian derivative characteristics of each input image. ILEE pipeline aims to automate the detection of cytoskeletons in an accurate unbiased manner. Figure 3c shows the outline of the ILEE workflow in which the raw image is binarised and used to compute a range of 2D and 3D cytoskeletal features. 12 cytoskeletal morphological indices are computed from this algorithm and categorised into five classes: density, bundling, connectivity, branching, and directionality. Whilst the complexity and comprehensiveness of this analysis tool is very effective at providing morphological information about actin cytoskeletons, it would be beneficial to distil down the number of output parameters and identify the CQAs required for cytoskeleton characterisation. Higaki et al. analysed the coefficient of variation of actin intensity as a means of describing the bundling of actin filaments. This was found to be comparable to skewness; the metric typically used to describe actin bundling. This demonstrates the ability of single metrics to describe multiple morphological features, reducing the number of indices required for characterisation (Higaki et al., 2020).
Overall, it is expected that a set of CQAs for cell actin morphology may consist of typical area and mean intensity data combined with specific indices acquired from the analysis tools described above. Filament length, density, and total number of nodes offer potential CQA values and are traceable to SI units of measurement (Daga et al., 2021). Values such as partial and total actin cytoskeletal deviation (PAD, TAD) may also be traced back to the SI unit of angular measurement, the radian, and can describe the directional organisation of the actin cytoskeleton with a single value. While Higaki et al. found that trend in bundling values largely agree with the coefficient of variation of actin intensity, to conclusively determine which actin output metrics are critical for the description of cell health, analysis of sample images set of known proliferative, apoptotic, and quiescent cells would be required (Higaki et al., 2020).
3.4 Mitochondria image analysis methodologies and tools
Improvements have been made in image processing algorithms and machine learning with several analysis pipelines being available for robust quantification of mitochondrial morphologies (Harwig et al., 2018). Current mitochondrial morphology analysis programmes have been developed as plugins for ImageJ and CellProfiler or are their own entity like MitoGraph and MitoER (Harwig et al., 2018). ImageJ has several different exclusive plugins including MiNa, MitoLoc, Mitochondrial Analyser and the Mitochondrial Morphology Macro (Valente et al., 2017; Hemel et al., 2021; Vowinckel et al., 2015; Chaudhry et al., 2020). The outputs of these plugins include number of fragments, mean area, and mean mitochondrial volume and in some instances, metrics describing mitochondrial branching. Branching is used as a method of describing the extent of mitochondrial networking, quantifying the amount of mitochondrial fission/fusion. Comparison of each of these analysis tools found that all were able to produce accurate outlines of the mitochondrial networks alongside measurement of the number of mitochondria. However, while measuring cellular mitochondrial clusters, MiNA, MitoLoc, and the Mitochondrial Morphology Macro were unable to separate mitochondrial structures. Due to integrated adaptive thresholding, Mitochondrial Analyzer was able to overcome the obstacle of incorrect segregation, recognising small structures within the mitochondrial network that are lost during filtering out the background signal thus, making it the most competent plug-in (Figure 4) (Hemel et al., 2021).
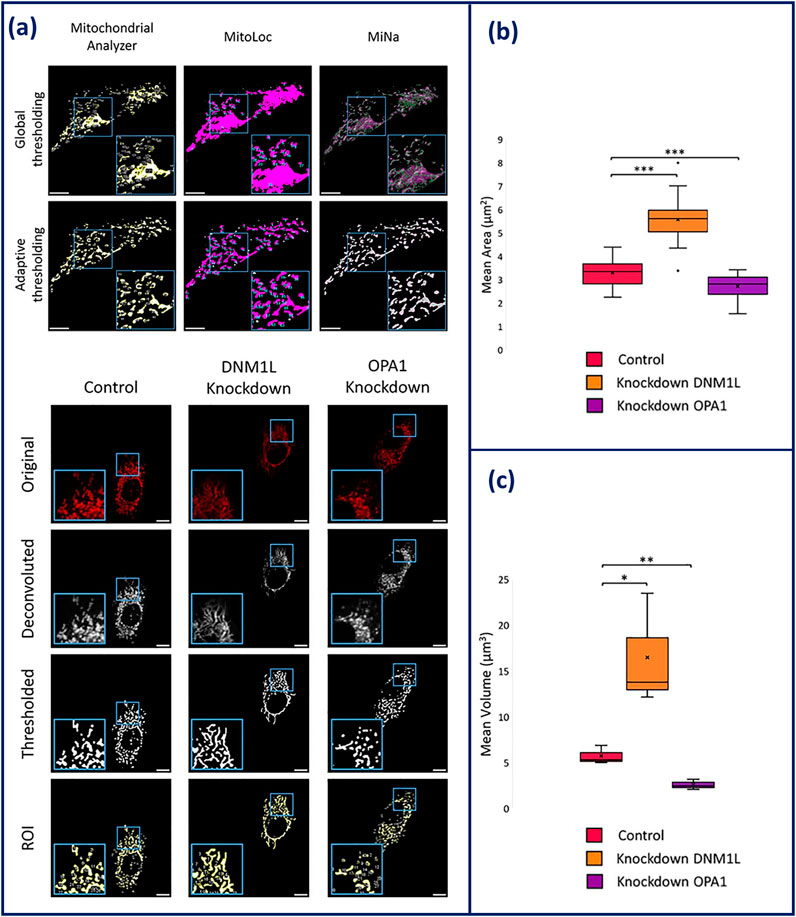
Figure 4. (a) Comparison of global and adaptive thresholding algorithms has on the effectiveness of mitochondrial network segregation within Mitochondrial Analyzer, MitoLoc, and MiNAa. (b) Overview of the imaging process of HeLa cells on Mitochondrial Analyzer. Elongation is shown in DNM1L knockdown cells and fragmentation is shown in OPA1 knockdown cells. (c) Statistical output of mitochondrial analyser showing mean area and volume of the mitochondria in knockdown conditions compared to control HeLa (Hemel et al., 2021). Figures have been adapted from publications with permission.
MitoGraph uses 3D images to measure individual mitochondrial structures as well as the volume of mitochondrial networking. Originally developed for quantifying mitochondrial volume in budding yeast, MitoGraph has more recently been validated to perform graph theory-based quantitative analysis of mitochondrial networks (Viana et al., 2015). This tool provides information about mitochondrial volume, total length, and degree of branching in the form of a connectivity score (Harwig et al., 2018). Although this software is validated against different cell lines, there are limitations to its success. It has been found that it fails to align 7.2% of nodes within the network and it struggles to segment the highly interconnected, often saturated perinuclear mitochondria. Despite its limitations, once optimised, it can batch analyse and can be a useful tool for high-throughput image analysis.
Along with MitoGraph, MitER is a newly developed open-source software which allows for the automated quantitative analysis of 3D mitochondrial morphology. The main outputs of the software include mitochondrial volume, surface area, and measurements related to inter-organelle contact focusing on contact with the mitochondria-endoplasmic reticulum (mito-ER). This software firstly utilises MitoGraph to process confocal images into single-cell 3D renderings. These renderings are processed in relation to the cell surface and input into MitER, where it is able produce quantifiable data on the mitochondria surface area, volume, spatial dimensions and number of Mito-ER contacts. For validation, quantifiable outputs were compared to MitoGraph outputs and were found to be agreeable with MitER benefiting from an automated workflow. Although this software has been optimised and validated for the measurement of mitochondrial morphology in yeast, the workflow has been adapted to mammalian cells. Mammalian cells pose the issue of irregular surfaces causing large rendering file sizes, ultimately causing slower analysis. To overcome this, a simpler mesh workflow is employed. With this modified workflow, the software was able to process mammalian images faster providing accurate morphological analysis (Kichuk et al., 2024).
Lastly, CellProfiler is an open-source software which allows users to identify key mitochondrial morphologies. As with actin, cell identification first requires nuclear staining, before segmentation and analysis of mitochondrial morphology. From this, CellProfiler can calculate the cytoplasmic area and determine mitochondrial networking and fragmentation. This program allows users to perform high-throughput analysis of mitochondrial images, but it has been shown to be less effective for acquiring data on extensive mitochondrial networking and is better suited in analysing fragmented mitochondria.
Overall, CQAs for mitochondrial morphological analysis may primarily include mean area, mean volume, and degree of branching. These outputs can provide data that is indicative of cell health and bioactivity based on mitochondrial morphology. For instance, this was shown when key genes related to mitochondrial morphology (OPA1 and DMN1L) were knocked-down, and morphological analysis tools were able to measure the impact of this knockdown. Upon knockdown of OPA1, fragmentation was observed and measured through the reduction in area and volume of the mitochondria. Whereas knockdown of DMN1L, presented an increase in area and volume, indicative of elongation demonstrated in Figure 4 (Hemel et al., 2021). By utilising mean volume and area of the mitochondria as a CQA, the measurement can be traced to the SI unit of meter, providing the prospective of standardisation measurement. This principle will be beneficial for future applications of mitochondrial morphological analysis, such as cancer detection and therapeutics (Chu et al., 2022).
4 Discussion and future Directions
This review has summarised the most notable analysis tools to characterise the nucleus, actin, mitochondria, and cell membrane structures. Key output metrics from each tool have been highlighted and assessed with reference to the identification of a concise set of measurable, quantifiable CQAs. Table 2 displays summary of each analysis tool, summarising their methodology, main output indices, and traceability to SI units. The review of cell analysis workflows revealed the initial challenge facing automated analysis tools is the effective segmentation of individual cell features. The extent of this challenge can be unique to each cell type and culture configuration but remains a crucial step in the analysis of individual cell profiles. Recent publications have shown that deep learning and AI-driven analysis tools are being developed to improve segmentation accuracy and reduce user analysis bias. However, there are considerable variations in the choice of deep learning algorithm and further alignment is required to encourage widespread adoption.
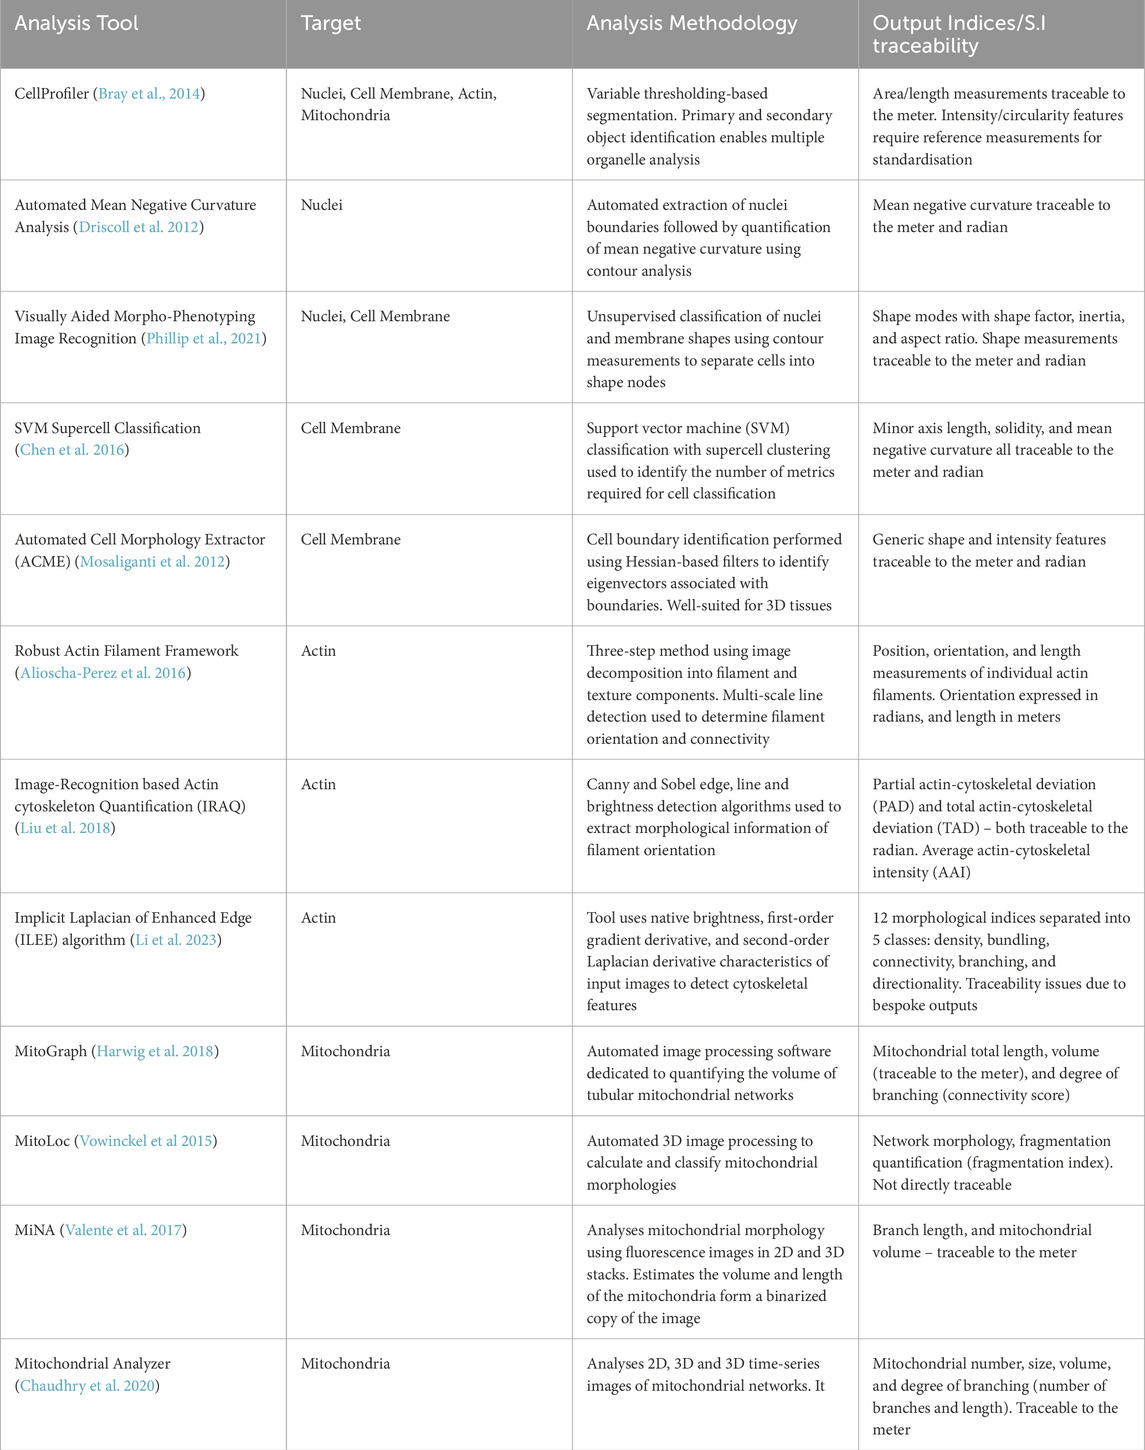
Table 2. Summary of the main analysis tools discussed throughout this review. Target organelle, analysis methodology, and main output indices are each described for each analysis tool.
The review of nucleic analysis methodologies has revealed that a detailed profile of cell nuclei and DNA morphology can be obtained through the combined used of DNA and Lamin A/C labelling and subsequent analysis of nuclear size, intensity, and nuclear membrane curvature (Driscoll et al., 2012; Phillip et al., 2021). Similarly, quantification of cell membrane morphology can be achieved using similar metrics due to variations in cell area and cell membrane curvature. Curvature offers a traceable quantity of measurement with units of m-1 due to its definition as the inverse of the radius of curvature. Circular rainbow beads offer a means of providing reference curvature and fluorescence measurements which also serves to validate analysis methodologies. Furthermore, the m-1 unit can be applied to measurements using the same analysis methodologies as those used for nuclei. Tools capable of analysing the morphology of multiple organelles using the same methodologies increases the likelihood of widespread adoption and offer an attractive option for users without specialised knowledge.
Actin cytoskeleton and mitochondrial network analysis tools display the most sophisticated analysis methodologies due to the morphological complexity these cell features display. Significant conformational changes occur in both actin and mitochondria in response to cell bioprocesses and external stimuli, posing a morphological measurement challenge but also the ability to determine well-defined values relating to cell bioactivity. Outputs from ILEE and IRAQ actin analysis tools indicate that filament length, density, and total number of nodes are crucial to fully evaluating actin network morphology (Liu et al., 2018; Li et al., 2023). Outputs from MitoGraph and Mitochondrial Analyzer analysis tools indicate that mitochondrial volume and degree of branching/connectivity are key parameters which must be quantified to describe network morphology (Harwig et al., 2018; Hemel et al., 2021). The primary challenge with the quantification of these metrics is ensuring that the image detail and quality is sufficient for analysis. The requirement for high magnification and resolution of cell images presents time limitations when aiming to morphologically profile a representative proportion of a cell population–particularly if 3D Z-stacks are required. The feasibility of using each of these tools, or analysis methodologies derived from these workflows, could be tested by analysing a series of images taken at a range of magnifications and resolutions to determine the minimum image quality required.
It is evident that there are a range of analysis methodologies and tools used to quantify the morphology of individual cell features. Several analysis tools here have been developed to fit a broad range of analysis requirements and can therefore be implemented to multiple cell profiling assays (Laan et al., 2023; Phillip et al., 2021). Conversely, multiple analysis tools have been developed for specific purposes, often aiming to quantify the morphology of organelles undergoing specific processes (Liu et al., 2018; Driscoll et al., 2012). Whilst several metrics output from the tools discussed here overlap, there is still a significant number of user-defined values unique to each tool. This presents challenges in the identification of a minimal set of critical quality attributes, to describe the state of a population of cells through their morphologies. Furthermore, machine learning and AI-driven analysis presents a promising future for rapid and accurate morphological image and data analysis, highlighted by the current development ISO standards related to the use of AI in digital pathology (ISO/AWI 24051-2) and the increase in publications employing the use of machine learning for image analysis (Tourlomousis et al., 2019; Tang et al., 2024). However, from a metrological perspective, there remains uncertainties associated with the ‘black-box’ nature of many of these analysis tools that need to be addressed to improve current workstreams (Chandrasekaran et al., 2021; Piccinini et al., 2017; Chen et al., 2016; Phillip et al., 2021).
Identification of superfluous or coinciding output metrics could be performed by analysing reference image sets with each analysis tool. Principal component and linear discriminant analysis could then be used to identify linear combinations of variables which describe similar morphological features. Applying analysis of reference data sets to a range of cell types and treatment conditions could establish a robust set of CQAs which are able to describe a range of cellular bioprocesses while also potentially providing routes to perform quality assessment once they become established. This unmet requirement also presents a future opportunity for interlaboratory comparison studies, such as those carried out by CAWG (within CCQM). Such studies could look to compare output metric values from identical images disseminated to multiple laboratories, then progress to dissemination of biological samples for morphological analysis and ultimately determine how such CQAs can be included in measurement uncertainty calculations to underpin metrological traceability. This work would further previous CCQM pilot studies which have focused on cell enumeration through analysis of nuclei morphology. Such studies would inform the development of ISO guidelines which would advise the wider scientific community on best practices for developing and reporting on morphological cell analysis assays. Ultimately, the aim of such studies would be the development of a standard set of cell images which serve as a calibration tool to aid morphological image analysis data traceability and reproducibility. Researchers currently developing such assays should first aim to follow appropriate QUAREP instrument standardisation guidelines and further ensure that reported morphological data is traceable to standardised units or appropriate material standards.
5 Conclusion
This review has highlighted several morphological analysis tools used to quantify the morphology of key cell features commonly considered in cell profiling studies. The range of image acquisition modalities, image analysis algorithms, and output metrics has highlighted the variation and lack of standardisation across morphological profiling in academic and industrial sectors. It is evident that further alignment of methodologies is required to facilitate data robustness and reproducibility. Candidate CQAs for each cell feature have been highlighted and evaluated with respect to their prevalence, traceability, and practicality. Moving forwards, it is suggested that the testing of each analysis tool with a candidate reference image set would further investigate the efficacy of each analysis tool and aid in the identification of a minimal set of concise cell morphological measurement parameters. In general, progress in this field will be led by metrological institutions in close collaboration with both academic and industrial research institutions to ensure the needs of both communities are met. Reference methodologies and materials will aim to be developed using international case studies to determine method robustness and data comparability. The generation of a standard set of cell images, such as those used throughout digital pathology, could also serve as a calibration tool which would aid data traceability and reproducibility and facilitate the widespread adoption of morphological cell profiling.
Author contributions
MB: Conceptualization, Methodology, Visualization, Writing – original draft, Writing – review and editing. LD: Conceptualization, Methodology, Visualization, Writing – original draft, Writing – review and editing. JH: Project administration, Supervision, Writing – review and editing, Conceptualization. JB: Project administration, Supervision, Writing – review and editing. JR: Conceptualization, Methodology, Supervision, Visualization, Writing – original draft, Writing – review and editing.
Funding
The author(s) declare that financial support was received for the research and/or publication of this article. This work was supported by the UK Government Department for Science, Innovation and Technology (DSIT) through the core chemical and biological metrology program.
Acknowledgments
The authors would like to thank University of Leeds Astbury Centre and Faculty of Bio-imaging and Flow Cytometry Facility in particular, Sally Boxall for the continued guidance and expertise. The authors would also like to thank Carole Foy for her support and guidance in reviewing the manuscript for journal submission.
Conflict of interest
Authors MB, LD, JH, JB and JR were employed by LGC Ltd., Teddington.
Generative AI statement
The author(s) declare that no Generative AI was used in the creation of this manuscript.
Publisher’s note
All claims expressed in this article are solely those of the authors and do not necessarily represent those of their affiliated organizations, or those of the publisher, the editors and the reviewers. Any product that may be evaluated in this article, or claim that may be made by its manufacturer, is not guaranteed or endorsed by the publisher.
References
Ahmadian, S., Lindsey, P. J., Smeets, H. J. M., van Tienen, F. H. J., and van Zandvoort, M. A. M. J. (2024). Spinning disk confocal microscopy for optimized and quantified live imaging of 3D mitochondrial network. Int. J. Mol. Sci. 25 (9), 4819. doi:10.3390/ijms25094819
Alioscha-Perez, M., Benadiba, C., Goossens, K., Kasas, S., Dietler, G., Willaert, R., et al. (2016). A robust actin filaments image analysis framework. PLoS Comput. Biol. 12 (8), 10050633–e1005123. doi:10.1371/journal.pcbi.1005063
Allocca, C., Lin-Gibson, S., Korter, M., and Paraecattil, A. (2024). ISO/TC 276/SC 1 - analytical methods. ISO. Available online at: https://www.iso.org/committee/10201756.html.
Arganda-Carreras, I., Kaynig, V., Rueden, C., Eliceiri, K. W., Schindelin, J., Cardona, A., et al. (2017). TRAINABLE WEKA SEGMENTATION USER MANUAL. Available online at: https://academic.oup.com/bioinformatics/article/33/15/2424/3092362.
Assefa, A. T., Verbist, B., Gustin, E., and Peeters, D. (2023). Automated quality control tool for high-content imaging data by building 2D prediction intervals on reference biosignatures. SLAS Discov. 28 (3), 111–117. doi:10.1016/j.slasd.2023.01.007
Bankhead, P. (2022). Developing image analysis methods for digital pathology. J. Pathology 257 (4), 391–402. doi:10.1002/path.5921
Berg, S., Kutra, D., Kroeger, T., Straehle, C. N., Kausler, B. X., Haubold, C., et al. (2019). Ilastik: interactive machine learning for (Bio)Image analysis. Nat. Methods 16 (12), 1226–1232. doi:10.1038/s41592-019-0582-9
Bissenova, S., Buitinga, M., Boesch, M., Korf, H., Casteels, K., Teunkens, An, et al. (2023). High-throughput analysis of neutrophil extracellular trap levels in subtypes of people with type 1 diabetes. Biology 12 (6), 882–913. doi:10.3390/biology12060882
Bonte, T., Philbert, M., Coleno, E., Bertrand, E., Imbert, A., and Walter, T. (2023). Learning with minimal effort: leveraging in silico labeling for cell and nucleus segmentation. Lect. Notes Comput. Sci. Incl. Subser. Lect. Notes Artif. Intell. Lect. Notes Bioinforma. 13804 LNCS, 423–436. doi:10.1007/978-3-031-25069-9_28
Brand, A., Singer, K., Koehl, G. E., Kolitzus, M., Schoenhammer, G., Thiel, A., et al. (2016). LDHA-associated lactic acid production blunts tumor immunosurveillance by T and NK cells. Cell Metab. 24 (5), 657–671. doi:10.1016/j.cmet.2016.08.011
Bray, M. A., Gustafsdottir, S. M., Rohban, M. H., Singh, S., Ljosa, V., Sokolnicki, K. L., et al. (2017). A dataset of images and morphological profiles of 30 000 small-molecule treatments using the cell painting assay. GigaScience 6 (12), 1–5. doi:10.1093/gigascience/giw014
Bray, M. A., Singh, S., Han, H., Davis, C. T., Borgeson, B., Hartland, C., et al. (2014). Cell painting, a high-contant image-based assay for morphological profiling using multiplexed fluroescent dyes. Nat. Protoc. 176 (8), 139–148. doi:10.1038/nprot.2016.105
Candelero, D., Roberto, G. F., Zanchetta Do Nascimento, M., Rozendo, G. B., and Neves, L. A. (2020). Selection of CNN, haralick and fractal features based on evolutionary algorithms for classification of histological images. Proc. - 2020 IEEE Int. Conf. Bioinforma. Biomed. BIBM 2020, 2709–2716. doi:10.1109/BIBM49941.2020.9313328
Ccqm, CAWG (2021). Consultative committee for amount of substance; metrology in chemistry and biology CCQM working group on isotope ratios (IRWG) strategy for rolling programme development (2021-2030). Available online at: https://www.iaea.org/services/networks/gnip.
Chandrasekaran, S. N., Ceulemans, H., Boyd, J. D., and Carpenter, A. E. (2021). Image-based profiling for drug discovery: due for a machine-learning upgrade? Nat. Rev. Drug Discov. 20 (2), 145–159. doi:10.1038/s41573-020-00117-w
Chaudhry, A., Shi, R., and Luciani, D. S. (2020). A pipeline for multidimensional confocal analysis of mitochondrial morphology, function, and dynamics in pancreatic β-cells. Am. J. Physiology - Endocrinol. Metabolism 318 (2), E87–E101. doi:10.1152/ajpendo.00457.2019
Chen, D., Sarkar, S., Candia, J., Florczyk, S. J., Bodhak, S., Driscoll, M. K., et al. (2016). Machine learning based methodology to identify cell shape phenotypes associated with microenvironmental cues. Biomaterials 104, 104–118. doi:10.1016/j.biomaterials.2016.06.040
Chu, C. H., Wen, W. T., Hsu, C. M., and An, C. W. (2022). Image analysis of the mitochondrial network morphology with applications in cancer research. Front. Phys. 10 (April), 1–16. doi:10.3389/fphy.2022.855775
Cimini, B. A., Chandrasekaran, S. N., Kost-Alimova, M., Miller, L., Goodale, A., Fritchman, B., et al. (2023). Optimizing the cell painting assay for image-based profiling. Nat. Protoc. 18 (7), 1981–2013. doi:10.1038/s41596-023-00840-9
Correa de Sampaio, P., Auslaender, D., Krubasik, D., Virgilio Failla, A., Skepper, J. N., Murphy, G., et al. (2012). A heterogeneous in vitro three dimensional model of tumour-stroma interactions regulating sprouting angiogenesis. PLoS ONE 7 (2), e30753. doi:10.1371/journal.pone.0030753
Cossarizza, A., Chang, H. D., Radbruch, A., Abrignani, S., Addo, R., Akdis, M., et al. (2021). Guidelines for the use of flow cytometry and cell sorting in immunological studies (third edition). Eur. J. Immunol. 51 (12), 2708–3145. doi:10.1002/eji.202170126
Daga, K. R., Priyadarshani, P., Larey, A. M., Rui, K., Mortensen, L. J., and Marklein, R. A. (2021). Shape up before you ship out: morphology as a potential critical quality attribute for cellular therapies. Curr. Opin. Biomed. Eng. 20 (21), 100352. doi:10.1016/j.cobme.2021.100352
Daniel, C., Traub, F., Sachsenmaier, S., Rosa, R., Moritz, M., Konrads, C., et al. (2023). An exploratory study of cell stiffness as a mechanical label-free biomarker across multiple musculoskeletal sarcoma cells. BMC Cancer 23 (1), 862–912. doi:10.1186/s12885-023-11375-3
Demuynck, R., Efimova, I., Lin, A., Declercq, H., and Krysko, D. v. (2020). A 3D cell death assay to quantitatively determine ferroptosis in spheroids. Cells 9 (3), 703. doi:10.3390/cells9030703
Denz, M., Chiantia, S., Herrmann, A., Mueller, P., Korte, T., and Schwarzer, R. (2017). Cell cycle dependent changes in the plasma membrane organization of mammalian cells. Biochimica Biophysica Acta - Biomembr. 1859 (3), 350–359. doi:10.1016/j.bbamem.2016.12.004
DeRose, P. C., Wang, L., Gaigalas, A. K., Kramer, G. W., Resch-Genger, U., and Panne, U. (2008). “Need for and metrological approaches towards standardization of fluorescence measurements from the view of national metrology institutes,” in Standardization and quality assurance in fluorescence measurements I (Springer Berlin Heidelberg), 33–62. doi:10.1007/4243_2008_049
Desai, S., Sander, G., Westerlo, E. van de, Lauwen, S., Paters, A., Prehn, J. H. M., et al. (2024). Performance of TMRM and mitotrackers in mitochondrial morphofunctional analysis of primary human skin fibroblasts. Biochimica Biophysica Acta - Bioenergetics 1865 (2), 149027. doi:10.1016/j.bbabio.2023.149027
Douthwright, S., and Sluder, G. (2017). “Live cell imaging: assessing the phototoxicity of 488 and 546 Nm light and methods to alleviate it.” J. Cell. Physiology 232 (9): 2461–2468. doi:10.1002/jcp.25588
Driscoll, M. K., Albanese, J. L., Xiong, Z. M., Mailman, M., Losert, W., and Cao, K. (2012). Automated image analysis of nuclear shape: what can we learn from a prematurely aged cell? Aging 4 (2), 119–132. doi:10.18632/aging.100434
Faklaris, O., Bancel-Vallée, L., Dauphin, A., Monterroso, B., Frère, P., Geny, D., et al. (2022). Quality assessment in light microscopy for routine use through simple tools and robust metrics. J. Cell Biol. 221 (11), e202107093. doi:10.1083/jcb.202107093
Faruqui, N., Kummrow, A., Fu, B., Divieto, C., Rojas, F., Kisulu, F., et al. (2020). Cellular metrology: scoping for a value proposition in extra- and intracellular measurements. Front. Bioeng. Biotechnol. 7 (January), 456–458. doi:10.3389/fbioe.2019.00456
Fischer, A. H., Jacobson, K. A., Rose, J., and Zeller, R. (2008). “Fixation and permeabilization of cells and tissues,” in Cold spring harbor protocols 2008, pdb–top36.5
Fischer, E. G. (2020). Nuclear morphology and the biology of cancer cells. Acta Cytol. 64 (6), 511–519. doi:10.1159/000508780
Garcia-Fossa, F., Costa Cruz, M., Haghighi, M., Bispo de Jesus, M., Singh, S., Carpenter, A. E., et al. (2023). Interpreting image-based profiles using similarity clustering and single-cell visualization. Curr. Protoc. 3 (3), e713. doi:10.1002/cpz1.713
Gauthier, B. R., and Valentine, C. (2021). Nuclear envelope integrity in health and disease: consequences on genome instability and inflammation. Int. J. Mol. Sci. 22 (14), 7281. doi:10.3390/ijms22147281
Gautier, M. K., and Ginsberg, S. D. (2021). A method for quantification of vesicular compartments within cells using 3D reconstructed confocal Z-stacks: comparison of ImageJ and Imaris to count early endosomes within basal forebrain cholinergic neurons. J. Neurosci. Methods 350 (February), 109038. doi:10.1016/j.jneumeth.2020.109038
Goldberg, I. G., Allan, C., Burel, J. M., Creager, D., Falconi, A., Hochheiser, H., et al. (2005). The open microscopy environment (OME) data model and XML file: open tools for informatics and quantitative analysis in biological imaging. Genome Biol. 6 (5), R47. doi:10.1186/gb-2005-6-5-r47
Gosak, M., Milojević, M., Duh, M., Skok, K., and Perc, M. (2022). Networks behind the morphology and structural design of living systems. Phys. Life Rev. 41, 1–21. doi:10.1016/j.plrev.2022.03.001
Hammer, M., Huisman, M., Rigano, A., Boehm, U., Chambers, J. J., Gaudreault, N., et al. (2021). Towards community-driven metadata standards for light microscopy: tiered specifications extending the OME model. Nat. Methods 18 (12), 1427–1440. doi:10.1038/s41592-021-01327-9
Haralick, R. M., Sternberg, S. R., and Zhuang, X. (1979). “Image algebra using mathematical morphology,” in ILEE Transaction on pattern Analysis and machine intelligence PAMI-9, 8–9.
Harwig, M. C., Viana, M. P., Egner, J. M., Harwig, J. J., Widlansky, M. E., Rafelski, S. M., et al. (2018). Methods for imaging mammalian mitochondrial morphology: a prospective on MitoGraph. Physiology and Behav. 46, 81–99. doi:10.1016/j.ab.2018.02.022
Hemel, I. M. G. M., Engelen, B. P. H., Luber, N., and Gerards, M. (2021). A hitchhiker’s guide to mitochondrial quantification. Mitochondrion 59 (May), 216–224. doi:10.1016/j.mito.2021.06.005
Herrera, E. L., Azzam, S. Z., Berger, M. C., and Diaz-Martinez, L. A. (2018). Genomic heterogeneity meets cellular energetics: crosstalk between the mitochondria and the cell cycle. J. Cancer Metastasis Treat. 4 (8), 42. doi:10.20517/2394-4722.2018.35
Higaki, T., Akita, K., and Katoh, K. (2020). Coefficient of variation as an image-intensity metric for cytoskeleton bundling. Sci. Rep. 10 (1), 22187–22213. doi:10.1038/s41598-020-79136-x
Hollandi, R., Moshkov, N., Paavolainen, L., Tasnadi, E., Piccinini, F., and Horvath, P. (2022). Nucleus segmentation: towards automated solutions. Trends Cell Biol. 32 (4), 295–310. doi:10.1016/j.tcb.2021.12.004
Hoppe, M. M., Jaynes, P., Wardyn, J. D., Upadhyayula, S. S., Tan, T. Z., Lie, S., et al. (2021). Quantitative imaging of RAD51 expression as a marker of platinum resistance in ovarian cancer. EMBO Mol. Med. 13 (5), 133666–e13412. doi:10.15252/emmm.202013366
Huang, Y., Bell, J., Kuksin, D., Sarkar, S., Pierce, L. T., Newton, D., et al. (2021). Practical application of cell counting method performance evaluation and comparison derived from the ISO cell counting standards Part 1 and 2. Cell Gene Ther. Insights 7 (9), 937–960. doi:10.18609/cgti.2021.126
ISO (2019). ISO 21073:2019 - microscopes — confocal microscopes — optical data of fluorescence confocal microscopes for biological imaging. Available online at: https://www.iso.org/standard/69820.html.
ISO (2025a). ISO/AWI 24051-2. Part 2: digital pathology and artificial intelligence (AI)-Based image analysis. Available online at: https://www.iso.org/standard/87674.html.
ISO (2025b). ISO/CD 23511 - biotechnology — general requirements and considerations for cell line authentication. Available online at: https://www.iso.org/standard/87312.html.
Jacquemet, G., Fazeli, E., Roy, N. H., Follain, G., Laine, R. F., von Chamier, L., et al. (2020). Automated cell tracking using StarDist and TrackMate. F1000Res. 9, 1279. doi:10.12688/f1000research.27019.1
Janssen, A. F. J., Breusegem, S. Y., and Larrieu, D. (2022). Current methods and pipelines for image-based quantitation of nuclear shape and nuclear envelope abnormalities. Cells 11 (3), 347. doi:10.3390/cells11030347
Jevtić, P., Edens, L. J., Vuković, L. D., and Levy, D. L. (2014). Sizing and shaping the nucleus: mechanisms and significance. Curr. Opin. Cell Biol. 28 (1), 16–27. doi:10.1016/j.ceb.2014.01.003
Jokhadar, Š. Z., Iturri, J., Toca-Herrera, J. L., and Derganc, J. (2021). Cell stiffness under small and large deformations measured by optical tweezers and atomic force microscopy: effects of actin disruptors CK-869 and jasplakinolide. J. Phys. D Appl. Phys. 54 (12), 124001. doi:10.1088/1361-6463/abd0ae
Kang, J., Hsu, C. H., Qi, Wu, Liu, S., Coster, A. D., Posner, B. A., et al. (2016). Improving drug discovery with high-content phenotypic screens by systematic selection of reporter cell lines. Nat. Biotechnol. 34 (1), 70–77. doi:10.1038/nbt.3419
Katiyar, A., Zhang, J., Antani, J. D., Yu, Y., Scott, K. L., Lele, P. P., et al. (2022). The nucleus bypasses obstacles by deforming like a drop with surface tension mediated by Lamin A/C. Adv. Sci. 9 (23), 22012488–e2201314. doi:10.1002/advs.202201248
Kichuk, T., Dhamankar, S., Malani, S., Hofstadter, W. A., Wegner, S. A., Cristea, I. M., et al. (2024). Using MitER for 3D analysis of mitochondrial morphology and ER contacts. Cell Rep. Methods 4 (1), 100692. doi:10.1016/j.crmeth.2023.100692
Kucharski, A., and Fabijańska, A. (2021). CNN-watershed: a watershed transform with predicted markers for corneal endothelium image segmentation. Biomed. Signal Process. Control 68 (October 2020), 102805. doi:10.1016/j.bspc.2021.102805
Kumari, A., Kesarwani, S., Javoor, M. G., Vinothkumar, K. R., and Sirajuddin, M. (2020). Structural insights into actin filament recognition by commonly used cellular actin markers. EMBO J. 39 (14), e104006–e104013. doi:10.15252/embj.2019104006
Laan, S. N. J., Dirven, R. J., Bürgisser, P. E., Eikenboom, J., and Bierings, R.SYMPHONY consortium (2023). Automated segmentation and quantitative analysis of organelle morphology, localization and content using CellProfiler. PLoS ONE 18 (6 June), e0278009–e0278018. doi:10.1371/journal.pone.0278009
Lee, Ga E., Byun, J., Lee, C. J., and Cho, Y. Y. (2023). Molecular mechanisms for the regulation of nuclear membrane integrity. Int. J. Mol. Sci. 24 (20), 15497. doi:10.3390/ijms242015497
Leemreis, J. R., Versteilen, A. M. G., Sipkema, P., Johan Groeneveld, A. B., and Musters, R. J. P. (2006). Digital image analysis of cytoskeletal F-actin disintegration in renal microvascular endothelium following ischemia/reperfusion. Cytom. Part A 69 (9), 973–978. doi:10.1002/cyto.a.20269
Legland, D., Arganda-Carreras, I., and Andrey, P. (2016). MorphoLibJ: integrated library and plugins for mathematical morphology with ImageJ. Bioinformatics 32 (22), 3532–3534. doi:10.1093/bioinformatics/btw413
Li, P., Zhang, Ze, Tong, Y., Foda, B. M., and Day, B. (2023). ILEE: algorithms and toolbox for unguided and accurate quantitative analysis of cytoskeletal images. J. Cell Biol. 222 (2), e202203024. doi:10.1083/jcb.202203024
Lin-Gibson, S., Sarkar, S., and Ito, Y. (2016). Defining quality attributes to enable measurement assurance for cell therapy products. Cytotherapy 18 (10), 1241–1244. doi:10.1016/j.jcyt.2016.07.002
Liu, S., Miné-Hattab, J., Villemeur, M., Guerois, R., Pinholt, H. D., Mirny, L. A., et al. (2023). In vivo tracking of functionally tagged Rad51 unveils a robust strategy of homology search. Nat. Struct. Mol. Biol. 30, 1582–1591. doi:10.1038/s41594-023-01065-w
Liu, Yi, Mollaeian, K., and Ren, J. (2018). An image recognition-based approach to actin cytoskeleton quantification. Electron. Switz. 7 (12), 443. doi:10.3390/electronics7120443
Liu, Z., Hirata-Miyasaki, E., Pradeep, S., Rahm, J., Foley, C., Chandler, T., et al. (2024). Robust virtual staining of landmark organelles. doi:10.1101/2024.05.31.596901
López-Hernández, F. J. (2021). Cell surface area to volume relationship during apoptosis and apoptotic body formation. Cell. Physiology Biochem. 55, 161–170. doi:10.33594/000000369
Manning, J. C., Antonio, R., Habermann, F. A., Caballero, G. G., Kaltner, H., and Gabius, H. J. (2017). Lectins: a primer for histochemists and cell biologists. Histochem. Cell Biol. 147 (2), 199–222. doi:10.1007/s00418-016-1524-6
Marklein, R. A., Lam, J., Guvendiren, M., Sung, K. E., and Bauer, S. R. (2018). Functionally-relevant morphological profiling: a tool to assess cellular heterogeneity. Trends Biotechnol. 36 (1), 105–118. doi:10.1016/j.tibtech.2017.10.007
Mascalchi, P., and Cordelieres, F. P. (2019). “Which elements to build Co-localisation workflows? From metrology to analysis,” in Computer optimized microscopy, 177–213. Available online at: http://www.springer.com/series/7651.
Mazloom-Farsibaf, H., Farzam, F., Fazel, M., Wester, M. J., Meddens, M. B. M., and Lidke, K. A. (2021). Comparing Lifeact and phalloidin for superresolution imaging of actin in fixed cells. PLoS ONE 16 (1 January), e0246138. doi:10.1371/journal.pone.0246138
McKayed, K. K., and Simpson, J. C. (2013). Actin in action: imaging approaches to study cytoskeleton structure and function. Cells 2 (4), 715–731. doi:10.3390/cells2040715
Mcquin, C., Goodman, A., Chernyshev, V., Kamentsky, L., Cimini, A., Karhohs, K. W., et al. (2018). Cellprofiler 3.0. PLoS Biol., 1–17. doi:10.1371/journal.pbio.2005970
Mishra, P., Martin, D. C., Androulakis, I. P., and Moghe, P. V. (2019). Fluorescence imaging of actin turnover parses early stem cell lineage divergence and senescence. Sci. Rep. 9 (1), 10377–10412. doi:10.1038/s41598-019-46682-y
Montero Llopis, P., Senft, R. A., Ross-Elliott, T. J., Stephansky, R., Keeley, D. P., Koshar, P., et al. (2021). Best practices and tools for reporting reproducible fluorescence microscopy methods. Nat. Methods 18 (12), 1463–1476. doi:10.1038/s41592-021-01156-w
Morgan, G. W., Kail, M., Hollinshead, M., and Vaux, D. J. (2013). Combined biochemical and cytological analysis of membrane trafficking using lectins. Anal. Biochem. 441 (1), 21–31. doi:10.1016/j.ab.2013.05.034
Mosaliganti, K. R., Noche, R. R., Xiong, F., Swinburne, I. A., and Megason, S. G. (2012). ACME: automated cell morphology extractor for comprehensive reconstruction of cell membranes. PLoS Comput. Biol. 8 (12), e1002780. doi:10.1371/journal.pcbi.1002780
Nair, S., Cairncross, S., Miles, X., Engelbrecht, M., du Plessis, P., Bolcaen, J., et al. (2021). An automated microscopic scoring method for the γ-H2AX foci assay in human peripheral blood lymphocytes. J. Vis. Exp. 2021 (178). doi:10.3791/62623
Nasufovic, V., Kompa, J., Lindamood, H. L., Blümke, M., Koch, B., Le-vario-Diaz, V., et al. (2025). SiR-XActin: a fluorescent probe for imaging actin dynamics in live cells. bioRxiv., doi:10.1101/2025.02.04.636537
Nelson, G., Boehm, U., Bagley, S., Bajcsy, P., Bischof, J., Brown, C. M., et al. (2021). QUAREP-LiMi: a community-driven initiative to establish guidelines for quality assessment and reproducibility for instruments and images in light microscopy. J. Microsc. 284 (1), 56–73. doi:10.1111/jmi.13041
NEQAS, UK (2024). UK NEQAS. Available online at: https://www.ukneqasli.co.uk/eqa-pt-programmes/flow-cytometry-programmes/.
Nguyen, C., and Thompson-Peer, K. L. (2021). Comparing automated morphology quantification software on dendrites of uninjured and injured Drosophila neurons. Neuroinformatics 19, 703–717. doi:10.1007/s12021-021-09532-9
Oakley, D. H., Klickstein, N., Commins, C., Chung, M., Simon, D., Bennett, R. E., et al. (2021). Continuous monitoring of tau-induced neurotoxicity in patient-derived IPSC-neurons. J. Neurosci. 41 (19), 4335–4348. doi:10.1523/JNEUROSCI.2590-20.2021
Ojha, A., and Ojha, N. K. (2021). Excitation light-induced phototoxicity during fluorescence imaging. J. Biosci. 46 (3), 78. doi:10.1007/s12038-021-00193-z
Okkelman, I. A., Papkovsky, D. B., and Dmitriev, R. I. (2020). Estimation of the mitochondrial membrane potential using fluorescence lifetime imaging microscopy. Cytom. Part A 97 (5), 471–482. doi:10.1002/cyto.a.23886
Otera, H., and Mihara, K. (2012). Mitochondrial dynamics: functional link with apoptosis. Int. J. Cell Biol. 2012, 821676. doi:10.1155/2012/821676
Pathak, R. U., Soujanya, M., and Mishra, R. K. (2021). Deterioration of nuclear morphology and architecture: a hallmark of senescence and aging. In Ageing Res. Rev. (Vol. 67). 101264, doi:10.1016/j.arr.2021.101264
Patil-Takbhate, B., Prasad Tripathy, S., and Harshavardhan, S. (2024). A narrative review on confocal laser scanning microscopy: principle, applications, advancements and challenges. J. Clin. DIAGNOSTIC Res. doi:10.7860/JCDR/2024/73869.20245
Phillip, J. M., Han, K. S., Chen, W. C., Wirtz, D., and Wu, P. H. (2021). A robust unsupervised machine-learning method to quantify the morphological heterogeneity of cells and nuclei. Nat. Protoc. 16 (2), 754–774. doi:10.1038/s41596-020-00432-x
Phinney, D. G. (2012). Functional heterogeneity of mesenchymal stem cells: implications for cell therapy. J. Cell. Biochem. 113 (9), 2806–2812. doi:10.1002/jcb.24166
Piccinini, F., Balassa, T., Abel, S., Molnar, C., Paavolainen, L., Kujala, K., et al. (2017). Advanced cell classifier: user-friendly machine-learning-based software for discovering phenotypes in high-content imaging data. Cell Syst. 4 (6), 651–655.e5. doi:10.1016/j.cels.2017.05.012
Pierce, L., Sarkar, S., Li-Ying Chan, L., Lin, Bo, and Qiu, J. (2021). Outcomes from a cell viability workshop: fit-for-purpose considerations for cell viability measurements for cellular therapeutic products. Cell Gene Ther. Insights 7 (4), 551–569. doi:10.18609/cgti.2021.076
Plant, A. L., Becker, C. A., Hanisch, R. J., Boisvert, R. F., Possolo, A. M., and Elliott, J. T. (2018). How measurement science can improve confidence in research results. PLoS Biol. 16 (4), 20042999–e2004307. doi:10.1371/journal.pbio.2004299
Plant, A. L., Locascio, L. E., May, W. E., and Gallagher, P. D. (2014). Improved reproducibility by assuring confidence in measurements in biomedical research. Nat. Methods 11 (9), 895–898. doi:10.1038/nmeth.3076
Poole, J. J. A., and Mostaço-guidolin, L. B. (2021). Optical microscopy and the extracellular matrix structure: a review. Cells. MDPI 10, 1760. doi:10.3390/cells10071760
Pospich, S., Merino, F., and Raunser, S. (2020). Structural effects and functional implications of phalloidin and jasplakinolide binding to actin filaments. Structure 28 (4), 437–449.e5. doi:10.1016/j.str.2020.01.014
Povea-Cabello, S., Oropesa-Ávila, M., Cruz-Ojeda, P. de la, Villanueva-Paz, M., De La Mata, M., Suárez-Rivero, J. M., et al. (2017). Dynamic reorganization of the cytoskeleton during apoptosis: the two coffins hypothesis. Int. J. Mol. Sci. 18 (11), 2393. doi:10.3390/ijms18112393
Purschke, M., Rubio, N., Held, K. D., and Redmond, R. W. (2010). Phototoxicity of Hoechst 33342 in time-lapse fluorescence microscopy. Photochem. Photobiological Sci. 9 (12), 1634–1639. doi:10.1039/c0pp00234h
Qi, J. (2014). Dense nuclei segmentation based on graph cut and convexity-concavity analysis. J. Microsc. 253 (1), 42–53. doi:10.1111/jmi.12096
Rai, Y., Pathak, R., Kumari, N., Kumar Sah, D., Pandey, S., Kalra, N., et al. (2018). Mitochondrial biogenesis and metabolic hyperactivation limits the application of MTT assay in the estimation of radiation induced growth inhibition. Sci. Rep. 8 (1), 1531–1615. doi:10.1038/s41598-018-19930-w
Rajagopal, D., Tian, L., Xiong, S., Wang, L., Campbell, J., Saraiva, L., et al. (2020). An accurate and rapid single step protocol for enumeration of cytokine positive T lymphocytes. J. Immunol. Regen. Med. 9, 100032. doi:10.1016/j.regen.2020.100032
Ren, W., Zhao, W., Cao, L., and Huang, J. (2021). Involvement of the actin machinery in programmed cell death. Front. Cell Dev. Biol. 8 (February), 634849. doi:10.3389/fcell.2020.634849
Reuille, P. B. de, Routier-Kierzkowska, A. L., Kierzkowski, D., Bassel, G. W., Schüpbach, T., Tauriello, G., et al. (2015). MorphoGraphX: a platform for quantifying morphogenesis in 4D. ELife 4 (MAY), 1–20. doi:10.7554/eLife.05864
Roddy, M., Nelson, T., Appledorn, D. M., and Groppi, V. (2016). Essens IncuCyte migration and invsion, 1–7.
Rose, S. E., Andrew Williams, C., Hailey, D. W., Mishra, S., Kirkland, A., Dirk Keene, C., et al. (2023). Advancements in high-resolution 3D microscopy analysis of endosomal morphology in postmortem alzheimer’s disease brains. Front. Neurosci. 17, 1321680. doi:10.3389/fnins.2023.1321680
Rothkamm, K., Barnard, S., Moquet, J., Ellender, M., Rana, Z., and Burdak-Rothkamm, S. (2010). DNA damage foci: meaning and significance. Environ. Mol. Mutagen. 405 (April), 391–405. doi:10.1002/em
Sage, D., Donati, L., Soulez, F., Fortun, D., Schmit, G., Seitz, A., et al. (2017). DeconvolutionLab2: an open-source software for deconvolution microscopy. Methods 115, 28–41. doi:10.1016/j.ymeth.2016.12.015
Sahu, S., Subhashree, P. S., and Chattopadhyay, A. (2024). Quantitation of F-actin in cytoskeletal reorganization: context, methodology and implications. Methods 230 (July), 44–58. doi:10.1016/j.ymeth.2024.07.009
Samanta, S., He, Y., Sharma, A., Kim, J., Pan, W., Yang, Z., et al. (2019). Fluorescent probes for nanoscopic imaging of mitochondria. Chem 5 (7), 1697–1726. doi:10.1016/j.chempr.2019.03.011
Sarkar, S., Lund, S. P., Vyzasatya, R., Vanguri, P., Elliott, J. T., Plant, A. L., et al. (2017). Evaluating the quality of a cell counting measurement process via a dilution series experimental design. Cytotherapy 19 (12), 1509–1521. doi:10.1016/j.jcyt.2017.08.014
Scheeder, C., Heigwer, F., and Boutros, M. (2018). Machine learning and image-based profiling in drug discovery. Curr. Opin. Syst. Biol. 10, 43–52. doi:10.1016/j.coisb.2018.05.004
Schindelin, J., Arganda-Carrera, I., Frise, E., Verena, K., Mark, L., Tobias, P., et al. (2009). Fiji - an open platform for biological image analysis. Nat. Methods 9 (7). doi:10.1038/nmeth.2019.Fiji
Schmied, C., Nelson, M. S., Avilov, S., Bakker, G. J., Bertocchi, C., Bischof, J., et al. (2023). Community-developed checklists for publishing images and image analyses. Nat. Methods 21, 170–181. doi:10.1038/s41592-023-01987-9
Schoen, I., Aires, L., Ries, J., and Vogel, V. (2017a). Nanoscale invaginations of the nuclear envelope: shedding new light on wormholes with elusive function. Nucleus 8 (5), 506–514. doi:10.1080/19491034.2017.1337621
Shannon, M. J., Eisman, S. E., Lowe, A. R., Tyler, S., and Mace, E. M. (2024). CellPLATO: an unsupervised method for identifying cell behaviour in heterogeneous cell trajectory data. J. Cell Sci. 137, jcs261887. doi:10.1242/jcs.261887
Shenkin, M., Babu, R., and Maiese, R. (2007). Accurate assessment of cell count and viability with a flow cytometer. Cytom. Part B - Clin. Cytom. 72 (5), 427–432. doi:10.1002/cyto.b.20179
Shimomura, T., Seino, R., Umezaki, K., Shimoda, A., Ezoe, T., Ishiyama, M., et al. (2021). New lipophilic fluorescent dyes for labeling extracellular vesicles: characterization and monitoring of cellular uptake. Bioconjugate Chem. 32 (4), 680–684. doi:10.1021/acs.bioconjchem.1c00068
Silva-Pedrosa, R., Salgado, A. J., and Ferreira, P. E. (2023). Revolutionizing disease modeling: the emergence of organoids in cellular systems. Cells 12 (6), 930. doi:10.3390/cells12060930
Simon, C. G., Lin-Gibson, S., Elliott, J. T., Sarkar, S., and Plant, A. L. (2016). Strategies for achieving measurement assurance for cell therapy products. Stem Cells Transl. Med. 5 (6), 705–708. doi:10.5966/sctm.2015-0269
Singh, S., Bray, M. A., Jones, T. R., and Carpenter, A. E. (2014). Pipeline for illumination correction of images for high-throughput microscopy. J. Microsc. 256 (3), 231–236. doi:10.1111/jmi.12178
Sivandzade, F., Bhalerao, A., and Cucullo, L. (2019). Analysis of the mitochondrial membrane potential using the cationic JC-1 dye as a sensitive fluorescent probe. Bio-Protocol 9 (1), 31288–e3213. doi:10.21769/BioProtoc.3128
Smoyer, C. J., and Jaspersen, S. L. (2014). Breaking down the wall: the nuclear envelope during mitosis. Curr. Opin. Cell Biol. 26 (1), 1–9. doi:10.1016/j.ceb.2013.08.002
Stebbings, R., Wang, L., Sutherland, J., Kammel, M., Gaigalas, A. K., John, M., et al. (2015). Quantification of cells with specific phenotypes I: determination of CD4+ cell count per microliter in reconstituted lyophilized human PBMC prelabeled with anti-CD4 FITC antibody. Cytom. Part A 87 (3), 244–253. doi:10.1002/cyto.a.22614
Stevens, M., Nanou, A., Terstappen, L. W. M. M., Driemel, C., Stoecklein, N. H., and Coumans, F. A. W. (2022). StarDist image segmentation improves circulating tumor cell detection. Cancers 14 (12), 2916. doi:10.3390/cancers14122916
Stirling, D. R., Swain-Bowden, M. J., Lucas, A. M., Carpenter, A. E., Cimini, B. A., and Goodman, A. (2021). CellProfiler 4: improvements in speed, utility and usability. BMC Bioinforma. 22 (1), 433–511. doi:10.1186/s12859-021-04344-9
Su, Z., Chen, Z., Ma, K., Chen, H., and Ho, J. W. K. (2022). Molecular determinants of intrinsic cellular stiffness in health and disease. Biophys. Rev. 14 (5), 1197–1209. doi:10.1007/s12551-022-00997-9
Takagi, T., Ueno, T., Ikawa, K., Asanuma, D., Nomura, Y., Uno, S.-N., et al. (2021). Discovery of an F-Actin-Binding small molecule serving as a fluorescent probe and a scaffold for functional probes. Sci. Adv. 7, eabg8585. doi:10.1126/sciadv.abg8585
Takahashi, M., Seino, R., Ezoe, T., Ishiyama, M., and Ueno, Y. (2020). Amphipathic fluorescent dyes for sensitive and long-term monitoring of plasma membranes. BioRxiv 2020, 11. doi:10.1101/2020.11.16.379206
Tamima, U., Sarkar, S., Islam, Md R., Shil, A., Kim, K. H., Reo, Ye J., et al. (2023). A small-molecule fluorescence probe for nuclear ATP. Angew. Chem. - Int. Ed. 62 (15), e202300580. doi:10.1002/anie.202300580
Tang, Q., Ratnayake, R., Seabra, G., Jiang, Z., Fang, R., Cui, L., et al. (2024). Morphological profiling for drug discovery in the era of deep learning. Briefings Bioinforma. 25 (4), bbae284. doi:10.1093/bib/bbae284
Thakur, S., Cattoni, D. I., and Nöllmann, M. (2015). The fluorescence properties and binding mechanism of SYTOX green, a bright, low photo-damage DNA intercalating agent. Eur. Biophysics J. 44 (5), 337–348. doi:10.1007/s00249-015-1027-8
Tourlomousis, F., Jia, C., Karydis, T., Mershin, A., Wang, H., Kalyon, D. M., et al. (2019). Machine learning metrology of cell confinement in melt electrowritten three-dimensional biomaterial substrates. Microsystems Nanoeng. 5 (1), 15. doi:10.1038/s41378-019-0055-4
Treiser, M. D., Yang, E. H., Gordonov, S., Cohen, D. M., Androulakis, I. P., Kohn, J., et al. (2010). Cytoskeleton-based forecasting of stem cell lineage fates. Proc. Natl. Acad. Sci. U. S. A. 107 (2), 610–615. doi:10.1073/pnas.0909597107
Valente, A. J., Maddalena, L. A., Robb, E. L., Moradi, F., and Stuart, J. A. (2017). A simple ImageJ Macro tool for analyzing mitochondrial network morphology in mammalian cell culture. Acta Histochem. 119 (3), 315–326. doi:10.1016/j.acthis.2017.03.001
Viana, M. P., Lim, S., and Rafelski, S. M. (2015). Quantifying mitochondrial content in living cells. Methods Cell Biol. 125, 77–93. doi:10.1016/bs.mcb.2014.10.003
Vincent, F., Nueda, A., Lee, J., Schenone, M., Prunotto, M., and Mercola, M. (2022). Phenotypic drug discovery: recent successes, lessons learned and new directions. Nat. Rev. Drug Discov. 21 (12), 899–914. doi:10.1038/s41573-022-00472-w
Vowinckel, J., Hartl, J., Butler, R., and Ralser, M. (2015). MitoLoc: a method for the simultaneous quantification of mitochondrial network morphology and membrane potential in single cells. Mitochondrion 24, 77–86. doi:10.1016/j.mito.2015.07.001
Wallace, W., Schaefer, L. H., Swedlow, J. R., and Biggs, D. (2025). Algorithms for deconvolution microscopy. Evident Sci. March 27. Available online at: https://evidentscientific.com/en/microscope-resource/knowledge-hub/digital-imaging/deconvolution/deconalgorithms.
Walton, S., Hofmeyr, M. D., and Van Der Horst, G. (2013). Accurate automated quantitative imaging of tortoise erythrocytes using the nis image analysis system. Biotech. Histochem. 88 (5), 242–249. doi:10.3109/10520295.2013.765594
Wang, Z. (2019). Cell segmentation for image cytometry: advances, insufficiencies, and challenges. Cytom. Part A 95 (7), 708–711. doi:10.1002/cyto.a.23686
Weichsel, J., Herold, N., Lehmann, M. J., Kräusslich, H. G., and Schwarz, U. S. (2010). A quantitative measure for alterations in the actin cytoskeleton investigated with automated high-throughput microscopy. Cytom. Part A 77 (1), 52–63. doi:10.1002/cyto.a.20818
Wernersson, E., Gelali, E., Girelli, G., Wang, Su, Castillo, D., Langseth, C. M., et al. (2024). Deconwolf enables high-performance deconvolution of widefield fluorescence microscopy images. Nat. Methods 21 (7), 1245–1256. doi:10.1038/s41592-024-02294-7
Wiesmann, V., Franz, D., Held, C., Münzenmayer, C., Palmisano, R., and Wittenberg, T. (2015). Review of free software tools for image analysis of fluorescence cell micrographs. J. Microsc. 257 (1), 39–53. doi:10.1111/jmi.12184
Yang, J., Hu, S., Bian, Y., Yao, J., Wang, D., Liu, X., et al. (2022). Targeting cell death: pyroptosis, ferroptosis, apoptosis and necroptosis in osteoarthritis. Front. Cell Dev. Biol. 9 (January), 789948–790018. doi:10.3389/fcell.2021.789948
Yi, J., Wu, P., Huang, Q., Qu, H., Liu, Bo, Hoeppner, D. J., et al. (2019). Multi-scale cell instance segmentation with keypoint graph based bounding boxes. Lect. Notes Comput. Sci. Incl. Subser. Lect. Notes Artif. Intell. Lect. Notes Bioinforma. 11764 LNCS, 369–377. doi:10.1007/978-3-030-32239-7_41
Yin, Y., and Shen, H. (2022). Common methods in mitochondrial research (Review). Int. J. Mol. Med. 50 (4), 126. doi:10.3892/ijmm.2022.5182
Zhang, Y., Chen, X., Gueydan, C., and Han, J. (2018). Plasma membrane changes during programmed cell deaths. Cell Res. 28 (1), 9–21. doi:10.1038/cr.2017.133
Zhang, Z., Lee, K. C. M., Siu, D. M. D., Lo, M. C. K., Lai, Q. T. K., Lam, E. Y., et al. (2023). Morphological profiling by high-throughput single-cell biophysical fractometry. Commun. Biol. 6 (1), 449–513. doi:10.1038/s42003-023-04839-6
Zhou, Y., Onder, O. F., Qi, D., Tsougenis, E., Chen, H., and Heng, P. A. (2019). CIA-net: robust nuclei instance segmentation with contour-aware information aggregation. Lect. Notes Comput. Sci. Incl. Subser. Lect. Notes Artif. Intell. Lect. Notes Bioinforma. 11492 LNCS, 682–693. doi:10.1007/978-3-030-20351-1_53
Zhukov, A., and Popov, V. (2023). Eukaryotic cell membranes: structure, composition, research methods and computational modelling. Int. J. Mol. Sci. 24 (13), 11226. doi:10.3390/ijms241311226
Ziegler, S., Sievers, S., and Waldmann, H. (2021). Morphological profiling of small molecules. Cell Chem. Biol. 28 (3), 300–319. doi:10.1016/j.chembiol.2021.02.012
Keywords: morphological cell analysis, critical quality attribute (CQA), metrology, traceability, standardisation
Citation: Bourn MD, Daly LF, Huggett JF, Braybrook J and Rivera JF (2025) Evaluation of image analysis tools for the measurement of cellular morphology. Front. Cell Dev. Biol. 13:1572212. doi: 10.3389/fcell.2025.1572212
Received: 07 February 2025; Accepted: 18 April 2025;
Published: 15 May 2025.
Edited by:
Denis Tsygankov, Georgia Institute of Technology, United StatesReviewed by:
Sylvain Monnier, Université Claude Bernard Lyon 1, FranceSara Hernández-Pérez, University College London, United Kingdom
Copyright © 2025 Bourn, Daly, Huggett, Braybrook and Rivera. This is an open-access article distributed under the terms of the Creative Commons Attribution License (CC BY). The use, distribution or reproduction in other forums is permitted, provided the original author(s) and the copyright owner(s) are credited and that the original publication in this journal is cited, in accordance with accepted academic practice. No use, distribution or reproduction is permitted which does not comply with these terms.
*Correspondence: Jeanne F. Rivera, SmVhbm5lLlJpdmVyYUBsZ2Nncm91cC5jb20=