 Pawan Kumar Raghav
 Basudha Banerjee
 Rajni Chadha
- 1Immunogenetics and Transplantation Laboratory, Department of Surgery, University of California San Francisco, San Francisco, CA, United States
- 2BioExIn, Delhi, India
Hematopoietic stem cells (HSCs) sustain lifelong hematopoiesis through their capacity for self-renewal and multilineage differentiation. However, the isolation and functional characterization of HSCs remain challenging due to their cellular heterogeneity and dynamically regulated transcriptional and epigenetic landscapes. Advances in experimental and computational biology, including single-cell RNA sequencing (scRNA-seq), chromatin immunoprecipitation sequencing (ChIP-seq), network inference algorithms, and machine learning, have improved our ability to resolve transcriptional states, trace lineage trajectories, and reconstruct gene regulatory networks (GRN) at single-cell resolution. These approaches enable the discovery of novel HSC subtypes and regulatory factors, and facilitate the integration of multi-omics data to uncover epigenetic and transcriptional mechanisms that drive stem cell fate decisions. Additionally, machine learning models trained on high-throughput datasets provide predictive power for identifying novel enhancers, transcription factors, and therapeutic targets. This review underscores the synergistic role of computational tools in deciphering HSC biology and highlights their potential to improve stem cell therapies and precision treatments for hematologic disorders.
1 Introduction
Hematopoiesis is the process by which hematopoietic stem cells (HSCs) proliferate and differentiate into all blood cell lineages, ensuring the continuous production of blood cells throughout an organism’s life (Ng and Alexander, 2017). HSCs can be sourced from bone marrow, peripheral, and umbilical cord blood (Lee and Hong, 2020). Understanding the regulation of HSC self-renewal and lineage differentiation is crucial for both basic research and clinical applications (Barriga et al., 2012). HSC transplantation remains a cornerstone in treating hematologic malignancies, autoimmune disorders, and immunodeficiencies, where their self-renewal capacity is critical for long-term engraftment and therapeutic success (Weissman and Shizuru, 2008). Despite their substantial clinical utilization, achieving a highly purified HSC population for transplantation continues to pose significant challenges. Standard therapeutic protocols often rely on mobilized peripheral blood or whole bone marrow, which contains a heterogeneous mixture of progenitor and mature cells. Consequently, the proportion of true, self-renewing HSCs is relatively low (Skulimowska et al., 2022). For successful transplantation, an optimal dose of approximately 2 × 10⁶ CD34+ cells per kilogram of the recipient’s body weight is recommended (Tricot et al., 2010). However, CD34 expression alone does not guarantee stem cell purity or functional potential. Pharmacological agents like NSC87877, a c-Kit inhibitor, when combined with stem cell factor (SCF), have shown promise for enhancing HSC proliferation post-isolation (Raghav et al., 2018). Increasing the accessibility of highly purified, self-renewing HSCs can enhance therapeutic outcomes and pave the way for novel treatment approaches (Negrin et al., 2000; Logan et al., 2012; Czechowicz and Weissman, 2010).
Computational approaches have emerged as powerful tools to overcome the limitations of HSC identification and characterization by tracing complex gene regulatory interactions (GRN) and epigenetic landscapes that govern HSC fate. Techniques such as single-cell RNA sequencing (scRNA-seq), chromatin immunoprecipitation sequencing (ChIP-seq), network inference algorithms, and machine learning enable the mapping of transcriptional profiles, regulatory networks, and functional heterogeneity at the single-cell level (Kamimoto et al., 2023; Moignard et al., 2015; Wilson et al., 2015; Wang et al., 2024).
Among these technologies, scRNA-seq has proven particularly valuable in revealing transcriptional heterogeneity within HSC populations. It provides high-resolution insights into the lineage commitment and developmental trajectories of HSCs (Wilson et al., 2015; Hérault et al., 2022; Velten et al., 2017). Analytical tools such as FastQC (Andrews, 2010), STAR (Dobin et al., 2013; Du et al., 2020), Seurat (Butler et al., 2018), SCANPY (Wolf et al., 2018), DESeq2 (Love et al., 2014), CellAssign (Zhang et al., 2019), edgeR (Robinson et al., 2010), and Monocle (Trapnell et al., 2014; Qiu et al., 2017a; Qiu et al., 2017b) are commonly used to process and interpret scRNA-seq data. ChIP-seq complements transcriptomic approaches by identifying genome-wide transcription factor (TF) binding sites and epigenetic modifications that regulate HSC self-renewal and differentiation (Cui et al., 2009; Joshi et al., 2013). Tools such as Bowtie2 (Langmead and Salzberg, 2012), MACS2 (Zhang et al., 2008), SICER (Xu et al., 2014), and GREAT (McLean et al., 2010) enable precise mapping of protein-DNA interactions and chromatin dynamics during HSC development. Network inference algorithms are another critical layer in decoding the regulatory circuitry of HSCs. By integrating large-scale expression data, these methods uncover interactions among TFs and their target genes, thereby identifying pivotal regulators such as PU.1, GATA2, LMO2, and MYB (Velten et al., 2017; Wilson et al., 2016; Rodriguez-Fraticelli et al., 2020; Moignard et al., 2013). Tools such as ARACNE (mutual information-based) (Margolin et al., 2006), WGCNA (correlation-based module detection) (Langfelder and Horvath, 2008), Cytoscape (Shannon et al., 2003), and GeneNet (Bayesian network inference) (Ananko et al., 2002) are widely used for inferring and visualizing these networks. Machine learning techniques further enhance our ability to model gene expression, predict regulatory elements, and analyze chromatin accessibility in HSCs (Xiang et al., 2020; Fortelny and Bock, 2020; Lal et al., 2021). Scikit-Learn, DeepCpG, and ChromNet, provide robust data integration, feature selection, model training, and predictive analysis capabilities (Angermueller et al., 2017; Lundberg et al., 2016; Scikit-Learn, 2016; Shannon et al., 2003).
Computational approaches revolutionize the understanding of HSC biology by unraveling cellular heterogeneity, elucidating transcriptional and epigenetic control mechanisms, and identifying biomarkers and therapeutic targets. Figure 1 presents a comprehensive framework for unraveling the complexity of HSC regulation by integrating multi-omics data with advanced computational pipelines. This framework ultimately facilitates the isolation and functional validation of pure HSC populations for therapeutic applications.
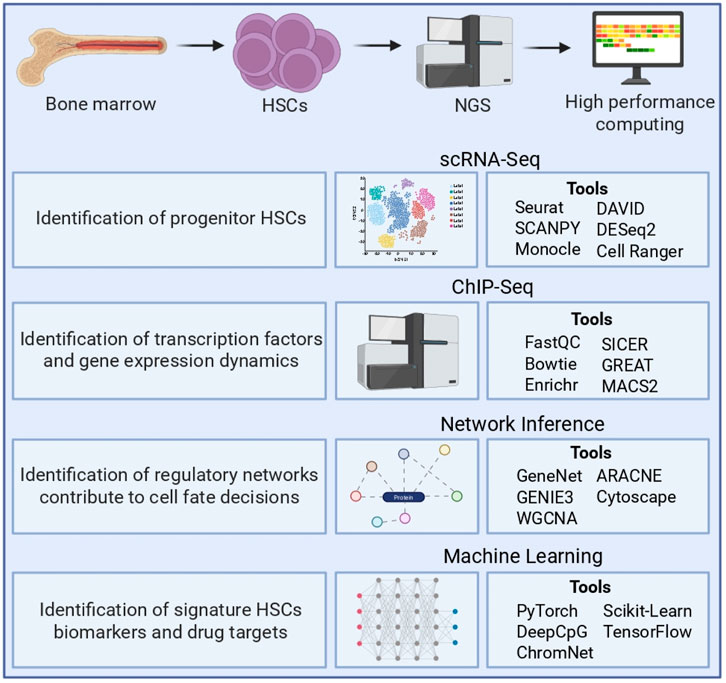
Figure 1. Computational approaches for HSCs’ genomic and transcriptomic data analysis. Illustrates the integrative workflow for analyzing bone marrow-derived HSCs using NGS and high-performance computing. scRNA-seq used to identify progenitor HSCs, resolve transcriptional heterogeneity, and explore cell state transitions using tools such as Seurat, SCANPY, Monocle, DESeq2, DAVID, and CellRanger. ChIP-seq identifies transcription factor binding sites and assesses gene regulatory dynamics, with key tools including FastQC, Bowtie, MACS2, SICER, Enrichr, and GREAT. Network inference approaches, such as GeneNet, GENIE3, WGCNA, ARACNE, and Cytoscape, enable the reconstruction of gene regulatory networks governing HSC fate decisions. Machine learning methods, including PyTorch, DeepCpG, ChromNet, scikit-learn, and TensorFlow, are applied to identify biomarkers, predict regulatory elements, and model gene expression patterns. NGS: next-generation sequencing; scRNA-seq: Single-cell RNA sequencing; ChIP-seq: Chromatin immunoprecipitation sequencing.
2 Approaches for analyzing HSC genomics and transcriptomic data
Following high-throughput data generation and expression quantification, various computational approaches are employed to analyze genomic and transcriptomic data in HSCs (Figure 1). These methods enable in-depth exploration of transcriptional heterogeneity, regulatory mechanisms, and lineage trajectories. scRNA-seq is a powerful tool for dissecting HSC heterogeneity, allowing the identification of novel cell types, functional states, and regulatory networks (Wilson et al., 2015; Hérault et al., 2022). ChIP-seq reveals genome-wide TF binding sites and epigenetic regulation, including cis-regulatory landscapes of HSCs (Qi et al., 2021). Network inference algorithms use high-throughput expression data to infer regulatory interactions among genes or proteins (Cahan et al., 2021). These approaches have been used to reconstruct transcriptional networks involved in hematopoietic development. Application of network inference on single-cell gene expression data decodes early blood development regulatory programs (Moignard et al., 2015). Machine learning algorithms, including support vector machines (SVMs), random forests, and deep learning, are employed to predict regulatory interactions and identify novel gene networks between endothelial cells and HSCs (Wang et al., 2024).
3 scRNA-seq in HSC analysis
scRNA-seq is a technique that enables high-resolution characterization of cellular heterogeneity by profiling gene expression at the single-cell level (Hérault et al., 2022). scRNA-seq has been instrumental in uncovering the transcriptional diversity of HSCs and their progeny. This groundbreaking approach has unveiled novel cell states, differentiation trajectories, and regulatory networks that were previously unknown (Hérault et al., 2022; Ivanova et al., 2002). Seminal studies have utilized scRNA-seq to identify and functionally characterize distinct HSC subpopulations. These studies revealed cells with transcriptional signatures linked to quiescence, immune activation, and a megakaryocyte-erythroid lineage bias (Wilson et al., 2015; Velten et al., 2017; Rothenberg, 2021). The technique has also delved into the differentiation of lineage-specific T and B lymphocytes and has identified transcriptional regulators that commit cells to these lineages (Velten et al., 2017; Rothenberg, 2021). Beyond steady-state hematopoiesis, scRNA-seq has unveiled how radiation affects the transcriptional programs of HSCs, shedding light on stress-induced alterations in quiescence and survival pathways. (Gao et al., 2021; Fast et al., 2021). scRNA-seq offers unprecedented insights into the molecular mechanisms that govern HSC identity and function. (Velten et al., 2017; Rodriguez-Fraticelli et al., 2018). Table 1 outlines the fundamental computational processes involved in analyzing scRNA-seq data and the commonly employed tools for HSC-specific research.
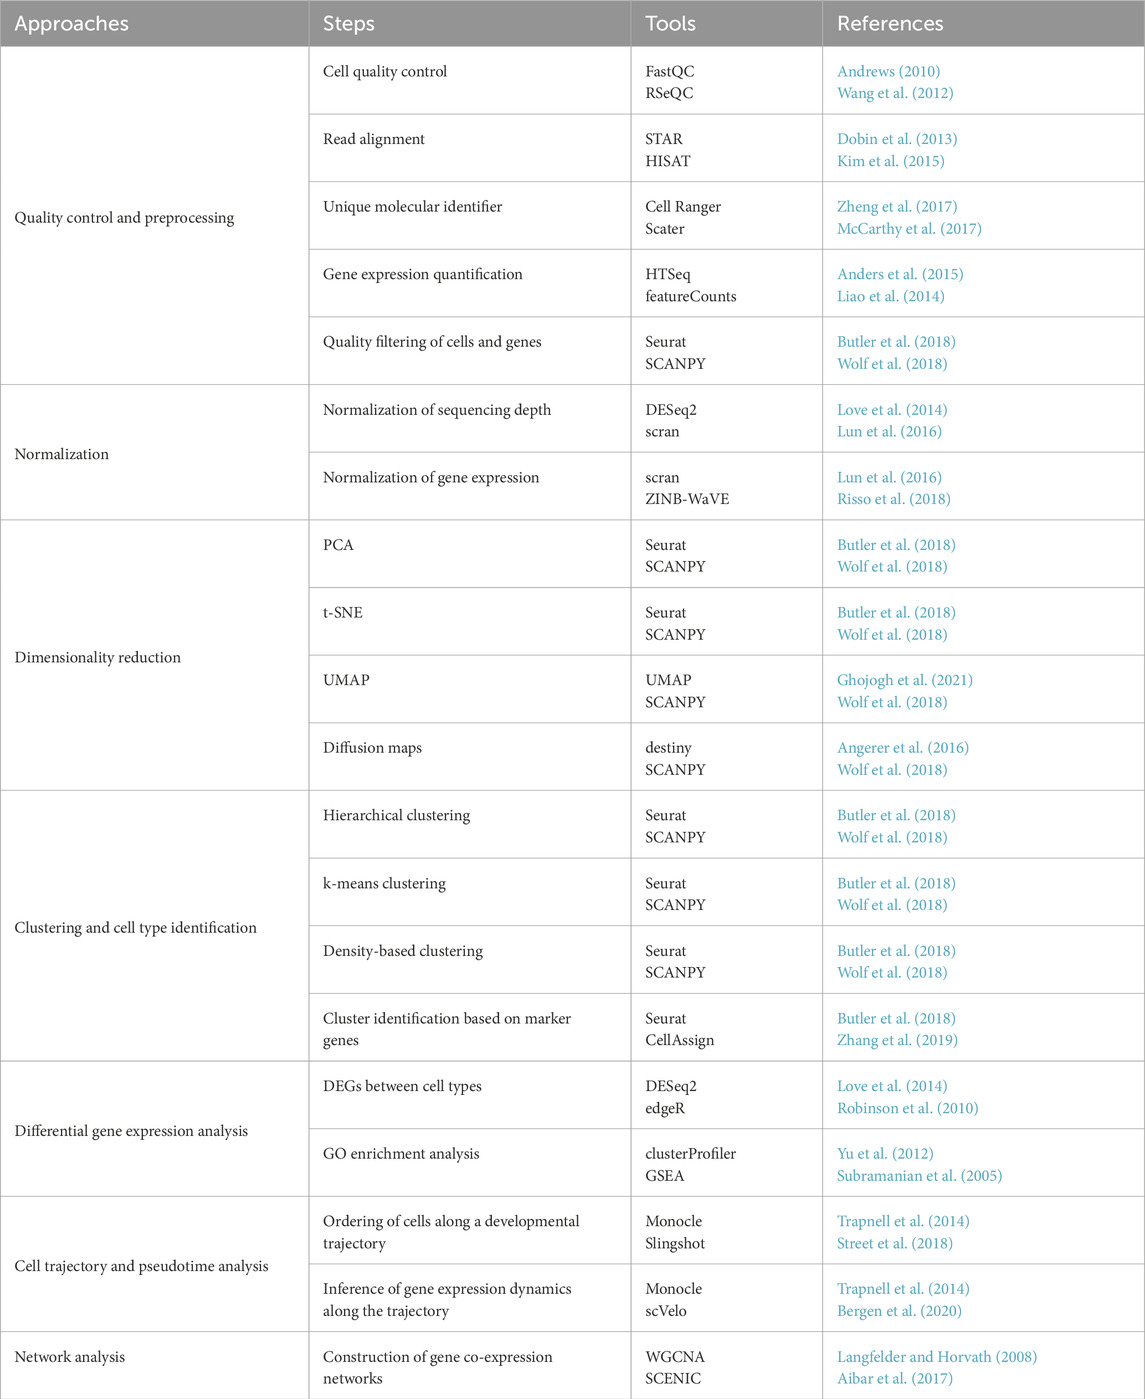
Table 1. Commonly used computational tools for the analysis of HSCs’ scRNA-seq data. Outlines key analytical approaches, including quality control, normalization, dimensionality reduction, clustering, differential gene expression analysis, pseudotime trajectory inference, and network analysis. For each step, representative tools are listed alongside corresponding references. scRNA-seq, single-cell RNA sequencing; HSCs, Hematopoietic stem cells; PCA, Principal component analysis; t-SNE, t-Distributed Stochastic Neighbor Embedding; UMAP, Uniform Manifold Approximation and Projection; DEGs, Differentially expressed genes; GO, Gene ontology.
3.1 Quality control and preprocessing
scRNA-seq generates high-dimensional raw data that requires extensive preprocessing to ensure analytical accuracy and biological validity (Zheng et al., 2017). This crucial step involves removing technical noise and low-quality cells before downstream analyses. The preprocessing pipeline typically encompasses cell quality assessment, read alignment, unique molecular identifier (UMI) counting, gene expression quantification, and quality filtering.
Cell quality control serves as the foundation and is an essential step for excluding cells with poor-quality reads or abnormal transcript profiles. Tools such as Cell Ranger, Seurat, and RSeQC are being widely used for this purpose (Butler et al., 2018; Zheng et al., 2017; Wang et al., 2012). Cell Ranger evaluates sequencing quality, total read count, and genome-mapping percentages, while Seurat utilizes metrics such as the number of detected genes, UMI counts, and mitochondrial gene content to identify and exclude low-quality cells (Butler et al., 2018).
Read alignment maps sequencing reads to a reference genome. STAR and HISAT are the most commonly used aligners (Dobin et al., 2013; Kim et al., 2015). STAR offers ultrafast and high-accuracy alignment through a two-pass strategy, while HISAT employs hierarchical indexing to efficiently map spliced reads.
UMI counting enables accurate quantification of gene expression by distinguishing between true transcripts (UMIs, short DNA sequences that tag individual mRNA molecules) and PCR duplicates (Smith et al., 2017). Cell Ranger, Drop-seq, and Scater facilitate UMI counting (Macosko et al., 2015; Baran-Gale et al., 2018; McCarthy et al., 2017).
Gene expression quantification typically involves counting UMIs associated with each gene. Commonly used tools include Cell Ranger, HTSeq, featureCounts, and Kallisto (Anders et al., 2015; Du et al., 2020; Zheng et al., 2017; Liao et al., 2014). Cell Ranger quantifies gene expression using the feature-barcode matrix generated from UMI counting (Zheng et al., 2017). Kallisto employs pseudo-alignment for faster transcript quantification without the need for complete read mapping (Bray et al., 2016; Brüning et al., 2022). Quality filtering of cells and genes ensures that only relevant data is retained for downstream analysis. Seurat and Cell Ranger apply user-defined thresholds based on gene detection, UMI counts, and mitochondrial gene expression (Butler et al., 2018; Zheng et al., 2017). Genes expressed in insufficient cells or at extremely low levels are filtered out to minimize noise and enhance statistical power (Wolf et al., 2018). These preprocessing steps are crucial for ensuring the reliability of scRNA-seq analysis. Their extensive validation in HSC studies forms the foundation for robust interpretation of single-cell transcriptomic data.
3.2 Normalization
Normalization is a critical step in scRNA-seq data analysis, addressing variability introduced by differences in sequencing depth, capture efficiency, and RNA content across cells (Cuevas-Diaz Duran et al., 2024). Appropriate normalization ensures that observed gene expression differences reflect biological variation rather than technical noise. Several tools have been developed to normalize scRNA-seq workflows, each employing distinct strategies to correct biases.
SCnorm adjusts for cell-specific technical variability using a variance-stabilizing normalization (VSN) approach, allowing accurate comparison of RNA expression levels across cells (Bacher et al., 2017).
Seurat, a widely used R package for scRNA-seq analysis, offers multiple normalization methods. These include global-scaling approaches and Cell Cycle Regression (CCR), which corrects cell cycle-related transcriptional effects that can confound downstream clustering and trajectory analysis (Butler et al., 2018).
DESeq2 is an R package for differential expression analysis, including normalization methods for scRNA-seq data. It uses a model-based approach to estimate size factors that account for differences in sequencing depth across cells (Love et al., 2014).
Other tools, such as scran and ZINB-WaVE, offer alternative frameworks for normalization, particularly for sparse and zero-inflated single-cell datasets (Lun et al., 2016; Risso et al., 2018). The appropriate normalization strategy is essential for accurate differential expression, clustering, and trajectory inference. The choice often depends on the specific characteristics of the dataset and the downstream analytical goals.
3.3 Dimensionality reduction
Dimensionality reduction transforms high-dimensional gene expression data into a lower-dimensional space while preserving essential biological variation (Townes et al., 2019). This facilitates data visualization, clustering, and trajectory inference by mitigating noise and computational complexity. Several widely used techniques are applied for HSC scRNA-seq studies.
Principal component analysis (PCA) is a linear method that identifies orthogonal axes (principal components) capturing the variance in gene expression. It is typically the first step in most scRNA-seq workflows and is implemented in tools such as Seurat and SCANPY (Butler et al., 2018; Wolf et al., 2018; Stuart et al., 2019).
t-Distributed stochastic neighbor embedding (t-SNE) is a nonlinear technique that emphasizes local data structure, making it helpful in visualizing distinct cell populations based on expression similarity. It is commonly employed in Seurat and SCANPY for cluster visualization (Butler et al., 2018; Wolf et al., 2018; Stuart et al., 2019).
Uniform manifold approximation and projection (UMAP) is a recent nonlinear method that preserves local and global data structures. UMAP has gained popularity due to its superior scalability and speed over t-SNE, particularly for large datasets. It is supported by SCANPY, and Harmony (Wolf et al., 2018; Korsunsky et al., 2019; Ghojogh et al., 2021).
Diffusion maps model gene expression similarity using diffusion distances, which are robust to noise and particularly useful for capturing continuous trajectories and identifying rare cell states. Destiny and Diffusion Maps are commonly used tools for this purpose (Angerer et al., 2016; Haghverdi et al., 2015).
3.4 Clustering
Clustering identifies transcriptionally distinct HSC populations within complex tissues such as the bone marrow (Butler et al., 2018). Multiple clustering strategies have been developed, each with strengths suited to different data structures and biological contexts.
Hierarchical clustering is a widely used method based on the recursive merging of similar cells or genes. The algorithm constructs a dendrogram to represent the nested relationships between clusters, which can then be cut at a desired resolution to define distinct groups. This method is implemented in tools such as Seurat, SCANPY, and Monocle, and has been applied extensively in HSC studies to resolve lineage-specific transcriptional states (Wolf et al., 2018; Qiu et al., 2017a; Satija et al., 2015).
k-means clustering partitions cells into k user-defined clusters by iteratively assigning cells to the nearest centroid and updating centroid positions until convergence. Despite its simplicity, k-means remains effective for well-separated clusters and is supported in frameworks such as Scikit-Learn and Cell Ranger (Scikit-Learn, 2016; Zheng et al., 2017).
Density-based clustering, including Density-Based Spatial Clustering of Applications with Noise (DBSCAN), identifies clusters based on cell density. This method captures clusters of varying shapes and sizes, excluding outliers or rare cell types as noise. DBSCAN is available in Seurat and SCANPY and has been used to delineate heterogeneous populations within HSC datasets (Butler et al., 2018; Wolf et al., 2018; Satija et al., 2015).
Marker gene-based annotation represents a supervised approach that leverages prior knowledge of gene expression signatures specific to known cell types. Tools such as SingleR and CellAssign compare transcriptomes against reference datasets or predefined marker panels to assign cell identities. This approach is particularly valuable for validating cluster annotations or transferring labels across datasets (Zhang et al., 2019; Aran et al., 2019).
3.5 Differential expression and enrichment analysis
Differential gene expression (DGE) analysis is a key component of scRNA-seq workflows, enabling the identification of genes that vary significantly across cell types, states, or conditions. DGE analysis has been instrumental in uncovering transcriptional regulators of HSCs associated with differentiation, aging, and lineage commitment (Wang et al., 2019). Several widely adopted tools support DGE analysis in scRNA-seq data.
DESeq2 is an R/Bioconductor package that employs a negative binomial distribution to model count data and estimate dispersion and fold changes between groups (Love et al., 2014). It has been used to identify transcriptional changes in aging HSCs (Adelman et al., 2019).
edgeR is another R/Bioconductor package that similarly models gene expression using a negative binomial distribution and generalized linear models, offering robust statistical frameworks for identifying differentially expressed genes (DEGs) across groups (Robinson et al., 2010). It has been applied in studies investigating dynamic gene expression during HSC differentiation (Lun et al., 2016).
Limma-voom combines linear modeling with precision weights derived from mean-variance relationships in log-transformed count data. This method is effective for scRNA-seq and has been used in both HSC-specific and broader single-cell studies (Lun et al., 2016; Ritchie et al., 2015).
MAST (Model-based Analysis of Single-cell Transcriptomics) utilizes a Bayesian hierarchical framework to model the bimodal distribution of single-cell data. It is particularly suited for zero-inflated datasets and has been widely applied to identify DEGs in HSCs and their progeny (Vanuytsel et al., 2022; Finak et al., 2015).
Initially developed for trajectory analysis, Monocle supports DGE testing along pseudotemporal trajectories, capturing dynamic changes during HSC lineage specification (Trapnell et al., 2014; Gao et al., 2021).
SCDE (Single-Cell Differential Expression) models dropouts and overdispersion using a Bayesian approach and have been applied in studies exploring gene expression dynamics during HSC differentiation (Tusi et al., 2018; Kharchenko et al., 2014).
In parallel with DGE, gene ontology (GO) enrichment analysis is used to interpret biological functions associated with DEG sets, revealing signaling pathways, cellular processes, and transcriptional programs relevant to hematopoiesis. To interpret the biological significance of differentially expressed genes, several widely used tools have been developed for GO enrichment analysis.
DAVID (Database for Annotation, Visualization, and Integrated Discovery), which enables functional annotation of gene lists, has been applied in studies of HSC differentiation (Adelman et al., 2019; Huang et al., 2009).
Enrichr, a web-based tool that offers access to multiple gene set libraries and enrichment algorithms, has been used to identify transcriptional regulators underlying dynamic HSC states (Kuleshov et al., 2016).
GSEA (Gene Set Enrichment Analysis) assesses whether predefined gene sets show statistically significant differences between biological conditions. It has been widely adopted in single-cell studies of HSCs and immune lineages (Subramanian et al., 2005).
ClusterProfiler provides a programmatic interface for GO and pathway enrichment directly within R and supports visualization and statistical comparison of multiple gene sets (Yu et al., 2012; Xu et al., 2024).
These tools have proven essential for decoding the molecular underpinnings of HSC identity and fate decisions. By linking gene expression patterns to functional pathways, DGE and enrichment analyses continue to deepen understanding of the regulatory networks governing hematopoiesis.
3.6 Pseudotime analysis
Pseudotime analysis is a computational strategy used to infer the temporal progression of cellular states from static single-cell transcriptomic data. By ordering cells along a putative developmental trajectory based on their gene expression profiles, pseudotime analysis enables the identification of key regulators and pathways involved in differentiation, lineage commitment, and cellular transitions (Street et al., 2018; Bergen et al., 2020; Campbell and Yau, 2019). Several tools have been developed to model pseudotemporal dynamics in HSCs, each using distinct algorithms to reconstruct lineage hierarchies and predict gene expression changes.
Monocle is one of the most widely used tools for pseudotime inference. It employs a reverse graph embedding algorithm to map gene expression dynamics along developmental trajectories. In HSC studies, Monocle has been used to reconstruct differentiation pathways and identify transcriptional regulators of lineage fate decisions (Trapnell et al., 2014; Olsson et al., 2016).
SCORPIUS utilizes a random walk-based algorithm to model the progression of cells along a smooth trajectory, enabling the prediction of future transcriptional states and identifying key regulatory genes. It has been applied to delineate hematopoietic lineage bifurcation, including the transition from HSCs to lymphoid and myeloid progenitors (Liang et al., 2020; Cannoodt et al., 2016).
Wanderlust reconstructs developmental progressions using a minimum spanning tree approach, enabling detailed mapping of sequential gene expression changes. This method has uncovered lineage-specific gene regulatory programs during HSC differentiation (Velten et al., 2017; Bendall et al., 2014).
Waterfall applies a hierarchical clustering framework to model cellular progression, effectively capturing transcriptional transitions and branching events. In HSCs, Waterfall has been used to trace developmental hierarchies and pinpoint regulatory genes involved in early hematopoietic commitment (Shin et al., 2015).
3.7 Network analysis
Network analysis provides a systems-level view of gene and protein interactions, enabling the identification of regulatory modules, signaling pathways, and transcriptional hierarchies that govern cellular identity and function (Cahan et al., 2021). In HSCs, network analysis has been pivotal for reconstructing GRN, identifying lineage-specific transcriptional regulators, and uncovering dynamic programs that govern differentiation and stem cell fate decisions. Several computational frameworks have been widely applied to single-cell transcriptomic data for network inference and analysis in HSCs.
Weighted Gene Co-expression Network Analysis (WGCNA) is an R-based package that constructs gene co-expression networks by identifying modules of highly correlated genes. These modules are often associated with biological traits or cell states. WGCNA has been used to identify hub genes and co-expression modules relevant to HSC maintenance and differentiation (Desterke et al., 2020).
SCENIC (Single-Cell Regulatory Network Inference and Clustering) integrates co-expression analysis with motif enrichment to infer TF–target relationships at single-cell resolution (Aibar et al., 2017). In HSCs, SCENIC has enabled the reconstruction of GRN and the identification of lineage-defining TFs and their regulatory targets (Moignard et al., 2015).
Monocle, in addition to trajectory inference, supports dynamic network analysis by modeling gene expression changes over pseudotime. This allows for identifying temporally regulated genes and pathways during hematopoietic differentiation (Trapnell et al., 2014; Olsson et al., 2016).
CellNet is a supervised machine learning tool designed to assess and reconstruct cell type–specific GRN using gene expression data. It has been employed to evaluate the fidelity of engineered or reprogrammed HSCs and to identify regulatory signatures distinguishing distinct hematopoietic states (Cahan et al., 2014; Lu et al., 2016).
Ingenuity Pathway Analysis (IPA) is a commercial platform that maps gene expression data onto curated biological pathways and networks. IPA has been used to identify upstream regulators, canonical pathways, and molecular interactions relevant to HSC signaling and functional specification (Marx-Blümel et al., 2021).
4 HSC ChIP-Seq data analysis
ChIP-seq maps genome-wide binding sites of TFs and other regulatory proteins, providing critical insights into the epigenetic regulation of gene expression (Lundberg et al., 2016). ChIP-seq has been instrumental in delineating cis-regulatory landscapes that control self-renewal and lineage commitment of HSCs. The method involves crosslinking DNA and proteins in situ, isolating protein–DNA complexes, immunoprecipitating them using target-specific antibodies, and sequencing the recovered DNA fragments. This enables the identification of genomic loci bound by TFs and chromatin-modifying proteins (Gade and Kalvakolanu, 2012). ChIP-seq profiled undifferentiated and activated HSCs to identify dynamic TF binding events and cis-regulatory regions associated with self-renewal and differentiation (Qi et al., 2021). These findings have deepened the understanding of HSC regulation and may inform future therapeutic strategies for hematological diseases.
4.1 Computational pipeline for ChIP-Seq data analysis
Computational analysis of ChIP-seq data involves several key steps, each facilitated by specialized bioinformatics tools.
4.1.1 Quality control and preprocessing
Raw sequencing reads must be assessed for quality and trimmed to remove adapters or low-quality bases. FastQC and Trimmomatic tools are routinely used at this stage (Andrews, 2010; Bolger et al., 2014).
4.1.2 Alignment
Cleaned reads are aligned to a reference genome using aligners such as Bowtie2 or BWA, producing binary alignment map (BAM) files that record read locations and mapping quality (Langmead and Salzberg, 2012; Li and Durbin, 2009).
4.1.3 Peak calling
Aligned reads identify enriched regions referred to as “peaks” that signify protein-DNA interactions. Standard tools include MACS2, which models peak significance, and SICER, which is suited for broad enrichment signals (Zhang et al., 2008; Xu et al., 2014).
4.1.4 Peak annotation and functional analysis
Identified peaks are annotated with genomic features (e.g., promoters, enhancers) using ChIPseeker (Yu et al., 2015). Enrichment analysis tools such as GREAT and Enrichr are then used to interpret the functional roles of bound regions (McLean et al., 2010; Kuleshov et al., 2016).
This pipeline enables the discovery of genome-wide TF binding sites, enhancer-promoter interactions, and regulatory motifs central to HSC function.
4.2 HSC ChIP-Seq studies
Applying ChIP-seq to HSCs has enabled high-resolution mapping of TF binding sites and chromatin modifications, offering critical insights into the regulatory architecture underlying hematopoiesis (Lundberg et al., 2016; Gade and Kalvakolanu, 2012). Through computational ChIP-seq data analysis, numerous studies have characterized gene regulatory elements that govern HSC self-renewal, quiescence, and lineage specification (Wilson et al., 2016; Cui et al., 2009). A study employed ChIP-seq to map genome-wide TF occupancy in HSCs subpopulations (Subramanian et al., 2023). MACS2 was used for peak calling and HOMER for motif discovery (Zhang et al., 2008) identified dynamic changes in cis-regulatory landscapes during differentiation. The analysis revealed stage-specific binding of key TFs, underscoring the dynamic regulatory programs that orchestrate HSC fate decisions. The distribution of histone modifications H3K4me3 and H3K27me3 in HSCs and their progeny was investigated using Bowtie for read alignment, MACS2 for peak calling, and IGV for visualization (Zhang et al., 2021). The study demonstrated that histone mark distribution is altered during differentiation. These findings suggested that epigenetic reprogramming is pivotal in regulating gene expression and lineage commitment. The function of Polycomb Repressive Complex 2 (PRC2) was examined in HSC regulation (Xie et al., 2014). ChIP-seq profiling of PRC2 components revealed enrichment at genes involved in differentiation. Functional studies showed that loss of PRC2 activity impaired HSC self-renewal and promoted premature differentiation, highlighting its essential role in maintaining stem cell identity. The enhancer landscape during HSC differentiation was characterized by profiling H3K4me1, a histone modification associated with active and primed enhancers. (Lara-Astiaso et al., 2014). The analysis revealed that lineage-specific enhancers are established early and maintained throughout differentiation, serving as epigenetic bookmarks for future transcriptional activation. The study also mapped binding sites of key TFs implicated in lineage choice and functional specification. ChIP-seq delineates the binding profile of GATA1, a master regulator of erythropoiesis, in erythroid progenitors derived from HSCs (Wilson et al., 2016). Bowtie and HOMER demonstrated that GATA1 targets both promoters and enhancers of erythroid-specific genes, reinforcing its central role in erythroid lineage programming. Similarly, ChIP-seq analysis revealed that GATA2, another critical TF in early hematopoiesis, binds to regulatory elements associated with genes essential for HSC maintenance and differentiation (Joshi et al., 2013). Loss of GATA2 disrupted these programs, confirming its indispensable role in sustaining HSC identity.
These studies underscore the power of ChIP-seq to uncover the transcriptional and epigenetic networks that define HSC behavior. High-resolution binding data with advanced computational pipelines facilitate the identification of promoters, enhancers, and TF occupancy patterns that govern key aspects of HSC function from quiescence and self-renewal to lineage commitment (Joshi et al., 2013; Gade and Kalvakolanu, 2012; Hannah et al., 2011). These findings enhance understanding of hematopoietic development and provide a framework for identifying novel targets for therapeutic manipulation in hematological disorders.
5 Network inference algorithms
Network inference algorithms offer a robust computational framework for reconstructing GRN from high-throughput gene expression data. These approaches enable the identification of transcriptional regulators, target genes, and functional modules that control cellular processes such as development, differentiation, and lineage commitment (Kamimoto et al., 2023; Mercatelli et al., 2020). Their application has been particularly transformative in the study of HSCs, where understanding the regulatory circuitry is essential for elucidating the mechanisms governing self-renewal, multipotency, and differentiation. Several network inference algorithms have been developed, each with unique strengths and assumptions based on data types and modeling goals (Saint-Antoine and Singh, 2020). These include Bayesian approaches, mutual information-based algorithms, and correlation-based methods. These algorithms have been applied to transcriptomic data, particularly from scRNA-seq, to predict regulatory interactions with increasing granularity and biological relevance. In a study, GENIE3 (tree-based ensemble learning) predicted regulatory interactions and was employed to infer GRN from single-cell expression profiles of developing mouse embryos (Kamimoto et al., 2023). The analysis identified well-established regulators of hematopoiesis, including GATA2, Runx1, and Scl/Tal1, as well as novel candidates such as LMO2 and MYB. Functional validation through genetic perturbation experiments confirmed the predicted regulatory interactions and demonstrated the network’s ability to forecast downstream effects of TF deletion. Similarly, a study used network inference to analyze bulk RNA-seq data from murine HSCs and their progenitors (Cabezas-Wallscheid et al., 2014). Their analysis revealed a GATA2-centered module regulating self-renewal and identified several additional factors involved in HSC lineage priming.
In another study, network inference was applied to human scRNA-seq datasets to reconstruct differentiation trajectories in early hematopoiesis (Velten et al., 2017). The analysis highlighted PU.1 as a key regulator of myeloid lineage commitment, consistent with prior functional evidence. GRN underlying the differentiation of HSCs into all major blood lineages has been reconstructed (Serina Secanechia et al., 2022). Using scRNA-seq data across developmental timepoints identified both canonical regulators (e.g., GATA2, Runx1, Scl/Tal1) and novel contributors such as CEBPα and Spi1. CRISPR-Cas9-mediated perturbations were used to validate predictions, demonstrating the predictive strength of the inferred network. These studies illustrate how integrating expression data with network inference enables mechanistic insights into HSC biology. By revealing both established and previously uncharacterized regulators, these approaches provide a blueprint for understanding hematopoietic fate decisions at a systems level (Armingol et al., 2021).
5.1 Computational workflow for network inference in HSCs
The computational reconstruction of GRN in HSCs typically involves four key steps.
5.1.1 Preprocessing
Raw transcriptomic data (e.g., RNA-seq or scRNA-seq) undergo to quality control, normalization, and batch correction to minimize technical variability and retain biological signals (Lun et al., 2016).
5.1.2 Network inference
Preprocessed data are input into network inference algorithms such as GENIE3, ARACNE, WGCNA, and GeneNet. These tools infer edges between TFs and potential targets, constructing initial GRN (Margolin et al., 2006; Langfelder and Horvath, 2008; Ananko et al., 2002).
5.1.3 Network validation
Inferred interactions are validated against known regulatory databases or experimentally using loss-of-function or gain-of-function assays. This step assesses biological plausibility and predictive robustness (Kamimoto et al., 2023).
5.1.4 Network analysis
The final network is analyzed using centrality, modularity, and connectivity metrics to identify master regulators and key subnetworks (Cahan et al., 2021). Tools like Cytoscape is commonly used for visualization and annotation (Shannon et al., 2003).
6 Machine learning approaches for HSC data analysis
Machine learning approaches have become indispensable in HSC computational biology, particularly for modeling complex regulatory networks and predicting gene interactions from high-dimensional data. These techniques facilitate the discovery of novel transcriptional programs and molecular mechanisms underlying HSC differentiation, lineage commitment, and self-renewal (Bian and Cahan, 2016). A notable study utilized a deep learning-based framework to predict tissue-specific regulatory interactions between endothelial cells and HSCs using scRNA-seq data from mouse bone marrow (Wang et al., 2024). This approach accurately captured previously unrecognized cross-cell-type interactions, highlighting the capacity of machine learning to elucidate complex intercellular communication.
ChIP-seq data have been integrated with machine learning, including applying a random forest algorithm to predict TF binding sites, identifying key regulators of HSC function and differentiation (Kamimoto et al., 2023). This highlights the utility of machine learning for enhancer and TF motif prediction. SVMs have also been applied to classify distinct stages of HSC differentiation based on gene expression profiles. A study delineated hematopoietic progenitor cell phenotyping through machine learning approaches, offering insights into the transcriptional differences from fetal liver HSCs (Fidanza et al., 2020). A neural network model has been developed to identify functional enhancers regulating self-renewal and lineage-specific regulators (Xia et al., 2020), and machine learning has also been used to estimate the regulatory potential of DNA sequences, identifying transcription factors and enhancer elements relevant to HSC identity and fate (Xiang et al., 2020).
Other studies have demonstrated the predictive power of random forest models in modeling gene expression changes during HSC differentiation and mapping chromatin accessibility across regulatory regions (Fortelny and Bock, 2020; Lal et al., 2021). Collectively, these applications underscore the transformative role of machine learning in decoding regulatory complexity in HSC biology (Fidanza et al., 2020).
6.1 Machine learning tools for HSC data analysis
Several computational tools and platforms have been developed to implement machine learning techniques for HSC datasets.
6.1.1 Scikit-learn
A widely used Python library offering an extensive suite of machine learning algorithms, including SVM, decision trees, and clustering. It has been applied in studies predicting intercellular regulatory interactions (Wang et al., 2024; Scikit-Learn, 2016).
6.1.2 TensorFlow
A robust open-source framework developed by Google, suitable for large-scale deep learning applications. TensorFlow constructs a neural network model to predict gene expression in single HSCs (Athanasiadis et al., 2017).
6.1.3 PyTorch
An alternative deep learning platform known for its flexibility and dynamic computation graph, used to model lineage trajectories of individual HSCs (Wang et al., 2024).
6.1.4 DeepCpG
A deep learning model for predicting DNA methylation from sequencing data. It has been used to model methylation dynamics at single CpG resolution in HSCs and progenitors (Angermueller et al., 2017).
6.1.5 ChromNet
A tool that infers chromatin interactions from ChIP-seq data using deep learning, applied to predict enhancer-promoter connectivity in HSCs (Lundberg et al., 2016).
6.2 Machine learning based workflow for HSC data analysis
Machine learning-driven analysis of HSC data typically follows a structured workflow.
6.2.1 Data preprocessing
Raw expression or epigenomic data are filtered, normalized, and batch corrected. Genes with low expression or limited variance are excluded (Gonzalez Zelaya, 2019).
6.2.2 Feature selection
Informative features are extracted to reduce dimensionality and improve model generalizability. Approaches such as minimum redundancy maximum relevance (mRMR) are commonly employed (Dhal and Azad, 2022).
6.2.3 Model training
Selected features are used to train machine learning models such as SVM, random forests, or neural networks (Bian and Cahan, 2016).
6.2.4 Model evaluation
Cross-validation or independent test sets assess model performance, ensuring robustness and avoiding overfitting (Xiong et al., 2020).
6.2.5 Network analysis
Predicted regulatory interactions are visualized and interpreted using platforms like Cytoscape, aiding in identifying key regulators and pathways (Shannon et al., 2003).
6.3 Case study: regulatory prediction between endothelial cells and HSCs
A complete machine learning pipeline was demonstrated in a study aimed at decoding HSCs based on their morphological features, using microscopy images, enabling rapid identification of HSCs and progenitor cells (Wang et al., 2024). The SVM model was trained and validated using cross-validation techniques after applying a mutual information-based minimum redundancy maximum relevance algorithm for feature selection (Dhal and Azad, 2022). The resulting network, visualized using Cytoscape, revealed novel intercellular signaling pathways that were experimentally supported, showcasing the strength of machine learning for hypothesis generation and network reconstruction.
7 Conclusion
HSC biology has entered a transformative era, driven by advances in high-throughput sequencing technologies and the parallel development of sophisticated computational frameworks. From scRNA-seq and ChIP-seq to network inference algorithms and machine learning, these techniques and tools have collectively revolutionized our ability to dissect the heterogeneity of HSCs, trace lineage trajectories, and decipher regulatory circuits at unprecedented resolution. Crucially, computational strategies enhance the identification and functional characterization of true, self-renewing HSCs. They also facilitate the discovery of biomarkers, transcriptional regulators, and epigenetic modifiers that underpin hematopoietic differentiation. Integrating multi-omics datasets with predictive modeling and functional validation is poised to unlock deeper mechanistic insights into normal and pathological hematopoiesis. The convergence of machine learning, systems biology, and experimental hematology will be essential for achieving the long-standing goal of prospectively isolating and therapeutically deploying pure HSC populations. Furthermore, linking these computational insights to clinical outcomes can accelerate the development of precision therapies for hematologic malignancies, bone marrow failure syndromes, and immune disorders. In essence, computational approaches are no longer ancillary tools in HSC research; they are central to the next-generation of discoveries and therapeutic innovations in stem cell biology and regenerative medicine.
Author contributions
PR: Conceptualization, Data curation, Formal Analysis, Investigation, Methodology, Supervision, Validation, Visualization, Writing – original draft, Writing – review and editing. BB: Data curation, Formal Analysis, Validation, Visualization, Writing – original draft, Writing – review and editing. RC: Data curation, Formal Analysis, Validation, Visualization, Writing – original draft, Writing – review and editing.
Funding
The author(s) declare that no financial support was received for the research and/or publication of this article.
Acknowledgments
The authors are most grateful to NIH/NLM (U.S. National Institutes of Health’s National Library of Medicine) for accessing free full-text scientific publications on PubMed Central (www.ncbi.nlm.nih.gov/pmc/), which was integral for the successful completion of this work. The figure is original and created by the author using Biorender (https://www.biorender.com/).
Conflict of interest
Authors BB, RC were employed by BioExIn.
The remaining author declares that the research was conducted in the absence of any commercial or financial relationships that could be construed as a potential conflict of interest.
Generative AI statement
The author(s) declare that no Generative AI was used in the creation of this manuscript.
Publisher’s note
All claims expressed in this article are solely those of the authors and do not necessarily represent those of their affiliated organizations, or those of the publisher, the editors and the reviewers. Any product that may be evaluated in this article, or claim that may be made by its manufacturer, is not guaranteed or endorsed by the publisher.
Abbreviations
BAM, Binary Alignment Map; CCR, Cell Cycle Regression; ChIP-Seq, Chromatin Immunoprecipitation Sequencing; DAVID, Database for Annotation, Visualization, and Integrated Discovery; DBSCAN, Density-Based Spatial Clustering of Applications with Noise; DEGs, Differentially Expressed Genes; DGE, Differential Gene Expression; GO, Gene Ontology; GRN, Gene Regulatory Network; GSEA, Gene Set Enrichment Analysis; HSCs, Hematopoietic Stem Cells; IPA, Ingenuity Pathway Analysis; MAST, Model-based Analysis of Single-cell Transcriptomics; NGS, Next-Generation Sequencing; PCA, Principal Component Analysis; PRC2, Polycomb Repressive Complex 2; SCDE, Single-Cell Differential Expression; SCF, Stem Cell Factor; scRNA-Seq, Single-cell RNA-Sequencing; SVM, Support Vector Machines; TFs, Transcription Factors; t-SNE, t-Distributed Stochastic Neighbor Embedding; UMAP, Uniform Manifold Approximation and Projection; UMIS, Unique Molecular Identifiers; VSN, Variance-Stabilizing Normalization; WGCNA, Weighted Gene Co-expression Network Analysis.
References
Adelman, E. R., Huang, H.-T., Roisman, A., Olsson, A., Colaprico, A., Qin, T., et al. (2019). Aging human hematopoietic stem cells manifest profound epigenetic reprogramming of enhancers that may predispose to leukemia. Cancer Discov. 9 (8), 1080–1101. doi:10.1158/2159-8290.CD-18-1474
Aibar, S., González-Blas, C. B., Moerman, T., Huynh-Thu, V. A., Imrichova, H., Hulselmans, G., et al. (2017). SCENIC: single-cell regulatory network inference and clustering. Nat. Methods 14 (11), 1083–1086. doi:10.1038/nmeth.4463
Ananko, E. A., Podkolodny, N. L., Stepanenko, I. L., Ignatieva, E. V., Podkolodnaya, O. A., and Kolchanov, N. A. (2002). GeneNet: a database on structure and functional organisation of gene networks. Nucleic Acids Res. 30 (1), 398–401. doi:10.1093/nar/30.1.398
Anders, S., Pyl, P. T., and Huber, W. (2015). HTSeq — a Python framework to work with high-throughput sequencing data. Bioinformatics 31 (2), 166–169. doi:10.1093/bioinformatics/btu638
Andrews, S. (2010). FastQC: a quality control tool for high throughput sequence data. Available online at: http://www.bioinformatics.babraham.ac.uk/projects/fastqc.
Angerer, P., Haghverdi, L., Büttner, M., Theis, F. J., Marr, C., and Buettner, F. (2016). destiny: diffusion maps for large-scale single-cell data in R. Bioinformatics 32 (8), 1241–1243. doi:10.1093/bioinformatics/btv715
Angermueller, C., Lee, H. J., Reik, W., and Stegle, O. (2017). DeepCpG: accurate prediction of single-cell DNA methylation states using deep learning. Genome Biol. 18 (1), 67. doi:10.1186/s13059-017-1189-z
Aran, D., Looney, A. P., Liu, L., Wu, E., Fong, V., Hsu, A., et al. (2019). Reference-based analysis of lung single-cell sequencing reveals a transitional profibrotic macrophage. Nat. Immunol. 20 (2), 163–172. doi:10.1038/s41590-018-0276-y
Armingol, E., Officer, A., Harismendy, O., and Lewis, N. E. (2021). Deciphering cell-cell interactions and communication from gene expression. Nat. Rev. Genet. 22 (2), 71–88. doi:10.1038/s41576-020-00292-x
Athanasiadis, E. I., Botthof, J. G., Andres, H., Ferreira, L., Lio, P., and Cvejic, A. (2017). Single-cell RNA-sequencing uncovers transcriptional states and fate decisions in haematopoiesis. Nat. Commun. 8 (1), 2045. doi:10.1038/s41467-017-02305-6
Bacher, R., Chu, L.-F., Leng, N., Gasch, A. P., Thomson, J. A., Stewart, R. M., et al. (2017). SCnorm: robust normalization of single-cell RNA-seq data. Nat. Methods 14 (6), 584–586. doi:10.1038/nmeth.4263
Baran-Gale, J., Chandra, T., and Kirschner, K. (2018). Experimental design for single-cell RNA sequencing. Brief. Funct. Genomics 17 (4), 233–239. doi:10.1093/bfgp/elx035
Barriga, F., Ramírez, P., Wietstruck, A., and Rojas, N. (2012). Hematopoietic stem cell transplantation: clinical use and perspectives. Biol. Res. 45 (3), 307–316. doi:10.4067/S0716-97602012000300012
Bendall, S. C., Davis, K. L., Amir, E.-A. D., Tadmor, M. D., Simonds, E. F., Chen, T. J., et al. (2014). Single-cell trajectory detection uncovers progression and regulatory coordination in human B cell development. Cell 157 (3), 714–725. doi:10.1016/j.cell.2014.04.005
Bergen, V., Lange, M., Peidli, S., Wolf, F. A., and Theis, F. J. (2020). Generalizing RNA velocity to transient cell states through dynamical modeling. Nat. Biotechnol. 38 (12), 1408–1414. doi:10.1038/s41587-020-0591-3
Bian, Q., and Cahan, P. (2016). Computational tools for stem cell biology. Trends Biotechnol. 34 (12), 993–1009. doi:10.1016/j.tibtech.2016.05.010
Bolger, A. M., Lohse, M., and Usadel, B. (2014). Trimmomatic: a flexible trimmer for Illumina sequence data. Bioinformatics 30 (15), 2114–2120. doi:10.1093/bioinformatics/btu170
Bray, N. L., Pimentel, H., Melsted, P., and Pachter, L. (2016). Near-optimal probabilistic RNA-seq quantification. Nat. Biotechnol. 34 (5), 525–527. doi:10.1038/nbt.3519
Brüning, R. S., Tombor, L., Schulz, M. H., Dimmeler, S., and John, D. (2022). Comparative analysis of common alignment tools for single-cell RNA sequencing. Gigascience 11, giac001. doi:10.1093/gigascience/giac001
Butler, A., Hoffman, P., Smibert, P., Papalexi, E., and Satija, R. (2018). Integrating single-cell transcriptomic data across different conditions, technologies, and species. Nat. Biotechnol. 36 (5), 411–420. doi:10.1038/nbt.4096
Cabezas-Wallscheid, N., Klimmeck, D., Hansson, J., Lipka, D. B., Reyes, A., Wang, Q., et al. (2014). Identification of regulatory networks in HSCs and their immediate progeny via integrated proteome, transcriptome, and DNA methylome analysis. Cell Stem Cell 15 (4), 507–522. doi:10.1016/j.stem.2014.07.005
Cahan, P., Cacchiarelli, D., Dunn, S.-J., Hemberg, M., de Sousa Lopes, S. M. C., Morris, S. A., et al. (2021). Computational stem cell biology: open questions and guiding principles. Cell Stem Cell 28 (1), 20–32. doi:10.1016/j.stem.2020.12.012
Cahan, P., Li, H., Morris, S. A., Lummertz da Rocha, E., Daley, G. Q., and Collins, J. J. (2014). CellNet: network biology applied to stem cell engineering. Cell 158 (4), 903–915. doi:10.1016/j.cell.2014.07.020
Campbell, K. R., and Yau, C. (2019). A descriptive marker gene approach to single-cell pseudotime inference. Bioinformatics 35 (1), 28–35. doi:10.1093/bioinformatics/bty498
Cannoodt, R., Saelens, W., and Saeys, Y. (2016). Computational methods for trajectory inference from single-cell transcriptomics. Eur. J. Immunol. 46 (11), 2496–2506. doi:10.1002/eji.201646347
Cuevas-Diaz Duran, R., Wei, H., and Wu, J. (2024). Data normalization for addressing the challenges in the analysis of single-cell transcriptomic datasets. BMC Genomics 25 (1), 444. doi:10.1186/s12864-024-10364-5
Cui, K., Zang, C., Roh, T.-Y., Schones, D. E., Childs, R. W., Peng, W., et al. (2009). Chromatin signatures in multipotent human hematopoietic stem cells indicate the fate of bivalent genes during differentiation. Cell Stem Cell 4 (1), 80–93. doi:10.1016/j.stem.2008.11.011
Czechowicz, A., and Weissman, I. L. (2010). Purified hematopoietic stem cell transplantation: the next generation of blood and immune replacement. Immunol. Allergy Clin. North Am. 30 (2), 159–171. doi:10.1016/j.iac.2010.03.003
Desterke, C., Petit, L., Sella, N., Chevallier, N., Cabeli, V., Coquelin, L., et al. (2020). Inferring gene networks in bone marrow hematopoietic stem cell-supporting stromal niche populations. iScience 23 (6), 101222. doi:10.1016/j.isci.2020.101222
Dhal, P., and Azad, C. (2022). A comprehensive survey on feature selection in the various fields of machine learning. Appl. Intell. 52 (4), 4543–4581. doi:10.1007/s10489-021-02550-9
Dobin, A., Davis, C. A., Schlesinger, F., Drenkow, J., Zaleski, C., Jha, S., et al. (2013). STAR: ultrafast universal RNA-seq aligner. Bioinformatics 29 (1), 15–21. doi:10.1093/bioinformatics/bts635
Du, Y., Huang, Q., Arisdakessian, C., and Garmire, L. X. (2020). Evaluation of STAR and Kallisto on single cell RNA-seq data alignment. G3 (Bethesda) 10 (5), 1775–1783. doi:10.1534/g3.120.401160
Fast, E. M., Sporrij, A., Manning, M., Rocha, E. L., Yang, S., Zhou, Y., et al. (2021). External signals regulate continuous transcriptional states in hematopoietic stem cells. eLife 10, 10. doi:10.7554/elife.66512
Fidanza, A., Stumpf, P. S., Ramachandran, P., Tamagno, S., Babtie, A., Lopez-Yrigoyen, M., et al. (2020). Single-cell analyses and machine learning define hematopoietic progenitor and HSC-like cells derived from human PSCs. Blood 136 (25), 2893–2904. doi:10.1182/blood.2020006229
Finak, G., McDavid, A., Yajima, M., Deng, J., Gersuk, V., Shalek, A. K., et al. (2015). MAST: a flexible statistical framework for assessing transcriptional changes and characterizing heterogeneity in single-cell RNA sequencing data. Genome Biol. 16, 278. doi:10.1186/s13059-015-0844-5
Fortelny, N., and Bock, C. (2020). Knowledge-primed neural networks enable biologically interpretable deep learning on single-cell sequencing data. Genome Biol. 21 (1), 190. doi:10.1186/s13059-020-02100-5
Gade, P., and Kalvakolanu, D. V. (2012). Chromatin immunoprecipitation assay as a tool for analyzing transcription factor activity. Methods Mol. Biol. 809, 85–104. doi:10.1007/978-1-61779-376-9_6
Gao, S., Wu, Z., Kannan, J., Mathews, L., Feng, X., Kajigaya, S., et al. (2021). Comparative transcriptomic analysis of the hematopoietic system between human and mouse by single cell RNA sequencing. Cells 10 (5), 973. doi:10.3390/cells10050973
Ghojogh, B., Ghodsi, A., Karray, F., and Crowley, M. (2021). Uniform manifold approximation and projection (UMAP) and its variants: tutorial and survey. arXiv.
Gonzalez Zelaya, C. V. (2019). “Towards explaining the effects of data preprocessing on machine learning,” in 2019 IEEE 35th international conference on data engineering (ICDE). IEEE, 2086–2090.
Haghverdi, L., Buettner, F., and Theis, F. J. (2015). Diffusion maps for high-dimensional single-cell analysis of differentiation data. Bioinformatics 31 (18), 2989–2998. doi:10.1093/bioinformatics/btv325
Hannah, R., Joshi, A., Wilson, N. K., Kinston, S., and Göttgens, B. (2011). A compendium of genome-wide hematopoietic transcription factor maps supports the identification of gene regulatory control mechanisms. Exp. Hematol. 39 (5), 531–541. doi:10.1016/j.exphem.2011.02.009
Hérault, L., Poplineau, M., Remy, E., and Duprez, E. (2022). Single cell transcriptomics to understand HSC heterogeneity and its evolution upon aging. Cells 11 (19), 3125. doi:10.3390/cells11193125
Huang, D. W., Sherman, B. T., and Lempicki, R. A. (2009). Systematic and integrative analysis of large gene lists using DAVID bioinformatics resources. Nat. Protoc. 4 (1), 44–57. doi:10.1038/nprot.2008.211
Ivanova, N. B., Dimos, J. T., Schaniel, C., Hackney, J. A., Moore, K. A., and Lemischka, I. R. (2002). A stem cell molecular signature. Science 298 (5593), 601–604. doi:10.1126/science.1073823
Joshi, A., Hannah, R., Diamanti, E., and Göttgens, B. (2013). Gene set control analysis predicts hematopoietic control mechanisms from genome-wide transcription factor binding data. Exp. Hematol. 41 (4), 354–66.e14. doi:10.1016/j.exphem.2012.11.008
Kamimoto, K., Stringa, B., Hoffmann, C. M., Jindal, K., Solnica-Krezel, L., and Morris, S. A. (2023). Dissecting cell identity via network inference and in silico gene perturbation. Nature 614 (7949), 742–751. doi:10.1038/s41586-022-05688-9
Kharchenko, P. V., Silberstein, L., and Scadden, D. T. (2014). Bayesian approach to single-cell differential expression analysis. Nat. Methods 11 (7), 740–742. doi:10.1038/nmeth.2967
Kim, D., Langmead, B., and Salzberg, S. L. (2015). HISAT: a fast spliced aligner with low memory requirements. Nat. Methods 12 (4), 357–360. doi:10.1038/nmeth.3317
Korsunsky, I., Millard, N., Fan, J., Slowikowski, K., Zhang, F., Wei, K., et al. (2019). Fast, sensitive and accurate integration of single-cell data with Harmony. Nat. Methods 16 (12), 1289–1296. doi:10.1038/s41592-019-0619-0
Kuleshov, M. V., Jones, M. R., Rouillard, A. D., Fernandez, N. F., Duan, Q., Wang, Z., et al. (2016). Enrichr: a comprehensive gene set enrichment analysis web server 2016 update. Nucleic Acids Res. 44 (W1), W90–W97. doi:10.1093/nar/gkw377
Lal, A., Chiang, Z. D., Yakovenko, N., Duarte, F. M., Israeli, J., and Buenrostro, J. D. (2021). Deep learning-based enhancement of epigenomics data with AtacWorks. Nat. Commun. 12 (1), 1507. doi:10.1038/s41467-021-21765-5
Langfelder, P., and Horvath, S. (2008). WGCNA: an R package for weighted correlation network analysis. BMC Bioinforma. 9, 559. doi:10.1186/1471-2105-9-559
Langmead, B., and Salzberg, S. L. (2012). Fast gapped-read alignment with Bowtie 2. Nat. Methods 9 (4), 357–359. doi:10.1038/nmeth.1923
Lara-Astiaso, D., Weiner, A., Lorenzo-Vivas, E., Zaretsky, I., Jaitin, D. A., David, E., et al. (2014). Immunogenetics. Chromatin state dynamics during blood formation. Science 345 (6199), 943–949. doi:10.1126/science.1256271
Lee, J. Y., and Hong, S.-H. (2020). Hematopoietic stem cells and their roles in tissue regeneration. Int. J. Stem Cells 13 (1), 1–12. doi:10.15283/ijsc19127
Li, H., and Durbin, R. (2009). Fast and accurate short read alignment with Burrows-Wheeler transform. Bioinformatics 25 (14), 1754–1760. doi:10.1093/bioinformatics/btp324
Liang, R., Arif, T., Kalmykova, S., Kasianov, A., Lin, M., Menon, V., et al. (2020). Restraining lysosomal activity preserves hematopoietic stem cell quiescence and potency. Cell Stem Cell 26 (3), 359–376.e7. doi:10.1016/j.stem.2020.01.013
Liao, Y., Smyth, G. K., and Shi, W. (2014). featureCounts: an efficient general purpose program for assigning sequence reads to genomic features. Bioinformatics 30 (7), 923–930. doi:10.1093/bioinformatics/btt656
Logan, A. C., Weissman, I. L., and Shizuru, J. A. (2012). The road to purified hematopoietic stem cell transplants is paved with antibodies. Curr. Opin. Immunol. 24 (5), 640–648. doi:10.1016/j.coi.2012.08.002
Love, M. I., Huber, W., and Anders, S. (2014). Moderated estimation of fold change and dispersion for RNA-seq data with DESeq2. Genome Biol. 15 (12), 550. doi:10.1186/s13059-014-0550-8
Lu, Y.-F., Cahan, P., Ross, S., Sahalie, J., Sousa, P. M., Hadland, B. K., et al. (2016). Engineered murine HSCs reconstitute multi-lineage hematopoiesis and adaptive immunity. Cell Rep. 17 (12), 3178–3192. doi:10.1016/j.celrep.2016.11.077
Lun, A. T. L., McCarthy, D. J., and Marioni, J. C. (2016). A step-by-step workflow for low-level analysis of single-cell RNA-seq data with Bioconductor. [version 2; peer review: 3 approved, 2 approved with reservations]. F1000Res 5, 2122. doi:10.12688/f1000research.9501.2
Lundberg, S. M., Tu, W. B., Raught, B., Penn, L. Z., Hoffman, M. M., and Lee, S.-I. (2016). ChromNet: learning the human chromatin network from all ENCODE ChIP-seq data. Genome Biol. 17, 82. doi:10.1186/s13059-016-0925-0
Marx-Blümel, L., Marx, C., Sonnemann, J., Weise, F., Hampl, J., Frey, J., et al. (2021). Molecular characterization of hematopoietic stem cells after in vitro amplification on biomimetic 3D PDMS cell culture scaffolds. Sci. Rep. 11 (1), 21163. doi:10.1038/s41598-021-00619-6
Macosko, E. Z., Basu, A., Satija, R., Nemesh, J., Shekhar, K., Goldman, M., et al. (2015). Highly parallel genome-wide expression profiling of individual cells using nanoliter droplets. Cell 161 (5), 1202–1214. doi:10.1016/j.cell.2015.05.002
Margolin, A. A., Nemenman, I., Basso, K., Wiggins, C., Stolovitzky, G., Dalla, F. R., et al. (2006). ARACNE: an algorithm for the reconstruction of gene regulatory networks in a mammalian cellular context. BMC Bioinforma. 7 (Suppl. 1), S7. doi:10.1186/1471-2105-7-S1-S7
McCarthy, D. J., Campbell, K. R., Lun, A. T. L., and Wills, Q. F. (2017). Scater: preprocessing, quality control, normalization and visualization of single-cell RNA-seq data in R. Bioinformatics 33 (8), 1179–1186. doi:10.1093/bioinformatics/btw777
McLean, C. Y., Bristor, D., Hiller, M., Clarke, S. L., Schaar, B. T., Lowe, C. B., et al. (2010). GREAT improves functional interpretation of cis-regulatory regions. Nat. Biotechnol. 28 (5), 495–501. doi:10.1038/nbt.1630
Mercatelli, D., Scalambra, L., Triboli, L., Ray, F., and Giorgi, F. M. (2020). Gene regulatory network inference resources: a practical overview. Biochim. Biophys. Acta Gene Regul. Mech. 1863 (6), 194430. doi:10.1016/j.bbagrm.2019.194430
Moignard, V., Macaulay, I. C., Swiers, G., Buettner, F., Schütte, J., Calero-Nieto, F. J., et al. (2013). Characterization of transcriptional networks in blood stem and progenitor cells using high-throughput single-cell gene expression analysis. Nat. Cell Biol. 15 (4), 363–372. doi:10.1038/ncb2709
Moignard, V., Woodhouse, S., Haghverdi, L., Lilly, A. J., Tanaka, Y., Wilkinson, A. C., et al. (2015). Decoding the regulatory network of early blood development from single-cell gene expression measurements. Nat. Biotechnol. 33 (3), 269–276. doi:10.1038/nbt.3154
Negrin, R. S., Atkinson, K., Leemhuis, T., Hanania, E., Juttner, C., Tierney, K., et al. (2000). Transplantation of highly purified CD34+Thy-1+ hematopoietic stem cells in patients with metastatic breast cancer. Biol. Blood Marrow Transpl. 6 (3), 262–271. doi:10.1016/s1083-8791(00)70008-5
Ng, A. P., and Alexander, W. S. (2017). Haematopoietic stem cells: past, present and future. Cell Death Discov. 3, 17002. doi:10.1038/cddiscovery.2017.2
Olsson, A., Venkatasubramanian, M., Chaudhri, V. K., Aronow, B. J., Salomonis, N., Singh, H., et al. (2016). Single-cell analysis of mixed-lineage states leading to a binary cell fate choice. Nature 537 (7622), 698–702. doi:10.1038/nature19348
Qi, Q., Cheng, L., Tang, X., He, Y., Li, Y., Yee, T., et al. (2021). Dynamic CTCF binding directly mediates interactions among cis-regulatory elements essential for hematopoiesis. Blood 137 (10), 1327–1339. doi:10.1182/blood.2020005780
Qiu, X., Hill, A., Packer, J., Lin, D., Ma, Y.-A., and Trapnell, C. (2017b). Single-cell mRNA quantification and differential analysis with Census. Nat. Methods 14 (3), 309–315. doi:10.1038/nmeth.4150
Qiu, X., Mao, Q., Tang, Y., Wang, L., Chawla, R., Pliner, H. A., et al. (2017a). Reversed graph embedding resolves complex single-cell trajectories. Nat. Methods 14 (10), 979–982. doi:10.1038/nmeth.4402
Raghav, P. K., Singh, A. K., and Gangenahalli, G. (2018). Stem cell factor and NSC87877 combine to enhance c-Kit mediated proliferation of human megakaryoblastic cells. PLoS ONE 13 (11), e0206364. doi:10.1371/journal.pone.0206364
Risso, D., Perraudeau, F., Gribkova, S., Dudoit, S., and Vert, J.-P. (2018). A general and flexible method for signal extraction from single-cell RNA-seq data. Nat. Commun. 9 (1), 284. doi:10.1038/s41467-017-02554-5
Ritchie, M. E., Phipson, B., Wu, D., Hu, Y., Law, C. W., Shi, W., et al. (2015). Limma powers differential expression analyses for RNA-sequencing and microarray studies. Nucleic Acids Res. 43 (7), e47. doi:10.1093/nar/gkv007
Robinson, M. D., McCarthy, D. J., and Smyth, G. K. (2010). edgeR: a Bioconductor package for differential expression analysis of digital gene expression data. Bioinformatics 26 (1), 139–140. doi:10.1093/bioinformatics/btp616
Rodriguez-Fraticelli, A. E., Weinreb, C., Wang, S.-W., Migueles, R. P., Jankovic, M., Usart, M., et al. (2020). Single-cell lineage tracing unveils a role for TCF15 in haematopoiesis. Nature 583 (7817), 585–589. doi:10.1038/s41586-020-2503-6
Rodriguez-Fraticelli, A. E., Wolock, S. L., Weinreb, C. S., Panero, R., Patel, S. H., Jankovic, M., et al. (2018). Clonal analysis of lineage fate in native haematopoiesis. Nature 553 (7687), 212–216. doi:10.1038/nature25168
Rothenberg, E. V. (2021). Single-cell insights into the hematopoietic generation of T-lymphocyte precursors in mouse and human. Exp. Hematol. 95, 1–12. doi:10.1016/j.exphem.2020.12.005
Saint-Antoine, M. M., and Singh, A. (2020). Network inference in systems biology: recent developments, challenges, and applications. Curr. Opin. Biotechnol. 63, 89–98. doi:10.1016/j.copbio.2019.12.002
Satija, R., Farrell, J. A., Gennert, D., Schier, A. F., and Regev, A. (2015). Spatial reconstruction of single-cell gene expression data. Nat. Biotechnol. 33 (5), 495–502. doi:10.1038/nbt.3192
Scikit-Learn, K. O. (2016). Machine learning for evolution strategies. Cham: Springer International Publishing, 45–53.
Serina Secanechia, Y. N., Bergiers, I., Rogon, M., Arnold, C., Descostes, N., Le, S., et al. (2022). Identifying a novel role for the master regulator Tal1 in the endothelial to hematopoietic transition. Sci. Rep. 12 (1), 16974. doi:10.1038/s41598-022-20906-0
Shannon, P., Markiel, A., Ozier, O., Baliga, N. S., Wang, J. T., Ramage, D., et al. (2003). Cytoscape: a software environment for integrated models of biomolecular interaction networks. Genome Res. 13 (11), 2498–2504. doi:10.1101/gr.1239303
Shin, J., Berg, D. A., Zhu, Y., Shin, J. Y., Song, J., Bonaguidi, M. A., et al. (2015). Single-cell RNA-seq with Waterfall reveals molecular cascades underlying adult neurogenesis. Cell Stem Cell 17 (3), 360–372. doi:10.1016/j.stem.2015.07.013
Skulimowska, I., Sosniak, J., Gonka, M., Szade, A., Jozkowicz, A., and Szade, K. (2022). The biology of hematopoietic stem cells and its clinical implications. FEBS J. 289 (24), 7740–7759. doi:10.1111/febs.16192
Smith, T., Heger, A., and Sudbery, I. (2017). UMI-tools: modeling sequencing errors in Unique Molecular Identifiers to improve quantification accuracy. Genome Res. 27 (3), 491–499. doi:10.1101/gr.209601.116
Street, K., Risso, D., Fletcher, R. B., Das, D., Ngai, J., Yosef, N., et al. (2018). Slingshot: cell lineage and pseudotime inference for single-cell transcriptomics. BMC Genomics 19 (1), 477. doi:10.1186/s12864-018-4772-0
Stuart, T., Butler, A., Hoffman, P., Hafemeister, C., Papalexi, E., Mauck, W. M., et al. (2019). Comprehensive integration of single-cell data. Cell 177 (7), 1888–1902.e21. doi:10.1016/j.cell.2019.05.031
Subramanian, A., Tamayo, P., Mootha, V. K., Mukherjee, S., Ebert, B. L., Gillette, M. A., et al. (2005). Gene set enrichment analysis: a knowledge-based approach for interpreting genome-wide expression profiles. Proc. Natl. Acad. Sci. U. S. A. 102 (43), 15545–15550. doi:10.1073/pnas.0506580102
Subramanian, S., Thoms, J. A. I., Huang, Y., Cornejo-Páramo, P., Koch, F. C., Jacquelin, S., et al. (2023). Genome-wide transcription factor-binding maps reveal cell-specific changes in the regulatory architecture of human HSPCs. Blood 142 (17), 1448–1462. doi:10.1182/blood.2023021120
Townes, F. W., Hicks, S. C., Aryee, M. J., and Irizarry, R. A. (2019). Feature selection and dimension reduction for single-cell RNA-Seq based on a multinomial model. Genome Biol. 20 (1), 295. doi:10.1186/s13059-019-1861-6
Trapnell, C., Cacchiarelli, D., Grimsby, J., Pokharel, P., Li, S., Morse, M., et al. (2014). The dynamics and regulators of cell fate decisions are revealed by pseudotemporal ordering of single cells. Nat. Biotechnol. 32 (4), 381–386. doi:10.1038/nbt.2859
Tricot, G., Cottler-Fox, M. H., and Calandra, G. (2010). Safety and efficacy assessment of plerixafor in patients with multiple myeloma proven or predicted to be poor mobilizers, including assessment of tumor cell mobilization. Bone Marrow Transplant. 45 (1), 63–68. doi:10.1038/bmt.2009.130
Tusi, B. K., Wolock, S. L., Weinreb, C., Hwang, Y., Hidalgo, D., Zilionis, R., et al. (2018). Population snapshots predict early haematopoietic and erythroid hierarchies. Nature 555 (7694), 54–60. doi:10.1038/nature25741
Vanuytsel, K., Villacorta-Martin, C., Lindstrom-Vautrin, J., Wang, Z., Garcia-Beltran, W. F., Vrbanac, V., et al. (2022). Multi-modal profiling of human fetal liver hematopoietic stem cells reveals the molecular signature of engraftment. Nat. Commun. 13 (1), 1103. doi:10.1038/s41467-022-28616-x
Velten, L., Haas, S. F., Raffel, S., Blaszkiewicz, S., Islam, S., Hennig, B. P., et al. (2017). Human haematopoietic stem cell lineage commitment is a continuous process. Nat. Cell Biol. 19 (4), 271–281. doi:10.1038/ncb3493
Wang, L., Wang, S., and Li, W. (2012). RSeQC: quality control of RNA-seq experiments. Bioinformatics 28 (16), 2184–2185. doi:10.1093/bioinformatics/bts356
Wang, S., Han, J., Huang, J., Islam, K., Shi, Y., Zhou, Y., et al. (2024). Deep learning-based predictive classification of functional subpopulations of hematopoietic stem cells and multipotent progenitors. Stem Cell Res. Ther. 15 (1), 74. doi:10.1186/s13287-024-03682-8
Wang, T., Li, B., Nelson, C. E., and Nabavi, S. (2019). Comparative analysis of differential gene expression analysis tools for single-cell RNA sequencing data. BMC Bioinforma. 20 (1), 40. doi:10.1186/s12859-019-2599-6
Weissman, I. L., and Shizuru, J. A. (2008). The origins of the identification and isolation of hematopoietic stem cells, and their capability to induce donor-specific transplantation tolerance and treat autoimmune diseases. Blood 112 (9), 3543–3553. doi:10.1182/blood-2008-08-078220
Wilson, N. K., Kent, D. G., Buettner, F., Shehata, M., Macaulay, I. C., Calero-Nieto, F. J., et al. (2015). Combined single-cell functional and gene expression analysis resolves heterogeneity within stem cell populations. Cell Stem Cell 16 (6), 712–724. doi:10.1016/j.stem.2015.04.004
Wilson, N. K., Schoenfelder, S., Hannah, R., Sánchez Castillo, M., Schütte, J., Ladopoulos, V., et al. (2016). Integrated genome-scale analysis of the transcriptional regulatory landscape in a blood stem/progenitor cell model. Blood 127 (13), e12–e23. doi:10.1182/blood-2015-10-677393
Wolf, F. A., Angerer, P., and Theis, F. J. (2018). SCANPY: large-scale single-cell gene expression data analysis. Genome Biol. 19 (1), 15. doi:10.1186/s13059-017-1382-0
Xia, B., Zhao, D., Wang, G., Zhang, M., Lv, J., Tomoiaga, A. S., et al. (2020). Machine learning uncovers cell identity regulator by histone code. Nat. Commun. 11 (1), 2696. doi:10.1038/s41467-020-16539-4
Xiang, G., Keller, C. A., Heuston, E., Giardine, B. M., An, L., Wixom, A. Q., et al. (2020). An integrative view of the regulatory and transcriptional landscapes in mouse hematopoiesis. Genome Res. 30 (3), 472–484. doi:10.1101/gr.255760.119
Xie, H., Xu, J., Hsu, J. H., Nguyen, M., Fujiwara, Y., Peng, C., et al. (2014). Polycomb repressive complex 2 regulates normal hematopoietic stem cell function in a developmental-stage-specific manner. Cell Stem Cell 14 (1), 68–80. doi:10.1016/j.stem.2013.10.001
Xiong, Z., Cui, Y., Liu, Z., Zhao, Y., Hu, M., and Hu, J. (2020). Evaluating explorative prediction power of machine learning algorithms for materials discovery using-fold forward cross-validation. Comp. Mater Sci. 171, 109203. doi:10.1016/j.commatsci.2019.109203
Xu, S., Grullon, S., Ge, K., and Peng, W. (2014). Spatial clustering for identification of ChIP-enriched regions (SICER) to map regions of histone methylation patterns in embryonic stem cells. Methods Mol. Biol. 1150, 97–111. doi:10.1007/978-1-4939-0512-6_5
Xu, S., Hu, E., Cai, Y., Xie, Z., Luo, X., Zhan, L., et al. (2024). Using clusterProfiler to characterize multiomics data. Nat. Protoc. 19 (11), 3292–3320. doi:10.1038/s41596-024-01020-z
Yu, G., Wang, L.-G., Han, Y., and He, Q.-Y. (2012). clusterProfiler: an R package for comparing biological themes among gene clusters. OMICS 16 (5), 284–287. doi:10.1089/omi.2011.0118
Yu, G., Wang, L.-G., and He, Q.-Y. (2015). ChIPseeker: an R/Bioconductor package for ChIP peak annotation, comparison and visualization. Bioinformatics 31 (14), 2382–2383. doi:10.1093/bioinformatics/btv145
Zhang, A., Wei, Y., Shi, Y., Deng, X., Gao, J., Feng, Y., et al. (2021). Profiling of h3k4me3 and h3k27me3 and their roles in gene subfunctionalization in allotetraploid cotton. Front. Plant Sci. 12, 761059. doi:10.3389/fpls.2021.761059
Zhang, A. W., O’Flanagan, C., Chavez, E. A., Lim, J. L. P., Ceglia, N., McPherson, A., et al. (2019). Probabilistic cell-type assignment of single-cell RNA-seq for tumor microenvironment profiling. Nat. Methods 16 (10), 1007–1015. doi:10.1038/s41592-019-0529-1
Zhang, Y., Liu, T., Meyer, C. A., Eeckhoute, J., Johnson, D. S., Bernstein, B. E., et al. (2008). Model-based analysis of ChIP-seq (MACS). Genome Biol. 9 (9), R137. doi:10.1186/gb-2008-9-9-r137
Keywords: Hematopoietic stem cells (HSCs), single-cell RNA sequencing (scRNA-Seq), computational biology, regenerative medicine, stem cell therapy, HSC transplantation, self-renewal, differentiation
Citation: Raghav PK, Banerjee B and Chadha R (2025) Unlocking hematopoietic stem cell potential: integrative computational approaches for genomic and transcriptomic analysis. Front. Cell Dev. Biol. 13:1589823. doi: 10.3389/fcell.2025.1589823
Received: 08 March 2025; Accepted: 11 June 2025;
Published: 03 September 2025.
Edited by:
Mariastefania Antica, Institute for Medical Research and Occupational Health, CroatiaReviewed by:
Armel Hervé Nwabo Kamdje, University of Garoua, CameroonMelissa Rayner, University College London, United Kingdom
Copyright © 2025 Raghav, Banerjee and Chadha. This is an open-access article distributed under the terms of the Creative Commons Attribution License (CC BY). The use, distribution or reproduction in other forums is permitted, provided the original author(s) and the copyright owner(s) are credited and that the original publication in this journal is cited, in accordance with accepted academic practice. No use, distribution or reproduction is permitted which does not comply with these terms.
*Correspondence: Pawan Kumar Raghav, UHduUmdodkBnbWFpbC5jb20=