Abstract
Introduction:
Clinical studies reveal bidirectional links between sarcopenia (SP) and diabetic nephropathy (DN). Damage to mitochondria in DN may result in diminished energy production, which consequently triggers SP. Consequently, mitochondria seem to function as critical nodes connecting DN with SP. The objective of this research was to pinpoint biomarkers associated with mitochondrial dysfunction in DN and SP.
Methods:
By analyzing the Gene Expression Omnibus (GEO) repository, we identified shared differentially expressed genes (DEGs) in the DN (GSE96804, GSE30528) and SP (GSE1428, GSE136344) datasets that displayed similar expression trends in mitochondrial genes. Using Least Absolute Shrinkage and Selection Operator (LASSO), Support Vector Machine (SVM), Extreme Gradient Boosting (XGB), and Random Forest (RF) algorithms, we identified three key mitochondrial hub genes. Diagnostic nomograms were created to predict DN and SP risk. We assessed immune infiltration using CIBERSORT and built a drug-gene network with Cytoscape. Molecular docking determined binding affinities between potential drugs and hub genes, which were validated in the datasets.
Results:
Analysis of GEO datasets identified 80 shared DEGs between DN and SP, including 10 mitochondria-related genes. Utilizing four machine learning algorithms (LASSO, SVM, XGBoost, RF), we pinpointed three mitochondrial hub genes. Subsequent validation confirmed two key mitochondria-related genes - HTT and TTC19 - as shared diagnostic biomarkers for both DN and SP. These biomarkers demonstrated strong diagnostic power (AUC >0.8), leading to the construction of diagnostic nomograms. Immune infiltration analysis revealed elevated M1 macrophages in DN and increased M2 macrophages in SP, with both biomarkers showing significant correlations with various immune cells. Gene set enrichment analysis linked HTT and TTC19 to mitochondrial metabolic processes. Crucially, in silico drug prediction identified 156 potential drugs, and molecular docking confirmed a high binding affinity between acetaminophen and the HTT protein.
Conclusion:
Our study identifies HTT and TTC19 as novel mitochondria-immune related biomarkers common to both DN and SP, providing insights into their shared pathogenesis involving mitochondrial dysfunction and immune dysregulation. The computational prediction of acetaminophen interaction highlights a potential avenue for therapeutic exploration. Further clinical and mechanistic studies are warranted to validate these findings and elucidate the underlying pathways.
1 Introduction
Diabetic nephropathy (DN) represents the predominant primary etiology of end-stage renal disease (ESRD) (Yu and Bonventre, 2018). Research indicates that approximately 30%–40% of individuals with Type 1 Diabetes Mellitus (T1DM) will develop DN, with around 50% of these cases advancing to ESRD (Kato and Natarajan, 2019). The pathogenesis of DN is characterized by a complex interaction of metabolic and inflammatory responses, hemodynamic factors, and various etiological determinants (Kato and Natarajan, 2019). Furthermore, oxidative stress, mitochondrial dysfunction, and renal hypoxia are implicated in the progression and exacerbation of DN. Mitochondrial dysfunction has emerged as a critical factor in the progression of DN, given its essential role in cellular energy metabolism and the regulation of reactive oxygen species (ROS). Studies have demonstrated that elevated blood glucose levels result in the overloading of the electron transport chain, subsequently increasing the production of ROS. This increase in ROS induces DNA damage and reduces the activity of glyceraldehyde-3-phosphate dehydrogenase (GAPDH) (Takasu et al., 2025). Additionally, the reduction of superoxide within the mitochondria exacerbates the inflammatory response by impairing vascular function and activating the nuclear factor-κB (NF-κB) pathway in B cells (Takasu et al., 2025; Wei and Szeto, 2019). The consequent impairment of mitochondrial function ultimately initiates apoptosis and cell death, contributing to the onset and progression of DN (Chang et al., 2021). Sarcopenia (SP) is a skeletal muscle disorder marked by the gradual decline in muscle mass and strength. The adverse effects of SP primarily encompass an elevated risk of falls, fractures, and disability, potentially resulting in the loss of independent living capabilities among older adults. Additionally, SP is associated with heightened rates of all-cause mortality and disability in this population (Cruz-Jentoft and Sayer, 2019). In comparison to youthful musculature, aging muscles exhibit an increased production of ROS and a concomitant decline in both oxygen consumption and ATP synthesis (Kamarulzaman and Makpol, 2025). In senescent skeletal muscles, various stimuli, including calcium, oxidative stress, and TNF-α, have the potential to induce apoptosis (Bottoni et al., 2019). Furthermore, alterations in mitochondrial protein interactions, cristae architecture, and mitochondrial networks may result in ADP insensitivity, thereby contributing to the development of SP [7].
The association between DN and SP is receiving increasing scholarly attention. A meta-analysis has identified DN as a risk factor for the onset of SP in individuals with diabetes (Feng et al., 2022). Additionally, emerging studies have underscored SP as a distinct risk factor for the development of DN. Furthermore, recent research has highlighted SP as an independent risk factor for DN (Huang et al., 2022). Despite the prevalence of SP and DN as comorbidities in elderly diabetic patients, no studies to date have confirmed a shared pathogenic mechanism underlying these two conditions. This underscores the necessity of investigating their common molecular pathways. In patients with DN, elevated serum levels of oxidative stress markers have been observed, which are significant contributors to renal tubular cell damage and the progression of DN (Xu et al., 2016). Mitochondria, serving as the cellular energy centers, are vital for maintaining cellular homeostasis but are particularly vulnerable to oxidative stress-induced damage (Min et al., 1985). Mitochondrial damage is pivotal in the pathophysiology of DN and SP, potentially acting as a nexus between these conditions. Under hyperglycemic conditions, mitochondria generate an excessive amount of ROS, which induces oxidative stress and results in damage to glomerular and tubular cells, as well as mitochondrial dysfunction (Takasu et al., 2025). This dysfunction not only impairs the energy metabolism of renal cells, thereby exacerbating renal damage (Takasu et al., 2025), but may also activate apoptotic signaling pathways, leading to the apoptosis of muscle cells and consequently facilitating the progression of SP (Bottoni et al., 2019). Thus, the identification of mitochondrial-related biomarkers common to both DN and SP could provide valuable insights for the diagnosis and treatment of these conditions.
Our research endeavor seeks to synthesize various public datasets to identify mitochondrial genes linked to DN and SP, and to assess their diagnostic significance in these conditions. Through the application of differential expression analysis, machine learning algorithms, and immune infiltration analysis, we aim to elucidate the potential molecular mechanisms underlying these diseases. Our findings reveal druggable targets and diagnostic markers associated with the shared pathological mechanisms between DN and SP.
2 Materials and methods
2.1 Data download and integration
The datasets for DN, GSE96804 (Pan et al., 2018; Shi et al., 2018) and GSE30528 (Woroniecka et al., 2011), and the datasets for sarcopenia (SP), GSE1428 (Giresi et al., 2005) and GSE136344 (Gueugneau et al., 2021), were all retrieved from the GEO database (https://www.ncbi.nlm.nih.gov/geo/). Four datasets were analyzed using distinct microarray platforms: GSE30528 (GPL571) and GSE1428 (GPL96) employed Human Genome U133A arrays (v2.0 and original respectively), whereas GSE96804 (GPL17586) and GSE136344 (GPL5175) utilized Human Transcriptome Array 2.0 and Exon 1.0 ST Array platforms correspondingly. In the DN datasets, two independent DN cohorts were analyzed: GSE30528 (13 controls vs. 9 DN cases) and GSE96804, which comprised renal tubular specimens from 20 healthy donors and 41 DN patients. The subsequent integration of these datasets resulted in a combined total of 33 control and 50 DN samples, ensuring statistical robustness for the differential expression analysis. In the SP datasets, GSE1428 included 10 young samples and 12 elderly samples, and GSE136344 included 11 young samples and 12 elderly samples. The data from the two datasets were integrated, resulting in a combined dataset with 21 young and 24 elderly normal tissue samples. Specific dataset information is provided in Table 1. We used the R package “sva” (Leek et al., 2012) to perform batch effect removal on the DN datasets GSE30528 and GSE96804, and the SP datasets GSE1428 and GSE136344, respectively, to obtain the integrated datasets DN-Datasets and SP-Datasets. The study workflow is illustrated in Supplementary Figure S1.
TABLE 1
| GSE30528 | GSE96804 | GSE1428 | GSE136344 | |
|---|---|---|---|---|
| Platform | GPL571 | GPL17586 | GPL196 | GPL5175 |
| Experiment type | Expression profiling by array | Expression profiling by array | Expression profiling by array | Expression profiling by array |
| Species | Homo sapiens | Homo sapiens | Homo sapiens | Homo sapiens |
| Tissue | Glomeruli | Glomeruli | Vastus lateralis muscle | Vastus lateralis muscle |
| Samples in control group | Control (13) | Control (20) | 10 young (19–25 years old) | 11 young samples |
| Samples in disease group | DN (9) | DN (41) | 12 older (70–80 years old) | 12 elderly samples |
| Reference | Transcriptome analysis of human diabetic kidney disease | Dissection of Glomerular Transcriptional Profile in Patients With Diabetic Nephropathy: SRGAP2a Protects Podocyte Structure and Function | Identification of a molecular signature of sarcopenia | Muscle Proteomic and Transcriptomic Profiling of Healthy Aging and Metabolic Syndrome in Men |
GEO dataset information list.
DN, diabetic nephropathy.
2.2 Differential expression gene analysis
We used the “limma” package in R software to perform differential analysis on the expression profile data of the DN - Datasets and SP - Datasets respectively, and screened the genes with the criteria of |logFC| > 0.25 and p. value <0.05. The differential expression analysis outcomes were visualized through a volcano plot, which was created utilizing the R package ggplot2.
2.3 Identification of genes with the same trend and mitochondria-related DEGs
We screened the differentially expressed genes (DEGs) that showed a common expression trend. By searching the GeneCard (Stelzer et al., 2016) database (https://www.genecards.org/), we identified 2,676 mitochondria-related genes using a correlation score exceeding 1 as the filtering criterion. The overlap between genes co-expressed differentially and those associated with mitochondria was utilized to pinpoint differentially expressed genes linked to mitochondrial functions.
2.4 Gene function enrichment analysis
The “enrichplot” package was employed to visualize the Gene Ontology (GO) (Gene Ontology Consortium, 2015) enrichment outcomes, encompassing biological processes, cellular components, and molecular functions. Furthermore, a network diagram was created to illustrate the enrichment findings from the Kyoto Encyclopedia of Genes and Genomes (KEGG) (Kanehisa and Goto, 2000) analysis.
2.5 Selection of key mitochondrial genes using machine learning algorithms
Least Absolute Shrinkage and Selection Operator (LASSO) is used for initial dimensionality reduction and linear feature screening; Support Vector Machine (SVM) handles nonlinear classification of high-dimensional small-sample data; and Random Forest (RF) and Extreme Gradient Boosting (XGB) capture complex interaction effects among genes through integrated learning. Ultimately, only genes selected in all four algorithms are defined as key biomarkers to ensure the robustness and interpretability of the results. We employed the LASSO, XGB, SVM, and RF methods to identify critical prognostic genes, and we constructed regression models with the aid of the “glmnet” package in R. The penalty coefficient was established using a tenfold cross-validation process. Subsequently, the Random Forest model was created with the “randomForest” package in R, following which the top ten variables were selected based on their importance scores. The XGB model was developed with the assistance of the “xgboost” package in R, which facilitated the selection of key variables based on feature importance scores (Gain or Cover) through tenfold cross-validation. For SVM, the “e1071”package was utilized to perform recursive feature elimination (SVM-RFE) for variable selection. A Venn diagram was utilized to determine the overlapping DEGs related to mitochondria, which were identified by the LASSO, XGB, SVM, and RF methods.
2.6 Diagnostic model construction and evaluation
We applied the “rms” (Xu et al., 2021) package to construct a Nomogram model to predict the risk of patients. A calibration curve was used to determine the degree of match between our predicted values and the reality. Decision curve analysis (DCA) was performed to evaluate whether model - based decisions were beneficial to patients.
2.7 Immune infiltration analysis
We utilized the CIBERSORT tool, an algorithm for Cell Type Identification By Estimating Relative Subsets Of RNA Transcripts (Kawada et al., 2021), to deconvolute the cellular composition of intricate tissues from gene expression profiles (https://cibersort.stanford.edu/). We carried out an analysis to investigate immune cell infiltration in the samples from patients, comparing the disease group with the normal control group. The “e1071”and “preprocessor” packages in R software were used in combination with the CIBERSORT algorithm. Additionally, we assessed the correlation between hub DEGs associated with mitochondria and the aforementioned immune cells, and we have depicted these findings in a heat map format. Furthermore, we measured the immune cell composition within each individual sample. The simulation was conducted with a total of n calculations, and outcomes with a significance level of p < 0.05 were filtered and kept for analysis.
2.8 GSEA analysis
Utilizing the “enrichR” package within R, we performed Gene Set Enrichment Analysis (GSEA) (Subramanian et al., 2005). The hallmark gene set and immune signature gene set were downloaded as the background sets for the enrichment analysis. Subsequently, we computed the enrichment score and p-value for each gene set via the GSEA method.
2.9 Drug prediction and molecular docking
First, we used the Comparative Toxicogenomics Database (CTD) (Davis et al., 2021) to predict drugs for the genes (http://ctdbase.org/.) A miRNA - drug regulatory network was constructed and visualized using Cytoscape. Structural data for target proteins and drug components were obtained from the Protein Data Bank (PDB, http://www.rcsb.org) and the PubChem database (Cob-Calan et al., 2019) (https://pubchem.ncbi.nlm.nih.gov). Subsequently, the protein structures were transformed into *.pdbqt format, following which molecular docking was carried out using the web-based tool CB-dock2 (https://cadd.labshare.cn/cb - dock2). The folding patterns and molecular interactions between the target protein and ligand molecules were examined to obtain the binding energy for screening.
2.10 Statistical analysis
All data processing and analysis in this study were conducted using R software (Version 4.3.3). For the comparison of two groups of continuous variables, the independent Student’s t-test was employed to estimate the statistical significance of normally distributed variables, while the Mann-Whitney U test (also known as the Wilcoxon rank-sum test) was utilized to analyze differences between non-normally distributed variables. For comparisons involving three or more groups, the Kruskal–Wallis test was applied. Chi-square tests or Fisher’s exact tests were used to assess the statistical significance of categorical variables between two groups. Spearman’s correlation method was employed to compute the correlation coefficients between various molecules. Unless otherwise specified, all statistical P values were two-tailed, with a significance level set at P < 0.05.
3 Results
3.1 Differential analysis of datasets
We initially employed the R package “sva” to perform batch effect removal on the DN-Dataset and SP-Datasets, resulting in the batch-corrected DN-Datasets and SP-Datasets. Subsequently, we compared the datasets before and after batch effect correction using Principal Component Analysis (PCA), as illustrated in Figures 1A–D. The PCA results indicate that the batch effects in the samples of the datasets have been largely eliminated following the batch removal procedure. Differential analysis was conducted using the “limma” package, and the results were visualized through a volcano plot. In the DN-Datasets, a total of 2,308 differentially expressed genes were identified, comprising 1,171 upregulated genes and 1,137 downregulated genes (Figure 1E). Furthermore, within the SP-Datasets, we detected 253 genes displaying differential expression, comprising 117 that were upregulated and 136 that were downregulated (Figure 1F).
FIGURE 1
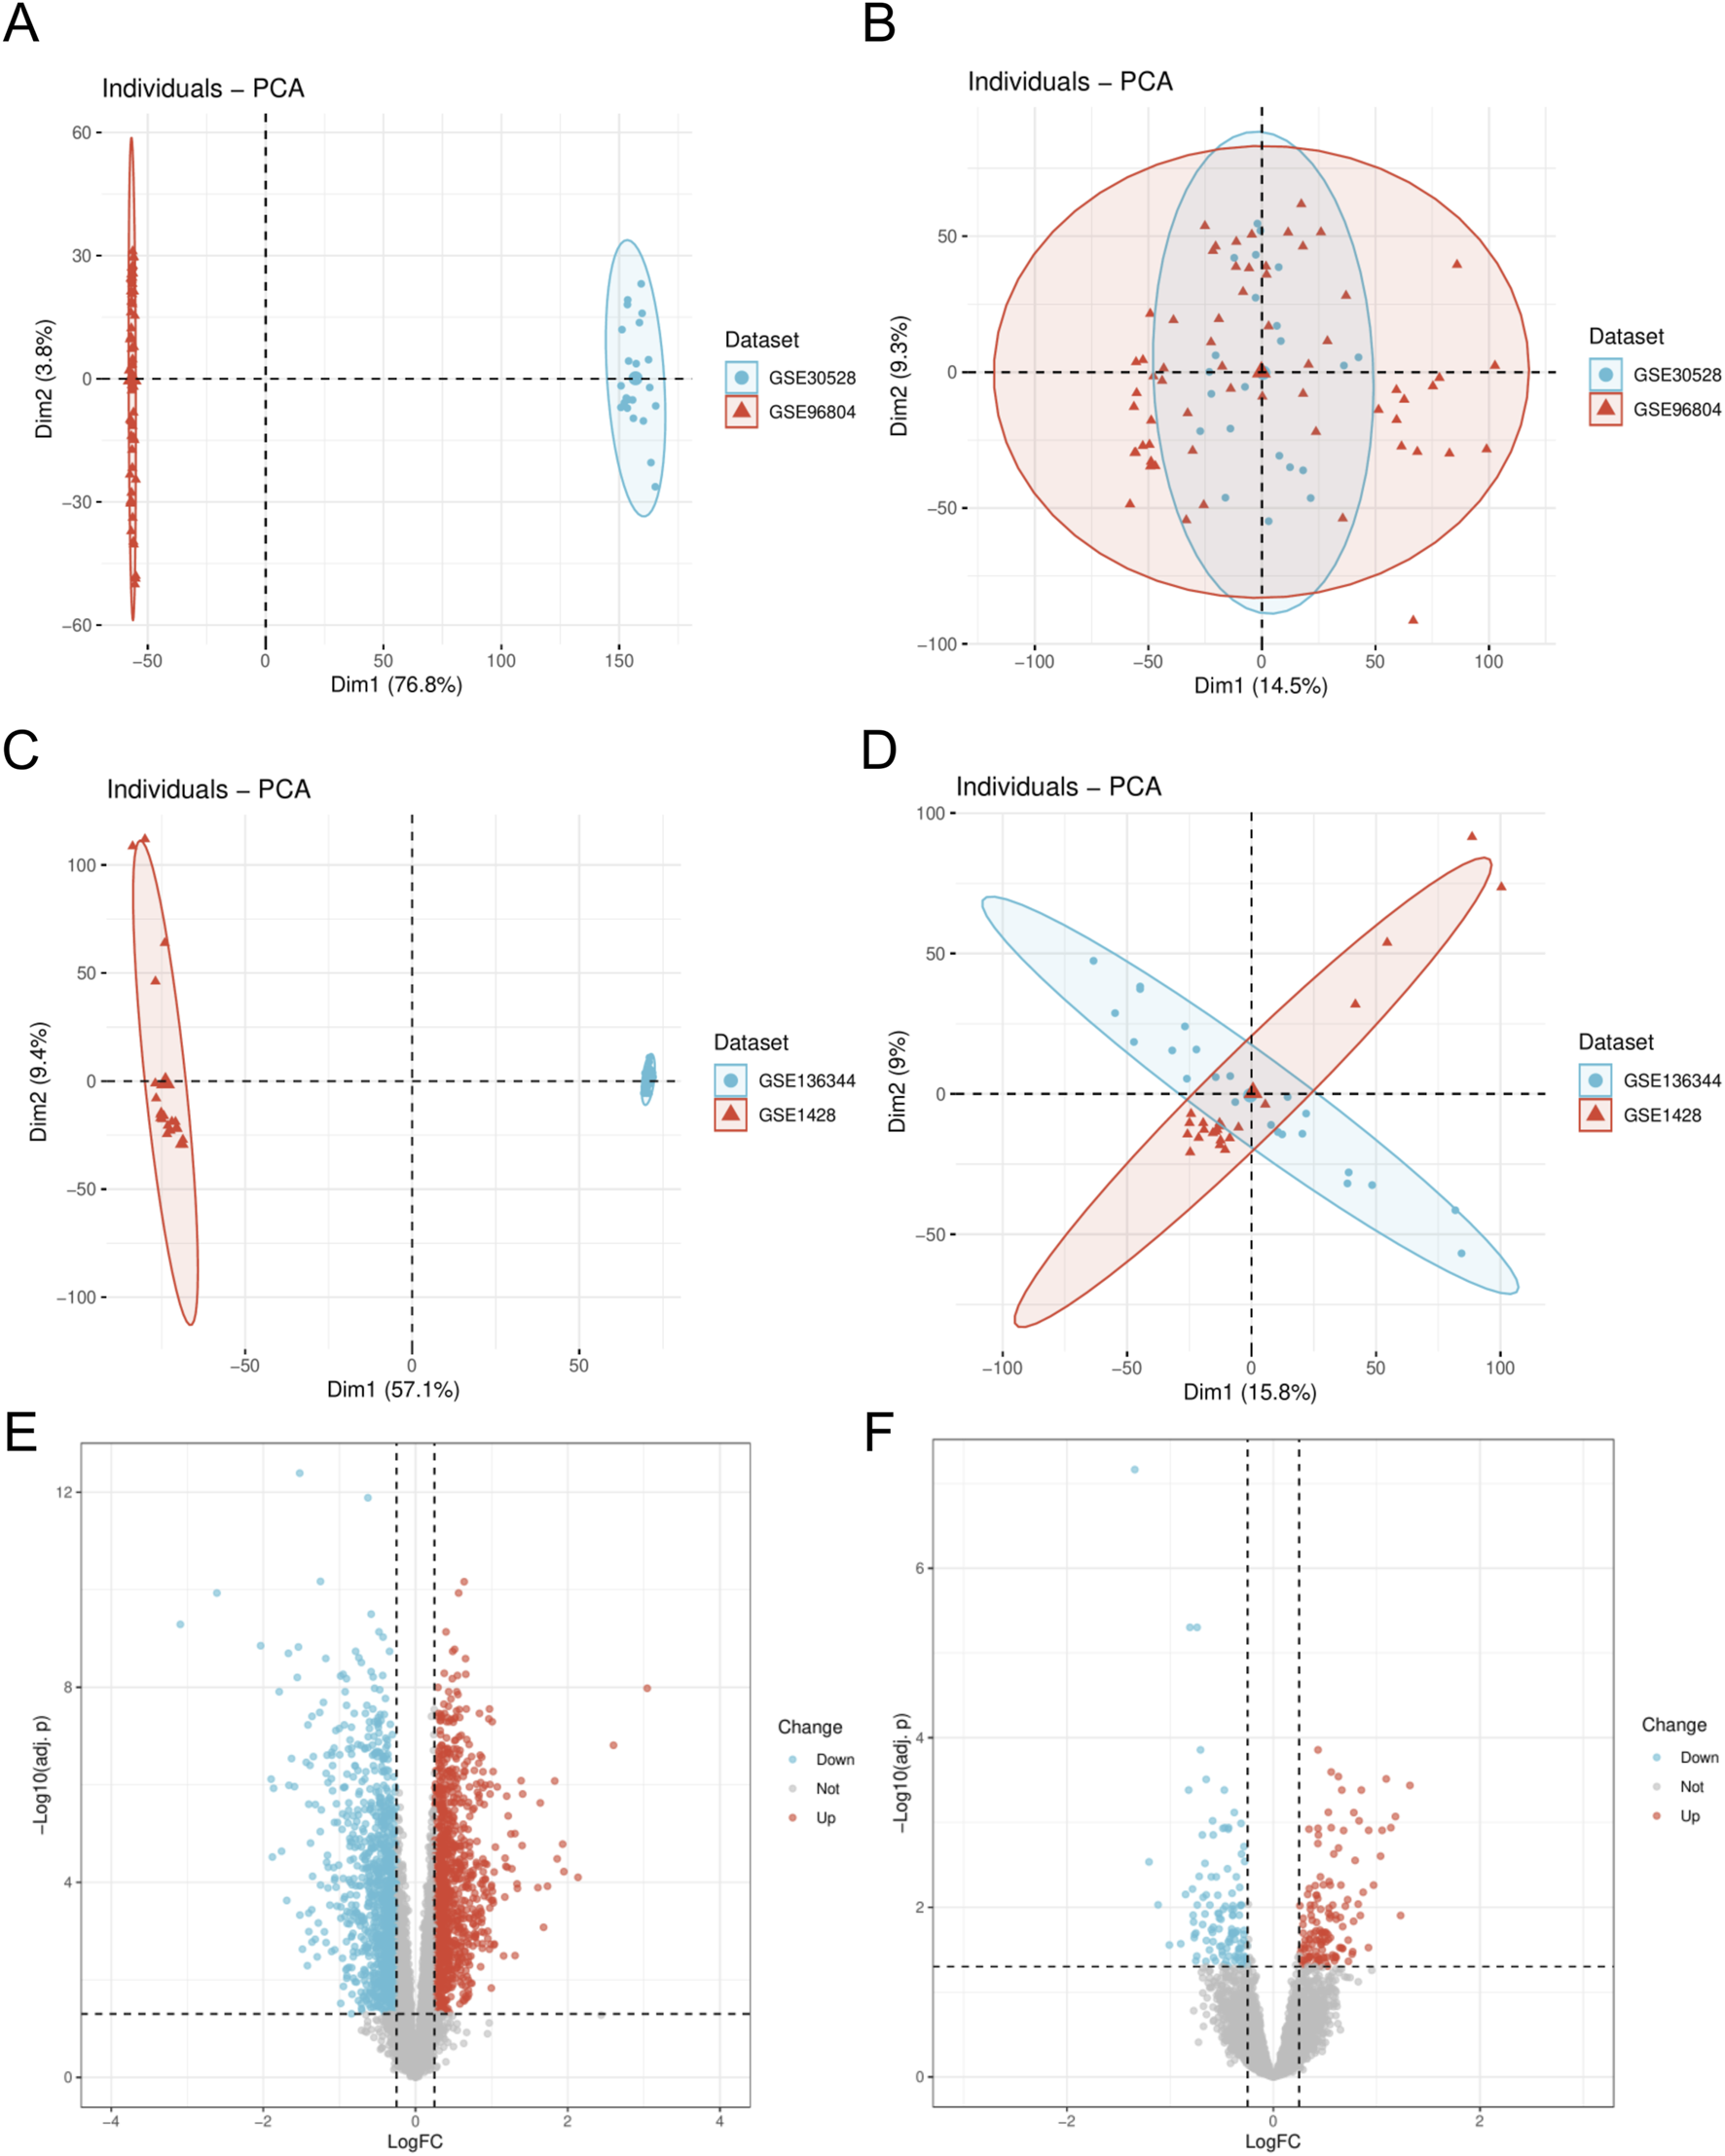
Dataset correction and analysis of differentially expressed genes. (A) PCA plot of DN- Datasets before correction. (B) PCA plot of the corrected DN-Datasets. (C) PCA plot of SP- Datasets before correction. (D) PCA plot of the corrected SP- Datasets. (E) Volcano plot of differential analysis results between DN and Control groups in the DN- Datasets dataset. (F) Volcano plot of differential analysis results between SP and Control groups in the SP- Datasets dataset. DN, Diabetic nephropathy; SP, Sarcopenia. The Diabetic nephropathy (DN) dataset GSE30528 is in light blue, and the Diabetic nephropathy (DN) dataset GSE96804 is in light red. The Sarcopenia (SP) dataset GSE136344 is in light blue, and the Sarcopenia (SP) dataset GSE1428 is in light red.
3.2 Identification of mitochondrial-related genes
We screened differentially expressed genes (DEGs) exhibiting similar expression trends (Figure 2A) and selected those that intersected with mitochondria-related genes (Figure 3A). This resulted in the identification of ten mitochondria-related DEGs: CKB, FAM162A, HSPE1, HTT, NFKBIA, PPARGC1A, PRKDC, QDPR, TTC19, and UCHL1. In the biological process (BP) enrichment analysis, DEGs with similar expression trends were primarily associated with the regulation of cellular circadian rhythms. This is closely linked to processes such as the cell cycle and metabolism (Figure 2B). During the analysis of cellular component (CC) enrichment, the main enrichment was observed in the extracellular matrix. In the molecular function (MF) enrichment analysis, the predominant enrichment was related to transcriptional corepressor binding (Figure 2C,D). KEGG pathway analysis indicated that these genes were enriched in pathways associated with circadian rhythms, apoptosis, and the RAS signaling pathway (Figure 2E). For the BP enrichment analysis of mitochondria-related DEGs, the primary enrichment was related to circadian rhythms. In the CC enrichment analysis, it was mainly associated with presynaptic and postsynaptic cytoplasm, and in the MF enrichment analysis, it was predominantly linked to transcription factor binding (Figures 3B–D). KEGG pathway analysis demonstrated that these genes were enriched in pathways related to insulin resistance, adipokine signaling, and arginine and proline metabolism (Figure 3E).
FIGURE 2
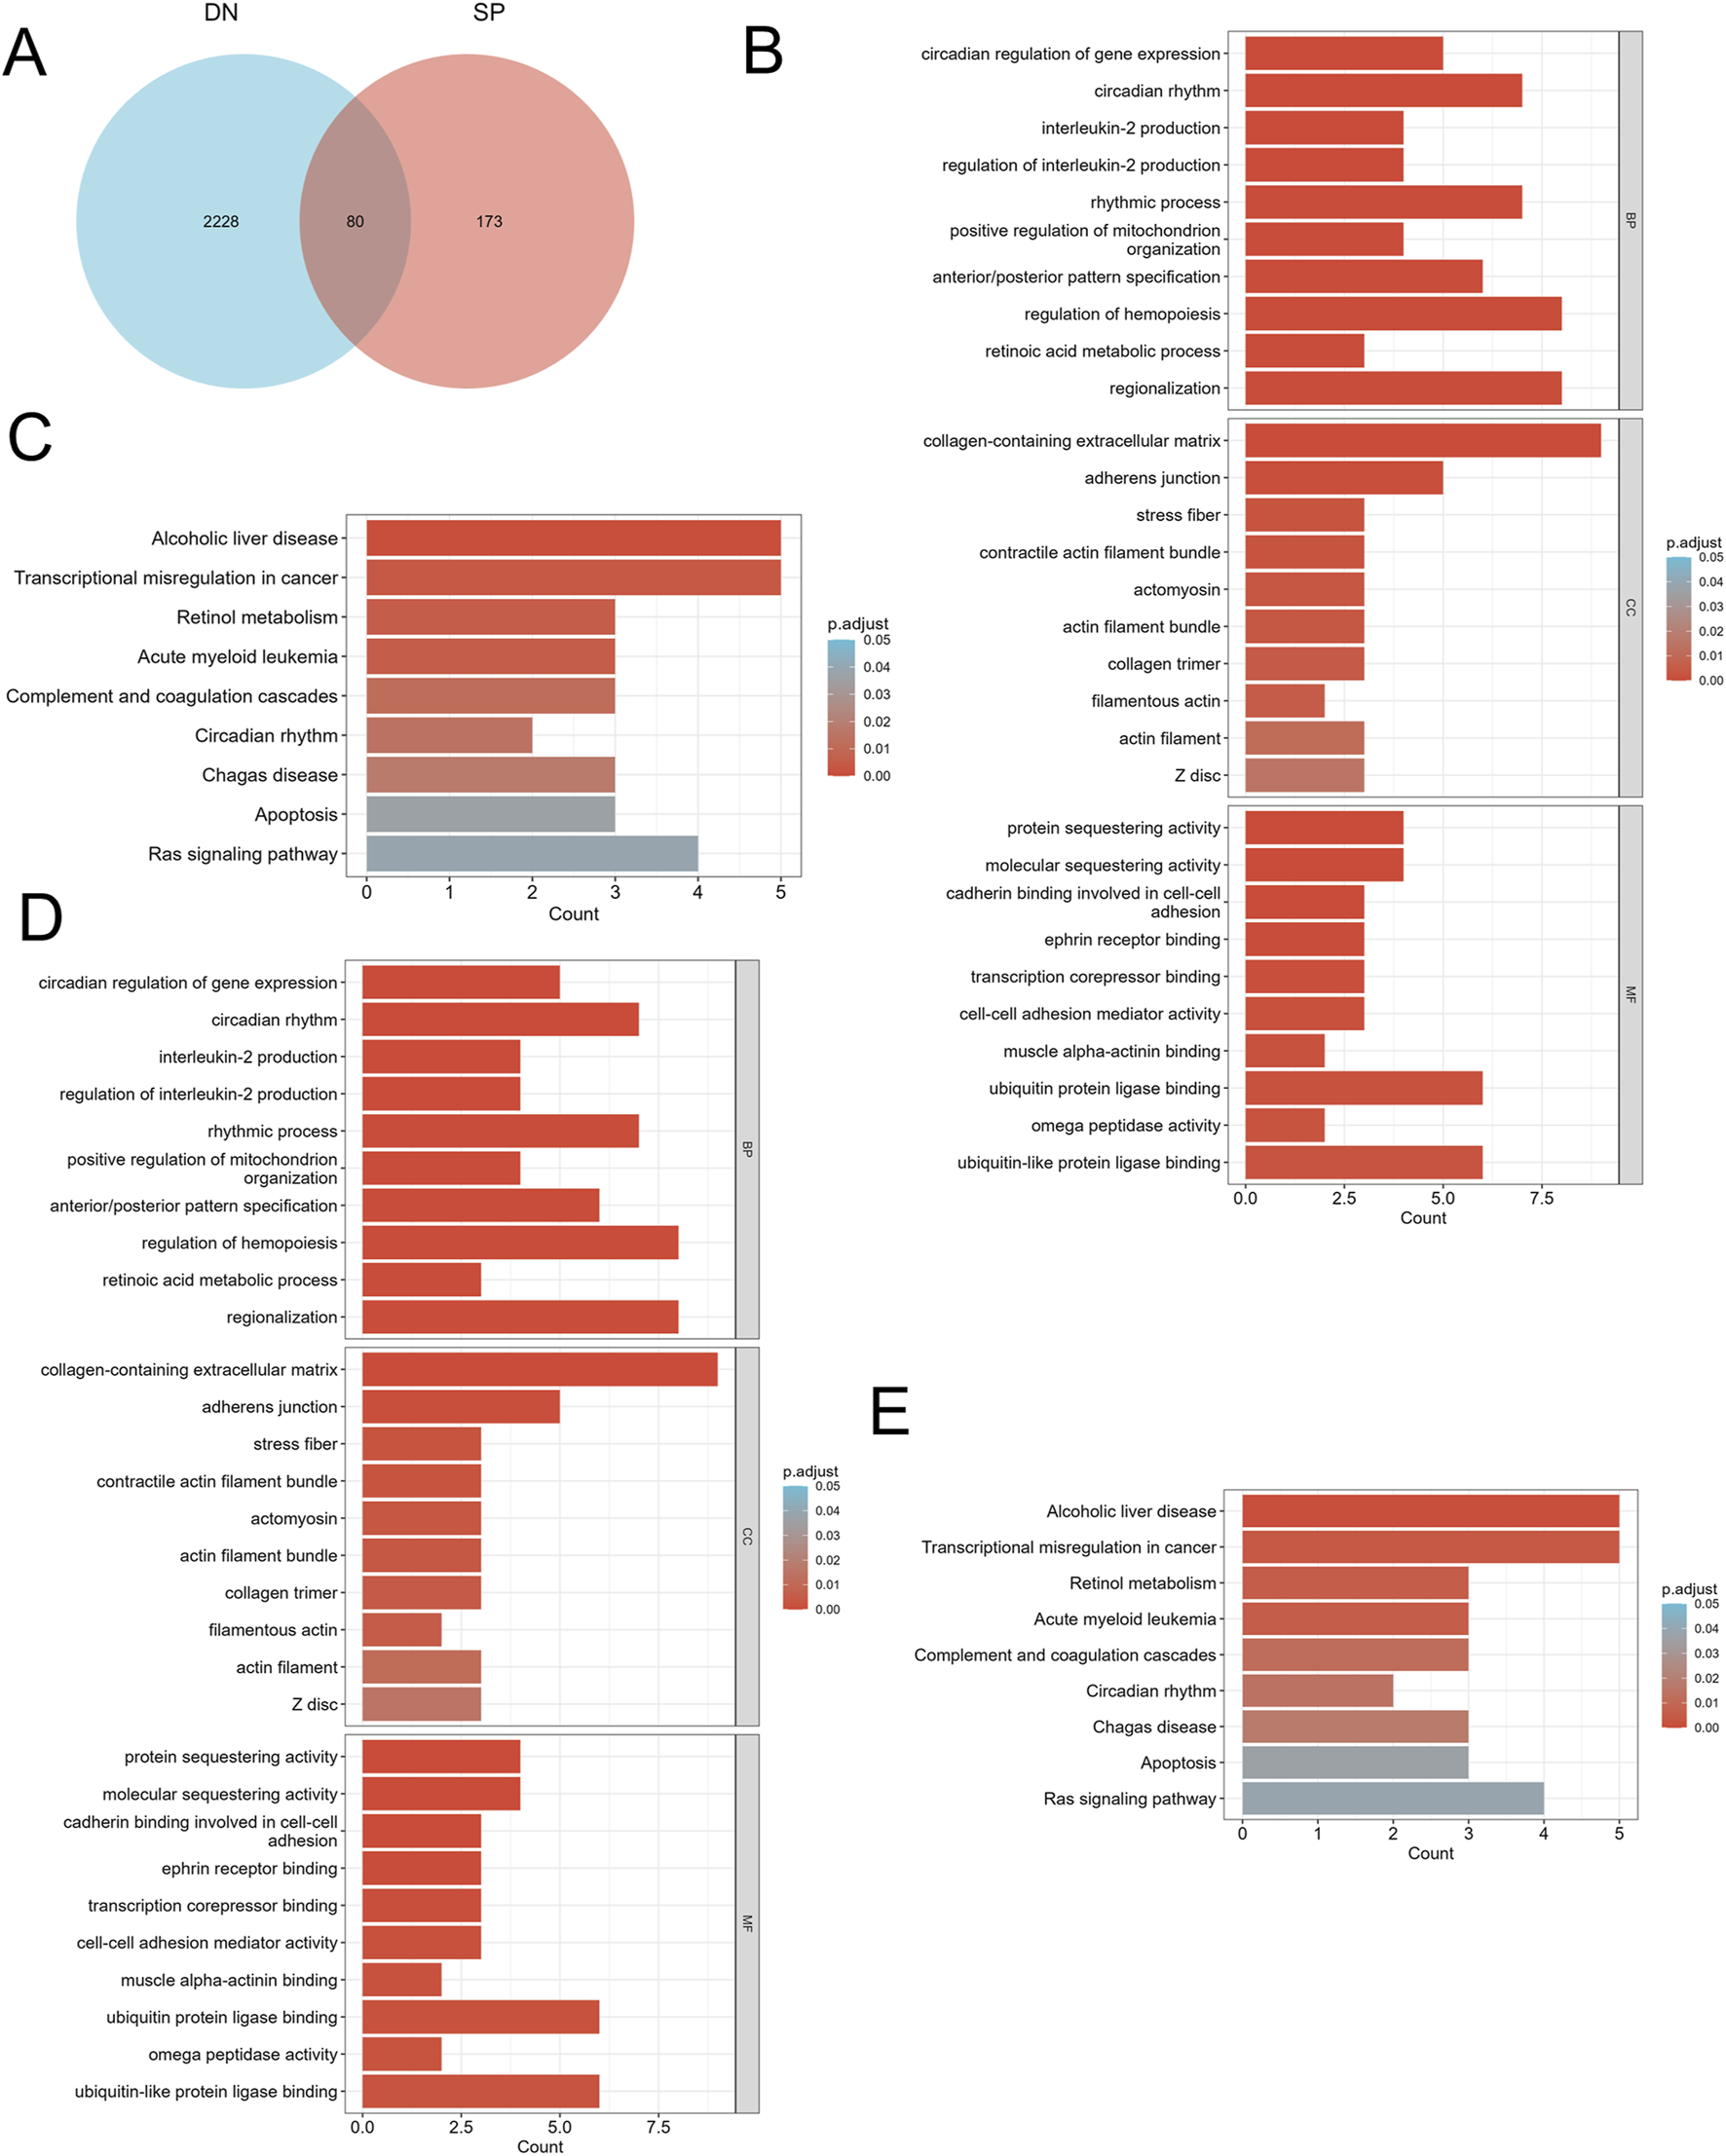
Identification of DEGs and functional enrichment between DN and SP. (A) Venn diagram of the DEGs. (B) GO enrichment analyses of DEGs with the same expression trends in DN; (C) KEGG enrichment analyses of DEGs with the same expression trends in DN. (D) GO enrichment analyses of DEGs with the same expression trends in SP. (E) KEGG enrichment analyses of mitochondria-related DEGs in SP. DN, Diabetic nephropathy; SP, Sarcopenia; DEGs, differentially expressed genes; GO, Gene ontology; KEGG, Kyoto encyclopedia of genes and genomes; BP, Biological process; CC, Cellular component; MF, Molecular function. The screening criteria for GO/KEGG enrichment items were p. Adj <0.05 and FDR value (q. value) <0.25, and the p value correction method was Benjamini–Hochberg (BH).
FIGURE 3
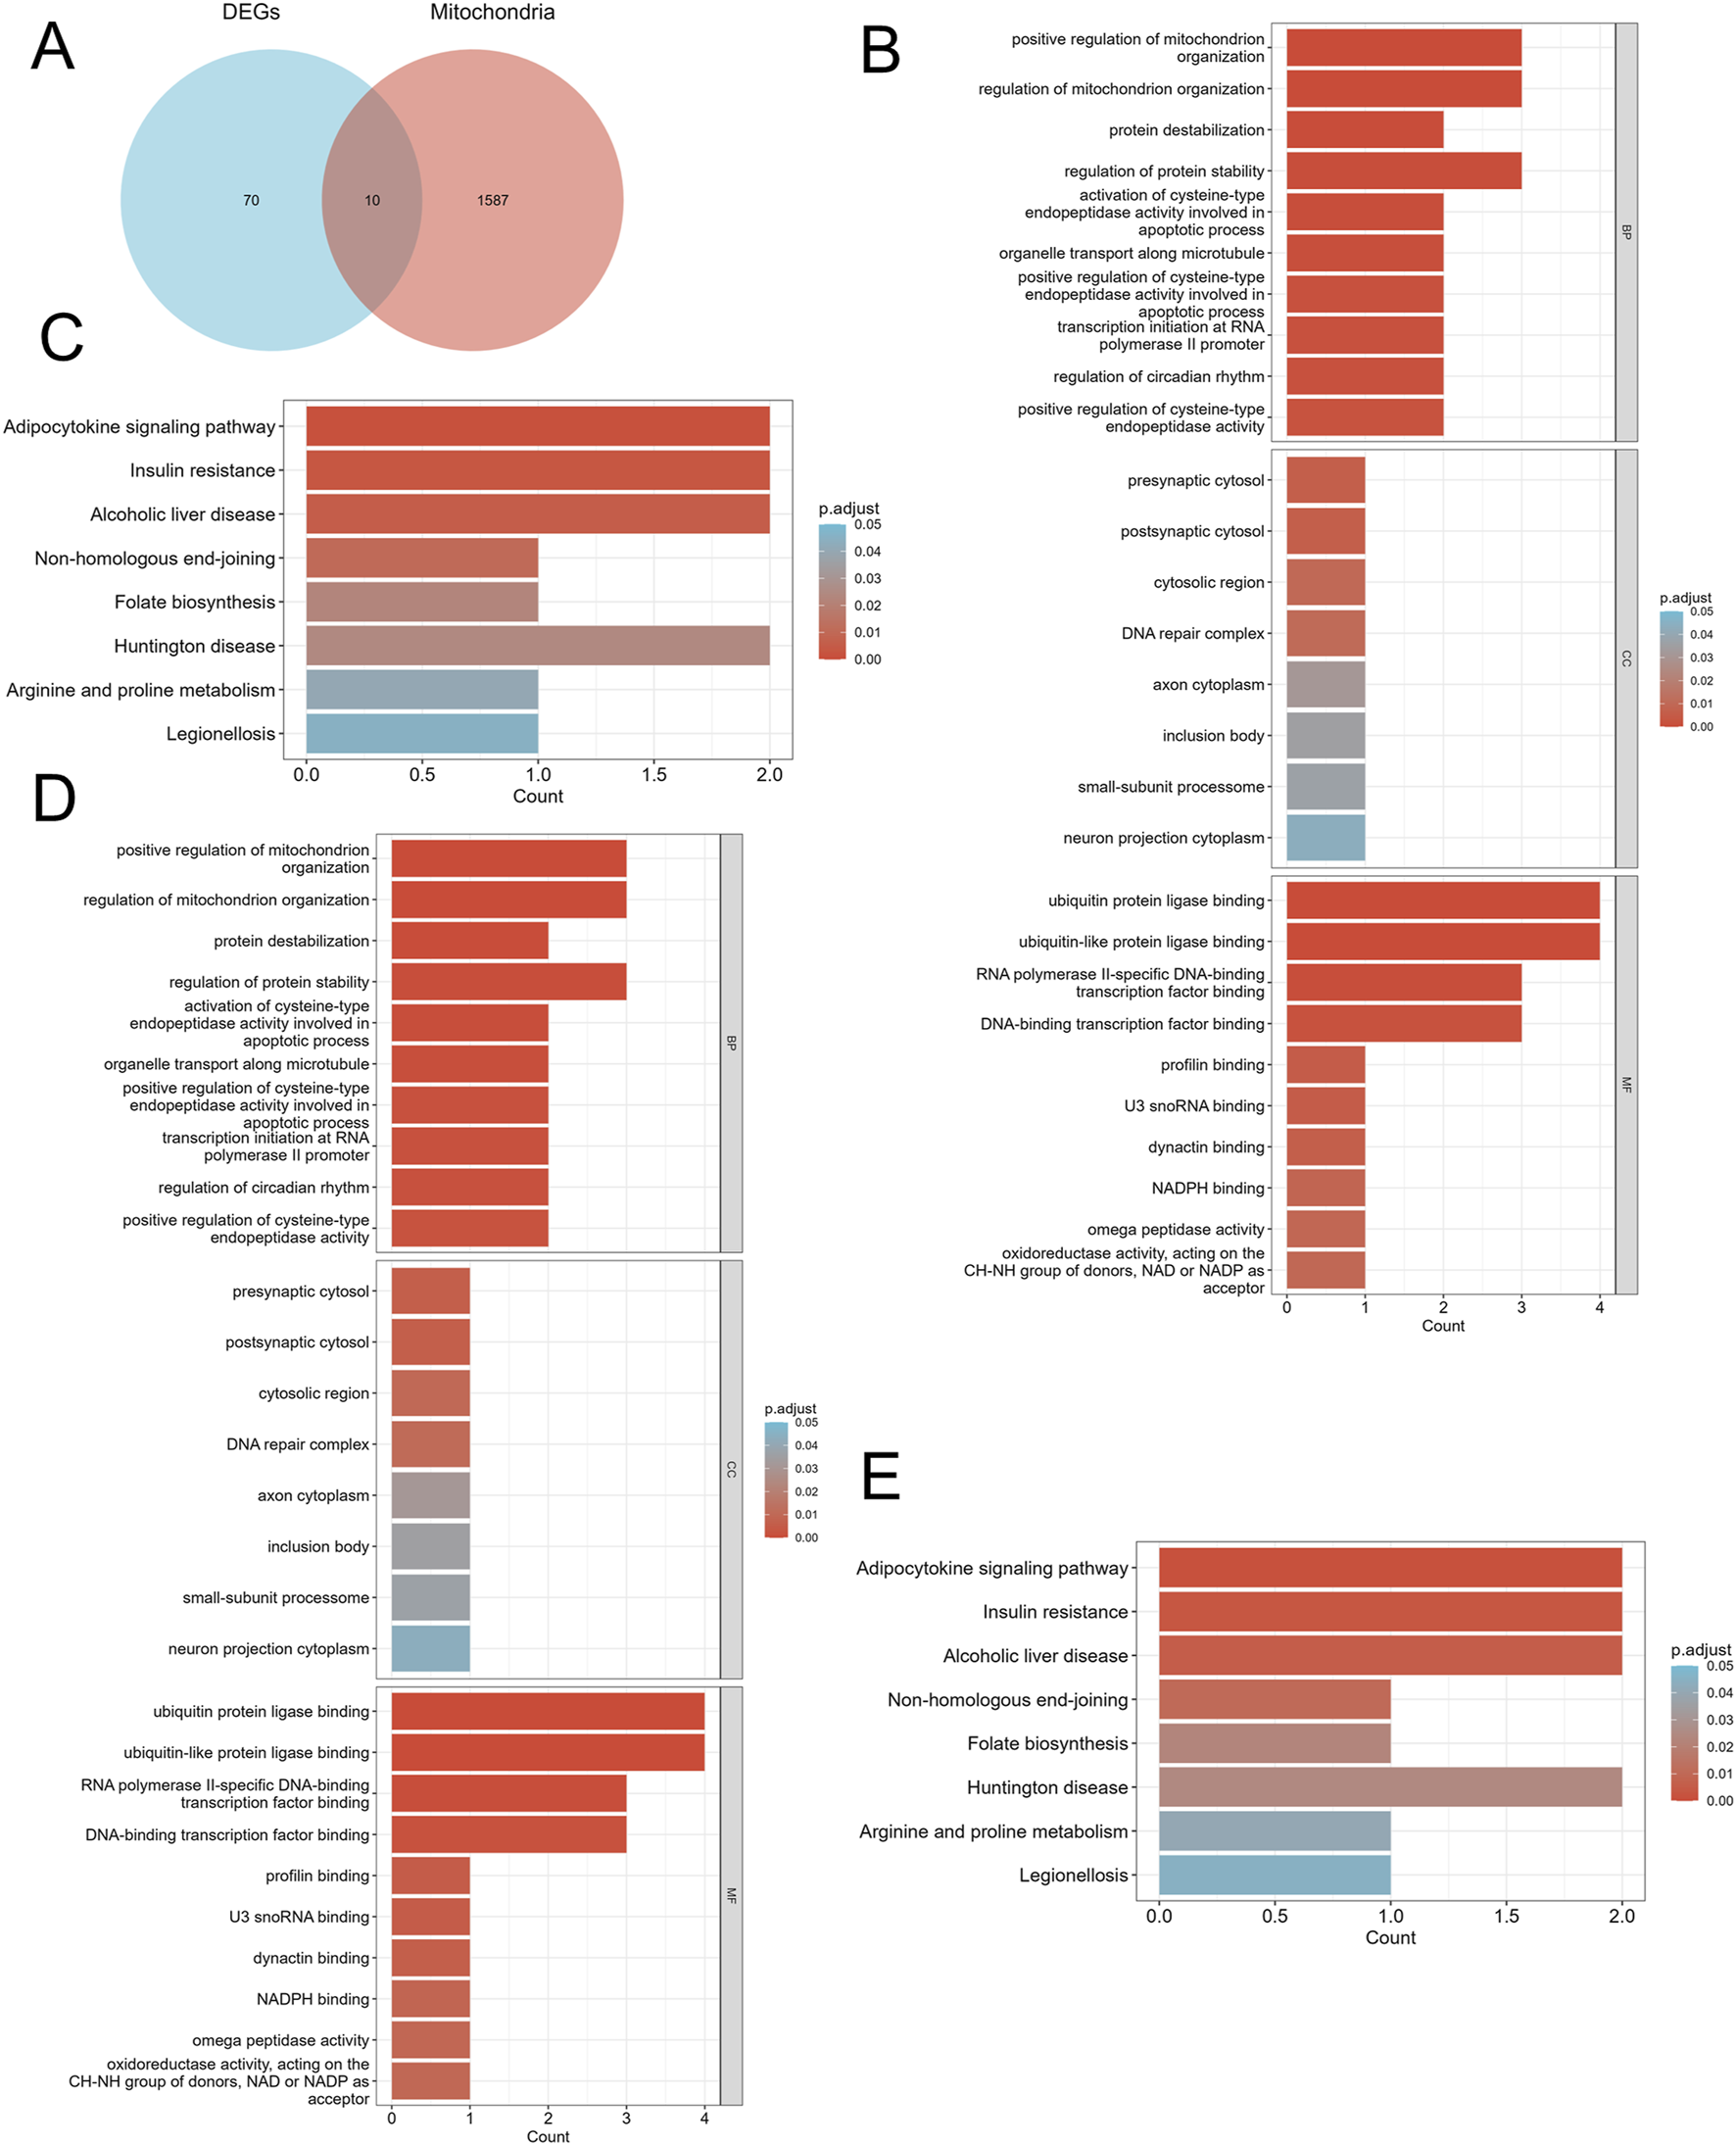
Identification of mitochondria-related DEGs and functional enrichment between DN and SP. (A) Venn diagram of the mitochondria-related DEGs. (B) GO enrichment analyses of mitochondria-related DEGs in DN; (C) KEGG enrichment analyses of mitochondria-related DEGs in DN. (D) GO enrichment analyses of mitochondria-related DEGs in SP; (E) KEGG enrichment analyses of DEGs with the same expression trends in SP. DN, Diabetic nephropathy; SP, Sarcopenia; DEGs, differentially expressed genes; GO, Gene ontology; KEGG, Kyoto encyclopedia of genes and genomes; BP, Biological process; CC, Cellular component; MF, Molecular function. The screening criteria for GO/KEGG enrichment items were p. Adj <0.05 and FDR value (q. value) <0.25.
3.3 Identifying key mitochondrial genes and their diagnostic significance
Using the LASSO algorithm, we identified 8 and 9 mitochondrial-related genes in the DN and SP datasets, respectively (Figures 4A–D). Using the RF approach, we pinpointed the top five genes in the DN and SP categories (Figures 4E–H), while the SVM algorithm identified 8 and 10 genes in DN and SP, respectively (Figures 5A–D), and the XGB algorithm identified 7 genes in both DN and SP (Figures 5E,F). By taking the intersection of the results from these four algorithms, we identified two key mitochondrial-related genes (HTT and TTC19) (Figures 6A–C). We then used ROC curves to estimate the diagnostic value of these two key genes (Figures 6D,E); it was observed that HTT was upregulated in DN (Figure 6F), while TTC19 was upregulated in DN and downregulated in SP (Figure 6G).
FIGURE 4
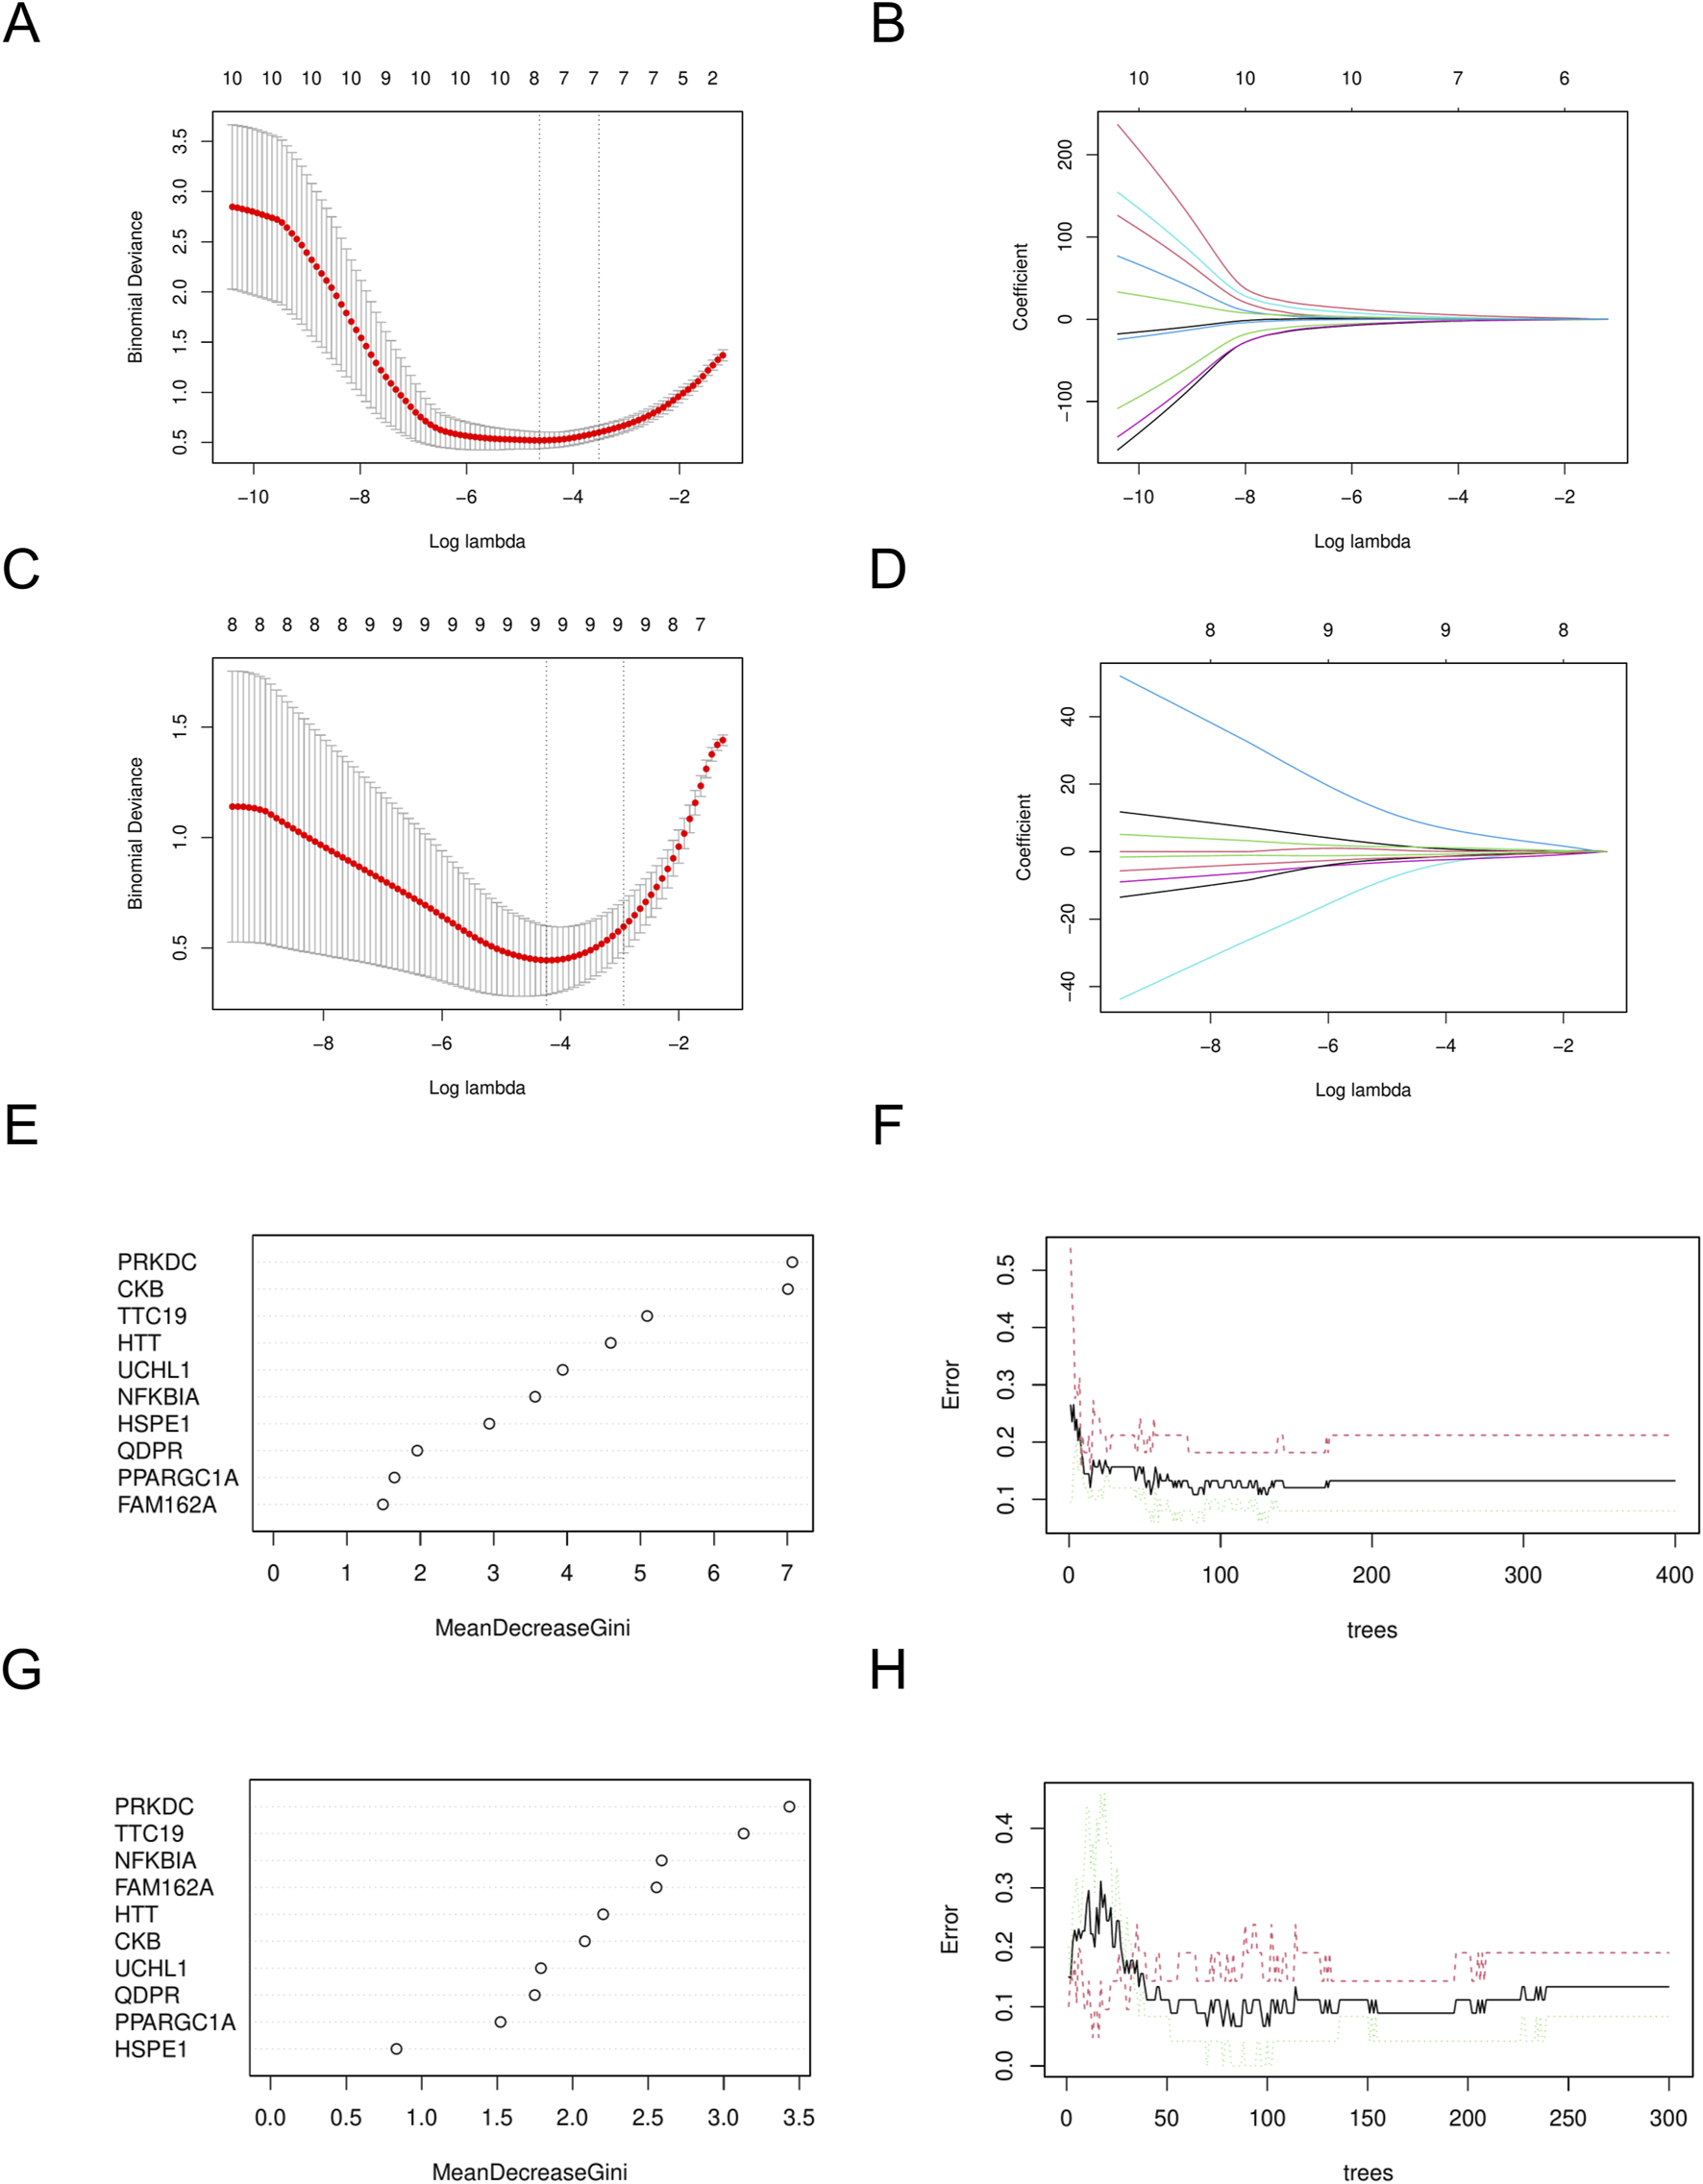
Construction of machine learning models. (A) Variables determined by LASSO analysis in DN- Datasets. (B) LASSO Coefficient distribution map-LASSO coefficient distribution of all variables in DN- Datasets. (C) variables determined by LASSO analysis in SP- Datasets. (D) LASSO Coefficient distribution map-LASSO coefficient distribution of all variables in SP- Datasets. (E) The relative importance of genes in random forest models in DN- Datasets. (F) Confidence intervals for error rates of random forest models in DN- Datasets. (G) The relative importance of genes in random forest models in SP- Datasets. (H) Confidence intervals for error rates of random forest models in SP- Datasets. DN, Diabetic nephropathy; SP, Sarcopenia. LASSO, Least Absolute Shrinkage and Selection Operator.
FIGURE 5
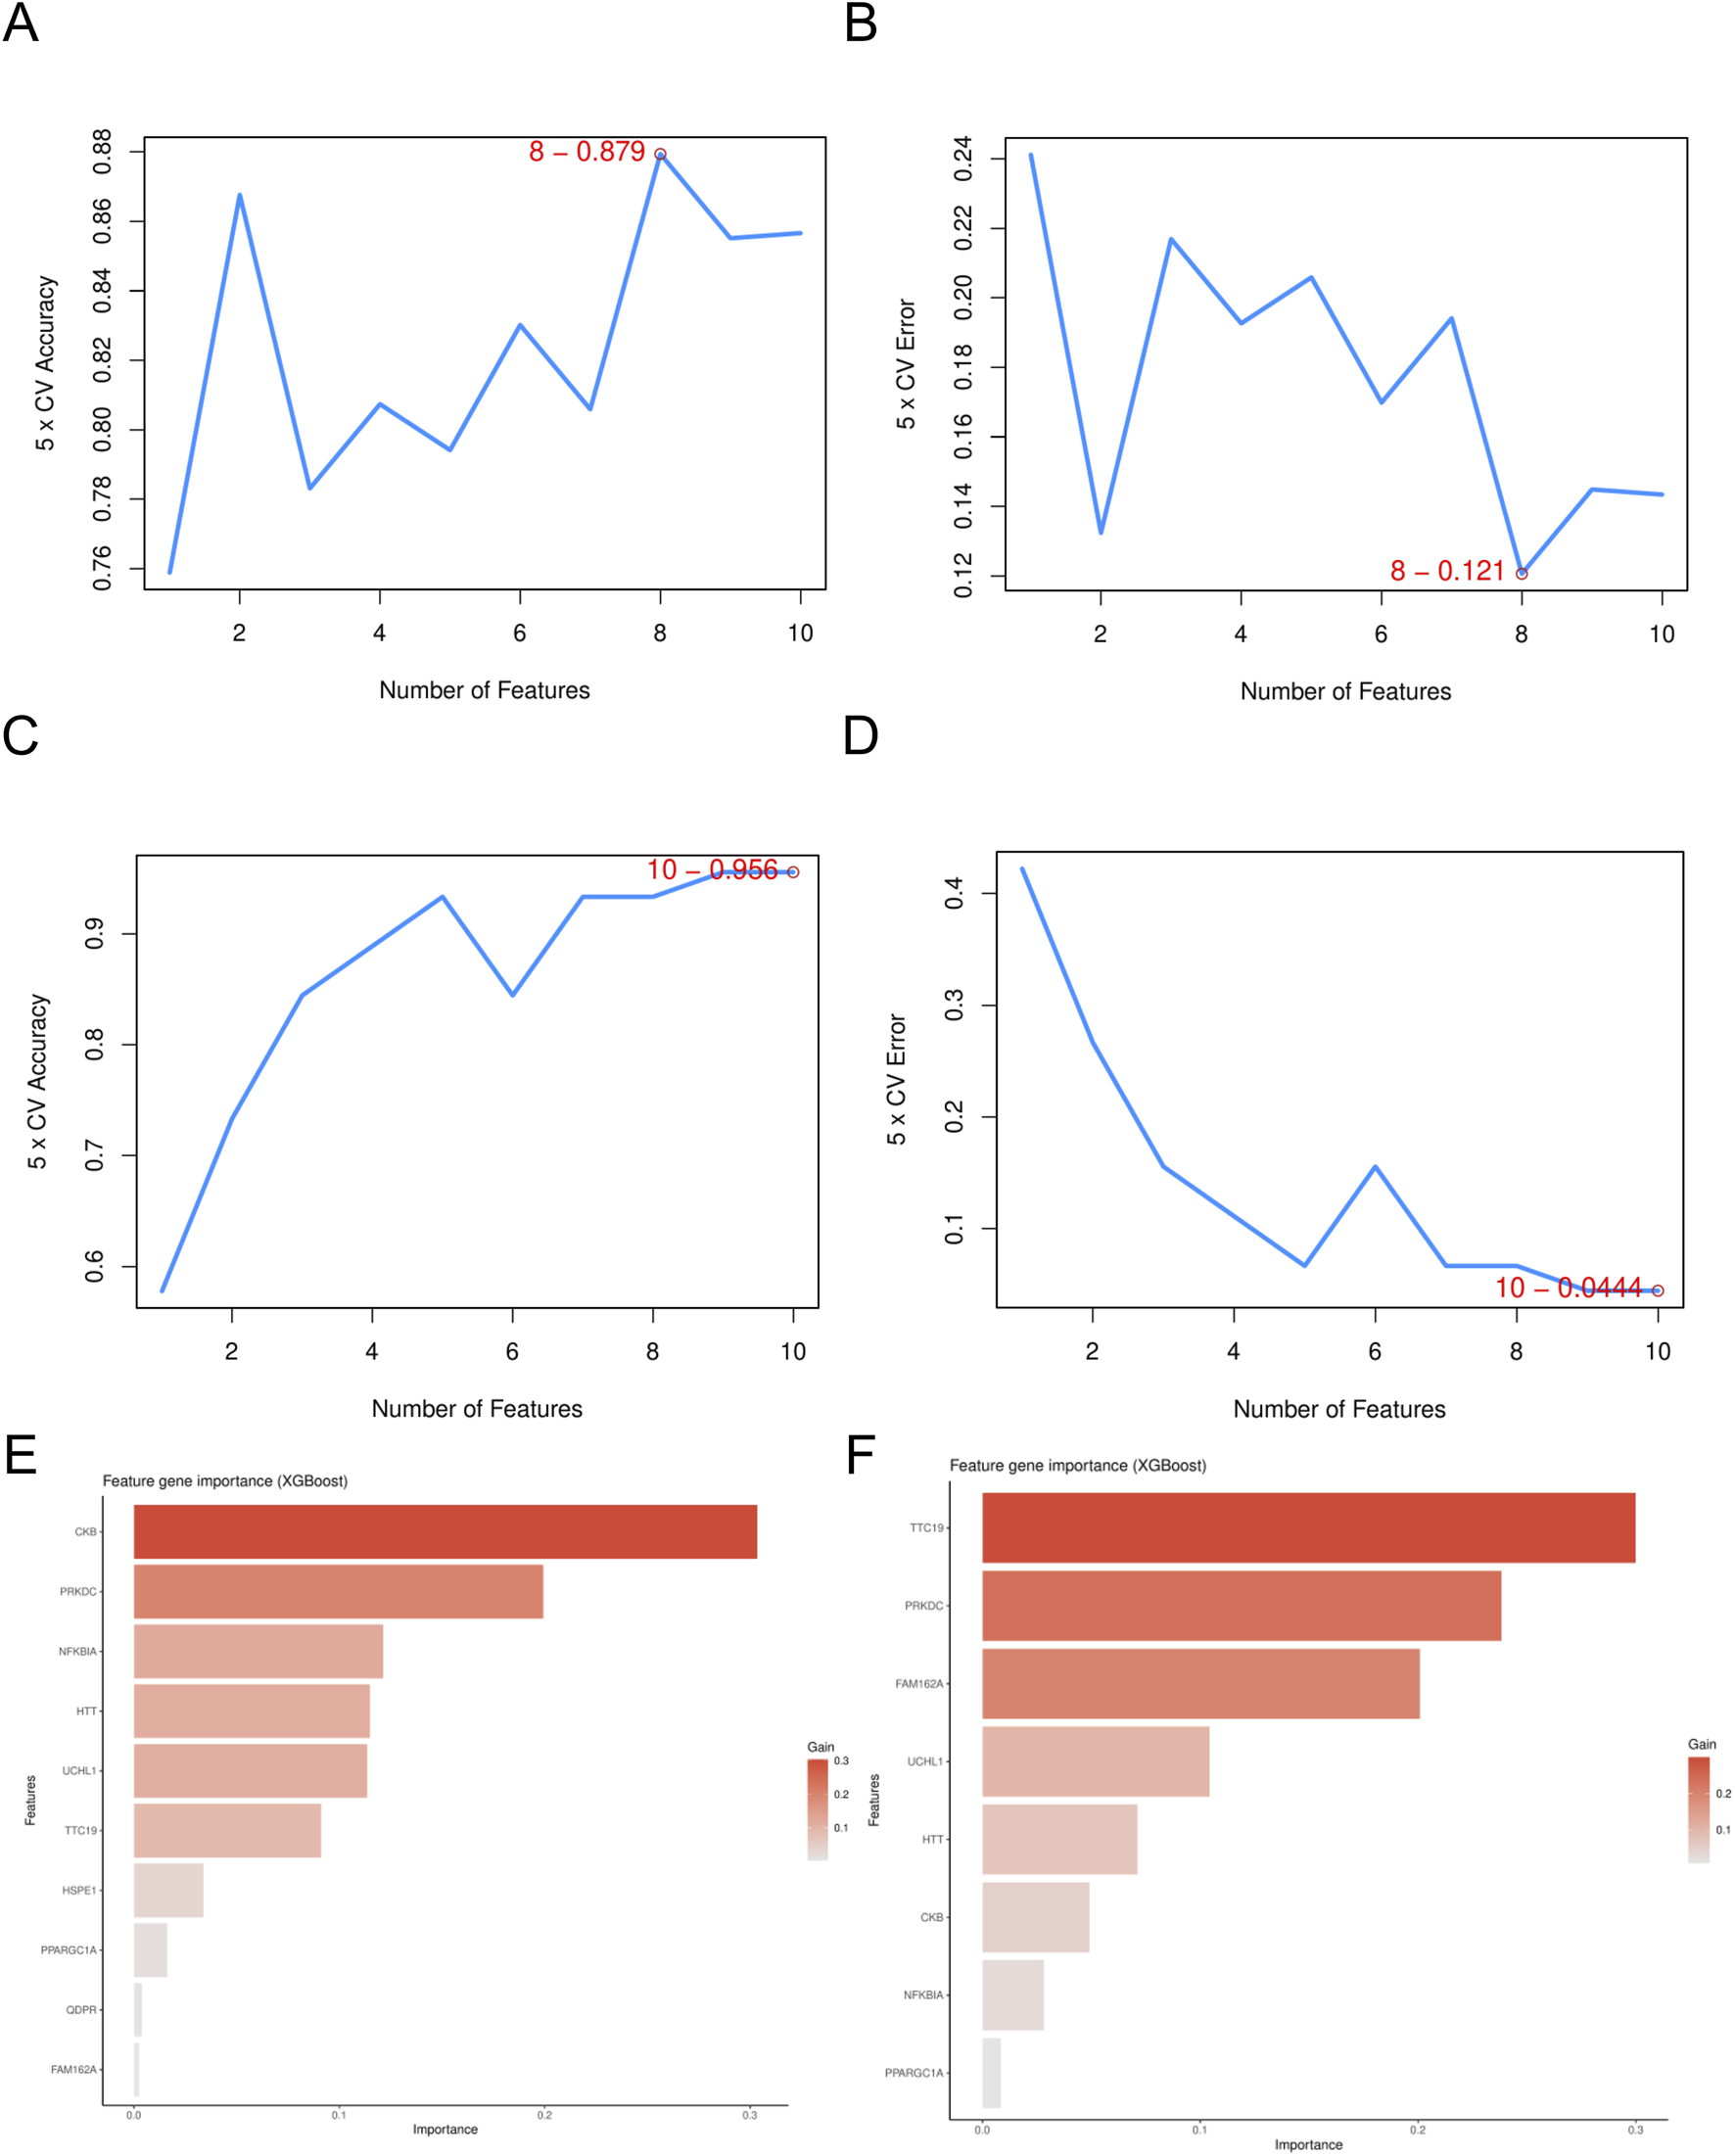
Screening of mitochondria-related hub genes. (A) The accuracy of the SVM model in DN- Datasets. (B) The accuracy of the SVM model in SP- Datasets. (C) The error of the SVM model in DN- Datasets. (D) The error of the SVM model in SP- Datasets. (E) The feature gene importance for the XGB model in DN- Datasets. (F) The feature gene importance for the XGB model in SP- Datasets. DN, Diabetic nephropathy; SP, Sarcopenia; SVM, Support Vector Machine; XGB, eXtreme Gradient Boosting.
FIGURE 6
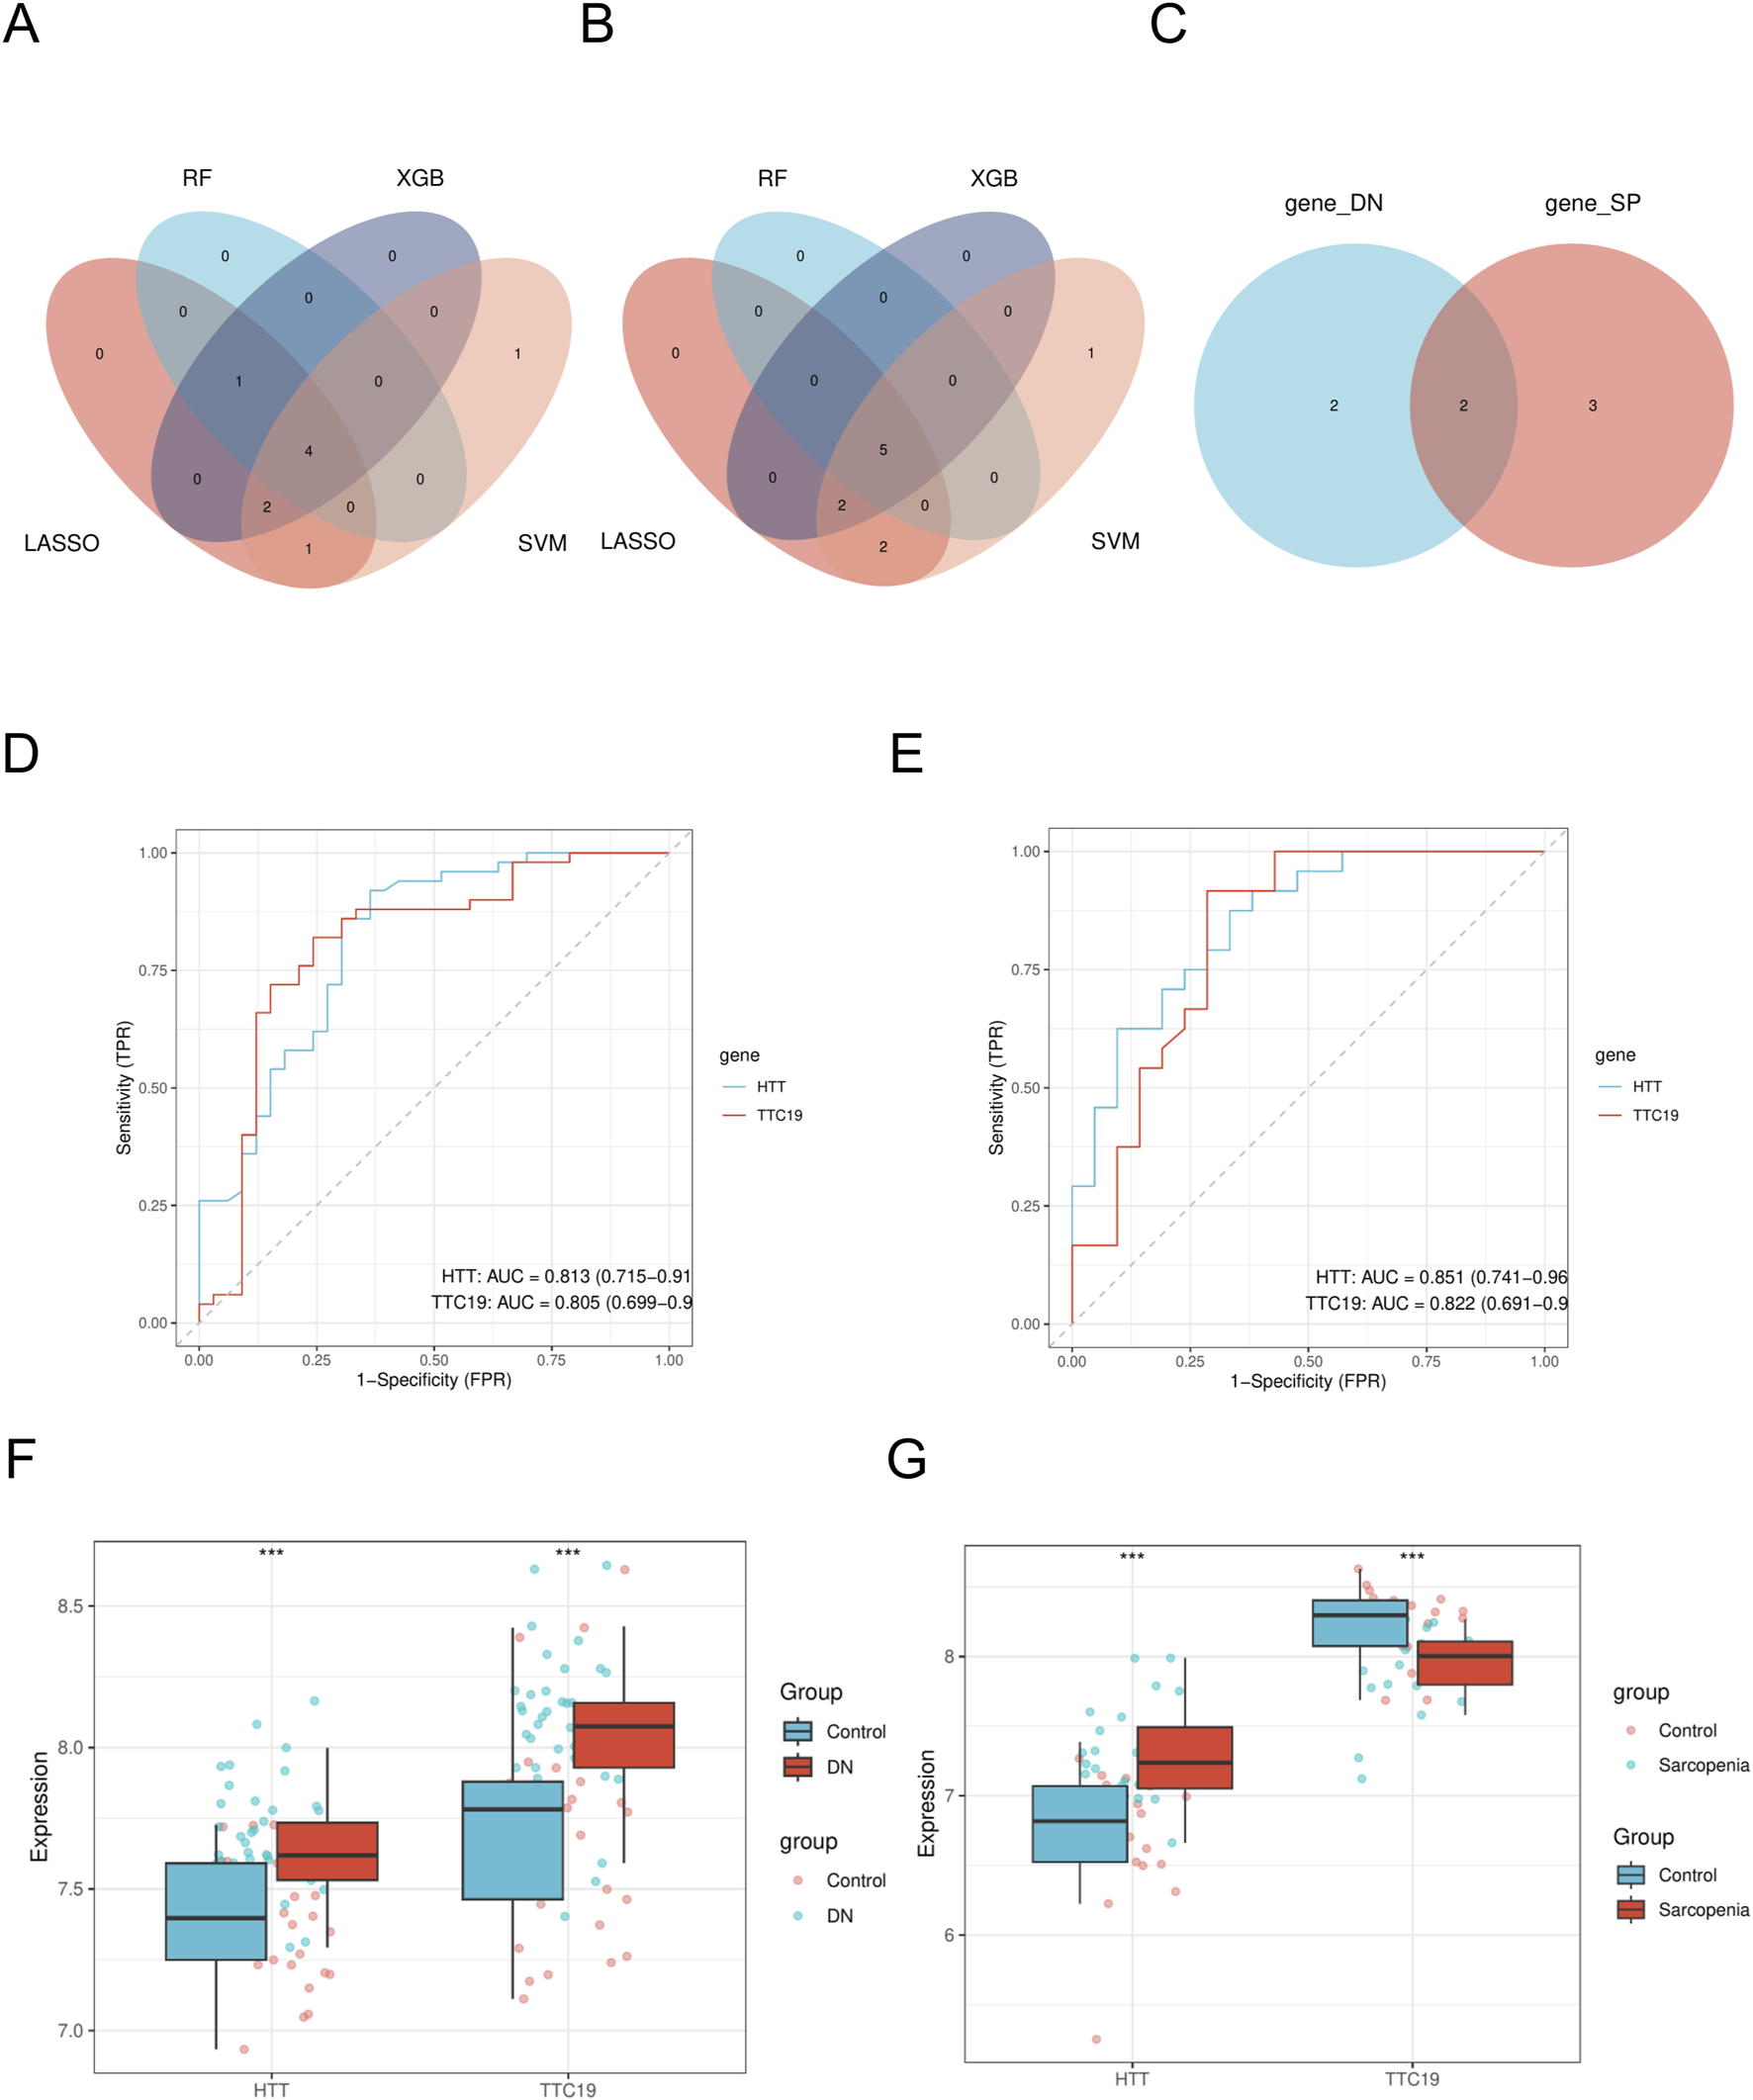
Identification of mitochondria-related hub genes. (A) The intersected genes of three machine learning analyses shown by Venn diagram in DN- Datasets. (B) The intersected genes of three machine learning analyses shown by Venn diagram in SP- Datasets. (C) Venn diagram of mitochondria-related hub genes. (D) ROC curve of HTT and TTC19 between different groups (DN/Control) of DN-Datasets. (E) ROC curve of HTT and TTC19 between different groups (SP/Control) of SP-Datasets. (F) Expression levels of HTT and TTC19 in DN-Datasets. (G) Expression levels of HTT and TTC19 in SP-Datasets. DN, Diabetic nephropathy; SP, Sarcopenia. The symbol ** is equivalent to P < 0.01, which is highly statistically significant. The symbol *** is equivalent to P < 0.001 and highly statistically significant. The closer the AUC in the ROC curve is to 1, the better the diagnostic effect is. When AUC was 0.7–0.9, it had a certain accuracy. AUC > 0.9 had high accuracy. ROC, Receiver operating characteristic curve; AUC, Area under the curve.
3.4 Construction and evaluation of the diagnostic model
A nomogram model was developed, incorporating the scores from the two hub genes. (Figures 7A,B). The decision curve analysis (DCA) curve showed that patients using this model benefited more than those without intervention or with full intervention (Figures 7C,D). The bias-adjusted curve closely approximated the perfect calibration curve, suggesting that the model was effectively calibrated (Figures 7E,F).
FIGURE 7
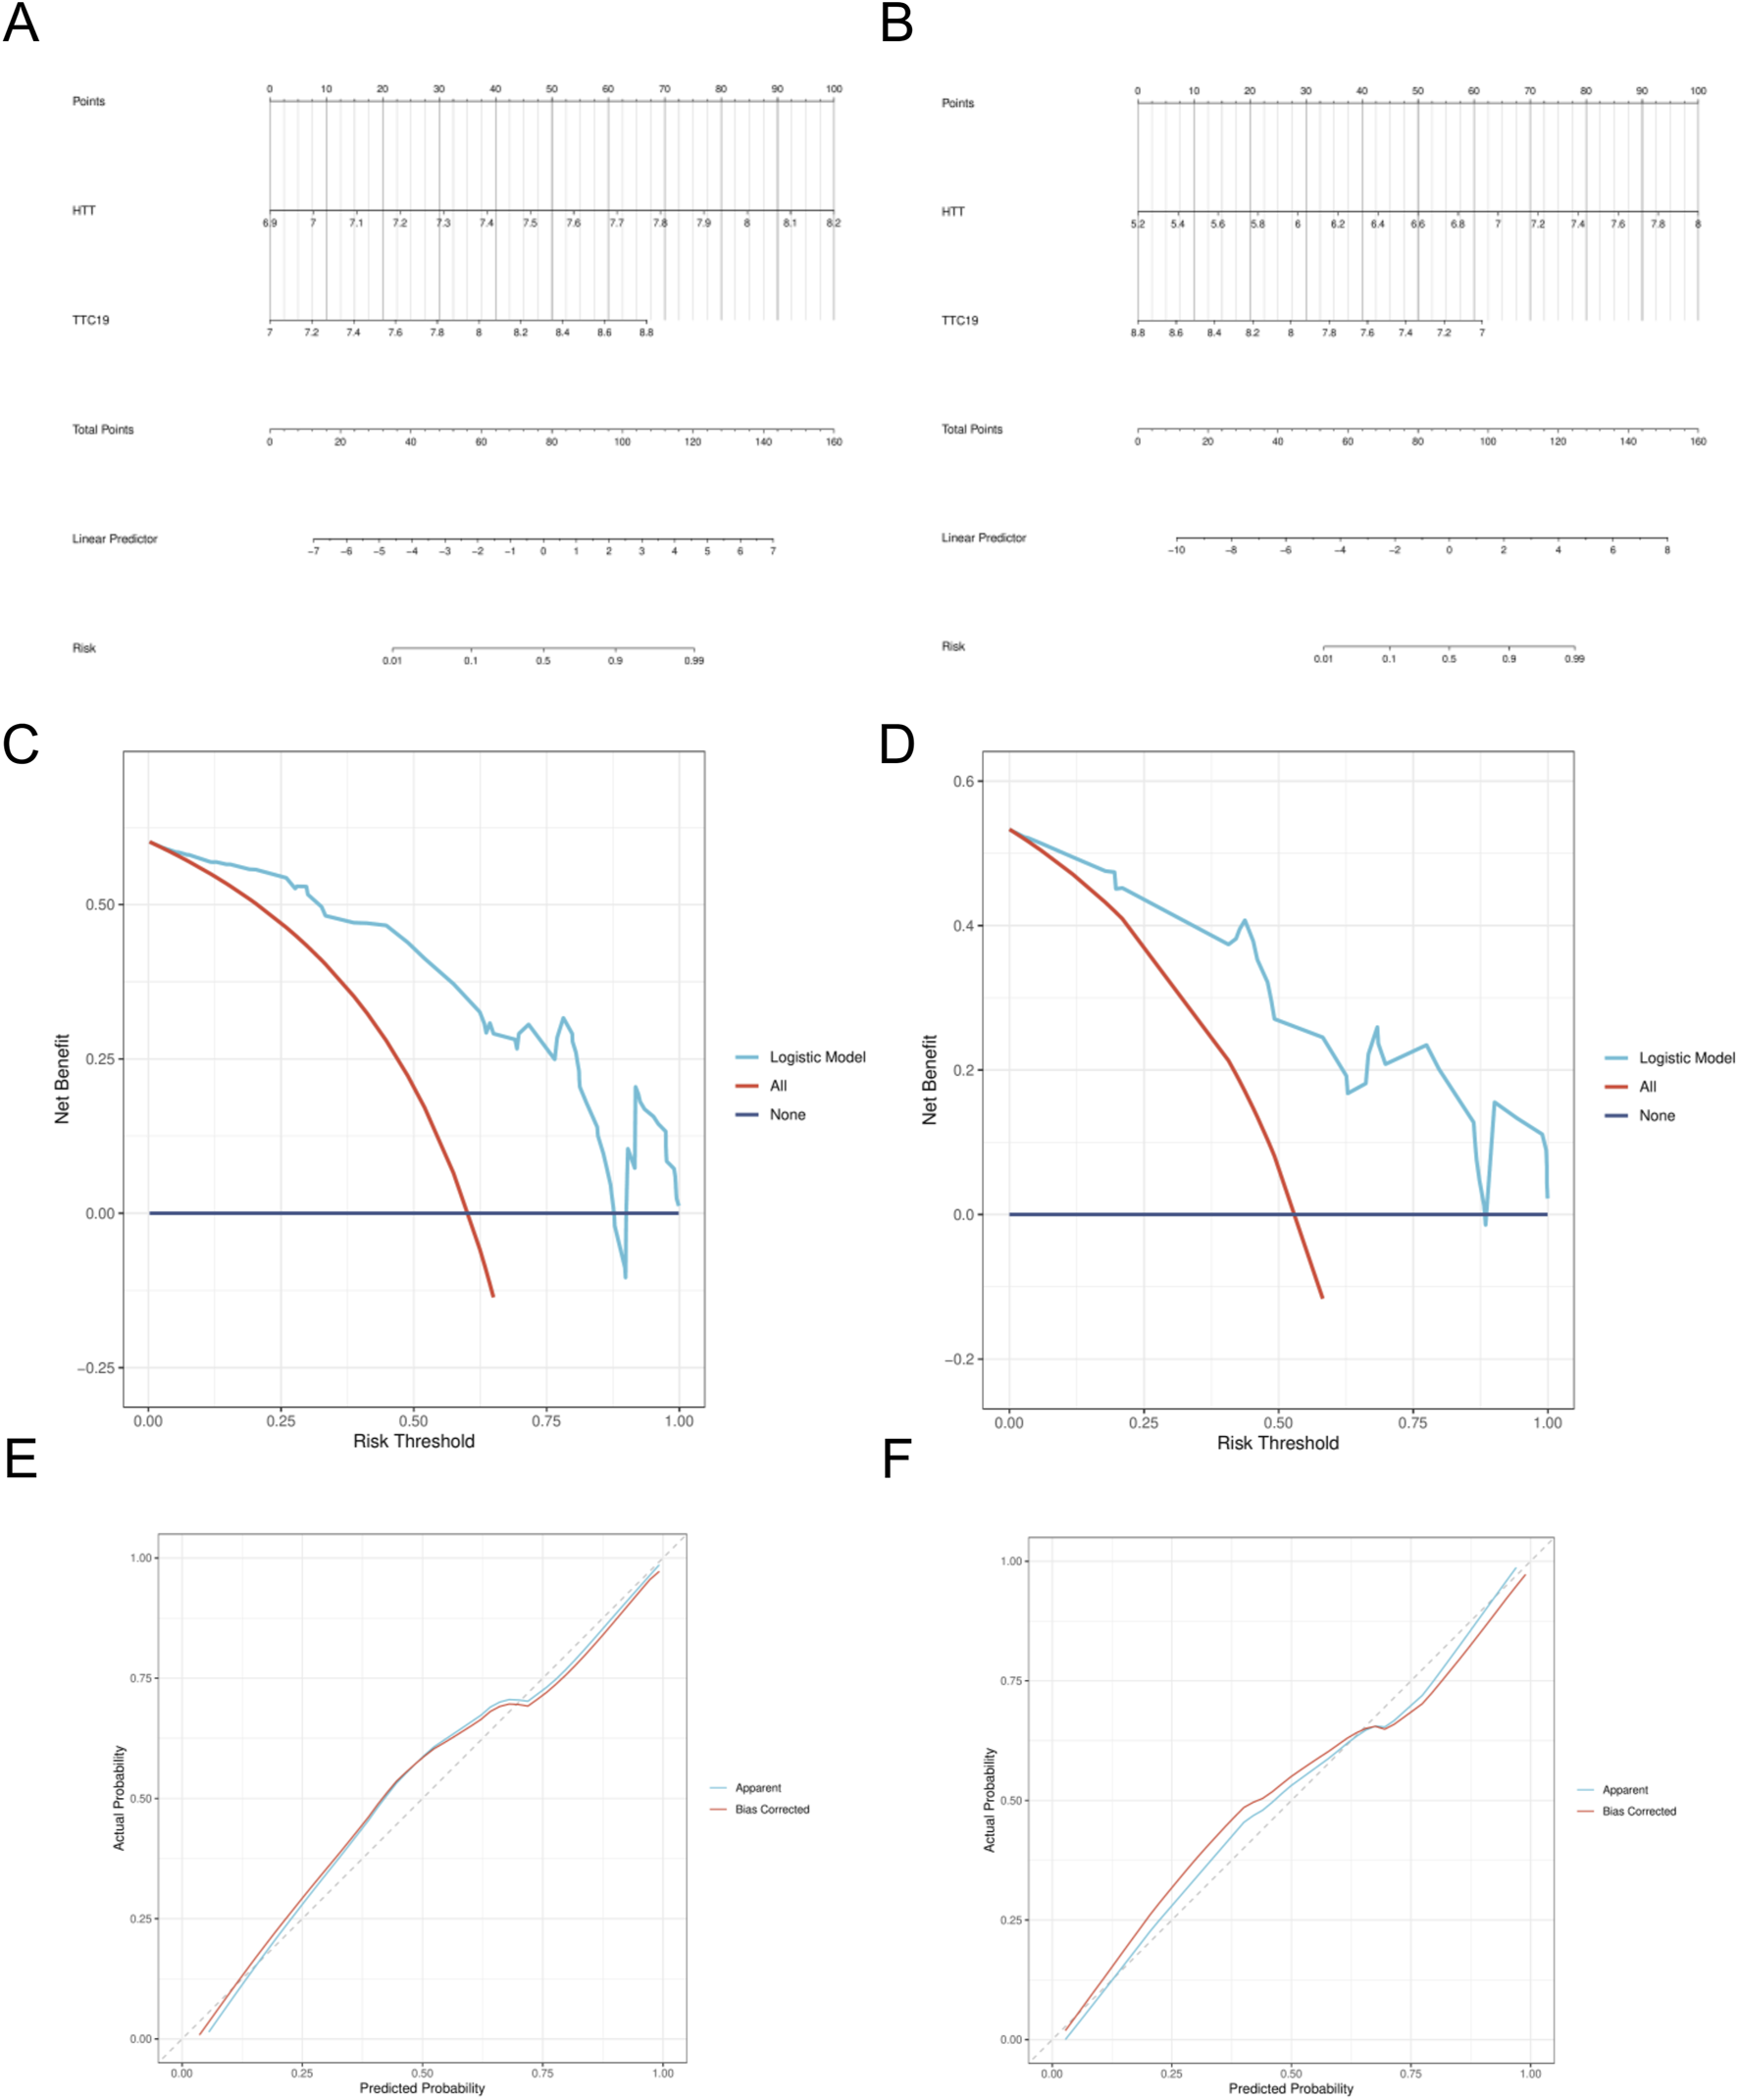
Construction of nomogram model. (A) Nomogram predicting the probability of DN. (B) Nomogram predicting the probability of SP. (C) DCA curves of the DN risk models. (D) DCA curves of the DN risk models. (E) Calibration curves of the DN risk models. (F) Calibration curves of the SP risk models.
3.5 Immune infiltration analysis
Utilizing the CIBERSORT method, we assessed the infiltration of immune cells in the case and control cohorts within the DN and SP dataset. Significant variations in the distribution of diverse immune cell populations were observed between DN and SP (Figures 8A,B). The DN group exhibited a significant increase in the number of M1 macrophages and M2 macrophages (Figure 8C), while SP patients demonstrated a significant elevation in the number of M2 macrophages (Figure 8D). Two pivotal genes were also found to be closely associated with multiple immune cells (Figures 8E,F). In the context of DN, HTT was positively correlated with regulatory T cells and negatively correlated with M2 macrophages and eosinophils, whereas TTC19 was negatively correlated with M1 macrophages. The results imply that these genes could be critical in shaping the molecular and immune cell recruitment landscape in individuals with DN and SP.
FIGURE 8
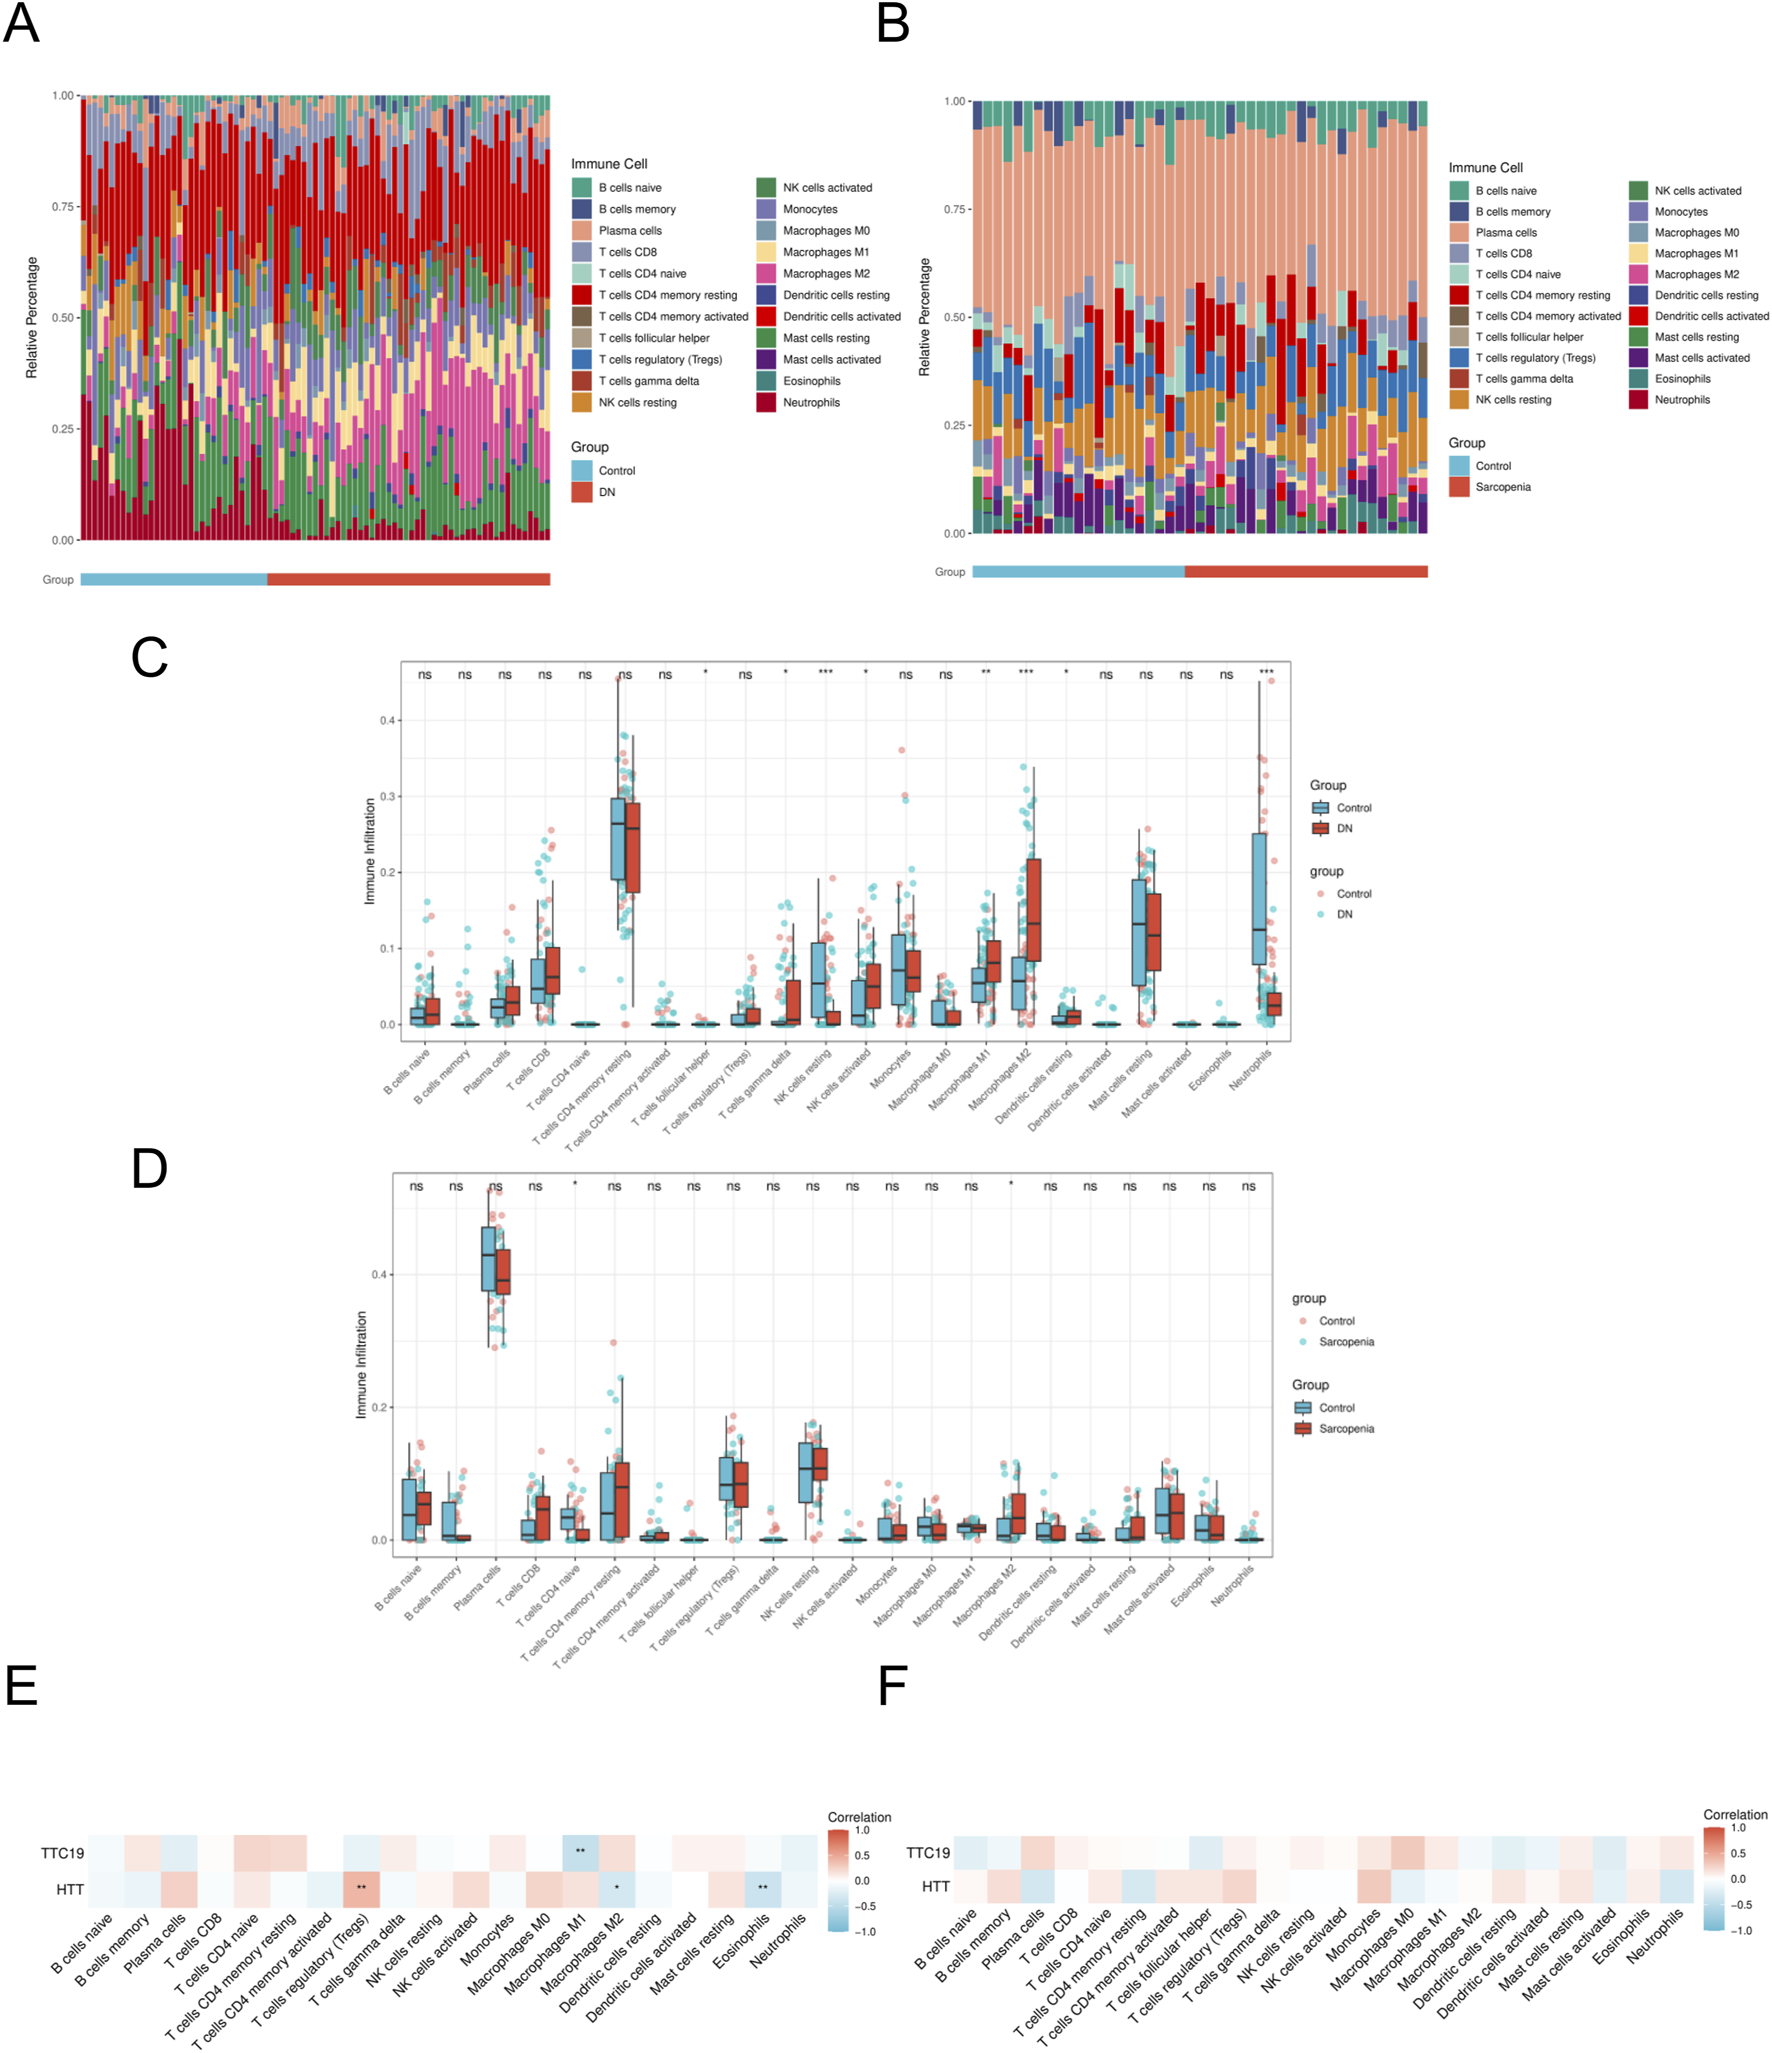
Immune cell infiltration analyses. (A) Immune cell distribution map in DN. (B) Immune cell distribution map in SP. (C) boxplot showing the comparison of 22 kinds of immune cells between DN and the control group. (D) boxplot showing the comparison of 22 kinds of immune cells between SP and the control group. (E) heatmap representing the associations of the differentially infiltrated immune cells with the two hub genes in DN. (F) heatmap representing the associations of the differentially infiltrated immune cells with the two hub genes in SP. DN, Diabetic nephropathy; SP, Sarcopenia. The symbol ** is equivalent to P < 0.01, which is highly statistically significant. The symbol *** is equivalent to P < 0.001 and highly statistically significant.
3.6 Enrichment analysis of characteristic genes
To gain a deeper understanding of the enrichment pathways associated with characteristic genes, we performed Gene Set Enrichment Analysis (GSEA) on a single-gene basis. Utilizing variations in expression levels, the target genes were sorted, thereby establishing groups characterized by high and low expression. The enrichment degree was evaluated by calculating the cumulative scores of the target gene sets in the ranked list. Enrichment analysis of single genes reveals that HTT and TTC19 are significantly associated with mitochondrial and fatty acid metabolism in patients with DN (Figures 9A,B), while in patients with SP, HTT and TTC19 were found to be enriched within the mismatch repair signaling pathway (Figures 9C,D).
FIGURE 9
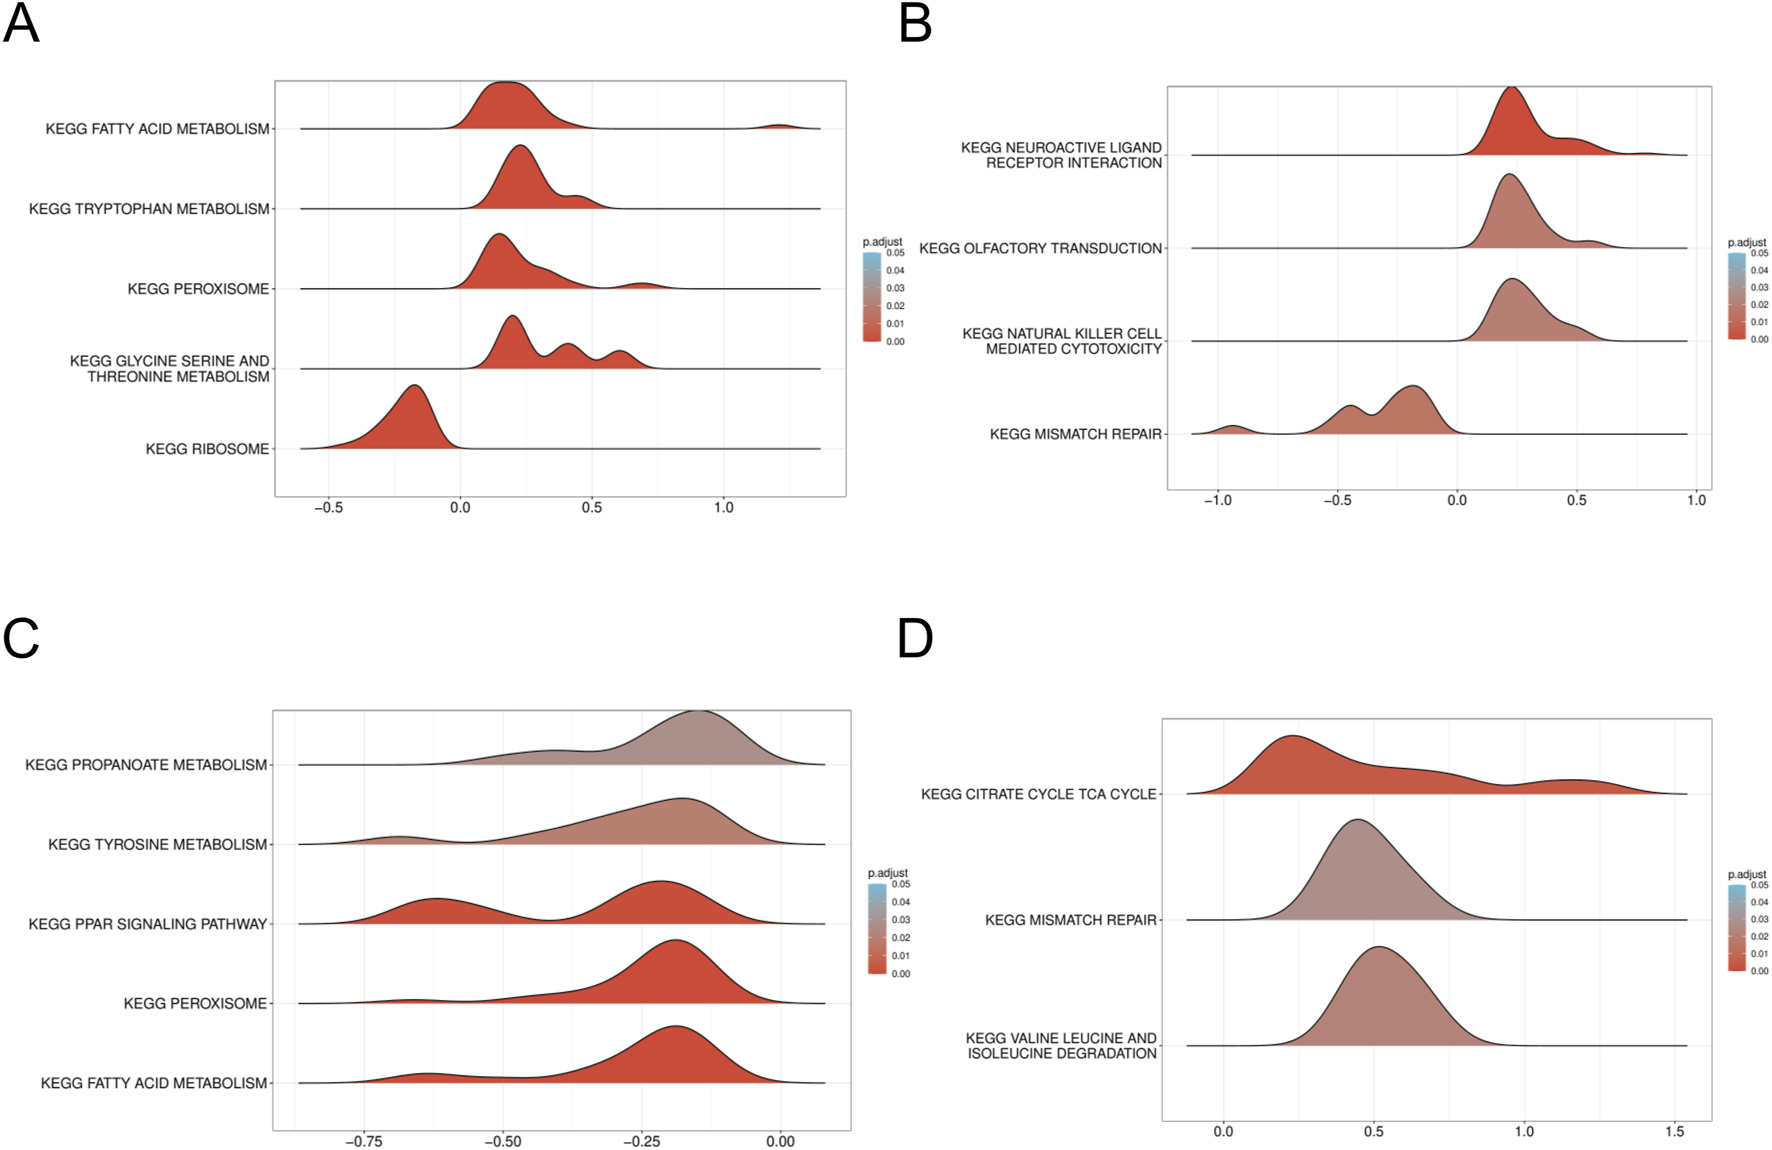
GSEA of DN Datasets dataset. (A) GSEA for the HTT in DN. (B) GSEA for the HTT in DN. (C) GSEA for the TTC19 in SP. (D) GSEA for the TTC19 in SP. GSEA, Gene set enrichment analysis; DN, Diabetic nephropathy; SP, Sarcopenia. The screening criteria of gene set enrichment analysis (GSEA) were p. Adj<0.05 and FDR value (q value) <0.25.
3.7 Drug prediction and molecular docking
Utilizing the Cytoscape, we developed a network mapping drugs to genes (Table 2). The results indicated that acetaminophen targets two genes (Figure 10A). Subsequently, we employed molecular docking techniques to evaluate the binding stability with the two hub genes in order to identify the optimal gene. Typically, a binding energy below −5 kcal/mol is considered to denote a high binding affinity, and a score lower than −7 kcal/mol is indicative of a strong binding interaction. A strong binding interaction is observed between acetaminophen and HTT, characterized by a binding energy of −6.2 kcal/mol (Figures 10B,C).
TABLE 2
| mRNA | Drug |
|---|---|
| HTT | Cadmium Chloride |
| HTT | Bisphenol A |
| HTT | Manganese |
| HTT | Minocycline |
| HTT | Aflatoxin B1 |
| HTT | Tetrachlorodibenzodioxin |
| HTT | Vinclozolin |
| HTT | Atrazine |
| HTT | Bisphenol F |
| HTT | Cadmium |
| HTT | Copper |
| HTT | Dioxins |
| HTT | Dronabinol |
| HTT | Endosulfan |
| HTT | Ethinyl Estradiol |
| HTT | Indomethacin |
| HTT | Isoflurane |
| HTT | Lead |
| HTT | Lipopolysaccharides |
| HTT | Manganese chloride |
| HTT | Nanotubes, Carbon |
| HTT | 1,2-Dimethylhydrazine |
| HTT | 1-Methyl-3-isobutylxanthine |
| HTT | 2,2′,4,4′-tetrabromodiphenyl ether |
| HTT | 2,3,7,8-tetrachlorodibenzofuran |
| HTT | 2,4-dinitrotoluene |
| HTT | 2,6-dinitrotoluene |
| HTT | 4-hydroxyphenyl 4-isopropoxyphenylsulfone |
| HTT | 7,8-Dihydro-7,8-dihydroxybenzo(a)pyrene 9,10-oxide |
| HTT | Abrine |
| HTT | Acetaminophen |
| HTT | Aflatoxin B2 |
| HTT | Air Pollutants |
| HTT | Ammonium Chloride |
| HTT | Arsenic |
| HTT | Arsenite |
| HTT | Asbestos, Crocidolite |
| HTT | Benoxacor |
| HTT | Benzo(a)pyrene |
| HTT | Benzophenoneidum |
| HTT | Bisphenol S |
| HTT | Caffeine |
| HTT | Chlorine |
| HTT | Cisplatin |
| HTT | Corosolic acid |
| HTT | Coumarin |
| HTT | Cypermethrin |
| HTT | Decamethrin |
| HTT | Desflurane |
| HTT | Dexamethasone |
| HTT | Dicrotophos |
| HTT | Dicyclohexyl phthalate |
| HTT | Dietary Fats |
| HTT | Diethylhexyl Phthalate |
| HTT | Dimethyl phthalate |
| HTT | Estradiol |
| HTT | Ethanol |
| HTT | Ethylnitrosourea |
| HTT | Flavonoids |
| HTT | Formic acid |
| HTT | FR900359 |
| HTT | Gallic Acid |
| HTT | Geldanamycin |
| HTT | Genistein |
| HTT | Gentamicins |
| HTT | Hexachlorocyclohexane |
| HTT | Hypoxanthine |
| HTT | Inulin |
| HTT | Iron |
| HTT | Ivermectin |
| HTT | JP8 aviation fuel |
| HTT | (+)-JQ1 compound |
| HTT | Lactones |
| HTT | Lead acetate |
| HTT | Menthol |
| HTT | Monomethyl phthalate |
| HTT | Nickel monoxide |
| HTT | Onjisaponin B |
| HTT | Ozone |
| HTT | Paraquat |
| HTT | Particulate Matter |
| HTT | Pentabrominated diphenyl ether 100 |
| HTT | Perfluorooctane sulfonic acid |
| HTT | Pirinixic acid |
| HTT | Pregnenolone Carbonitrile |
| HTT | Procymidone |
| HTT | Sevoflurane |
| HTT | Silver |
| HTT | Sodium arsenite |
| HTT | Soman |
| HTT | Superoxides |
| HTT | TAK-243 |
| HTT | Tetrabromobisphenol A |
| HTT | Thalidomide |
| HTT | Titanium dioxide |
| HTT | Toluene |
| HTT | Trimellitic anhydride |
| HTT | Triphenyl phosphate |
| HTT | Tris (1,3-dichloro-2-propyl)phosphate |
| HTT | Tungsten |
| HTT | Valproic Acid |
| HTT | Xestospongin C |
| TTC19 | Valproic Acid |
| TTC19 | Bisphenol A |
| TTC19 | Acetaminophen |
| TTC19 | Cadmium |
| TTC19 | Dibutyl Phthalate |
| TTC19 | Nanotubes, Carbon |
| TTC19 | Tetrachlorodibenzodioxin |
| TTC19 | Vehicle Emissions |
| TTC19 | 1,2-Dimethylhydrazine |
| TTC19 | 4-hydroxyphenyl 4-isopropoxyphenylsulfone |
| TTC19 | Acetamide |
| TTC19 | Acrylamide |
| TTC19 | Air Pollutants |
| TTC19 | Amitrole |
| TTC19 | Benz(a)anthracene |
| TTC19 | Benzene |
| TTC19 | Bisphenol S |
| TTC19 | Cadmium Chloride |
| TTC19 | Cyclosporine |
| TTC19 | Decamethrin |
| TTC19 | Diazinon |
| TTC19 | Doxorubicin |
| TTC19 | Ethanol |
| TTC19 | Ethinyl Estradiol |
| TTC19 | Fenthion |
| TTC19 | Fulvestrant |
| TTC19 | Gentamicins |
| TTC19 | Ginger extract |
| TTC19 | Hexabromocyclododecane |
| TTC19 | Ionomycin |
| TTC19 | K 7174 |
| TTC19 | Manganese |
| TTC19 | Manganese chloride |
| TTC19 | Methamphetamine |
| TTC19 | Methidathion |
| TTC19 | Methimazole |
| TTC19 | mono-(2-ethylhexyl)phthalate |
| TTC19 | Oils, Volatile |
| TTC19 | Particulate Matter |
| TTC19 | Perfluorooctanesulfonamide |
| TTC19 | Plant Extracts |
| TTC19 | Propylthiouracil |
| TTC19 | Resveratrol |
| TTC19 | Sodium arsenite |
| TTC19 | Soot |
| TTC19 | Sulfadimethoxine |
| TTC19 | Temozolomide |
| TTC19 | Tetradecanoylphorbol Acetate |
| TTC19 | Thapsigargin |
| TTC19 | Titanium dioxide |
| TTC19 | Tretinoin |
| TTC19 | Troglitazone |
| TTC19 | Tunicamycin |
| TTC19 | Vinclozolin |
mRNA-Drug interaction network nodes.
FIGURE 10
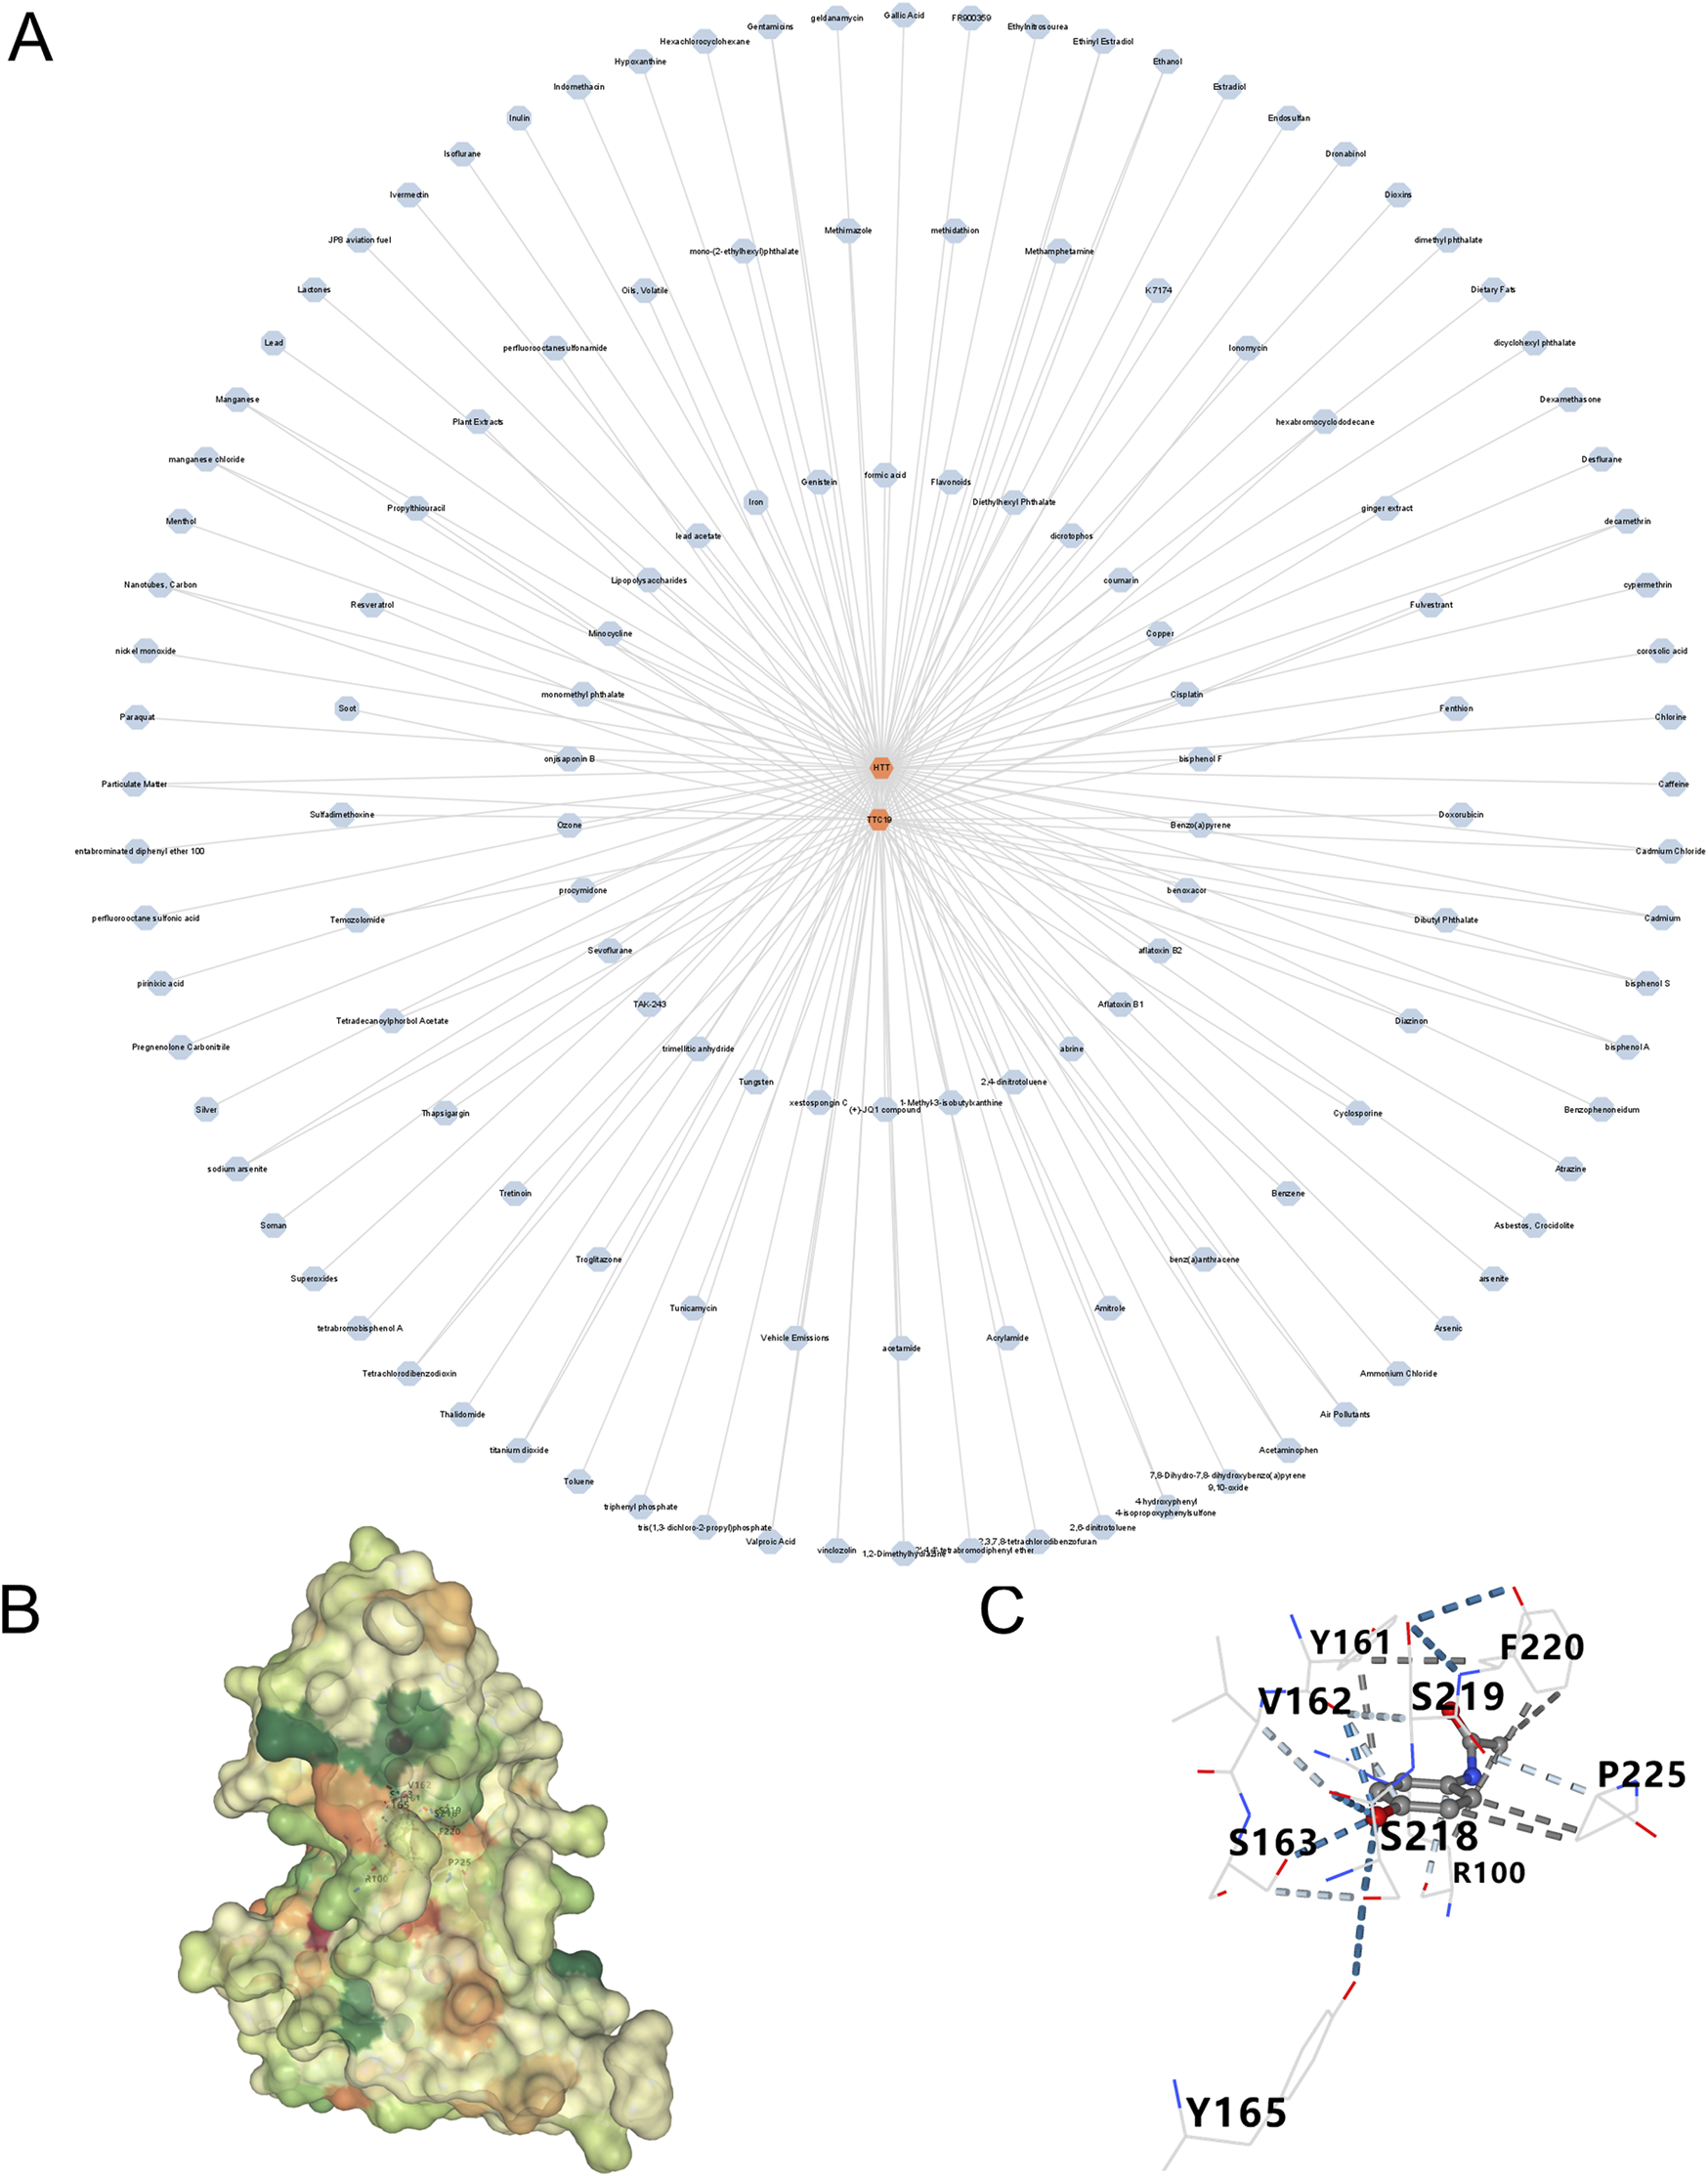
Prediction of drugs for three genes (A) A drug-genes network. (B,C) Schematic diagram of resveratrol-HTT molecular docking.
4 Discussion
Diabetic nephropathy (DN), a prevalent complication of diabetes mellitus, has emerged as a leading global contributor to end-stage renal failure. Identifying reliable biomarkers for chronic kidney disease (CKD), especially DN, is crucial for early detection and understanding the disease. Recent advancements have introduced a variety of novel biomarkers, including protein-based biomarkers such as serum secreted leukocyte protease inhibitor (SLPI), which has proven to be a valuable predictor of DN progression (Sun et al., 2024). Urine biomarkers, such as neutrophil gelatinase-associated lipocalin (NGAL), kidney injury molecule-1 (KIM-1), and periostin, have shown potential as tools for the noninvasive monitoring of DN (V et al., 2024). Microbiome interventions, such as targeting Lactobacillus johnsonii, have been proposed as potential strategies for reversing CKD (Miao et al., 2024a). Metabolite-based biomarkers, including p-cresol sulfate and indole sulfate, have been investigated for their role in predicting renal function based on glomerular filtration rate (GFR) categories (Corradi et al., 2024). Additionally, research on the diagnostic complexities of CKD in the elderly has highlighted the importance of considering biomarkers specifically for this population (Muglia et al., 2024). Furthermore, metabolites such as serum 5-methoxytryptophan (5-MTP), homocysteine, and citrulline have been identified as biomarkers in patients with advanced DN through a combination of untargeted and targeted metabolomics approaches (Chen et al., 2024). A hyperglycemic environment fosters the overproduction of reactive oxygen species (ROS), leading to mitochondrial DNA (mtDNA) impairment and ultimately resulting in renal impairment (Takasu et al., 2025). Emerging therapeutic strategies targeting mitochondrial homeostasis, particularly through AMP-activated protein kinase (AMPK) activation and nitric oxide (NO) production modulation, demonstrate potential for halting DN progression (Börgeson et al., 2017; Gao et al., 2004). Concurrently, mitochondrial DNA content serves as a critical biomarker for muscle injury and exhibits strong associations with sarcopenia (SP) progression (Short et al., 2005; Rygiel et al., 2016). Given the high mitochondrial density in skeletal muscle fibers essential for ATP production via oxidative phosphorylation, mitochondrial dysfunction has been implicated as a central mechanism in SP pathogenesis (Calvani et al., 2013). Through systematic cross-disease analysis, we identified mitochondrial-related hub genes shared between DN and SP, revealing their pivotal role in disease pathogenesis.
In this study, we identified 80 genes exhibiting similar patterns in two diseases, including 10 genes related to mitochondrial function: CKB, FAM162A, HSPE1, HTT, NFKBIA, PPARGC1A, PRKDC, QDPR, TTC19, and UCHL1. Machine learning algorithms prioritized HTT and TTC19 as core diagnostic biomarkers, with logistic regression models demonstrating high discriminative accuracy. Gene Ontology (GO) and Kyoto Encyclopedia of Genes and Genomes (KEGG) enrichment analyses indicated that these genes are significantly involved in the regulation of circadian rhythms, cellular metabolism, and apoptosis. These findings suggest two important considerations: first, the regulation of circadian rhythms, cellular metabolism, and apoptosis may constitute a shared pathogenic mechanism in both diseases; second, impaired mitochondrial function could potentially influence these processes.
HTT (Huntingtin) is a multifunctional cytoplasmic protein (Prowse et al., 2025), whose expression is downregulated in both DN and SP as demonstrated in our study. HTT interacts with proteins such as dynein to regulate vesicular transport and synaptic transmission, which are essential for maintaining the normal physiological functions of neurons and muscle cells (Prowse et al., 2025). Furthermore, HTT plays a critical role in the regulation of mitochondrial function, impacting adenosine triphosphate (ATP) production and oxidative stress (Prowse et al., 2025; Browne et al., 1999). In the brains of patients with Huntington’s disease (HD), markers of oxidative stress, including 8-hydroxy-2′-deoxyguanosine and malondialdehyde (MDA), are significantly elevated (Polidori et al., 1999). Observations have indicated the presence of oxidative stress in the peripheral blood of individuals with HD (Chen et al., 2007), as well as in animal models simulating HD (Bogdanov et al., 2001). Oxidative stress plays a pivotal role in the onset of DN (Samsu, 2021; Jin et al., 2023) and is a major pathogenic factor in SP (Chen et al., 2022), characterized by neurogenic denervation at the neuromuscular junction, muscle fiber atrophy, and mitochondrial dysfunction (Xu et al., 2025). We propose that HTT contributes to mitochondrial damage in patients with DN and facilitates the progression of SP. Tetratricopeptide repeat domain 19 (TTC19) encodes a protein with a molecular weight of 35 kDa, which was initially considered a complex III (CIII) assembly factor. This discovery was based on the detection of the absence of this protein in some biochemical patients presenting with isolated CIII deficiency (Ghezzi et al., 2011). Through in - depth molecular studies on the Ttc19−/− mouse model, we found that TTC19 plays an important role in clearing the N - terminal fragments generated during the processing of the catalytic Fe - S Rieske subunit (Uqcrfs1), which is crucial for maintaining the functional and structural integrity of CIII (Bottani et al., 2017; Fernandez-Vizarra and Zeviani, 2018). This complex is essential for mitochondrial function, and any disruptions in its function can result in mitochondrial dysfunction. TTC19 is integral to mitochondrial dynamics; however, research examining the association between TTC19 and DN remains limited. Despite this, TTC19 expression is linked to mitochondrial dysfunction, a process critically involved in the development and progression of both DN (Zhang et al., 2021) and SP (Kamarulzaman and Makpol, 2025). Therefore, addressing mitochondrial dysfunction is a fundamental concern in the management of DN and SP.
Gene Set Enrichment Analysis (GSEA) reveals that HTT and TTC19 are significantly enriched in the mitochondrial and fatty acid metabolism pathways in individuals with DN, whereas these genes are overrepresented in the mismatch repair signaling pathway among individuals with SP. As mentioned above, the functional abnormalities of HTT and TTC19 can lead to mitochondrial dysfunction. The enrichment of HTT and TTC19 in mitochondrial and fatty acid metabolic pathways in patients with DN may suggest a correlation between the functional anomalies of these genes and the mitochondrial dysfunction and fatty acid metabolic dysregulation observed in DN. In DN, the enrichment of mitochondrial and fatty acid metabolism pathways suggests a disruption in energy homeostasis and an increase in oxidative stress. This mitochondrial dysfunction likely contributes to key pathological processes, including epithelial-mesenchymal transition (EMT), which is a well-established driver of renal fibrosis in DN (Balakumar, 2024). Moreover, mitochondrial impairment is critically associated with podocyte injury, another hallmark of DN. Podocytes, which are essential for maintaining the integrity of the glomerular filtration barrier, are particularly vulnerable to mitochondrial damage caused by hyperglycemia and oxidative stress (Liu et al., 2022). Protective mechanisms, such as the upregulation of Sirtuin 6 (Sirt6), have been demonstrated to alleviate podocyte injury by inhibiting harmful pathways, including the Wnt/β-catenin signaling pathway and the renin-angiotensin system (RAS) (Miao et al., 2024b). The interaction between mitochondrial health and these crucial signaling pathways, which are dysregulated in DN, such as RAS and Wnt/β-catenin, highlights the fundamental importance of maintaining mitochondrial homeostasis (Balakumar, 2024; Miao et al., 2024b). The observed enrichment of HTT and TTC19 in the mismatch repair signaling pathway among SP patients suggests a potential pivotal role for these genes in the maintenance of genomic stability. Mismatch repair constitutes a fundamental component of the cellular DNA damage repair system, crucial for averting the accumulation of mutations and preventing genomic instability. The presence of HTT and TTC19 enrichment within this pathway may indicate compromised DNA repair capabilities in SP patients (Narciso et al., 2007). Furthermore, the variation in enrichment pathways of HTT and TTC19 across different patient populations suggests that these genes may perform distinct functional roles under varying pathological conditions. This observation carries significant implications for elucidating the molecular mechanisms underlying DN and SP.
Our study found a significant increase in macrophages in DN, consistent with their known role as the main immune cells in renal biopsies for DN (Tesch, 2010; Liu et al., 2021). In addition to macrophages, the dysregulation of other immune cell populations plays a substantial role in the pathogenesis of DN. For example, emerging subsets of T-cells have been identified as non-invasive biomarkers for vascular injury during the pre-dialysis stages of CKD (Martín-Vírgala et al., 2024), underscoring the extensive involvement of adaptive immunity. The activation of macrophages and the progression of DN are driven by factors such as advanced glycation end-products (AGEs), oxidized low-density lipoprotein (Ox-LDL), reactive oxygen species (ROS), and proteases (Hickey and Martin, 2013). These mechanisms exacerbate tissue damage, ultimately leading to renal fibrosis. Moreover, renal injury is notably prevalent among patients with idiopathic inflammatory myopathies (IIMs) (Conticini et al., 2023). Biomarkers such as neutrophil gelatinase-associated lipocalin (NGAL), kidney injury molecule-1 (KIM-1), Activin A, CD163, and Cystatin C have proven to be reliable for the early diagnosis of CKD in this context (Conticini et al., 2023), thereby reinforcing the crucial connection between immune dysregulation, and renal damage across different conditions. In addition, clinical studies have demonstrated age-related variations and changes in macrophage phenotype responses in human skeletal muscle following injury (Zhang et al., 2024). Muscle biopsies from older adults (aged 60–75 years) exhibit a significant decrease in CD68+CD11b+M1 macrophages compared to younger individuals (aged 18–35 years). Furthermore, an 8-week lower limb eccentric exercise rehabilitation program resulted in a more pronounced increase in CD206+M2 macrophages in older adults than in younger individuals (Reidy et al., 2018), aligning with our research findings.
A variety of chemical compounds and medications have been explored as potential treatments for DN and SP. Nonetheless, as of now, no definitive pharmacological interventions have been pinpointed for patients suffering from both DN and SP. Our research aimed to identify potential therapeutic targets and found acetaminophen to be a promising treatment option for both conditions. While predicting acetaminophen-HTT binding computationally is intriguing, clinical validation of HTT is crucial. Specific miRNAs in urine exosomes, like miR-320a, are early biomarkers for kidney disease (Mishra et al., 2024). Exosome-based therapies, such as delivering miRNA-23a/27a/26a clusters, have shown promise in reducing tubulointerstitial fibrosis in DN models (Ji et al., 2023). Additionally, using specific Lactobacillus strains, such as Lactobacillus reuteri, can improve membranous nephropathy by affecting the aryl hydrocarbon receptor pathway (Miao et al., 2024c). These findings emphasize the potential of targeting the gut-kidney axis and microbial metabolites. Consequently, future research should concentrate on two main areas: validating the diagnostic and prognostic value of miRNA biomarkers through non-invasive methods like urinary exosomal analysis, and advancing clinical research on new therapies, including exosomes and microbial interventions, to evaluate their effectiveness and safety in patients.
Although prior research has noted links between DN and SP, the common molecular pathways underlying these diseases have not been analyzed through bioinformatics methods. Our study marks the first identification of key mitochondrial genes that may be implicated in the pathogenesis of DN and SP. Through the application of sophisticated machine learning techniques, we have illuminated potential connections between these genes and the overlapping pathological mechanisms of DN and SP. Nevertheless, our study has certain limitations. Firstly, the study’s dataset, sourced from public repositories, had limited and uneven data, potentially missing key genes in disease progression. Secondly, although the predictive model was developed and evaluated using cross-validation with strict data partitioning to reduce overfitting risks, external validation in independent clinical cohorts remains necessary. Thirdly, the four models built on small public datasets may have limited generalizability despite cross-validation. Future studies should expand cohorts and employ algorithms tailored for small samples (e.g., sPLS-DA) to enhance reliability. Fourthly, the current overlap of the results of the four machine learning models relies on empirical intersections, and in the future, consensus strategies such as weighted voting and integrated learning need to be introduced and combined with statistical tests (e.g., Bootstrapping) to quantify gene selection stability.
Ultimately, to corroborate our findings, the pathological causal pathways of diseases linked to key genes and immune infiltration require additional experimental confirmation from external sources. This study investigated the relationship between DN and SP through transcriptomic data analysis, identifying common DEGs and hub genes pertinent to both conditions. Multiple bioinformatics analyses were conducted based on these findings. The research indicates that DN and SP share certain pathogenic mechanisms potentially mediated by specific key genes. The present research provides innovative biological targets and understanding, which can enhance investigations into the molecular pathways, facilitate the creation of novel treatments, and support the early detection and efficient management of individuals suffering from DN and SP. Identifying HTT and TTC19 as crucial links between mitochondrial dysfunction and DN pathogenesis highlights their potential as therapeutic targets. These genes are enriched in pathways vital for DN, such as mitochondrial and fatty acid metabolism, which may affect EMT and podocyte injury. Targeting these genes or their downstream effects, like modulating mitochondrial function or protecting podocytes, shows promise. Innovative approaches, such as exosome-mediated miRNA delivery or microbiome modulation, expand the therapeutic options for DN. However, the biological implications of these findings necessitate additional investigation, which should be conducted through a combination of in vitro and in vivo experimental approaches.
5 Conclusion
We identified two mitochondrial-related hub genes that are common to both DN and SP, demonstrating their significant diagnostic value. The genes HTT and TTC19 are implicated in the mitochondrial metabolic pathways of these conditions. Our investigation reveals new understanding of the common pathological processes involved in DN and SP. However, further clinical research is essential to confirm the functions and pathways of these genes in individuals affected by DN and SP.
Statements
Data availability statement
The original contributions presented in the study are included in the article/Supplementary Material, further inquiries can be directed to the corresponding authors.
Ethics statement
Ethical approval was not required for the studies involving humans because The data is sourced from public databases, ethical approval is not necessary. The studies were conducted in accordance with the local legislation and institutional requirements. Written informed consent for participation was not required from the participants or the participants’ legal guardians/next of kin in accordance with the national legislation and institutional requirements because The data is sourced from public databases, ethical approval is not necessary.
Author contributions
YC: Software, Writing – original draft, Investigation, Visualization, Methodology. SH: Software, Visualization, Writing – original draft, Investigation, Methodology. YW: Funding acquisition, Writing – review and editing. LH: Investigation, Writing – original draft. QC: Supervision, Project administration, Data curation, Writing – review and editing, Methodology, Funding acquisition. SL: Project administration, Funding acquisition, Data curation, Supervision, Writing – review and editing, Methodology.
Funding
The author(s) declare that financial support was received for the research and/or publication of this article. This study was supported by the Fund of Jiangxi Provincial Natural Science Foundation (Grant number: 20212BAB206028, 20232BAB206034).
Conflict of interest
The authors declare that the research was conducted in the absence of any commercial or financial relationships that could be construed as a potential conflict of interest.
Generative AI statement
The author(s) declare that no Generative AI was used in the creation of this manuscript.
Publisher’s note
All claims expressed in this article are solely those of the authors and do not necessarily represent those of their affiliated organizations, or those of the publisher, the editors and the reviewers. Any product that may be evaluated in this article, or claim that may be made by its manufacturer, is not guaranteed or endorsed by the publisher.
Supplementary material
The Supplementary Material for this article can be found online at: https://www.frontiersin.org/articles/10.3389/fcell.2025.1596204/full#supplementary-material
References
1
Balakumar P. (2024). Unleashing the pathological role of epithelial-to-mesenchymal transition in diabetic nephropathy: the intricate connection with multifaceted mechanism. World J. Nephrol.13 (2), 95410. 10.5527/wjn.v13.i2.95410
2
Bogdanov M. B. Andreassen O. A. Dedeoglu A. Ferrante R. J. Beal M. F. (2001). Increased oxidative damage to DNA in a transgenic mouse model of huntington's disease. J. Neurochem.79 (6), 1246–1249. 10.1046/j.1471-4159.2001.00689.x
3
Börgeson E. Wallenius V. Syed G. H. Darshi M. Lantero Rodriguez J. Biörserud C. et al (2017). AICAR ameliorates high-fat diet-associated pathophysiology in mouse and ex vivo models, independent of adiponectin. Diabetologia60 (4), 729–739. 10.1007/s00125-017-4211-9
4
Bottani E. Cerutti R. Harbour M. E. Ravaglia S. Dogan S. A. Giordano C. et al (2017). TTC19 plays a husbandry role on UQCRFS1 turnover in the biogenesis of mitochondrial respiratory complex III. Mol. Cell.67 (1), 96–105. 10.1016/j.molcel.2017.06.001
5
Bottoni A. dos Anjos Garnes S. Lasakosvitsch F. Bottoni A. (2019). Sarcopenia: an overview and analysis of molecular mechanisms. Nutrire44 (1), 6. 10.1186/s41110-019-0097-2
6
Browne S. E. Ferrante R. J. Beal M. F. (1999). Oxidative stress in huntington's disease. Brain Pathol.9 (1), 147–163. 10.1111/j.1750-3639.1999.tb00216.x
7
Calvani R. Joseph A.-M. Adhihetty P. J. Miccheli A. Bossola M. Leeuwenburgh C. et al (2013). Mitochondrial pathways in sarcopenia of aging and disuse muscle atrophy. Biol. Chem.394 (3), 393–414. 10.1515/hsz-2012-0247
8
Chang J. Yan J. Li X. Liu N. Zheng R. Zhong Y. (2021). Update on the mechanisms of tubular cell injury in diabetic kidney disease. Front. Med.8, 661076. 10.3389/fmed.2021.661076
9
Chen C.-M. Wu Y.-R. Cheng M.-L. Liu J.-L. Lee Y.-M. Lee P.-W. et al (2007). Increased oxidative damage and mitochondrial abnormalities in the peripheral blood of huntington's disease patients. Biochem. Biophys. Res. Commun.359 (2), 335–340. 10.1016/j.bbrc.2007.05.093
10
Chen D. Guo Y. Li P. (2024). New insights into a novel metabolic biomarker and therapeutic target for chronic kidney disease. Integr. Med. Nephrol. Androl.11 (3), e24–00019. 10.1097/imna-d-24-00019
11
Chen M. Wang Y. Deng S. Lian Z. Yu K. (2022). Skeletal muscle oxidative stress and inflammation in aging: focus on antioxidant and anti-inflammatory therapy. Front. Cell. Dev. Biol.10, 964130. 10.3389/fcell.2022.964130
12
Cob-Calan N. N. Chi-Uluac L. A. Ortiz-Chi F. Cerqueda-García D. Navarrete-Vázquez G. Ruiz-Sánchez E. et al (2019). Molecular docking and dynamics simulation of protein β-Tubulin and antifungal cyclic lipopeptides. Molecules24 (18), 3387. 10.3390/molecules24183387
13
Conticini E. Naveen R. Sen P. Singh M. Rathore U. Anuja A. K. et al (2023). Renal injury, biomarkers, and myositis, an understudied aspect of disease: prospective study in the MyoCite cohort. Front. Med.10, 1127657. 10.3389/fmed.2023.1127657
14
Corradi V. Caprara C. Barzon E. Mattarollo C. Zanetti F. Ferrari F. et al (2024). A possible role of P-Cresyl sulfate and indoxyl sulfate as biomarkers in the prediction of renal function according to the GFR (G) categories. Integr. Med. Nephrol. Androl.11 (3), e24–00002. 10.1097/imna-d-24-00002
15
Cruz-Jentoft A. J. Sayer A. A. (2019). Sarcopenia. Lancet.393 (10191), 2636–2646. 10.1016/S0140-6736(19)31138-9
16
Davis A. P. Grondin C. J. Johnson R. J. Sciaky D. Wiegers J. Wiegers T. C. et al (2021). Comparative toxicogenomics database (CTD): update 2021. Nucleic Acids Res.49 (D1), D1138–D1143. 10.1093/nar/gkaa891
17
Feng L. Gao Q. Hu K. Wu M. Wang Z. Chen F. et al (2022). Prevalence and risk factors of sarcopenia in patients with diabetes: a meta-analysis. J. Clin. Endocrinol. Metab.107 (5), 1470–1483. 10.1210/clinem/dgab884
18
Fernandez-Vizarra E. Zeviani M. (2018). Mitochondrial complex III rieske Fe-S protein processing and assembly. Cell. Cycle17 (6), 681–687. 10.1080/15384101.2017.1417707
19
Gao S. Chen J. Brodsky S. V. Huang H. Adler S. Lee J. H. et al (2004). Docking of endothelial nitric oxide synthase (eNOS) to the mitochondrial outer membrane: a pentabasic amino acid sequence in the autoinhibitory domain of eNOS targets a proteinase K-cleavable peptide on the cytoplasmic face of mitochondria. J. Biol. Chem.279 (16), 15968–15974. 10.1074/jbc.M308504200
20
Gene Ontology Consortium (2015). Gene ontology consortium: going forward. Nucleic Acids Res.43 (Database issue), D1049–D1056. 10.1093/nar/gku1179
21
Ghezzi D. Arzuffi P. Zordan M. Da Re C. Lamperti C. Benna C. et al (2011). Mutations in TTC19 cause mitochondrial complex III deficiency and neurological impairment in humans and flies. Nat. Genet.43 (3), 259–263. 10.1038/ng.761
22
Giresi P. G. Stevenson E. J. Theilhaber J. Koncarevic A. Parkington J. Fielding R. A. et al (2005). Identification of a molecular signature of sarcopenia. Physiol. Genomics21 (2), 253–263. 10.1152/physiolgenomics.00249.2004
23
Gueugneau M. Coudy-Gandilhon C. Chambon C. Verney J. Taillandier D. Combaret L. et al (2021). Muscle proteomic and transcriptomic profiling of healthy aging and metabolic syndrome in men. Int. J. Mol. Sci.22 (8), 4205. 10.3390/ijms22084205
24
Hickey F. B. Martin F. (2013). Diabetic kidney disease and immune modulation. Curr. Opin. Pharmacol.13 (4), 602–612. 10.1016/j.coph.2013.05.002
25
Huang Y.-M. Chen W.-M. Chen M. Shia B.-C. Wu S.-Y. (2022). Sarcopenia is an independent risk factor for severe diabetic nephropathy in type 2 diabetes: a long-term Follow-Up propensity score-matched diabetes cohort study. J. Clin. Med.11 (11), 2992. 10.3390/jcm11112992
26
Ji J.-L. Shi H.-M. Li Z.-L. Jin R. Qu G.-T. Zheng H. et al (2023). Satellite cell-derived exosome-mediated delivery of microRNA-23a/27a/26a cluster ameliorates the renal tubulointerstitial fibrosis in mouse diabetic nephropathy. Acta Pharmacol. Sin.44 (12), 2455–2468. 10.1038/s41401-023-01140-4
27
Jin Q. Liu T. Qiao Y. Liu D. Yang L. Mao H. et al (2023). Oxidative stress and inflammation in diabetic nephropathy: role of polyphenols. Front. Immunol.14, 1185317. 10.3389/fimmu.2023.1185317
28
Kamarulzaman N. T. Makpol S. (2025). The link between mitochondria and sarcopenia. J. Physiol. Biochem.81, 1–20. 10.1007/s13105-024-01062-7
29
Kanehisa M. Goto S. (2000). KEGG: kyoto encyclopedia of genes and genomes. Nucleic Acids Res.28 (1), 27–30. 10.1093/nar/28.1.27
30
Kato M. Natarajan R. (2019). Epigenetics and epigenomics in diabetic kidney disease and metabolic memory. Nat. Rev. Nephrol.15 (6), 327–345. 10.1038/s41581-019-0135-6
31
Kawada J.-I. Takeuchi S. Imai H. Okumura T. Horiba K. Suzuki T. et al (2021). Immune cell infiltration landscapes in pediatric acute myocarditis analyzed by CIBERSORT. J. Cardiol.77 (2), 174–178. 10.1016/j.jjcc.2020.08.004
32
Leek J. T. Johnson W. E. Parker H. S. Jaffe A. E. Storey J. D. (2012). The sva package for removing batch effects and other unwanted variation in high-throughput experiments. Bioinformatics28 (6), 882–883. 10.1093/bioinformatics/bts034
33
Liu J. Zhang Y. Sheng H. Liang C. Liu H. Moran Guerrero J. A. et al (2021). Hyperoside suppresses renal inflammation by regulating macrophage polarization in mice with type 2 diabetes mellitus. Front. Immunol.12, 733808. 10.3389/fimmu.2021.733808
34
Liu S. Yuan Y. Xue Y. Xing C. Zhang B. (2022). Podocyte injury in diabetic kidney disease: a focus on mitochondrial dysfunction. Front. Cell. Dev. Biol.10, 832887. 10.3389/fcell.2022.832887
35
Martín-Vírgala J. Miranda-Prieto D. Fernández-Villabrille S. Martín-Carro B. González-García N. Bande-Fernández J. et al (2024). Novel T-cell subsets as non-invasive biomarkers of vascular damage along the predialysis stages of chronic kidney disease. Front. Med.11, 1460021. 10.3389/fmed.2024.1460021
36
Miao H. Liu F. Wang Y.-N. Yu X.-Y. Zhuang S. Guo Y. et al (2024a). Targeting Lactobacillus johnsonii to reverse chronic kidney disease. Signal Transduct. Target Ther.9 (1), 195. 10.1038/s41392-024-01913-1
37
Miao H. Wang Y.-N. Su W. Zou L. Zhuang S.-G. Yu X.-Y. et al (2024b). Sirtuin 6 protects against podocyte injury by blocking the renin-angiotensin system by inhibiting the Wnt1/β-catenin pathway. Acta Pharmacol. Sin.45 (1), 137–149. 10.1038/s41401-023-01148-w
38
Miao H. Wang Y.-N. Yu X.-Y. Zou L. Guo Y. Su W. et al (2024c). Lactobacillus species ameliorate membranous nephropathy through inhibiting the aryl hydrocarbon receptor pathway via tryptophan-produced indole metabolites. Br. J. Pharmacol.181 (1), 162–179. 10.1111/bph.16219
39
Min K. Smuder A. J. Kwon O.-S. Kavazis A. N. Szeto H. H. Powers S. K. (1985)2011). Mitochondrial-targeted antioxidants protect skeletal muscle against immobilization-induced muscle atrophy. J. Appl. Physiol.111 (5), 1459–1466. 10.1152/japplphysiol.00591.2011
40
Mishra D. D. Maurya P. K. Tiwari S. (2024). Reference gene panel for urinary exosome-based molecular diagnostics in patients with kidney disease. World J. Nephrol.13 (3), 99105. 10.5527/wjn.v13.i3.99105
41
Muglia L. Di Dio M. Filicetti E. Greco G. I. Volpentesta M. Beccacece A. et al (2024). Biomarkers of chronic kidney disease in older individuals: navigating complexity in diagnosis. Front. Med.11, 1397160. 10.3389/fmed.2024.1397160
42
Narciso L. Fortini P. Pajalunga D. Franchitto A. Liu P. Degan P. et al (2007). Terminally differentiated muscle cells are defective in base excision DNA repair and hypersensitive to oxygen injury. Proc. Natl. Acad. Sci. U. S. A.104 (43), 17010–17015. 10.1073/pnas.0701743104
43
Pan Y. Jiang S. Hou Q. Qiu D. Shi J. Wang L. et al (2018). Dissection of glomerular transcriptional profile in patients with diabetic nephropathy: sRGAP2a protects podocyte structure and function. Diabetes67 (4), 717–730. 10.2337/db17-0755
44
Polidori M. C. Mecocci P. Browne S. E. Senin U. Beal M. F. (1999). Oxidative damage to mitochondrial DNA in huntington's disease parietal cortex. Neurosci. Lett.272 (1), 53–56. 10.1016/s0304-3940(99)00578-9
45
Prowse E. N. P. Turkalj B. A. Gursu L. Hendricks A. G. (2025). The huntingtin transport complex. Biochemistry64 (4), 760–769. 10.1021/acs.biochem.4c00811
46
Reidy P. T. Lindsay C. C. McKenzie A. I. Fry C. S. Supiano M. A. Marcus R. L. et al (2018). Aging-related effects of bed rest followed by eccentric exercise rehabilitation on skeletal muscle macrophages and insulin sensitivity. Exp. Gerontol.107, 37–49. 10.1016/j.exger.2017.07.001
47
Rygiel K. A. Picard M. Turnbull D. M. (2016). The ageing neuromuscular system and sarcopenia: a mitochondrial perspective. J. Physiol.594 (16), 4499–4512. 10.1113/JP271212
48
Samsu N. (2021). Diabetic nephropathy: challenges in pathogenesis, diagnosis, and treatment. Biomed. Res. Int.2021, 1497449. 10.1155/2021/1497449
49
Shi J.-S. Qiu D.-D. Le W.-B. Wang H. Li S. Lu Y.-H. et al (2018). Identification of transcription regulatory relationships in diabetic nephropathy. Chin. Med. J.131 (23), 2886–2890. 10.4103/0366-6999.246063
50
Short K. R. Bigelow M. L. Kahl J. Singh R. Coenen-Schimke J. Raghavakaimal S. et al (2005). Decline in skeletal muscle mitochondrial function with aging in humans. Proc. Natl. Acad. Sci. U. S. A.102 (15), 5618–5623. 10.1073/pnas.0501559102
51
Stelzer G. Rosen N. Plaschkes I. Zimmerman S. Twik M. Fishilevich S. et al (2016). The GeneCards suite: from gene data mining to disease genome sequence analyses. Curr. Protoc. Bioinforma.54, 1. 10.1002/cpbi.5
52
Subramanian A. Tamayo P. Mootha V. K. Mukherjee S. Ebert B. L. Gillette M. A. et al (2005). Gene set enrichment analysis: a knowledge-based approach for interpreting genome-wide expression profiles. Proc. Natl. Acad. Sci. U. S. A.102 (43), 15545–15550. 10.1073/pnas.0506580102
53
Sun W. Yang H. Zhang J. Wei S. Wu Q. Yang J. et al (2024). Secretory leukocyte protease inhibitor as a novel predictive biomarker in patients with diabetic kidney disease. Front. Endocrinol.15, 1334418. 10.3389/fendo.2024.1334418
54
Takasu M. Kishi S. Nagasu H. Kidokoro K. Brooks C. R. Kashihara N. (2025). The role of mitochondria in diabetic kidney disease and potential therapeutic targets. Kidney Int. Rep.10 (2), 328–342. 10.1016/j.ekir.2024.10.035
55
Tesch G. H. (2010). Macrophages and diabetic nephropathy. Semin. Nephrol.30 (3), 290–301. 10.1016/j.semnephrol.2010.03.007
56
Varatharajan S. Jain V. Pyati A. K. Neeradi C. Reddy K. S. Pallavali J. R. et al (2024). Neutrophil gelatinase-associated lipocalin, kidney injury molecule-1, and periostin: novel urinary biomarkers in diabetic nephropathy. World J. Nephrol.13 (4), 98880. 10.5527/wjn.v13.i4.98880
57
Wei P. Z. Szeto C. C. (2019). Mitochondrial dysfunction in diabetic kidney disease. Clin. Chim. Acta496, 108–116. 10.1016/j.cca.2019.07.005
58
Woroniecka K. I. Park A. S. D. Mohtat D. Thomas D. B. Pullman J. M. Susztak K. (2011). Transcriptome analysis of human diabetic kidney disease. Diabetes60 (9), 2354–2369. 10.2337/db10-1181
59
Xu D. Wang Y. Liu X. Zhou K. Wu J. Chen J. et al (2021). Development and clinical validation of a novel 9-gene prognostic model based on multi-omics in pancreatic adenocarcinoma. Pharmacol. Res.164, 105370. 10.1016/j.phrs.2020.105370
60
Xu H. Brown J. L. Bhaskaran S. Van Remmen H. (2025). Reactive oxygen species in the pathogenesis of sarcopenia. Free Radic. Biol. Med.227, 446–458. 10.1016/j.freeradbiomed.2024.11.046
61
Xu X. Zhu X. Ma M. Han Y. Hu C. Yuan S. et al (2016). p66Shc: a novel biomarker of tubular oxidative injury in patients with diabetic nephropathy. Sci. Rep.6, 29302. 10.1038/srep29302
62
Yu S. M.-W. Bonventre J. V. (2018). Acute kidney injury and progression of diabetic kidney disease. Adv. Chronic Kidney Dis.25 (2), 166–180. 10.1053/j.ackd.2017.12.005
63
Zhang N. Zhai L. Wong R. M. Y. Cui C. Law S.-W. Chow S. K.-H. et al (2024). Harnessing immunomodulation to combat sarcopenia: current insights and possible approaches. Immun. Ageing21 (1), 55. 10.1186/s12979-024-00458-9
64
Zhang P. N. Zhou M. Q. Guo J. Zheng H. J. Tang J. Zhang C. et al (2021). Mitochondrial dysfunction and diabetic nephropathy: nontraditional therapeutic opportunities. J. Diabetes Res.2021, 1010268. 10.1155/2021/1010268
Summary
Keywords
diabetic nephropathy, sarcopenia, machine learning, mitochondria-related genes, molecular docking
Citation
Chen YW, He S, Wang Y, Hu LY, Chen QK and Liu SY (2025) Mitochondrial insights: key biomarkers and potential treatments for diabetic nephropathy and sarcopenia. Front. Cell Dev. Biol. 13:1596204. doi: 10.3389/fcell.2025.1596204
Received
19 March 2025
Accepted
30 June 2025
Published
09 July 2025
Volume
13 - 2025
Edited by
Shyamala Maheswaran, Harvard Medical School, United States
Reviewed by
Xiaoyong Yu, Shaanxi Provincial Hospital of Traditional Chinese Medicine, China
Ruigang Wei, Jiangxi University of Finance and Economics, China
Jun-hee Kim, Yonsei University - Mirae Campus, Republic of Korea
Updates
Copyright
© 2025 Chen, He, Wang, Hu, Chen and Liu.
This is an open-access article distributed under the terms of the Creative Commons Attribution License (CC BY). The use, distribution or reproduction in other forums is permitted, provided the original author(s) and the copyright owner(s) are credited and that the original publication in this journal is cited, in accordance with accepted academic practice. No use, distribution or reproduction is permitted which does not comply with these terms.
*Correspondence: Qin Kai Chen, timmyclz@163.com; Si Yi Liu, liusiyi641@126.com
†These authors have contributed equally to this work
Disclaimer
All claims expressed in this article are solely those of the authors and do not necessarily represent those of their affiliated organizations, or those of the publisher, the editors and the reviewers. Any product that may be evaluated in this article or claim that may be made by its manufacturer is not guaranteed or endorsed by the publisher.