 Luhao Han
 Fabricio da Silva Costa
 Anthony Perkins1,4
 Olivia Holland
- 1School of Pharmacy and Medical Sciences, Griffith University, Gold Coast, QLD, Australia
- 2School of Medicine and Dentistry, Griffith University, Gold Coast, QLD, Australia
- 3Maternal Fetal Medicine Unit, Women-Newborn-Children Services, Gold Coast University Hospital, Gold Coast, QLD, Australia
- 4School of Health, University of the Sunshine Coast, Sunshine Coast, QLD, Australia
- 5Women-Newborn-Children-Services, Gold Coast University Hospital, Gold Coast Hospital and Health Services, Gold Coast, QLD, Australia
Background: Preeclampsia (PE) is a multisystemic pregnancy syndrome that presents in different clinical subtypes. While placental dysfunction is a critical feature of PE, its contribution to different PE subtypes remains unclear. This study aims to use integrated bioinformatics analysis of placental transcriptomics to investigate subtype-specific molecular mechanisms associated with PE.
Methods: A systematic search of the Gene Expression Omnibus (GEO) repository identified two datasets (GSE234729, n = 123; GSE75010, n = 157) for integrated Weighted Gene Co-expression Network Analysis (WGCNA) and differential gene expression analysis. We constructed co-expression networks and identified gene modules correlated with three PE subtypes (severe, early-onset and late-onset). Differential gene expression analysis was conducted using the “limma” R package. Differentially expressed genes (DEGs) overlapping with PE subtype-correlated WGCNA modules underwent Gene Ontology (GO) enrichment analysis. Consistently dysregulated genes were validated in an additional external dataset (GSE25906) and RT-PCR analysis of placental samples from 21 PE cases and 21 uncomplicated controls.
Results: We identified distinct molecular signatures associated with each PE subtype. The green gene module was positively correlated with severe PE (r = 0.63, p = 4e-15), containing 179 DEGs primarily involved in lipid metabolism and hypoxia response processes. Early-onset PE had two highly significant gene modules: the yellow module (r = 0.73, p = 4e-15) with 112 DEGs enriched in biological processes related to gonadotrophin secretion and lipid storage, and the black module (r = −0.55, p = 5e-08) with 47 DEGs significantly enriched in chronic inflammation responses. Late-onset PE showed moderate correlation with the ivory module (r = 0.46, p = 5e-05), containing 23 DEGs enriched in p38MAPK stress-response signalling. Cross-subtype analysis identified 20 consistently dysregulated genes across three PE subtypes, with four upregulated genes (LEP, FSTL3, HTRA4, and HK2) confirmed in the external dataset GSE25906. However, RT-PCR validation showed only moderate upregulation without statistical significance.
Conclusion: Though placental dysfunction occurs across all subtypes with a core set of upregulated genes, variation exits in placental gene expression patterns among PE subtypes. Severe and early-onset PE exhibit large molecular perturbations, while late-onset PE presents more subtle alterations. Aberrant placental lipid storage may contribute to disease severity and early manifestation.
1 Introduction
Preeclampsia (PE) poses a critical global health challenge, contributing substantially to maternal, fetal, and neonatal morbidity and mortality (Magee et al., 2022; Abalos et al., 2014). Affecting approximately 2%–8% of pregnancies worldwide, this complex multisystem disorder manifests through a diverse spectrum of clinical symptoms, ranging from mild hypertension to severe complications including eclampsia and HELLP syndrome (Hemolysis, Elevated Liver enzymes, Low Platelet count) (Gestational Hypertension and Preeclampsia: ACOG Practice Bulletin, 2020). PE can develop at various time points in pregnancy after 20 weeks of gestation and vary in severity. The condition is often classified into subtypes based on onset timing: early-onset (<34 gestational weeks) versus late-onset (≥34 weeks), or preterm (delivery <37 weeks) versus term (delivery ≥37 weeks). Additionally, PE can be further categorized as mild and severe depending on maternal symptom severity, or whether complicated with fetal growth restriction (FGR) (Dimitriadis et al., 2023).
Although PE subtypes present similar clinical symptoms, a common pathophysiological mechanism currently fails to explain the aetiology of all PE cases. Substantial evidence from clinical, epidemiologic, histologic and biological studies supports placental dysfunction as a central factor in PE pathophysiology (Dimitriadis et al., 2023). It has been proposed that dysfunctional placenta releases pathogenic factors into maternal circulation, triggering endothelial dysfunction and systemic inflammation responses, leading to clinical manifestation of PE (Pankiewicz et al., 2021; Michalczyk et al., 2020; Ngene and Moodley, 2018).
The cause and degree of placental dysfunction varies among preeclampsia subtypes, likely reflecting various pathophysiological processes. Early-onset PE is often associated with inadequate trophoblast invasion and poor remodelling of the uterine spiral arteries, leading to placental hypoxia and oxidative stress. This defective placentation is believed to be influenced by aberrant maternal immune responses to the feto-placental unit (Burton et al., 2019). Additionally, early-onset PE is characterized by more pronounced systemic inflammation and disruption of the angiogenic balance (Chuah et al., 2018; Pinheiro et al., 2014). Another potential aetiology is suboptimal maternal cardiovascular function secondary to uteroplacental malperfusion, which may contribute to placental dysfunction in certain PE cases (Melchiorre et al., 2022). Epidemiological evidence has revealed shared risk factors between PE and cardiovascular disease (Wu et al., 2017; Leon et al., 2019), and echocardiographic studies have found cardiac parameter abnormalities in women several weeks prior to the manifestation of clinical signs of both preterm and term PE (Thilaga and nathan, 2020; Castleman et al., 2016; Garcia-Gonzalez et al., 2020; Melchiorre et al., 2013).
Previous transcriptomic studies have provided valuable insights into the molecular differences between early-onset and late-onset PE, supporting the hypothesis that these subtypes may be driven by different pathogenic mechanisms. As early as 2007, Nishizawa et al. conducted a microarray analysis of placental samples from severe PE cases and identified 11 differentially expressed genes between early-onset and late-onset subtypes (Nishizawa et al., 2007). Later, Sitras et al. reported 168 differentially expressed gene between these two PE subtypes, with pathways related to oxidative stress, inflammation, and endothelin signalling involved in early-onset PE (Sitras et al., 2009). Similarly, Junus et al. found significant downregulation of angiogenesis-related genes specifically in early-onset type, suggesting its association with more severe placental vascular dysfunction (Junus et al., 2012). Subsequent transcriptomic investigations have consistently shown that late-onset PE exhibits fewer placental gene alterations compared to early type (Ren et al., 2021; Liang et al., 2016). Furthermore, dysregulation of the placental innate immune system has been identified as a feature specific to early-onset PE but not observed in the late-onset subtype (Broekhuizen et al., 2021). Most recently, a single-cell transcriptomics study of PE placentae reinforced this evidence, showing widespread cell-type–specific gene dysregulation in early-onset PE but fewer changes in late-onset (Admati et al., 2023).
The classical analytic method for those transcriptomic studies focuses on differential gene expression, examining individual genes based on fold changes and statistical significance. However, this approach cannot fully capture the complex gene-gene interactions and regulatory networks underlying multifactorial diseases like PE. Advanced bioinformatics methods like weighted gene co-expression network analysis (WGCNA) can identify co-expression modules of functionally related genes that can be correlated with clinical phenotypes and disease pathophysiology (Langfelder and Horvath, 2008). Our study employs an integrated approach, combining WGCNA with differential expression analysis to systematically characterise molecular signatures across three PE subtypes. This investigation elucidates distinct molecular mechanisms underlying subtype-specific placental pathologies in PE.
2 Materials and methods
2.1 Selection of datasets
A systematic search was conducted from GEO website to identify transcriptomic datasets related to PE in placental tissue. The search terms included “placenta” and “preeclampsia.” Key dataset information including GEO accession number, platform, sample type, processing methods, and sample numbers was extracted and summarized in Supplementary File S1. Dataset selection criteria included placental villous tissue samples collected at delivery, with a sample size over 60, representation of a multi-ethnic population, and contained information about PE subtypes. Based on these criteria, we selected two eligible datasets (GSE234729, GSE75010) for combined WGCNA and DEGs analysis. GSE234729 is RNA-seq data from 50 severe PE placentae and 73 normotensive controls (Aisagbonhi et al., 2023). Severe PE features were defined according to the original study, which was based on the American College of Obstetricians and Gynecologists (ACOG) guideline (Aisagbonhi et al., 2023). Although the classification of PE severity is not recommended for clinical use, this classification remains useful in research (Magee et al., 2022; Dimitriadis et al., 2023). GSE75010 is a microarray dataset from 80 PE cases and 77 normotensive controls with accompanying clinical data including maternal body mass index (BMI), gestational age, newborn weight, and placental weight (Leavey et al., 2016). For this study, cases from GSE75010 were divided into early-onset PE (delivery <34 weeks) and late-onset PE (delivery ≥34 weeks) groups to explore potential molecular mechanism differences between PE subtypes (Dimitriadis et al., 2023; Poon et al., 2019). Additionally, GSE25906 (n = 60), the third-largest available dataset, was included for external validation (Tsai et al., 2011). The overall analytical workflow is illustrated in Figure 1.
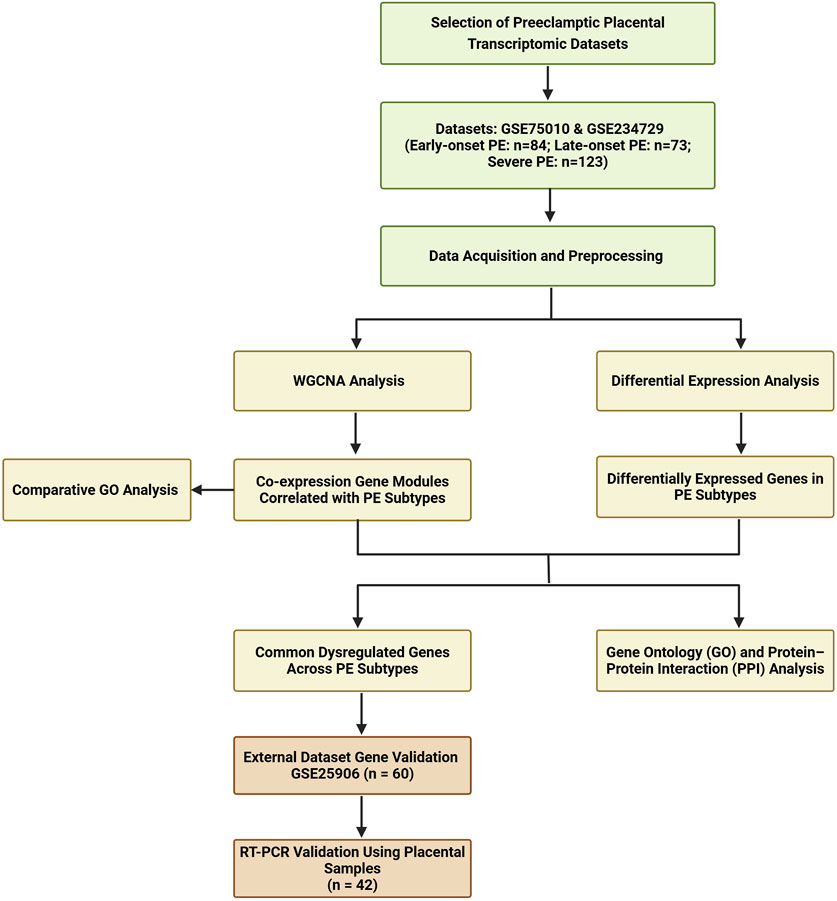
Figure 1. Flowchart of this study.
2.2 Data acquisition and Preprocessing
Gene expression datasets GSE75010, GSE234729, and GSE25906 with clinical information were retrieved from the GEO website or the “GEOquery” R package (Sean and Meltzer, 2007). All datasets were pre-processed using log2 transformation for normalization to stabilize variance and reduce skewness in expression values. Boxplots were generated after transformation to visualize sample distribution and identify potential outliers as part of quality control.
2.3 Weighted gene Co-expression network analysis (WGCNA)
We performed WGCNA analysis using the “WGCNA” R package, following the workflow recommended by the package developers (Langfelder and Horvath, 2008). First, a sample dendrogram was generated to visualize the hierarchical clustering of the samples based on overall gene expression profiles and clinical traits, which aided in the detection and removal of outlier samples to ensure robust network construction. Subsequently, we constructed the co-expression network by computing a co-expression similarity matrix based on Pearson correlation coefficients between all gene pairs. This matrix was then transformed into a dissimilarity matrix using the Topological Overlap Measure (TOM) by subtracting the TOM from 1. Hierarchical clustering was performed on this dissimilarity matrix to group genes with similar expression patterns. Gene modules were identified using the dynamic tree cut algorithm with a minimum module size set to 30 genes. Modules with highly similar expression profiles were merged if their correlation height was below 0.25, resulting in distinct modules with unique colour labels. For each module, eigengenes (MEs) were calculated as the first principal component of the module’s gene expression data. These eigengenes serve as a summary of the expression pattern within the module and can be used in subsequent correlation analyses with clinical traits.
To identify gene expression significantly associated with clinical traits such as PE and maternal ethnicity, we calculated the correlations between MEs and the clinical traits. The relationships between modules and clinical traits were visualized using heatmaps to provide a clear overview of the associations. We defined significance thresholds where correlation coefficients greater than 0.5 indicated strong relationships, while coefficients between 0.3 and 0.5 suggested moderate relationships. Additionally, an adjusted p-value less than 0.05 was required to confirm a statistically significant relationship between a module’s gene expression profile and the clinical trait. Furthermore, we conducted a comparative Gene Ontology (GO) analysis across different gene modules using the compareCluster function from the clusterProfiler R package (Yu et al., 2012). This analysis enabled systematic comparison of gene lists and identification of enriched GO terms across multiple modules simultaneously, revealing both unique and shared biological processes, molecular functions, and cellular components associated with each module.
2.4 Differential expression analysis
Gene expression differences were assessed for three PE subtypes (severe, early-onset, and late-onset), each compared to uncomplicated pregnant control groups individually within the same dataset. Differential expression analysis between PE cases and uncomplicated controls was performed using the “limma” R package (Ritchie et al., 2015). Genes were considered differentially expressed based on the following criteria: an adjusted p-value <0.05, using the Benjamini–Hochberg method to control the false discovery rate, and an absolute log2 fold change >0.5.
2.5 Functional enrichment and interaction network analysis
Key dysregulated placental genes were defined as the intersection of genes within PE subtype correlated modules and DEGs, followed by functional GO enrichment analysis and protein-protein interaction (PPI) analysis. GO enrichment analysis was performed using the “clusterProfiler” R package to examine biological processes (Yu et al., 2012). GO terms with an adjusted p-value <0.05 were considered significantly enriched. PPI analysis was conducted using the STRING database and visualized by Cytoscape. The Maximal Clique Centrality (MCC) algorithm, implemented in the CytoHubba plugin, was employed to precisely identify highly interconnected and influential genes within the network (Shannon et al., 2003; Sz et al., 2019).
2.6 Validation and experimental confirmation
Gene validation was conducted using dataset GSE25906, which includes 37 PE cases and 23 controls. The diagnostic performance of genes was evaluated through Receiver Operating Characteristic (ROC) curve analysis using the “pROC” R package (Robin et al., 2011). The area under the curve (AUC) was calculated to assess the discriminatory power of these genes in distinguishing PE cases from controls.
Placental villous tissues from 21 PE cases and 21 controls matched by prepregnancy BMI, gestational age of delivery, and maternal age were collected at Gold Coast University Hospital. Ethical approval for this study was granted by the Royal Brisbane and Women’s Hospital Human Research Ethics Committee (HREC/2020/QRBW/59479) and the Griffith University Human Research Ethics Committee (GU Ref No: 2020/049). Written informed consent was obtained from all participants. Placental samples were collected immediately post-delivery following the Stillbirth Centre for Research Excellence collection guideline, snap-frozen in liquid nitrogen, and stored at −80°C (Stillbirth CoRE, 2018). RNA was extracted using the RNeasy Mini Kit (Qiagen), and reverse transcription was performed with the QuantiTect Reverse Transcription Kit (Qiagen). Gene expression was quantified via quantitative PCR (qPCR) using SYBR Green Mix (Qiagen) with gene-specific primers. Expression levels were normalized to the housekeeping gene YWHAZ, known for its stability in placental tissue (Murthi et al., 2008). Relative gene expression was calculated using the delta-delta Ct method (Meller et al., 2005). Statistical analysis was performed using unpaired two-tailed t-test, and a p-value <0.05 was considered statistically significant. Plots were created with the “ggplot2” package in R (Wickham, 2016).
3 Results
3.1 Overview of placental transcriptomic studies in PE research
Through a comprehensive review of the GEO repository, we found 51 placental transcriptomic datasets focused on PE research (Supplementary File S1). The datasets were generated using three primary molecular profiling methods: 34 studies utilized microarray-based expression profiling, 16 employed high-throughput sequencing including one single-cell sequencing dataset, and one study used RT-PCR array. In addition, 36 studies focused on mRNA expression profiling, 11 targeted non-coding RNA profiling, and four studies conducted profiling for both mRNA and non-coding RNA. Sample collection timing varied across studies: 47 datasets used placental tissue collected after delivery, two used first-trimester chorionic villous sampling, and two datasets included placental tissue collected during both second trimester and at delivery.
3.2 Gene co-expression network analysis across PE subtypes
3.2.1 Co-expressed modules related to severe PE of GSE234729
WGCNA was performed for the GSE234729 dataset, encompassing 13,507 genes among 50 severe PE cases and 73 uncomplicated control samples. Sample clustering analysis and clinical trait associations are illustrated in Figure 2A. We constructed a scale-free co-expression network using a soft-threshold power of three, which achieved high scale independence (R2 > 0.8) while maintaining robust gene connectivity (Figure 2B). The dynamic tree cutting algorithm identified eight distinct gene modules (Figure 2C), each assigned a unique colour and containing genes with highly correlated expression patterns. Module-trait relationship analysis examined correlations between each module and clinical characteristics (severe PE status, maternal ethnicity, and newborn gender). The correlation heatmap (Figure 2D) revealed that the green module demonstrated the strongest positive correlation with severe PE (r = 0.63, p = 4e-15).
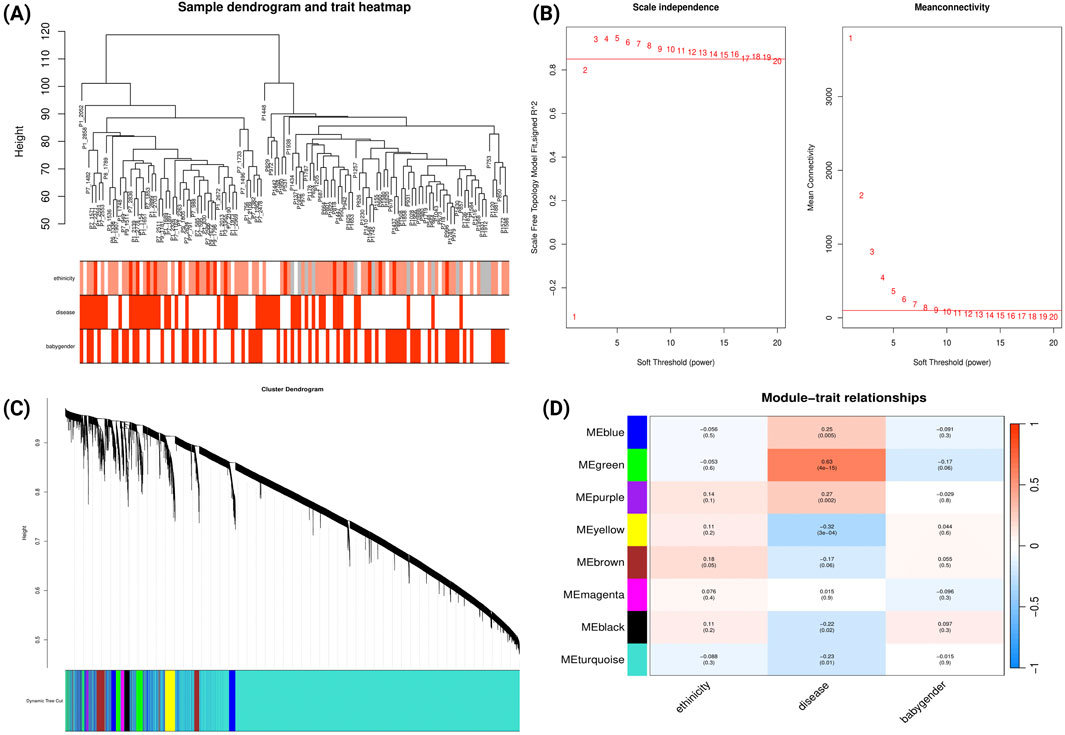
Figure 2. WGCNA Network Analysis of Severe Preeclampsia Dataset (GSE234729). (A) Sample dendrogram and clinical traits heatmap. The colour intensity below the dendrogram reflects the presence or magnitude of the clinical traits PE status, maternal ethnicity, and newborn gender. (B) Determination of soft-threshold power based on scale independence (left) and mean connectivity (right). (C) Gene cluster dendrogram showing module identification. Coloured bands below represent distinct co-expression modules identified through dynamic tree cutting. (D) Module-trait relationships heatmap. This heatmap displays correlations between module eigengenes (rows) and clinical traits (columns). Each cell contains the correlation coefficient (red indicating positive correlations, blue indicating negative correlations) and corresponding p-value.
We conducted comparative GO analysis to functionally annotate the WGCNA-identified gene modules, delineating their associated biological processes, molecular functions, and cellular components (Supplementary File S2; Supplementary Figure S1). The green module (which demonstrated the strongest correlation with severe PE; Figure 2D) showed predominant enrichment in biological processes related to responses to xenobiotic stimuli, lipid storage, epidermis development, and response to decreased oxygen levels.
3.2.2 Co-expressed modules related to early-onset and late-onset PE of GSE75010
For early-onset PE analysis of GSE75010, WGCNA was performed on 84 samples (49 early-onset PE cases and 35 uncomplicated cases delivered before 34 gestational weeks). The sample dendrogram (Figure 3A) illustrates hierarchical clustering based on gene expression patterns, alongside clinical traits (disease status, maternal BMI, ethnicity, HELLP syndrome, and FGR). Using a soft-threshold power of 10 to achieve scale-free topology (Figure 3B), we identified 23 co-expression modules (Figure 3C). Module-trait correlation analysis (Figure 3D) revealed that the yellow module demonstrated a strong correlation with clinical traits: positive correlations with early-onset PE (r = 0.73, p = 4e-15), HELLP syndrome (r = 0.44, p = 4e-05), FGR (r = 0.36, p = 0.001), and negative correlations with newborn weight (r = 0.59, p = 4e-09) and placental weight (r = −0.55, p = 7e-08). In contrast, the black and midnight-blue modules showed significant negative correlations with early-onset PE and positive correlations with newborn and placental weight. Comparative GO analysis (Supplementary File S2; Supplementary Figure S2) revealed that genes within yellow module were predominantly enriched in biological processes related to hypoxic responses while genes within black module were enriched in cellular division processes.
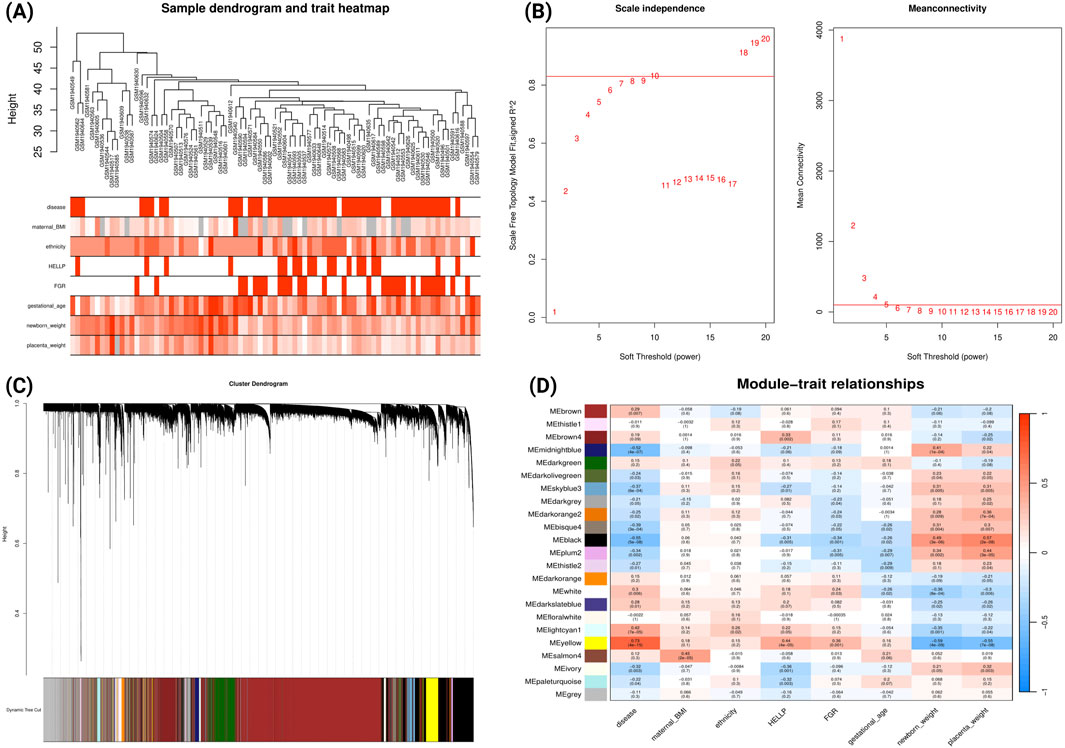
Figure 3. WGCNA Network Analysis of Early-onset Preeclampsia Dataset (GSE75010) (A) Sample dendrogram and clinical traits heatmap. Colour intensity represents the magnitude of clinical characteristics including PE status, maternal BMI, ethnicity, HELLP syndrome, FGR, gestational age, newborn weight, and placental weight. (B) Determination of soft-threshold power based on scale independence (left) and mean connectivity (right). (C) Gene cluster dendrogram with coloured bands representing distinct co-expression modules identified through dynamic tree cutting. (D) Module-trait relationship heatmap displaying correlations between module eigengenes (rows) and clinical traits (columns). Each cell contains the correlation coefficient (red indicating positive, blue indicating negative correlations) and corresponding p-value.
A similar analysis was conducted for late-onset PE from GSE75010 (Figure 4). The analysis identified 32 co-expression modules (Figure 4D). The bisque4 module showed the strongest negative correlation with late-onset PE (r = −0.56, p = 3e-07) and positive correlations with gestational age (r = 0.54, p = 1e-06), newborn weight (r = 0.52, p = 3e-06) and placental weight (r = 0.38, p = 0.001). The ivory module exhibited moderate positive correlation with late-onset PE (r = 0.46, p = 5e-05) and negative correlations with gestational age (r = −0.4, p = 5e-04), newborn weight (r = −0.44, p = 9e-05) and placental weight (r = −0.37, p = 0.001). Notably, the light-steel-blue1 module showed strong positive correlation with newborn weight (r = 0.6, p = 3e-08). Comparative GO analysis (Supplementary File S2; Supplementary Figure S3) revealed that the genes from ivory module was predominantly enriched in biological processes related to hypoxic response, cell-substrate adhesion and cellular response to external stimulus.
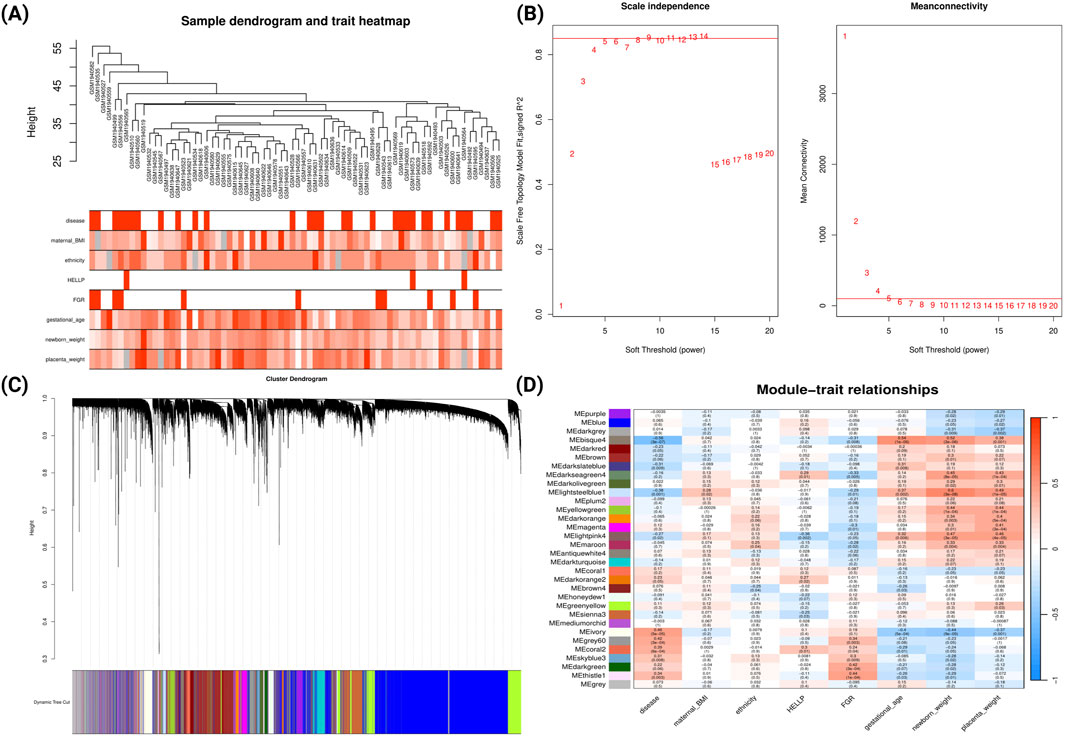
Figure 4. WGCNA Network Analysis of Late-onset Preeclampsia Dataset (GSE75010) (A) Sample dendrogram and clinical traits heatmap. Colour intensity represents the magnitude of clinical characteristics including PE status, maternal BMI, ethnicity, HELLP syndrome, FGR, gestational age, newborn weight, and placental weight. (B) Determination of soft-threshold power based on scale independence (left) and mean connectivity (right). (C) Gene cluster dendrogram with coloured bands representing distinct co-expression modules identified through dynamic tree cutting. (D) Module-trait relationship heatmap displaying correlations between module eigengenes (rows) and clinical traits (columns). Each cell contains the correlation coefficient (red indicating positive, blue indicating negative correlations) and corresponding p-value.
3.3 Differential expression analysis and Integration of WGCNA
3.3.1 Identification of differentially expressed genes
We performed differential expression analysis for each dataset using criteria (|log2FC| > 0.5, FDR <0.05). In GSE234729 dataset, we identified 953 differentially expressed genes (DEGs) in severe PE, including 457 upregulated genes and 496 downregulated genes. Analysis of the GSE75010 dataset revealed 175 DEGs in early-onset PE (103 upregulated and 72 downregulated genes) and 34 DEGs in late-onset PE (26 upregulated and 8 downregulated genes).
3.3.2 Integration DEGs with PE-correlated gene modules
To identify key dysregulated genes potentially involved in PE subtype pathogenesis, we took the intersection between WGCNA gene modules and DEGs for each PE subtype, which are summarized in Table 1. For severe PE, the green module with the strongest positive correlation with disease status contains 179 DEGs. GO enrichment analysis of dysregulated genes from the green module (Figure 5A) revealed biological processes predominantly enriched in pathways related to lipid storage, epidermis development, and hypoxic response. PPI network analysis (Supplementary File S2; Supplementary Figure S4) identified the top ten hub genes using the Maximal Clique Centrality (MCC) algorithm that appear to play central roles in the network. These hub genes, ranked from highest to lowest MCC scores, are SCARB1, LEP, ENG, SLC2A1, LPL, THY1, FLT1, MME, PLIN2, and P4HA1. For early-onset PE, we identified 112 dysregulated genes in the positively correlated yellow module and 47 in the negatively correlated black module shown in Table 1. The yellow module DEGs were enriched in gonadotropin secretion regulation and lipid storage processes (Figure 5B). Similar PPI network analysis was performed and shown in Supplementary File S2; Supplementary Figure S5. Six hub genes (SCARB1, LEP, PLIN2, LPL, ENG, P4HA1) were common between the green module in severe PE and the yellow module in early-onset PE. The black module dysregulated genes (IDO1, VNN1, S100A8) of early-onset PE were significantly enriched in chronic inflammatory response (Figure 5C). The ivory module of late-onset PE contained 23 DEGs enriched in the p38 mitogen-activated protein kinase (p38MAPK) signalling pathway (Figure 5D). In this module, the top hub genes were HTRA4, LEP, FLT1, BHLHE40, FSTL3, SASH1, SIGLEC6, FLNB, COL17A1, and ANKRD37 (Supplementary File S2; Supplementary Figure S6).
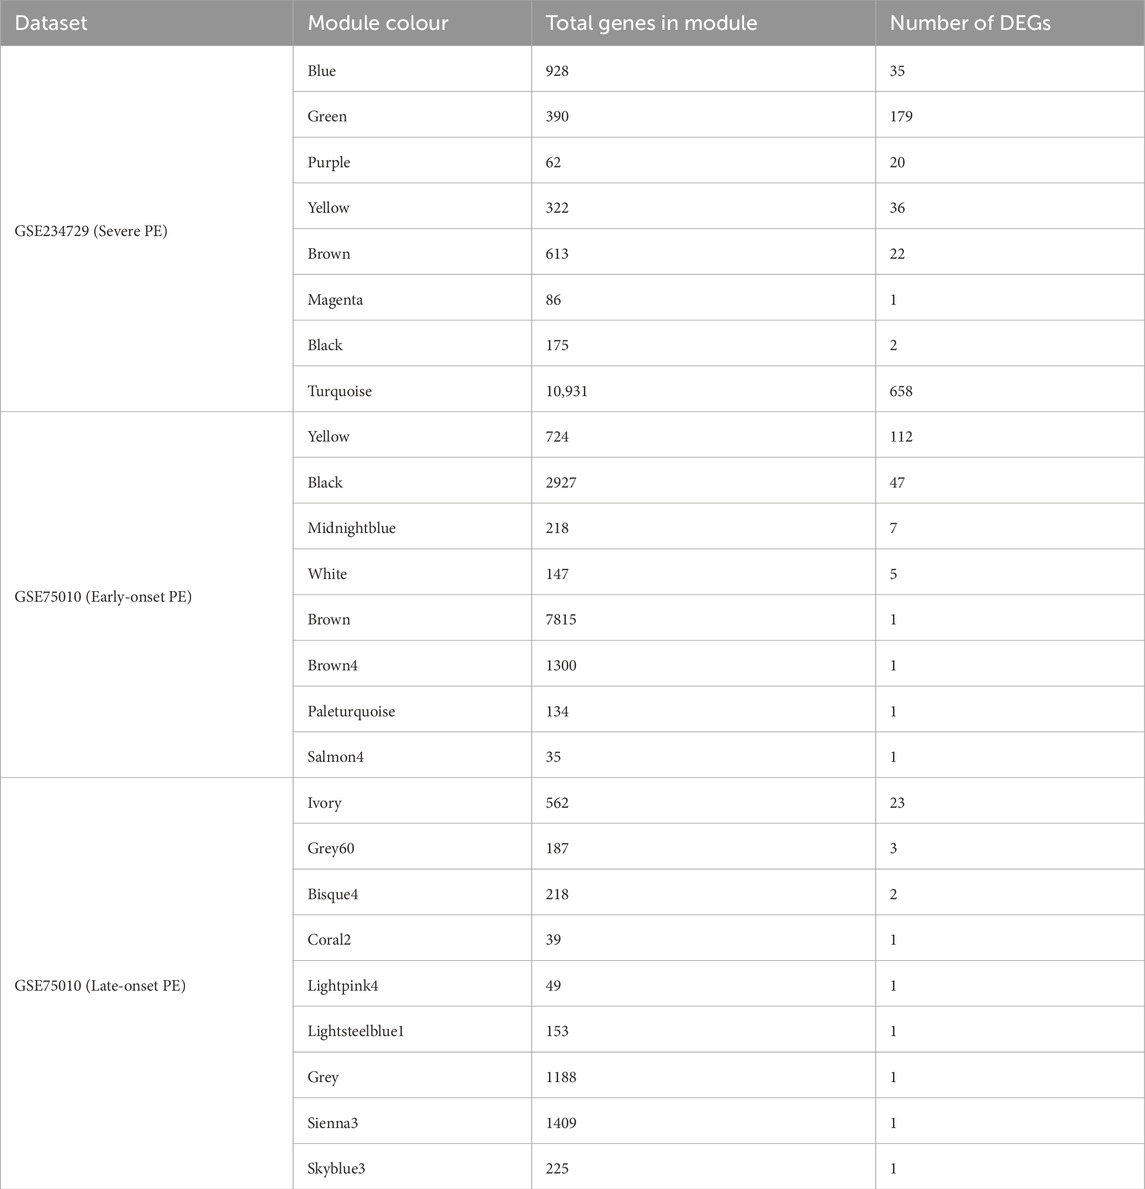
Table 1. Summary of gene modules and differentially expressed genes across PE subtypes.
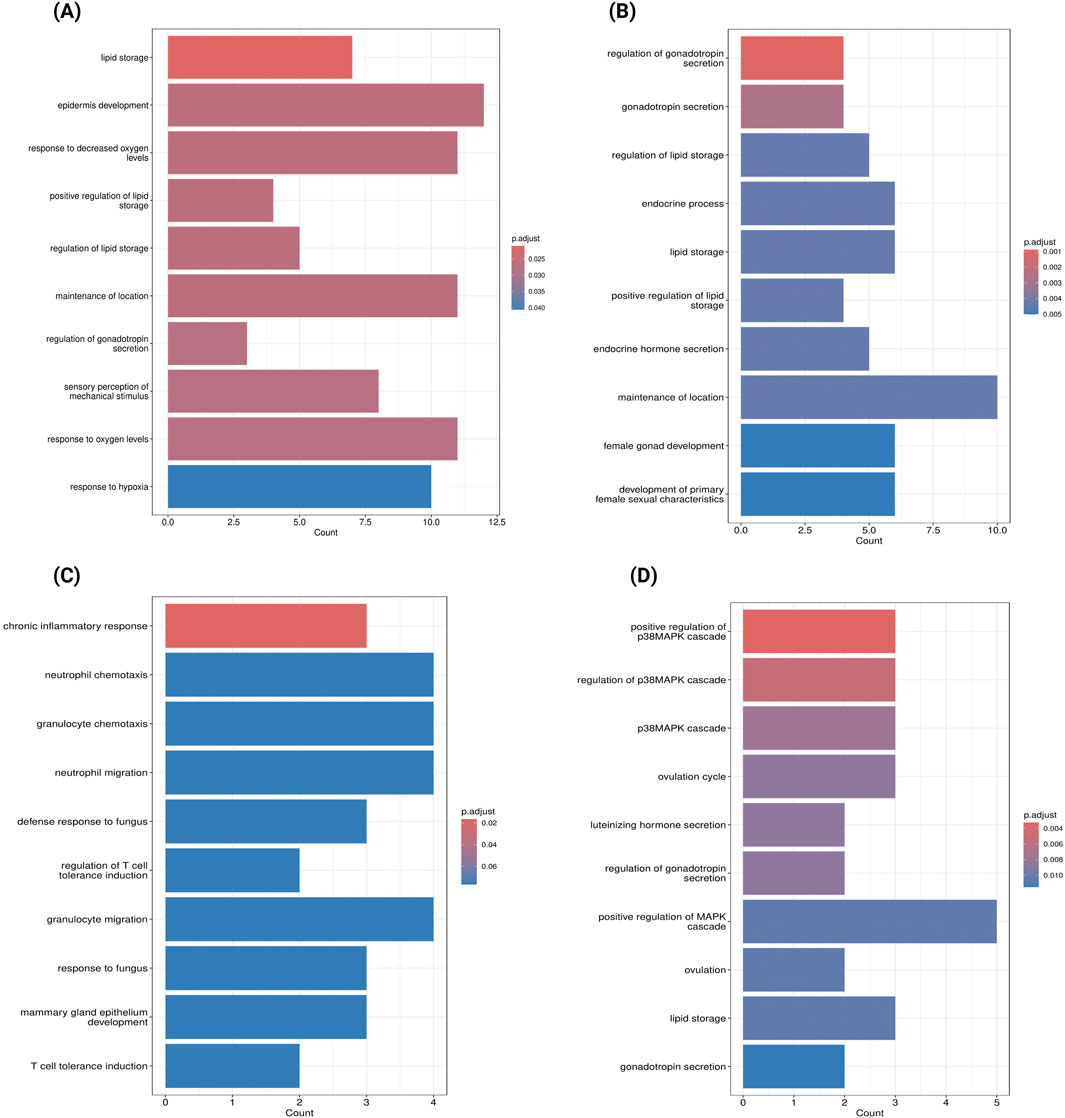
Figure 5. Gene Ontology Enrichment Analysis of Key Dysregulated Genes in Preeclampsia Subtypes (A) GO enrichment analysis of genes overlapping between the green module and DEGs in severe Preeclampsia (GSE234729). (B) GO enrichment analysis of genes overlapping between the yellow module and DEGs in early-onset Preeclampsia (GSE75010). (C) GO enrichment analysis of genes overlapping between the black module and DEGs in early-onset Preeclampsia (GSE75010). (D) GO enrichment analysis of genes overlapping between the ivory module and DEGs in late-onset Preeclampsia (GSE75010). Bar length represents the number of genes associated with each biological process, and colour intensity indicates statistical significance (darker blue represents lower adjusted p-values).
3.4 Identification and validation of potential biomarker candidates
We further performed a cross-analysis of DEGs from three modules showing positive correlation with PE subtypes to identify common dysregulated placental genes. There are 20 consistently dysregulated genes (BHLHE40, SH3BP5, CORO2A, TMEM45A, QPCT, C12orf75, HK2, NRIP1, FSTL3, ANKRD37, FLNB, HTRA4, FLT1, COL17A1, NPNT, RASEF, SIGLEC6, HILPDA, SASH1, LEP) overlapping among the green module (severe PE, GSE234729), yellow module (early-onset PE, GSE75010), and ivory module (late-onset PE, GSE75010), as illustrated in Figure 6. External validation using GSE25906 dataset confirmed differential expression of four genes: FSTL3, HK2, HTRA4, and LEP. Receiver Operating Characteristic (ROC) analysis of four validated genes in GSE25906 demonstrated their diagnostic potential (Supplementary File S2; Supplementary Figure S7), with LEP showing the highest discriminatory power (AUC = 0.84, 95% CI: 0.73–0.95). However, RT-PCR validation in our placental tissue cohort showed only modest upregulation of these genes, approximately 0.5 log2 fold change without statistical significance. The log2 fold change expression these genes in different datasets, RT-PCR results, and the area under the receiver operating characteristic curve (AUC) are summarized in Table 2.
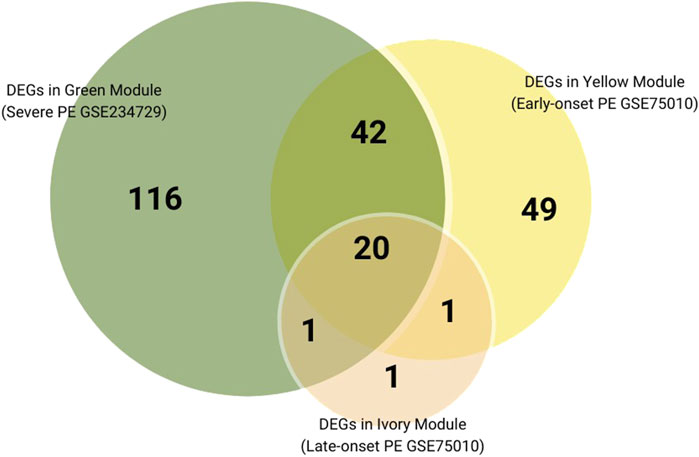
Figure 6. Venn diagram of DEGs overlaps among positively correlated Preeclampsia-related modules across subtypes.
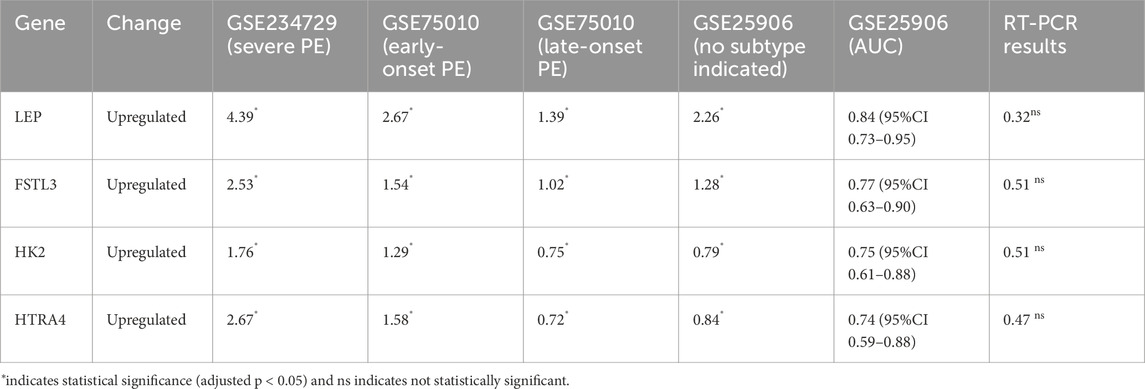
Table 2. Log2 fold change expression of four validated genes across datasets.
4 Discussion
The exact aetiology of PE remains elusive, and its clinical management continues to be challenging due to its multifactorial and heterogenous nature. Through integrated analysis of placental transcriptomics, we have identified both subtype-specific molecular signatures and overlapped biological processes with a core placental dysregulation signature underlying the three PE subtypes (severe, early-onset, and late-onset). Co-expression gene modules showed stronger association with severe and early-onset PE and these subtypes also have a greater number of differentially expressed genes. In contrast, late-onset PE presents modest correlation with WGCNA gene modules and fewer dysregulated genes. This may indicate that placental dysfunction is closely related to disease severity and early manifestation. We also identified 20 commonly dysregulated placental genes across PE-related modules in all PE subtypes, with four upregulated genes (LEP, FSTL3, HTRA4, and HK2) validated in the external dataset, suggesting a potential shared pathogenic feature despite the clinical and molecular heterogeneity among subtypes.
In this study, we found a robust association between severe PE and the WGCNA green module. GO functional annotation of dysregulated genes in this module revealed enrichment of several biological processes, including lipid storage, epidermis development, and response to decreased oxygen levels. These dysregulated pathways, particularly abnormal lipid metabolism and hypoxia response, appear to be key features of severe PE placental pathology. Previous research found increased levels of phospholipids, total cholesterol and lipid peroxides in preeclamptic decidua basalis tissue (Staff et al., 1999). Subsequent lipidomic studies also confirmed significantly higher lipid content in preeclamptic placental tissue (Zhang et al., 2022; Brown et al., 2016). In addition, maternal blood lipidomic profiling study has identified a significant correlation between oxidized phospholipids (OxPLs) and PE. They also found specific lipid species are uniquely associated with severe PE (He et al., 2021). Additionally, a study found that hypoxia promotes accumulation of lipid droplets in primary human trophoblast, and that perilipin (PLIN) proteins play key roles in the process (Bildirici et al., 2018). This evidence suggests there may be a potential link between placental hypoxia and altered lipid metabolism. Despite established research for both placental hypoxia and dysregulated lipid metabolism in PE, the relationship between these processes and how hypoxia-induced alterations in placental lipid metabolism may drive PE development and progression remains unclear.
The enrichment of lipid storage pathways was also observed in early-onset PE within the yellow module. Four genes involved in lipid metabolism (SCARB1, LEP, PLIN2, LPL) are upregulated in both severe and early-onset subtypes: SCARB1 mediating cholesterol uptake (West et al., 2009), LEP encoding leptin, a hormone regulating energy consumption and adiposity (LeDuc et al., 2021), PLIN2 facilitating lipid storage droplets formation (Itabe et al., 2017), and LPL hydrolysing triglycerides (Mead et al., 2002). These molecular alterations in placental lipid processing may contribute to both PE severity and early-onset manifestation. Moreover, DEGs genes (LEP, INHBA, INHA and CRH) in the yellow module are enriched endocrine hormone secretion pathways. This molecular signature suggests that disruption of endocrine and gonadotropin secretion processes may be a pathogenic mechanism in early-onset PE. INHA and INHBA encode inhibin A and activin A, modulating placental hormone synthesis. Elevated levels of activin A and inhibin A have been previously reported in placenta and maternal circulation as potential endocrine markers for PE (Florio et al., 2002; Muttukrishna et al., 2000; Spencer et al., 2008). Furthermore, dysregulated genes in the black module are mostly downregulated. We found IDO1, VNN1, S100A8 are enriched in chronic inflammatory and immune response processes, indicating possible altered inflammatory or immune regulation in early-onset PE. IDO1 is an interesting gene encoding indoleamine 2,3-dioxygenase (IDO), with functions involved in chronic inflammatory response, T cell tolerance induction, and L-tryptophan catabolism (Seo and Kwon, 2023). Reduced expression and activity of IDO1 have been reported in preeclamptic placentae (Kudo et al., 2003; Iwahashi et al., 2017), with one study suggesting this downregulation only occurs in early-onset PE but not in late-onset PE (Broekhuizen et al., 2021). Overall, these findings provide molecular evidence of complex interactions among metabolic, endocrine, and immune-inflammatory pathways in the pathogenesis of early-onset PE.
Previous research suggests that late-onset PE is less associated with placental dysfunction than severe and/or early-onset forms (Ren et al., 2021). These differences likely reflect distinct underlying pathophysiological mechanism. Early-onset PE is primarily characterised by defective placentation in early gestation, resulting in widespread transcriptomic and histopathological disruption. In contrast, late-onset PE is believed to being predominantly driven by maternal factors, such as preexisting cardiovascular and metabolic conditions, with placental stress and aging emerging as secondary contributors in later gestation (Melchiorre et al., 2022; Redman et al., 2022; Robillard et al., 2022; Staff, 2019; Khodzhaeva et al., 2016). This is further supported by clinical evidence demonstrating higher frequencies of fetal growth restriction in early-onset PE compared to late-onset PE, as well as placental pathology analyses reporting a higher rate of maternal vascular malperfusion lesions in early-onset cases (Freedman et al., 2023; Ogge et al., 2011; Gilgannon et al., 2023; Hung et al., 2018). Consistent with these established findings, our analysis found that late-onset PE exhibited fewer differentially expressed genes and only modest correlations with WGCNA gene modules, which may indicate more subtle placental transcriptomic alterations in the late subtype. The ivory module has a moderate correlation with disease status, with DEGs primarily enriched in the p38MAPK signalling pathway (SASH1/FLT1/NPNT/LEP/OPRK1). This pathway plays a critical role in stress response and inflammatory signalling (Cuenda and Rousseau, 2007). The enrichment of p38MAPK signalling in late-onset PE placenta may reflect activation of stress-response mechanisms proximal to term.
We externally validated twenty placental genes that are consistently dysregulated across PE subtypes and confirmed that four genes (LEP, FSTL3, HTRA4, HK2) were significantly upregulated. However, clinical validation by RT-PCR only presented moderate upregulation, which may be attributed to the predominance of term PE cases (19/22) in our validation cohort, all of which developed and delivered at or beyond 37 weeks of gestation. Previous studies support the clinical utility of three of these candidates as maternal biomarkers. LEP plays a multifunctional role in the placenta such as regulating endocrine processes, angiogenesis, and inflammatory responses (Zeng et al., 2023). Maternal serum and plasma leptin levels have been found to differ between preeclamptic women and normotensive pregnant women, with higher concentrations in severe and early-onset cases (Taylor et al., 2015; Hao et al., 2020; El et al., 2013; Salimi et al., 2014). Similarly, increased follistatin-like 3 (FSTL-3) levels is reported with increased likelihood of developing PE (Found et al., 2015; Han et al., 2014), although another study found that FSTL-3 did not alter in early-onset PE (Nevalainen et al., 2017). Elevated serum HtrA4 levels were also higher in the PE group compared to the control group, and this biomarker showed predictive value when combined with first-trimester uterine artery Doppler measurements (Siricharoenthai and Phupong, 2023). HK2 encodes hexokinase 2, a key glycolytic enzyme that is upregulated in preeclamptic and FGR placentas (Wong et al., 2024). Currently, no studies have investigated whether hexokinase 2 levels are elevated in the maternal circulation in PE cases.
Our study identified subtype-specific mechanisms and key dysregulated genes associated with PE. Future research should validate key dysregulated placental genes through functional experiments such as placenta organoid models to define their roles in placental dysfunction. Moreover, determining whether candidate genes such as LEP, FSTL3, HTRA4, and HK2, or their protein products, can be reliably detected and quantified in maternal circulation is essential for translating these findings into clinical applications as potential biomarkers. Several limitations should be considered when interpreting these results. First, heterogeneity in sample sources and transcriptomic platforms may impact reproducibility. Datasets GSE75010 and GSE25906 were generated using microarray technology, whereas dataset GSE234729 utilized RNA-sequencing. Such technique and platform differences introduce technical variations that may affect gene expression comparison across datasets. For the current analysis, we also selected only studies with greater than 60 samples; this was done to provide a good level of statistical power, but may have introduced selection bias by excluding smaller studied. Additionally, potential confounding factors like maternal clinical characteristics may also influence placental gene expression patterns. Second, although PE cases and controls were matched for key maternal variables in RT-PCR validation, several factors are likely to have limited our capacity to detect gene expression with significant differences, including the modest sample size, the predominance of term PE cases (19/22 delivering ≥37 weeks gestation), and potential RNA degradation during sample processing. Third, the computational methodologies employed generate preliminary findings that require experimental validation. While WGCNA is a powerful tool for identifying gene co-expression modules, this approach is susceptible to various sources of bias, including technical artifacts, suboptimal experimental design, and analytical decisions (e.g., sample clustering, module selection). Similarly, predicted PPI networks need experimental confirmation at the protein level to establish biological relevance and functional significance. These methodological limitations collectively affect the reproducibility and clinical interpretation of our results, indicating that further experimental validation is required.
In conclusion, this study presents a detailed analysis of placental transcriptomic data across different PE subtypes, revealing both distinct molecular signatures and shared potential pathogenic mechanisms. Severe and early-onset PE are characterized by significant molecular dysregulation in placenta, while late-onset PE shows more modest alterations. There is evidence that disrupted lipid storage pathways are a common molecular feature in both early-onset and severe PE, suggesting that altered placental lipid homeostasis may be a critical determinant of disease severity and early manifestation. Whilst these findings provide evidence of placental transcriptomic changes associated with PE, they are preliminary and require further experimental confirmation in additional cohorts to determine the potential translation of evidence into clinical care.
Data availability statement
The original contributions presented in the study are included in the article/Supplementary Material, further inquiries can be directed to the corresponding author.
Ethics statement
The studies involving humans were approved by Royal Brisbane and Women’s Hospital Human Research Ethics Committee (HREC/2020/QRBW/59479) and Griffith University Human Research Ethics Committee (GU Ref No: 2020/049). The studies were conducted in accordance with the local legislation and institutional requirements. The participants provided their written informed consent to participate in this study.
Author contributions
LH: Validation, Formal Analysis, Writing – original draft, Project administration, Visualization, Conceptualization, Software, Methodology, Investigation, Data curation. FS: Writing – review and editing, Supervision, Funding acquisition, Resources. AP: Supervision, Funding acquisition, Resources, Writing – review and editing. OH: Resources, Project administration, Funding acquisition, Writing – review and editing, Supervision.
Funding
The author(s) declare that no financial support was received for the research and/or publication of this article.
Conflict of interest
The authors declare that the research was conducted in the absence of any commercial or financial relationships that could be construed as a potential conflict of interest.
Generative AI statement
The author(s) declare that Generative AI was used in the creation of this manuscript to assist with language editing, grammar correction, and troubleshooting code during data analysis in R Studio. No AI-generated content contributed to the interpretation of results or the formulation of scientific conclusions. All analytical decisions, interpretations, and intellectual contributions are those of the author(s).
Publisher’s note
All claims expressed in this article are solely those of the authors and do not necessarily represent those of their affiliated organizations, or those of the publisher, the editors and the reviewers. Any product that may be evaluated in this article, or claim that may be made by its manufacturer, is not guaranteed or endorsed by the publisher.
Supplementary material
The Supplementary Material for this article can be found online at: https://www.frontiersin.org/articles/10.3389/fcell.2025.1635878/full#supplementary-material
References
Abalos, E., Cuesta, C., Carroli, G., Qureshi, Z., Widmer, M., Vogel, J. P., et al. (2014). Pre-eclampsia, eclampsia and adverse maternal and perinatal outcomes: a secondary analysis of the world health organization multicountry survey on maternal and newborn health. Bjog 121 (Suppl. 1), 14–24. doi:10.1111/1471-0528.12629
Admati, I., Skarbianskis, N., Hochgerner, H., Ophir, O., Weiner, Z., Yagel, S., et al. (2023). Two distinct molecular faces of preeclampsia revealed by single-cell transcriptomics. Med 4 (10), 687–709 e7. doi:10.1016/j.medj.2023.07.005
Aisagbonhi, O., Bui, T., Nasamran, C. A., St Louis, H., Pizzo, D., Meads, M., et al. (2023). High placental expression of FLT1, LEP, PHYHIP and IL3RA - in persons of African ancestry with severe preeclampsia. Placenta 144, 13–22. doi:10.1016/j.placenta.2023.10.008
Bildirici, I., Schaiff, W. T., Chen, B., Morizane, M., Oh, S. Y., O'Brien, M., et al. (2018). PLIN2 is essential for trophoblastic lipid droplet accumulation and cell survival during hypoxia. Endocrinology 159 (12), 3937–3949. doi:10.1210/en.2018-00752
Broekhuizen, M., Hitzerd, E., van den Bosch, T. P. P., Dumas, J., Verdijk, R. M., van Rijn, B. B., et al. (2021). The placental innate immune system is altered in early-onset preeclampsia, but not in late-onset preeclampsia. Front. Immunol. 12, 780043. doi:10.3389/fimmu.2021.780043
Brown, S. H., Eather, S. R., Freeman, D. J., Meyer, B. J., and Mitchell, T. W. (2016). A lipidomic analysis of placenta in preeclampsia: evidence for lipid storage. PLoS One 11 (9), e0163972. doi:10.1371/journal.pone.0163972
Burton, G. J., Redman, C. W., Roberts, J. M., and Moffett, A. (2019). Pre-eclampsia: pathophysiology and clinical implications. BMJ 366, l2381. doi:10.1136/bmj.l2381
Castleman, J. S., Ganapathy, R., Taki, F., Lip, G. Y., Steeds, R. P., and Kotecha, D. (2016). Echocardiographic structure and function in hypertensive disorders of pregnancy: a systematic review. Circ. Cardiovasc Imaging 9 (9), e004888. doi:10.1161/CIRCIMAGING.116.004888
Chuah, T. T., Tey, W. S., Ng, M. J., Tan, E. T. H., Chern, B., and Tan, K. H. (2018). Serum sFlt-1/PlGF ratio has better diagnostic ability in early-compared to late-onset pre-eclampsia. J. Perinat. Med. 47 (1), 35–40. doi:10.1515/jpm-2017-0288
Cuenda, A., and Rousseau, S. (2007). p38 MAP-Kinases pathway regulation, function and role in human diseases. Biochim. Biophys. Acta 1773 (8), 1358–1375. doi:10.1016/j.bbamcr.2007.03.010
Dimitriadis, E., Rolnik, D. L., Zhou, W., Estrada-Gutierrez, G., Koga, K., Francisco, R. P. V., et al. (2023). Pre-eclampsia. Nat. Rev. Dis. Prim. 9 (1), 8. doi:10.1038/s41572-023-00417-6
El, S. A. M., Ahmed, A. B., Ahmed, M. R., and Mohamed, H. S. (2013). Maternal serum leptin as a marker of preeclampsia. Arch. Gynecol. Obstet. 288 (6), 1317–1322. doi:10.1007/s00404-013-2915-8
Florio, P., Ciarmela, P., Luisi, S., Palumbo, M. A., Lambert-Messerlian, G., Severi, F. M., et al. (2002). Pre-eclampsia with fetal growth restriction: placental and serum activin A and inhibin A levels. Gynecol. Endocrinol. 16 (5), 365–372. doi:10.1080/gye.16.5.365.372
Founds, S. A., Ren, D., Roberts, J. M., Jeyabalan, A., and Powers, R. W. (2015). Follistatin-like 3 across gestation in preeclampsia and uncomplicated pregnancies among lean and Obese women. Reprod. Sci. 22 (4), 402–409. doi:10.1177/1933719114529372
Freedman, A. A., Suresh, S., and Ernst, L. M. (2023). Patterns of placental pathology associated with preeclampsia. Placenta 139, 85–91. doi:10.1016/j.placenta.2023.06.007
Garcia-Gonzalez, C., Georgiopoulos, G., Azim, S. A., Macaya, F., Kametas, N., Nihoyannopoulos, P., et al. (2020). Maternal cardiac assessment at 35 to 37 weeks improves prediction of development of preeclampsia. Hypertension 76 (2), 514–522. doi:10.1161/HYPERTENSIONAHA.120.14643
Gestational Hypertension and Preeclampsia: ACOG Practice Bulletin (2020). Number 222. Obstet. Gynecol. 135 (6), e237–e260. doi:10.1097/AOG.0000000000003891
Gilgannon, L., Martins, J. G., Srinivas, R. S., Gupta, N., Long, D., King, K., et al. (2023). Adverse maternal outcomes of patients with preeclampsia complicated by fetal growth restriction. Am. J. Obstetrics and Gynecol. 228 (1), S515–S516. doi:10.1016/j.ajog.2022.11.883
Han, X., He, J., Wang, A., and Dong, M. (2014). Serum Follistatin-like-3 was elevated in second trimester of pregnant women who subsequently developed preeclampsia. Hypertens. Pregnancy 33 (3), 277–282. doi:10.3109/10641955.2013.874439
Hao, S., You, J., Chen, L., Zhao, H., Huang, Y., Zheng, L., et al. (2020). Changes in pregnancy-related serum biomarkers early in gestation are associated with later development of preeclampsia. PLoS One 15 (3), e0230000. doi:10.1371/journal.pone.0230000
He, B., Liu, Y., Maurya, M. R., Benny, P., Lassiter, C., Li, H., et al. (2021). The maternal blood lipidome is indicative of the pathogenesis of severe preeclampsia. J. Lipid Res. 62, 100118. doi:10.1016/j.jlr.2021.100118
Hung, T. H., Hsieh, T. T., and Chen, S. F. (2018). Risk of abnormal fetal growth in women with early- and late-onset preeclampsia. Pregnancy Hypertens. 12, 201–206. doi:10.1016/j.preghy.2017.09.003
Itabe, H., Yamaguchi, T., Nimura, S., and Sasabe, N. (2017). Perilipins: a diversity of intracellular lipid droplet proteins. Lipids Health Dis. 16 (1), 83. doi:10.1186/s12944-017-0473-y
Iwahashi, N., Yamamoto, M., Nanjo, S., Toujima, S., Minami, S., and Ino, K. (2017). Downregulation of indoleamine 2, 3-dioxygenase expression in the villous stromal endothelial cells of placentas with preeclampsia. J. Reprod. Immunol. 119, 54–60. doi:10.1016/j.jri.2017.01.003
Junus, K., Centlow, M., Wikstrom, A. K., Larsson, I., Hansson, S. R., and Olovsson, M. (2012). Gene expression profiling of placentae from women with early- and late-onset pre-eclampsia: down-regulation of the angiogenesis-related genes ACVRL1 and EGFL7 in early-onset disease. Mol. Hum. Reprod. 18 (3), 146–155. doi:10.1093/molehr/gar067
Khodzhaeva, Z. S., Kogan, Y. A., Shmakov, R. G., Klimenchenko, N. I., Akatyeva, A. S., Vavina, O. V., et al. (2016). Clinical and pathogenetic features of early- and late-onset pre-eclampsia. J. Matern. Fetal Neonatal Med. 29 (18), 2980–2986. doi:10.3109/14767058.2015.1111332
Kudo, Y., Boyd, C. A., Sargent, I. L., and Redman, C. W. (2003). Decreased tryptophan catabolism by placental indoleamine 2,3-dioxygenase in preeclampsia. Am. J. Obstet. Gynecol. 188 (3), 719–726. doi:10.1067/mob.2003.156
Langfelder, P., and Horvath, S. (2008). WGCNA: an R package for weighted correlation network analysis. Bmc Bioinforma. 9, 559. doi:10.1186/1471-2105-9-559
Leavey, K., Benton, S. J., Grynspan, D., Kingdom, J. C., Bainbridge, S. A., and Cox, B. J. (2016). Unsupervised placental gene expression profiling identifies clinically relevant subclasses of human preeclampsia. Hypertension 68 (1), 137–147. doi:10.1161/HYPERTENSIONAHA.116.07293
LeDuc, C. A., Skowronski, A. A., and Rosenbaum, M. (2021). The role of leptin in the development of energy homeostatic systems and the maintenance of body weight. Front. Physiol. 12, 789519. doi:10.3389/fphys.2021.789519
Leon, L. J., McCarthy, F. P., Direk, K., Gonzalez-Izquierdo, A., Prieto-Merino, D., Casas, J. P., et al. (2019). Preeclampsia and cardiovascular disease in a large UK pregnancy cohort of linked electronic health records: a CALIBER study. Circulation 140 (13), 1050–1060. doi:10.1161/CIRCULATIONAHA.118.038080
Liang, M., Niu, J., Zhang, L., Deng, H., Ma, J., Zhou, W., et al. (2016). Gene expression profiling reveals different molecular patterns in G-protein coupled receptor signaling pathways between early- and late-onset preeclampsia. Placenta 40, 52–59. doi:10.1016/j.placenta.2016.02.015
Magee, L. A., Brown, M. A., Hall, D. R., Gupte, S., Hennessy, A., Karumanchi, S. A., et al. (2022). The 2021 international society for the study of hypertension in pregnancy classification, diagnosis and management recommendations for international practice. Pregnancy Hypertens. 27, 148–169. doi:10.1016/j.preghy.2021.09.008
Mead, J. R., Irvine, S. A., and Ramji, D. P. (2002). Lipoprotein lipase: structure, function, regulation, and role in disease. J. Mol. Med. Berl. 80 (12), 753–769. doi:10.1007/s00109-002-0384-9
Melchiorre, K., Giorgione, V., and Thilaganathan, B. (2022). The placenta and preeclampsia: villain or victim? Am. J. Obstet. Gynecol. 226 (2S), S954–S962. doi:10.1016/j.ajog.2020.10.024
Melchiorre, K., Sutherland, G., Sharma, R., Nanni, M., and Thilaganathan, B. (2013). Mid-gestational maternal cardiovascular profile in preterm and term pre-eclampsia: a prospective study. BJOG 120 (4), 496–504. doi:10.1111/1471-0528.12068
Meller, M., Vadachkoria, S., Luthy, D. A., and Williams, M. A. (2005). Evaluation of housekeeping genes in placental comparative expression studies. Placenta 26 (8-9), 601–607. doi:10.1016/j.placenta.2004.09.009
Michalczyk, M., Celewicz, A., Celewicz, M., Woźniakowska-Gondek, P., and Rzepka, R. (2020). The role of inflammation in the pathogenesis of preeclampsia. Mediat. Inflamm. 2020, 3864941. doi:10.1155/2020/3864941
Murthi, P., Fitzpatrick, E., Borg, A. J., Donath, S., Brennecke, S. P., and Kalionis, B. (2008). GAPDH, 18S rRNA and YWHAZ are suitable endogenous reference genes for relative gene expression studies in placental tissues from human idiopathic fetal growth restriction. Placenta 29 (9), 798–801. doi:10.1016/j.placenta.2008.06.007
Muttukrishna, S., North, R. A., Morris, J., Schellenberg, J. C., Taylor, R. S., Asselin, J., et al. (2000). Serum inhibin A and activin A are elevated prior to the onset of pre-eclampsia. Hum. Reprod. 15 (7), 1640–1645. doi:10.1093/humrep/15.7.1640
Nevalainen, J., Korpimaki, T., Kouru, H., Sairanen, M., and Ryynanen, M. (2017). Performance of first trimester biochemical markers and mean arterial pressure in prediction of early-onset pre-eclampsia. Metabolism 75, 6–15. doi:10.1016/j.metabol.2017.07.004
Ngene, N. C., and Moodley, J. (2018). Role of angiogenic factors in the pathogenesis and management of pre-eclampsia. Int. J. Gynaecol. Obstet. 141 (1), 5–13. doi:10.1002/ijgo.12424
Nishizawa, H., Pryor-Koishi, K., Kato, T., Kowa, H., Kurahashi, H., and Udagawa, Y. (2007). Microarray analysis of differentially expressed fetal genes in placental tissue derived from early and late onset severe pre-eclampsia. Placenta 28 (5-6), 487–497. doi:10.1016/j.placenta.2006.05.010
Ogge, G., Chaiworapongsa, T., Romero, R., Hussein, Y., Kusanovic, J. P., Yeo, L., et al. (2011). Placental lesions associated with maternal underperfusion are more frequent in early-onset than in late-onset preeclampsia. J. Perinat. Med. 39 (6), 641–652. doi:10.1515/jpm.2011.098
Pankiewicz, K., Fijałkowska, A., Issat, T., and Maciejewski, T. M. (2021). Insight into the key points of preeclampsia pathophysiology: uterine artery remodeling and the role of MicroRNAs. Int. J. Mol. Sci. 22 (6), 3132. doi:10.3390/ijms22063132
Pinheiro, C. C., Rayol, P., Gozzani, L., Reis, L. M., Zampieri, G., Dias, C. B., et al. (2014). The relationship of angiogenic factors to maternal and neonatal manifestations of early-onset and late-onset preeclampsia. Prenat. Diagn 34 (11), 1084–1092. doi:10.1002/pd.4432
Poon, L. C., Shennan, A., Hyett, J. A., Kapur, A., Hadar, E., Divakar, H., et al. (2019). The international Federation of gynecology and obstetrics (FIGO) initiative on pre-eclampsia: a pragmatic guide for first-trimester screening and prevention. Int. J. Gynaecol. Obstet. 145 (1), 1–33. doi:10.1002/ijgo.12802
Redman, C. W. G., Staff, A. C., and Roberts, J. M. (2022). Syncytiotrophoblast stress in preeclampsia: the convergence point for multiple pathways. Am. J. Obstet. Gynecol. 226 (2S), S907–S927. doi:10.1016/j.ajog.2020.09.047
Ren, Z., Gao, Y., Gao, Y., Liang, G., Chen, Q., Jiang, S., et al. (2021). Distinct placental molecular processes associated with early-onset and late-onset preeclampsia. Theranostics 11 (10), 5028–5044. doi:10.7150/thno.56141
Ritchie, M. E., Phipson, B., Wu, D., Hu, Y. F., Law, C. W., Shi, W., et al. (2015). Limma powers differential expression analyses for RNA-Sequencing and microarray studies. Nucleic Acids Res. 43 (7), e47. doi:10.1093/nar/gkv007
Robillard, P. Y., Dekker, G., Scioscia, M., and Saito, S. (2022). Progress in the understanding of the pathophysiology of immunologic maladaptation related to early-onset preeclampsia and metabolic syndrome related to late-onset preeclampsia. Am. J. Obstet. Gynecol. 226 (2S), S867–S875. doi:10.1016/j.ajog.2021.11.019
Robin, X., Turck, N., Hainard, A., Tiberti, N., Lisacek, F., Sanchez, J. C., et al. (2011). pROC: an open-source package for R and S+ to analyze and compare ROC curves. BMC Bioinforma. 12, 77. doi:10.1186/1471-2105-12-77
Salimi, S., Farajian-Mashhadi, F., Naghavi, A., Mokhtari, M., Shahrakipour, M., Saravani, M., et al. (2014). Different profile of serum leptin between early onset and late onset preeclampsia. Dis. Markers 2014, 628476. doi:10.1155/2014/628476
Sean, D., and Meltzer, P. S. (2007). GEOquery: a bridge between the gene expression omnibus (GEO) and BioConductor. Bioinformatics 23 (14), 1846–1847. doi:10.1093/bioinformatics/btm254
Seo, S. K., and Kwon, B. (2023). Immune regulation through tryptophan metabolism. Exp. Mol. Med. 55 (7), 1371–1379. doi:10.1038/s12276-023-01028-7
Shannon, P., Markiel, A., Ozier, O., Baliga, N. S., Wang, J. T., Ramage, D., et al. (2003). Cytoscape: a software environment for integrated models of biomolecular interaction networks. Genome Res. 13 (11), 2498–2504. doi:10.1101/gr.1239303
Siricharoenthai, P., and Phupong, V. (2023). The first-trimester serum high-temperature requirement protease A4 and uterine artery doppler for the prediction of preeclampsia. Sci. Rep. 13 (1), 8295. doi:10.1038/s41598-023-35243-z
Sitras, V., Paulssen, R. H., Gronaas, H., Leirvik, J., Hanssen, T. A., Vartun, A., et al. (2009). Differential placental gene expression in severe preeclampsia. Placenta 30 (5), 424–433. doi:10.1016/j.placenta.2009.01.012
Spencer, K., Cowans, N. J., and Nicolaides, K. H. (2008). Maternal serum inhibin-A and activin-A levels in the first trimester of pregnancies developing pre-eclampsia. Ultrasound Obstet. Gynecol. 32 (5), 622–626. doi:10.1002/uog.6212
Staff, A. C. (2019). The two-stage placental model of preeclampsia: an update. J. Reprod. Immunol. 134-135, 1–10. doi:10.1016/j.jri.2019.07.004
Staff, A. C., Ranheim, T., Khoury, J., and Henriksen, T. (1999). Increased contents of phospholipids, cholesterol, and lipid peroxides in decidua basalis in women with preeclampsia. Am. J. Obstet. Gynecol. 180 (3 Pt 1), 587–592. doi:10.1016/s0002-9378(99)70259-0
Szklarczyk, D., Gable, A. L., Lyon, D., Junge, A., Wyder, S., Huerta-Cepas, J., et al. (2019). STRING v11: protein-protein association networks with increased coverage, supporting functional discovery in genome-wide experimental datasets. Nucleic Acids Res. 47 (D1), D607–D613. doi:10.1093/nar/gky1131
Taylor, B. D., Ness, R. B., Olsen, J., Hougaard, D. M., Skogstrand, K., Roberts, J. M., et al. (2015). Serum leptin measured in early pregnancy is higher in women with preeclampsia compared with normotensive pregnant women. Hypertension 65 (3), 594–599. doi:10.1161/HYPERTENSIONAHA.114.03979
Thilaganathan, B. (2020). Maternal cardiac dysfunction precedes development of preeclampsia. Hypertension 76 (2), 321–322. doi:10.1161/HYPERTENSIONAHA.120.15281
Tsai, S., Hardison, N. E., James, A. H., Motsinger-Reif, A. A., Bischoff, S. R., Thames, B. H., et al. (2011). Transcriptional profiling of human placentas from pregnancies complicated by preeclampsia reveals disregulation of sialic acid acetylesterase and immune signalling pathways. Placenta 32 (2), 175–182. doi:10.1016/j.placenta.2010.11.014
West, M., Greason, E., Kolmakova, A., Jahangiri, A., Asztalos, B., Pollin, T. I., et al. (2009). Scavenger receptor class B type I protein as an independent predictor of high-density lipoprotein cholesterol levels in subjects with hyperalphalipoproteinemia. J. Clin. Endocrinol. Metab. 94 (4), 1451–1457. doi:10.1210/jc.2008-1223
Wickham, H. (2016). Ggplot2: elegant graphics for data analysis. 2 ed. Springer International Publishing.
Wong, G. P., Hartmann, S., Simmons, D. G., Ellis, S., Nonn, O., Cannon, P., et al. (2024). Trophoblast side-population markers are dysregulated in preeclampsia and fetal growth restriction. Stem Cell. Rev. Rep. 20 (7), 1954–1970. doi:10.1007/s12015-024-10764-w
Wu, P., Haththotuwa, R., Kwok, C. S., Babu, A., Kotronias, R. A., Rushton, C., et al. (2017). Preeclampsia and future cardiovascular health: a systematic review and meta-analysis. Circ. Cardiovasc Qual. Outcomes 10 (2), e003497. doi:10.1161/CIRCOUTCOMES.116.003497
Yu, G., Wang, L. G., Han, Y., and He, Q. Y. (2012). clusterProfiler: an R package for comparing biological themes among gene clusters. OMICS 16 (5), 284–287. doi:10.1089/omi.2011.0118
Zeng, S., Liu, Y., Fan, P., Yang, L., and Liu, X. (2023). Role of leptin in the pathophysiology of preeclampsia. Placenta 142, 128–134. doi:10.1016/j.placenta.2023.09.005
Keywords: preeclampsia subtypes, pregnancy complications, hypertensive disorders of pregnancy, placental gene expression, transcriptomic analysis
Citation: Han L, da Silva Costa F, Perkins A and Holland O (2025) Molecular signatures of preeclampsia subtypes determined through integrated weighted gene co-expression network analysis and differential gene expression analysis of placental transcriptomics. Front. Cell Dev. Biol. 13:1635878. doi: 10.3389/fcell.2025.1635878
Received: 27 May 2025; Accepted: 15 July 2025;
Published: 31 July 2025.
Edited by:
Rajesh Kumar Manne, Duke University, United StatesReviewed by:
Atar Singh Kushwah, Icahn School of Medicine at Mount Sinai, United StatesHong Wu, Sichuan Cancer Hospital, China
Copyright © 2025 Han, da Silva Costa, Perkins and Holland. This is an open-access article distributed under the terms of the Creative Commons Attribution License (CC BY). The use, distribution or reproduction in other forums is permitted, provided the original author(s) and the copyright owner(s) are credited and that the original publication in this journal is cited, in accordance with accepted academic practice. No use, distribution or reproduction is permitted which does not comply with these terms.
*Correspondence: Olivia Holland, by5ob2xsYW5kQGdyaWZmaXRoLmVkdS5hdQ==