 Bingjie Ma
 Jingjing Liang
 Meixia Dai
 Jue Wang
 Jingyin Luo
 Zheqing Zhang
 Jin Jing
- 1Department of Maternal and Child Health, School of Public Health, Sun Yat-sen University, Guangzhou, China
- 2Department of Child Health Care, Guangzhou Women and Children's Medical Center, Guangzhou Medical University, Guangzhou, China
- 3Guangdong Provincial Key Laboratory of Tropical Disease Research, Department of Nutrition and Food Hygiene, School of Public Health, Southern Medical University, Guangzhou, China
The link between gut microbes and autism spectrum disorders (ASD) has been already observed in some studies, but some bacterial families/species were found to be inconsistently up or down regulated. This issue has been rarely explored in the Chinese population. In this study, we assessed whether or not gut microbiota dysbiosis was associated with children with ASD in China. We enrolled 45 children with ASD (6–9 years of age; 39 boys and 6 girls) and 45 sex- and age-matched neurotypical children. Dietary and other socio-demographic information was obtained via questionnaires. We characterized the composition of the fecal microbiota using bacterial 16S ribosomal RNA (16S rRNA) gene sequencing. The ASD group showed less diversity and richness of gut microbiota than the neurotypical group, as estimated by the abundance-based coverage estimator index and the phylogenetic diversity index. The analysis of beta diversity showed an altered microbial community structure in the ASD group. After adjustment for confounders and multiple testing corrections, no significant group difference was found in the relative abundance of microbiota on the level of the phylum. At the family level, children with ASD had a lower relative abundance of Acidaminococcaceae than the healthy controls. Moreover, a decrease in the relative abundance of genera Lachnoclostridium, Tyzzerella subgroup 4, Flavonifractor, and unidentified Lachnospiraceae was observed in ASD group. This study provides further evidence of intestinal microbial dysbiosis in ASD and sheds light on the characteristics of the gut microbiome of autistic children in China.
Introduction
Autism spectrum disorders (ASD) are complex neurodevelopmental disorders characterized by impairment of social interaction and communication and restricted, repetitive behavior (American Psychiatric Association, 2013). The origin of ASD is not fully understood, and evidence suggests that both genetic and environmental factors are involved (Mcelhanon et al., 2014; Colvert et al., 2015). In addition to the core symptoms, evidence shows that gastrointestinal (GI) symptoms, including constipation, abdominal pain, diarrhea and gaseousness and vomiting, are also prominent in individuals with ASD, with estimates ranging from 9 to 70% (Buie et al., 2010). Furthermore, several studies have reported a strong positive correlation between GI problems and the severity of ASD (Buie et al., 2010; Adams et al., 2011; Tomova et al., 2015). The GI microbiota is an integral part of human physiology. It influences brain development and behavior through the neuroendocrine, neuroimmune and autonomic nervous systems (Ding et al., 2017). Investigators have highlighted the existence of a so-called “microbiota-gut-brain axis,” which supports the hypothesis that the gut microbiota could trigger neuropsychiatric symptoms in subjects with ASD (Sampson and Mazmanian, 2015; Kraneveld et al., 2016; Sharon et al., 2016).
The gut microbiota–ASD connection has been tested in animal models of ASD, and the microbiota was mechanistically linked to abnormal metabolites and behavior (Hsiao et al., 2013; Mayer et al., 2014; Arentsen et al., 2015). Various bacterial species have been shown to be involved in microbial dysbiosis in children with ASD (Finegold et al., 2010; Martirosian et al., 2011; Williams et al., 2011; Kang et al., 2013; De Angelis et al., 2015; Strati et al., 2017; Zhang et al., 2018; Liu et al., 2019). Specifically, a higher bacterial incidence of potentially harmful Clostridium clusters was observed in autistic children than in healthy controls (Argou-Cardozo and Zeidan-Chulia, 2018). Beneficial bacteria (i.e., Bifidobacterium, Lactobacillus) were reported to be inconsistently up or down regulated in different studies (Wang et al., 2011; Tomova et al., 2015). There is also no established consensus on observations on individual bacterial taxa. For example, Desulfovibrio and Akkermansia levels in autistic children were shown to be either higher (De Angelis et al., 2015) or lower (Wang et al., 2011; Kang et al., 2013). Although some studies supported a reduction of the Bacteroidetes/Firmicutes ratio in children with ASD (Williams et al., 2011; Tomova et al., 2015; Strati et al., 2017), this was incongruent with other findings (De Angelis et al., 2015; Liu et al., 2019). Some human epidemiologic studies focusing on children with ASD and their neurotypical siblings reported either no difference (Gondalia et al., 2012; Son et al., 2015) or an aberrant composition of gut microbiota (De Angelis et al., 2015). It should be noted that neurotypical siblings, however, may differ from the general neurotypical population.
Microbiota varies with age, genetics, dietary habits, geographic environment, and other host-associated factors (Yatsunenko et al., 2012). Recent studies have also shown substantial divergence in the microbiome structure between individuals from different races and ethnicities (Chong et al., 2015; Gupta et al., 2017). To the best of our knowledge, only two studies have addressed this topic in the context of ASD in the Chinese population (Zhang et al., 2018; Liu et al., 2019). Therefore, we studied the bacterial gut microbiota between 45 children with ASD between 6 and 9 years of age and 45 sex- and age-matched neurotypical children by sequencing the V3/V4 regions of the 16S rRNA from fecal samples.
Methods
Subject Recruitment
Between December 2015 and July 2017, 45 children with ASD between 6 and 9 years of age (39 males and 6 females) were enrolled in the Center for Child and Adolescent Psychology and Behavioral Development of Sun Yat-sen University in Guangzhou, China. The children received a diagnosis of ASD and met the criteria in the Diagnostic and Statistical Manual of Mental Disorders, 5th Edition (DMS-5) (American Psychiatric Association, 2013). Two experienced developmental and behavioral pediatricians further confirmed the diagnosis with the Childhood Autism Rating Scale (CARS) (Schopler et al., 1980). Children with ASD were excluded from the study if they had a history of Rett syndrome, cerebral palsy, other congenital diseases, and acute or chronic affective diseases in the past 3 months. Sex- and age-matched healthy, developmentally normal children, who were unrelated to the autistic individuals, were recruited from primary schools and sent an invitation letter. The participants did not receive antibiotic treatment, probiotics, prebiotics or any other medical treatment that could influence the intestinal microbiota during the 3 months before they were enrolled in the study.
Anthropometric Measurements
We measured weight to the nearest 0.1 kg, with the participants wearing light clothes and no shoes, and height to the nearest 0.1 cm, with the child in an upright position.
Sample Collection and DNA Extraction
Stool specimens were collected from 39 out of 45 children with ASD and all the controls during the process of physical and mental examination. The specimens were frozen at −80°C within 10 min and stored until DNA extraction. In the remaining six ASD cases, the parents were asked to collect the stool samples at home and place them in a sterile plastic container. The samples were refrigerated at home and transported to the research facility within 12 h in a cooler with ice packs. Following the manufacturer's instructions, the fecal microbial DNA was extracted from 250 mg of feces using QIAamp Fast DNA Stool Mini kit (Qiagen, Hilden, Germany). The DNA concentration and purity were monitored on 1% agarose gels. According to the concentration, the DNA was diluted to 1 ng/μL using sterile water and stored at −20°C before analysis.
16S rRNA Sequencing Analysis
For each DNA sample, we amplified the bacterial 16S rRNA genes using a primer set specific for V3–V4 hypervariable regions (341F: CCT AYG GGR BGC ASC AG, 806R: GGA CTA CNN GGG TAT CTA AT) (Xiao et al., 2016) with a unique barcode for multiplexing. The PCR reactions were carried out in 30-μl reactions with 15 μl of Phusion High-Fidelity PCR Master Mix (New England Biolabs), 0.2 pmol/μl of forward and reverse primers, and about 10 ng of DNA template. Thermal cycling consisted of initial denaturation at 98°C for 1 min, 30 cycles of 98°C for 10 s, annealing at 50°C for 30 s, elongation at 72°C for 1 min, and finally an extension of 72°C for 5 min. The amplified products were then checked, purified and quantified, according to the respective manufacturers' instructions. Following the manufacturer's recommendations, sequencing libraries were generated using the TruSeq DNA PCR-Free Sample Preparation Kit (Illumina, USA) and index codes were added. The library quality was assessed on the Qubit@ 2.0 Fluorometer (Thermo Scientific) and Agilent Bioanalyzer 2100 system. Finally, 250 bp paired-end reads were obtained using the IlluminaHiSeq2500 platform. The paired-end reads from the original DNA fragments were merged using FLASH (V1.2.7, http://ccb.jhu.edu/software/FLASH/) (Magoc and Salzberg, 2011). We assigned paired-end reads to each sample according to their unique barcodes. The tags were compared with the reference database of Broad Microbiome Utilities (“Gold database,” version 20110519, http://drive5.com/uchime/uchime_download.html) using UCHIME algorithm (UCHIME Algorithm, http://www.drive5.com/usearch/manual/uchime_algo.html) (Edgar et al., 2011) to detect chimera sequences; putative chimeric sequences were removed. OTU grouping was performed using the Uparse software package (Uparse v7.0.1001, http://drive5.com/uparse/) (Edgar, 2013). Sequences with >97% similarity were assigned to the same operational taxonomic units (OTUs). For each representative sequence, Mothur classifier (with a cut-off value of 0.8) was used to annotate taxonomic information against SILVA Database (version 128, https://www.arb-silva.de/) (Quast et al., 2013). In addition, the MUSCLE software (Version 3.8.31, http://www.drive5.com/muscle/) (Edgar, 2004) was used to estimate the phylogenetic tree to be used in the Unifrac distances calculation. The functional potential of gut microbiota was inferred with Tax4Fun (Asshauer et al., 2015) using the SILVA database as a reference. Further, we obtained a prediction of the Kyoto Encyclopedia of Genes and Genomes (KEGG) ortholog (KO) functional profiles.
Covariates
A validated 79-item food frequency questionnaire was used to assess the usual dietary intake for the past year (Zhang and Ho, 2009). The parents and their children were asked to complete the questionnaire together. Photographs of food portion sizes were provided to help estimate the amount of food consumed. For each food item, five possible frequencies (never, per year, per month, per week, and per day) and a quantitative (amount) response were available. Daily mean nutrient and energy intakes were calculated using the Chinese Food Composition Table, 2009 (Yang et al., 2009). In addition, individual daily intake of each nutrient was adjusted for total energy intake by using the regression residual method (Willett et al., 1997). Trained interviewers conducted face-to-face interviews to collect essential information on gestational age, delivery mode, birth weight and height of children, feeding patterns, and parent educational level. We classified the parent educational level into four categories: primary or less, secondary, graduate, or postgraduate or above.
Statistical Analyses
Continuous variables were presented as mean ± standard deviation, and comparisons between ASD and neurotypical groups were performed with paired Student t-test or Wilcoxon matched pairs test. Categorical variables were presented as proportions, and the groups were compared using chi-square tests. QIIME software (Version 1.7.0) (Caporaso et al., 2010) was used to calculate the alpha and beta diversity estimates, which were displayed by R software (Version 2.15.3). The indicators of alpha diversity included abundance-based coverage estimator (ACE), Chao1, Shannon, and the phylogenetic diversity (PD) index. The difference in the alpha diversity between the groups was tested with a paired Student t-test. The principal coordinates analysis (PCoA) using Bray-Curtis dissimilarity and unweighted and weighted UniFrac distances were performed to assess the beta diversity of the bacterial community. The permutational multivariate analysis of variance (PERMANOVA) analysis was conducted using the adonis function of the vegan package in R with 999 permutations (Oksanen et al., 2013). The differences of the relative abundance between the groups at each taxonomic level (phylum, class, order, family, genus, and species) and the group differences in the functional category abundances were analyzed using paired Student t-test. The false discovery rate (FDR) was used for the P-value correction upon multiple comparisons, using the Benjamini-Hochberg method (Benjamini and Hochberg, 1995). In addition, multivariable models were adjusted for gestational age, delivery mode, parent educational levels, and daily intakes of total energy, protein, fat, carbohydrates, and fiber.
Results
Characteristics of Study Participants
We recruited 45 subjects with ASD (average age 7.04 ± 1.19 years; male: female, 39:6) and 45 sex- and age-matched neurotypical controls. Table 1 shows the characteristics of the subjects. We observed a significant difference in the distribution of paternal educational level between the two groups (P = 0.020). No significant differences were found in the other characteristics between the ASD and neurotypical groups.
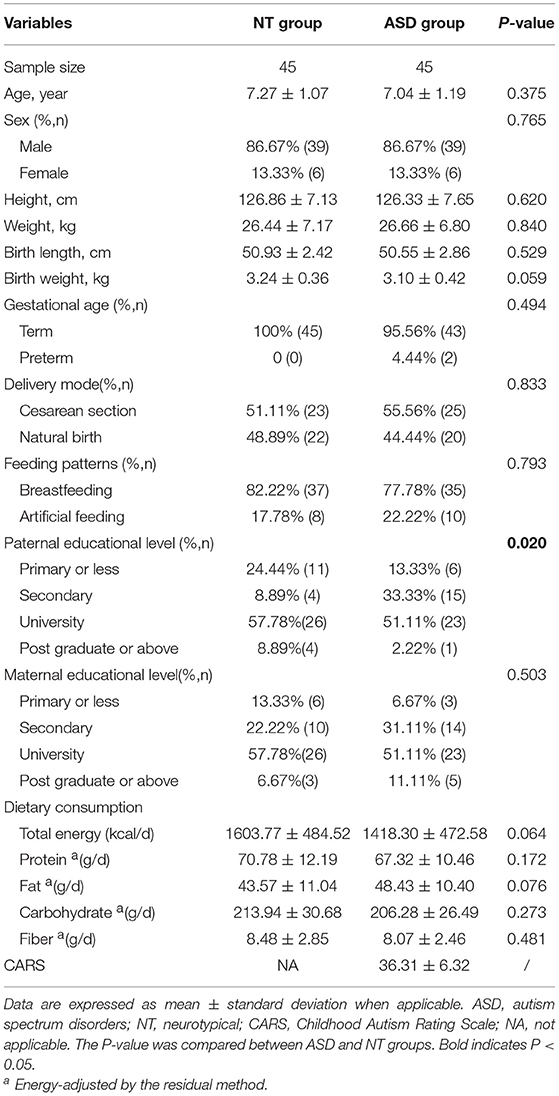
Table 1. Characteristics of study participants.
Differences of Gut Microbial Diversity Between ASD and Healthy Children
This study obtained 5,903,119 reads of high quality and classification at an average of 65,590 reads per sample (Supplemental Table S1). At a 97% similarity level, this study identified 30,217 OTUs in all samples and an average of 336 OTUs per sample (Supplemental Table S1). The ASD group had a lower biodiversity than the neurotypical group, as indicated by the ACE estimator (329.27 ± 30.52 vs. 343.93 ± 32.45, P = 0.040; Figure 1A and Supplemental Table S2) and PD index (19.20 ± 1.98 vs. 22.07 ± 5.64, P = 0.002; Figure 1B and Supplemental Table S2).
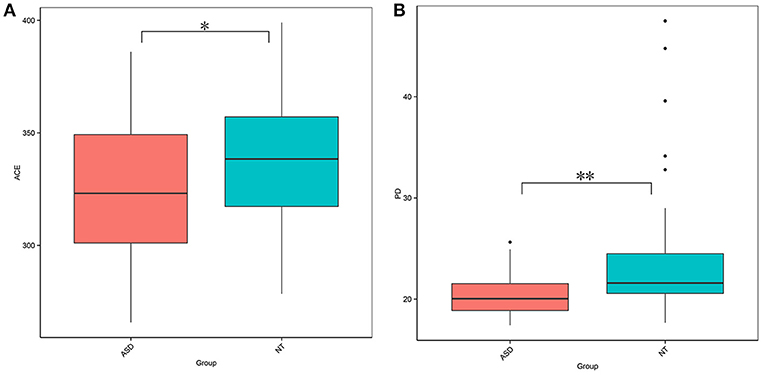
Figure 1. Comparison on bacterial richness and diversity between NT and ASD groups. Comparison of (A) ACE estimator and (B) PD index between ASD (red-colored box) and NT (blue-colored box) groups (*P < 0.05, **P < 0.01 by paired Student t-test). ASD, autism spectrum disorders; NT, neurotypical.
The PCoA analysis calculated on the Bray-Curtis dissimilarity and unweighted UniFrac distances revealed that the gut microbiota of the subjects with ASD clustered apart from that of neurotypical subjects (P = 0.002, P = 0.001, respectively; Figure 2 and Supplemental Table S3). The PCoA analysis of the weighted UniFrac distances showed no group difference (P = 0.128, Supplemental Table S3).
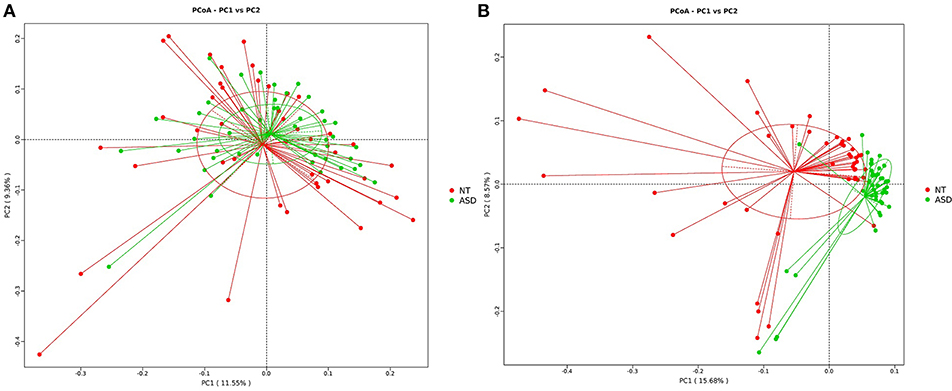
Figure 2. PCoA of bacterial beta diversity based on (A) Bray-Curtis dissimilarity (B) unweighted UniFrac distances. Subjects with ASD and NT subjects are colored in green and red, respectively. ASD, autism spectrum disorders; NT, neurotypical.
Differences of Microbiota Comparison Between ASD and Healthy Children
The analysis of the microbial composition of the ASD and control groups at the phylum level (Supplemental Table S4 and Supplemental Figure S1) showed that four phyla, including Firmicutes, Bacteroidetes, Actinobacteria, and Proteobacteria, made up the main part of the gut microbiota. However, we observed no significant difference in terms of the microbial composition at the phylum level between the two groups. The ratio of Firmicutes/Bacteroidetes was also not significantly different between the ASD and healthy children (1.39 vs. 1.82, P = 0.108). FDR-adjusted differences at the family level did not reach statistical significance except for Acidaminococcaceae (0.44 and 0.16% for healthy controls and ASD children, respectively; PFDR = 0.029; Table 2). No significant group difference was found in the relative abundance of microbiota at the class and order level (Supplemental Tables S5, S6).
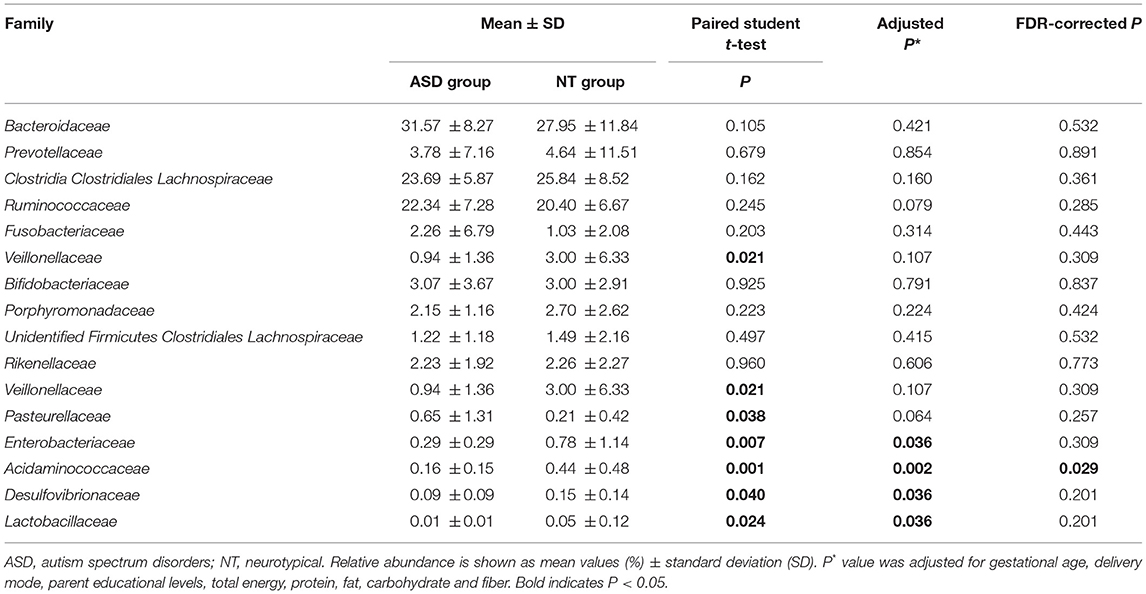
Table 2. Relative abundance of top 10 abundant families detected in NT and ASD groups and family presenting significant difference between NT and ASD groups.
At the genera level, Bacteroides constituted the most abundant genus in both the ASD and healthy control groups, but with no significant difference between the two groups (31.59 vs. 27.98%, PFDR = 0.600; Table 3 and Supplemental Figure S2). Compared to the neurotypical controls after adjustment for covariates and multiple comparison correction, Lachnoclostridium (3.55 vs. 2.25%, PFDR = 0.005), Tyzzerella subgroup 4 (0.50 vs. 0.03%, PFDR = 0.002), Flavonifractor (0.16 vs. 0.08%, PFDR = 0.002) and unidentified Lachnospiraceae (0.13 vs. 0.06%, PFDR = 0.002) were less abundant in the ASD group (Table 3). At the species level, Clostridium clostridioforme was more abundant in the ASD group (0.10 vs. 0.22%, PFDR = 0.005; Supplemental Table S7).
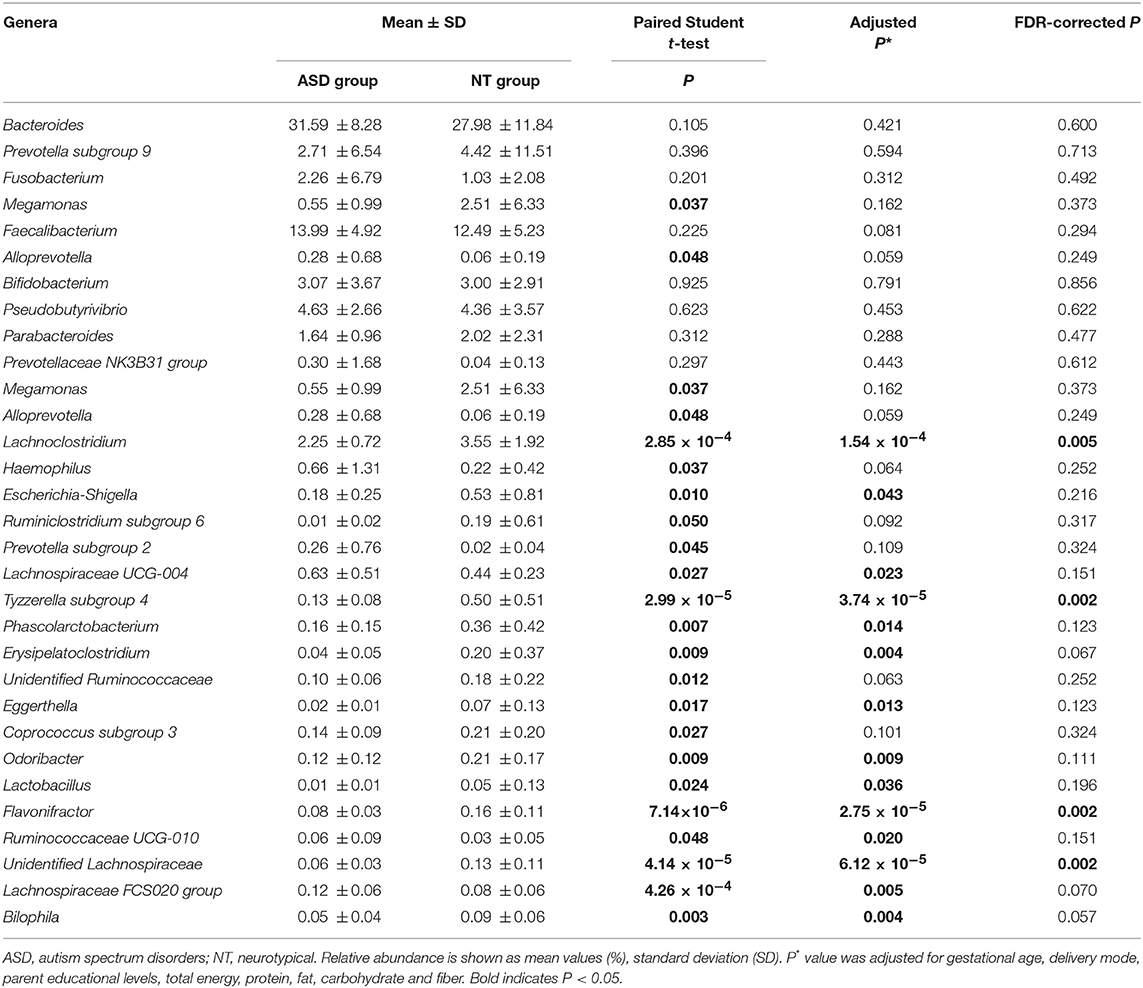
Table 3. Relative abundance of top 10 abundant genera detected in NT and ASD groups and genera presenting significant difference between NT and ASD groups.
Functional Capability Analysis
The overall functional structure of ASD group was dominated by 20 functions, such as Cellular processes and signaling, Metabolism, and Carbohydrate metabolism, while the neurotypical group was dominated by the other 15 functions (Figure 3). However, no significant functional differences were found between groups after FDR correction (Supplemental Table S8).
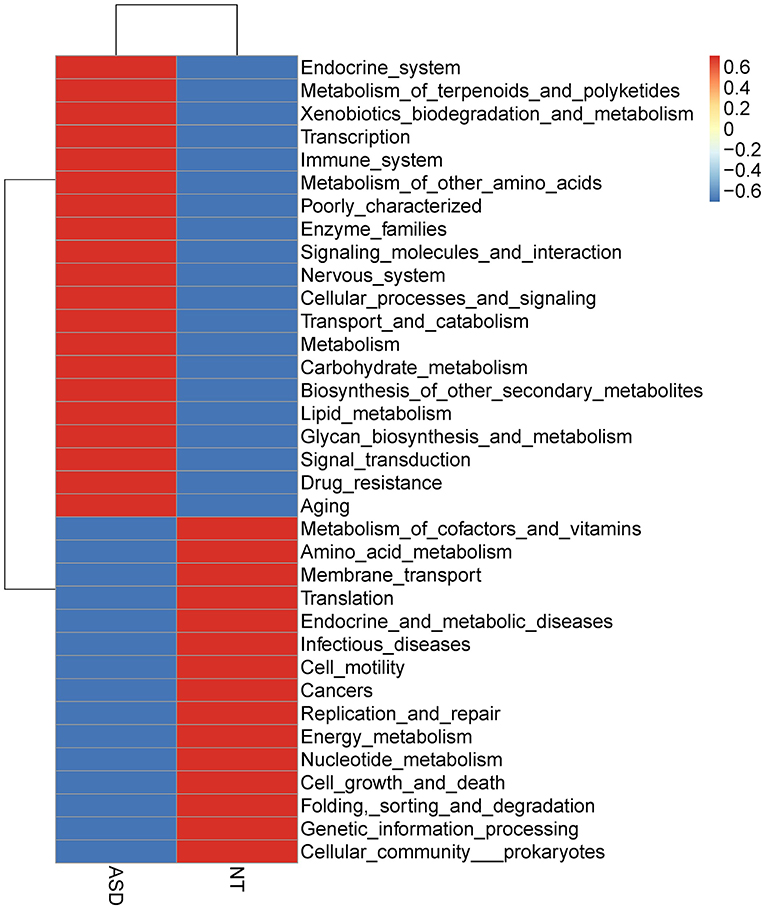
Figure 3. Heatmap based on mean abundances of level 2 KEGG pathways between ASD and NT groups. ASD, autism spectrum disorders; NT, neurotypical.
Discussion
Based on the 16S rRNA data from 45 autistic cases and 45 sex- and age-matched controls, we describe the differences in the gut microbiota features in Chinese children. The children with ASD displayed a less diverse gut microbiome than the neurotypical controls. Children with ASD exhibited a lower relative abundance of Acidaminococcaceae than the healthy controls at the family level. A decrease in the relative abundance of genera Lachnoclostridium, Tyzzerella subgroup 4, Flavonifractor, and unidentified Lachnospiraceae was also found in the ASD group than in the neurotypical children.
Diversity of Microbiota
In our data, the analysis of beta diversity revealed a different microbiota profile between the two groups, indicating an altered microbial community structure in the ASD group. This result was supported by previous studies (Finegold et al., 2010; De Angelis et al., 2013; Strati et al., 2017; Kang et al., 2018; Liu et al., 2019). The decreased gut microbial diversity in children with ASD was concordant with studies by Kang et al. (2013, 2018) and Liu et al. (2019). In contrast, Son et al. found no visible changes in the diversity and richness of gut microbiota in the stools of subjects with ASD and neurotypical sibling controls (Son et al., 2015). Finegold et al. and Angelis et al. found greater microbial diversity in subjects with ASD than in controls (Finegold et al., 2010; De Angelis et al., 2013). In comparison with the previous studies, the case-control subjects in our research had similar lifestyle characteristics and were matched for sex and age in a narrow age range. In addition, this design had a relatively larger sample size than most of the previous reports which usually involved fewer than 25 participants in each group (Finegold et al., 2010; Wang et al., 2011; Williams et al., 2011; Kang et al., 2013, 2018; De Angelis et al., 2015; Tomova et al., 2015; Rose et al., 2018), thus could provide more robust conclusions. Furthermore, differences in the diagnosis criteria (e.g., the Autism Diagnostic Observation Schedule, the Autism Diagnostic Interview-Revised or the CARS), the methods used to investigate the subject samples (16S rRNA, qPCR, or culture), genetic and/or dietary background, and autism severity (Desbonnet et al., 2014; Wang et al., 2014) might be other potential reasons for the study heterogeneity.
Autism-Associated Changes in Gut Microflora at Different Levels
Consistent with Kang et al. (2013), we found no significant difference in the relative abundance of microbiota on the level of phylum between the ASD and neurotypical groups. However, previous studies have shown changes in the relative abundance of phylotypes, such as Firmicutes, Bacteroidetes, Proteobacteria, and Actinobacteria (Williams et al., 2011; De Angelis et al., 2015; Tomova et al., 2015; Strati et al., 2017; Liu et al., 2019). In addition, some studies have previously reported a shift toward a lower proportion of Bacteroidetes and a higher level of Firmicutes for fecal samples of ASD children (Williams et al., 2011; Tomova et al., 2015; Strati et al., 2017). Angelis et al., in contrast, found the opposite result (De Angelis et al., 2015). Family level analysis in our data showed a significant reduction of Acidaminococcaceae in the fecal samples of ASD subjects compared to the healthy controls, which had not been reported previously.
Comparing the microbial taxa at the genus level between the ASD and healthy groups, Flavonifractor (family Ruminococcaceae), Lachnoclostridium, Tyzzerella subgroup 4, and unidentified Lachnospiraceae (family Lachnospiraceae) were significantly lower in children with ASD in the present study. Liu et al. also found a signifcant decrease of Lachnospiraceae NC2004 group (family Lachnospiraceae) in ASD group (Liu et al., 2019). In contrast, based on 21 autistic and 7 typically developing samples with GI symptoms, Rose et al. found that children with ASD showed more Lachnospiraceae than typically developing groups (Rose et al., 2018). De Angelis et al. demonstrated that members in the Lachnospiraceae family either increased or decreased in children with ASD compared to healthy controls (De Angelis et al., 2013). Increasing evidence from animal studies supports the hypothesis that intestinal microbiota have evolved to exert a marked influence on the central nervous system function via inflammation, and the hypothalamic–pituitary–adrenal axis, by affecting neurotransmission. Inflammatory activity, assessed by proinflammatory cytokines, such as tumor necrosis factor alpha, interleukin 1β, and interleukin 8, were enhanced in children with ASD (Tonhajzerova et al., 2015). Members of the Lachnospiraceae and Ruminococcaceae family are butyrate producers (Meehan and Beiko, 2014). Butyrate production in the human gut is highly relevant because it promotes Treg cell differentiation, which can ultimately suppress proinflammatory responses (Singh et al., 2014). A recent study using a mice model with inflammatory bowel disease showed that butyrate can protect the integrity of intestinal epithelial barrier, which can reduce the inflammatory response in inflammatory bowel disease such as Crohn's disease (Chen et al., 2018). In addition, butyrate can regulate synthesis of the neurotransmitters dopamine by altering expression of the tyrosine hydroxylase gene (Decastro et al., 2005). However, we found that apart from Lachnoclostridium genus, all other significant differences were related to very low-abundant genera (0.08–0.16%). The cross-sectional nature of the study did not enable us to understand the mechanisms and time sequence of the associations. New studies that incorporate repeated, prospectively collected fecal samples will be important to elucidate whether those bacteria with low abundance could really result from or have an influence on the disease in ASD patients.
A recent systematic review demonstrated an interrelation between Clostridium bacteria colonization of the intestinal tract and autism (Argou-Cardozo and Zeidan-Chulia, 2018). The species belonging to the Clostridium have been shown to produce exotoxins (Stiles et al., 2014) and p-cresol, cause higher propionic acid levels (Larroya-Garc et al., 2018), and promote conditions that favor inflammation that may exacerbate autistic symptoms (Shen, 2012). It may also interacts with beneficial bacteria such as Bifidobacterium to play a role in the pathogenesis of ASD (Larroya-Garc et al., 2018). We also observed that Clostridium clostridioforme, affiliated to Clostridium genera, was higher in the ASD group than in healthy children. Nevertheless, possible neurotoxic effects of bacterial metabolites require further research to assess their exact effect and how they can be altered. Data from India (Pulikkan et al., 2018), Slovakia (Tomova et al., 2015) and the United States (Adams et al., 2011) revealed a significantly high richness of genus Lactobacillus in children with ASD. Kang et al. (2013, 2018) and De Angelis et al. (2013) suggested an enrichment of the genus Prevotella in healthy subjects compared to autistic samples. However, in this study, we did not detect any significant differences of these bacteria between autistic and healthy children. Potential issues connected to mis-classification at species-level using 16S rRNA gene method could not be excluded in the present study.
In our data, substantial covariate information collection was allowed for adjustment of potential confounders in the analysis of group differences at different levels of microbiome whereas most of the previous used univariate analysis to draw conclusion (Finegold et al., 2010; Adams et al., 2011; Wang et al., 2011, 2013; Williams et al., 2011; De Angelis et al., 2013; Tomova et al., 2015; Strati et al., 2017; Kang et al., 2018; Pulikkan et al., 2018; Zhang et al., 2018; Liu et al., 2019). We also applied the FDR to correct multiple comparisons which has not been considered in some of the previous studies (Finegold et al., 2010; Wang et al., 2011, 2013; Williams et al., 2011; De Angelis et al., 2013). Therefore, covariates adjustment and inadequate statistical control for testing multiple hypotheses might also provide possible explanations for the different findings at each level of bacteria across studies in addition to the potential reasons mentioned above (Desbonnet et al., 2014; Wang et al., 2014).
No significant functional differences were found between groups after FDR correction, which was consistent with Kang et al. using the PICRUSt to estimate metabolic function (Kang et al., 2018). Rose et al. reported that the pathways correlated to the two components system were under-represented in ASD children compared with healthy controls (Rose et al., 2018). However, the functional differences based on 16S rRNA gene method relies on an open but incomplete reference genome database, thus predictions should be interpreted with caution (Langille et al., 2013; Asshauer et al., 2015). Future studies with microbial metagenomic sequencing analysis should be carried out to obtain information about the functional diversity of the bacterial community.
Conclusions
In conclusion, we found that children with ASD had lower quantities of Acidaminococcaceae, genera Flavonifractor, Lachnoclostridium, Tyzzerella subgroup 4, and unidentified Lachnospiraceae and an elevated proportion of Clostridium clostridioforme compared to neurotypical controls.
Data Availability
The datasets for this manuscript are not publicly available because of limitations due to participant consent. Requests to access the datasets should be directed to Jin Jing, amluZ2ppbkBtYWlsLnN5c3UuZWR1LmNu.
Ethics Statement
The Ethical Committee of the School of Public Health, Sun Yat-sen University approved this study (NO.2018047). The study was performed in accordance with ethical principles in the Declaration of Helsinki, including that the subjects were volunteers and that them and their legally authorized representatives were adequately informed of the aims, methods, the anticipated benefits and the potential risks of the study and the discomfort it might entail. All subjects were informed of the sources of funding and the possible conflicts of interest and the institutional affiliations of the researchers. Every precaution was taken in order to grant the privacy of the research subjects (World Medical Association, 2013). The parents or guardians of all subjects provided their written informed consent before the study.
Author Contributions
JJ and ZZ conceived the study and designed the experiments. JJL, MD, and JW recruited subjects and collected specimens. BM and JYL performed the experiments and analyzed the data. BM and JJL wrote the manuscript. JJ and ZZ revised the manuscript. All the authors critically reviewed and approved the manuscript.
Funding
This project was supported by National Natural Science Foundation of China (Grant No.81502798); Natural Science Foundation of Guangdong Province, China (Grant No.2015A030310399); Maternal and Children Nutrition and Care Fund of Biostime (Grant No.BINCMYF15006); and Guangzhou Yineng Biological Technology Co., Ltd. (Grant No.5100071020325). The funding supported us to recruit the participants, carry out the assessments for the participants and collect data. The funding (Grant No.5100071020325) also supported us in paying for open access publication fees.
Conflict of Interest Statement
The authors declare that the research was conducted in the absence of any commercial or financial relationships that could be construed as a potential conflict of interest.
Acknowledgments
This research was conducted through the Center for Child and Adolescent Psychology and Behavioral Development of Sun Yat-sen University. We would like to acknowledge the contributions of the parents and the children who participated in this study, and the clinician who were proficient in the assessments and provided diagnosis.
Supplementary Material
The Supplementary Material for this article can be found online at: https://www.frontiersin.org/articles/10.3389/fcimb.2019.00040/full#supplementary-material
Abbreviations
ASD, Autism Spectrum Disorder; NT, neurotypical; 16S rRNA, 16S ribosomal RNA; GI, gastrointestinal; DMS-5, Diagnostic and Statistical Manual of Mental Disorders, 5th Edition; CARS, Childhood Autism Rating Scale; OTUs, operational taxonomic units; ACE, abundance-based coverage estimator; PD, phylogenetic diversity; PCoA, principal coordinates analysis; PERMANOVA, permutational multivariate analysis of variance; FDR; false discovery rate.
References
Adams, J. B., Johansen, L. J., Powell, L. D., Quig, D., and Rubin, R. A. (2011). Gastrointestinal flora and gastrointestinal status in children with autism–comparisons to typical children and correlation with autism severity. BMC Gastroenterol. 11:22. doi: 10.1186/1471-230X-11-22
American Psychiatric Association (2013). Diagnostic and Statistical Manual of Mental Disorders (DSM-5). Washington, DC: American Psychiatric Pub.
Arentsen, T., Raith, H., Qian, Y., Forssberg, H., and Diaz, H. R. (2015). Host microbiota modulates development of social preference in mice. Microb. Ecol. Health Dis. 26:29719. doi: 10.3402/mehd.v26.29719
Argou-Cardozo, I., and Zeidan-Chulia, F. (2018). Clostridium bacteria and autism spectrum conditions: a systematic review and hypothetical contribution of environmental glyphosate levels. Med. Sci. 6:29. doi: 10.3390/medsci6020029
Asshauer, K. P., Wemheuer, B., Daniel, R., and Meinicke, P. (2015). Tax4Fun: predicting functional profiles from metagenomic 16S rRNA data. Bioinformatics 31, 2882–2884. doi: 10.1093/bioinformatics/btv287
Benjamini, Y., and Hochberg, Y. (1995). Controlling the false discovery rate: a practical and powerful approach to multiple testing. J. R. Statist. Soc. Ser. B 1, 289–300. doi: 10.1111/j.2517-6161.1995.tb02031.x
Buie, T., Campbell, D. B., Fuchs, G. J. R., Furuta, G. T., Levy, J., Vandewater, J., et al. (2010). Evaluation, diagnosis, and treatment of gastrointestinal disorders in individuals with ASDs: a consensus report. Pediatrics 125(Suppl. 1), S1–18. doi: 10.1542/peds.2009-1878C
Caporaso, J. G., Kuczynski, J., Stombaugh, J., Bittinger, K., Bushman, F. D., Costello, E. K., et al. (2010). QIIME allows analysis of high-throughput community sequencing data. Nat. Methods 7, 335–336. doi: 10.1038/nmeth.f.303
Chen, G., Ran, X., Li, B., Li, Y., He, D., Huang, B., et al. (2018). Sodium butyrate inhibits inflammation and maintains epithelium barrier integrity in a TNBS-induced inflammatory bowel disease mice model. EBioMedicine 30, 317–325. doi: 10.1016/j.ebiom.2018.03.030
Chong, C. W., Ahmad, A. F., Lim, Y. A., Teh, C. S., Yap, I. K., Lee, S. C., et al. (2015). Effect of ethnicity and socioeconomic variation to the gut microbiota composition among pre-adolescent in Malaysia. Sci. Rep. 5:13338. doi: 10.1038/srep13338
Colvert, E., Tick, B., Mcewen, F., Stewart, C., Curran, S. R., Woodhouse, E., et al. (2015). Heritability of autism spectrum disorder in a UK population-based twin sample. JAMA Psychiatry 72, 415–423. doi: 10.1001/jamapsychiatry.2014.3028
De Angelis, M., Francavilla, R., Piccolo, M., De Giacomo, A., and Gobbetti, M. (2015). Autism spectrum disorders and intestinal microbiota. Gut Microbes 6, 207–213. doi: 10.1080/19490976.2015.1035855
De Angelis, M., Piccolo, M., Vannini, L., Siragusa, S., De Giacomo, A., Serrazzanetti, D. I., et al. (2013). Fecal microbiota and metabolome of children with autism and pervasive developmental disorder not otherwise specified. PLoS ONE 8:e76993. doi: 10.1371/journal.pone.0076993
Decastro, M., Nankova, B. B., Shah, P., Patel, P., Mally, P. V., Mishra, R., et al. (2005). Short chain fatty acids regulate tyrosine hydroxylase gene expression through a cAMP-dependent signaling pathway. Brain Res. Mol. Brain Res. 142, 28–38. doi: 10.1016/j.molbrainres.2005.09.002
Desbonnet, L., Clarke, G., Shanahan, F., Dinan, T. G., and Cryan, J. F. (2014). Microbiota is essential for social development in the mouse. Mol. Psychiatry 19, 146–148. doi: 10.1038/mp.2013.65
Ding, H. T., Taur, Y., and Walkup, J. T. (2017). Gut microbiota and autism: key concepts and findings. J. Autism Dev. Disord. 47, 480–489. doi: 10.1007/s10803-016-2960-9
Edgar, R. C. (2004). MUSCLE: multiple sequence alignment with high accuracy and high throughput. Nucleic Acids Res. 32, 1792–1797. doi: 10.1093/nar/gkh340
Edgar, R. C. (2013). UPARSE: highly accurate OTU sequences from microbial amplicon reads. Nat. Methods 10, 996–998. doi: 10.1038/nmeth.2604
Edgar, R. C., Haas, B. J., Clemente, J. C., Quince, C., and Knight, R. (2011). UCHIME improves sensitivity and speed of chimera detection. Bioinformatics 27, 2194–2200. doi: 10.1093/bioinformatics/btr381
Finegold, S. M., Dowd, S. E., Gontcharova, V., Liu, C., Henley, K. E., Wolcott, R. D., et al. (2010). Pyrosequencing study of fecal microflora of autistic and control children. Anaerobe 16, 444–453. doi: 10.1016/j.anaerobe.2010.06.008
Gondalia, S. V., Palombo, E. A., Knowles, S. R., Cox, S. B., Meyer, D., and Austin, D. W. (2012). Molecular characterisation of gastrointestinal microbiota of children with autism (with and without gastrointestinal dysfunction) and their neurotypical siblings. Autism Res. 5, 419–427. doi: 10.1002/aur.1253
Gupta, V. K., Paul, S., and Dutta, C. (2017). Geography, ethnicity or subsistence-specific variations in human microbiome composition and diversity. Front. Microbiol. 8:1162. doi: 10.3389/fmicb.2017.01162
Hsiao, E. Y., Mcbride, S. W., Hsien, S., Sharon, G., Hyde, E. R., Mccue, T., et al. (2013). Microbiota modulate behavioral and physiological abnormalities associated with neurodevelopmental disorders. Cell 155, 1451–1463. doi: 10.1016/j.cell.2013.11.024
Kang, D. W., Ilhan, Z. E., Isern, N. G., Hoyt, D. W., Howsmon, D. P., Shaffer, M., et al. (2018). Differences in fecal microbial metabolites and microbiota of children with autism spectrum disorders. Anaerobe 49, 121–131. doi: 10.1016/j.anaerobe.2017.12.007
Kang, D. W., Park, J. G., Ilhan, Z. E., Wallstrom, G., Labaer, J., Adams, J. B., et al. (2013). Reduced incidence of Prevotella and other fermenters in intestinal microflora of autistic children. PLoS ONE 8:e68322. doi: 10.1371/journal.pone.0068322
Kraneveld, A. D., Szklany, K., De Theije, C. G., and Garssen, J. (2016). Gut-to-brain axis in autism spectrum disorders: central role for the microbiome. Int. Rev. Neurobiol. 131, 263–287. doi: 10.1016/bs.irn.2016.09.001
Langille, M. G., Zaneveld, J., Caporaso, J. G., Mcdonald, D., Knights, D., Reyes, J. A., et al. (2013). Predictive functional profiling of microbial communities using 16S rRNA marker gene sequences. Nat. Biotechnol. 31, 814–821. doi: 10.1038/nbt.2676
Larroya-Garc, A., Navas-Carrillo, D., and Orenes-Pinero, E. (2018). Impact of gut microbiota on neurological diseases: diet composition and novel treatments. Crit. Rev. Food Sci. Nutr. doi: 10.1080/10408398.2018.1484340. [Epub ahead of print].
Liu, S., Li, E., Sun, Z., Fu, D., Duan, G., Jiang, M., et al. (2019). Altered gut microbiota and short chain fatty acids in Chinese children with autism spectrum disorder. Sci. Rep. 9:287. doi: 10.1038/s41598-018-36430-z
Magoc, T., and Salzberg, S. L. (2011). FLASH: fast length adjustment of short reads to improve genome assemblies. Bioinformatics 27, 2957–2963. doi: 10.1093/bioinformatics/btr507
Martirosian, G., Ekiel, A., Aptekorz, M., Wiechula, B., Kazek, B., Jankowska-Steifer, E., et al. (2011). Fecal lactoferrin and Clostridium spp. in stools of autistic children. Anaerobe 17, 43–45. doi: 10.1016/j.anaerobe.2010.12.003
Mayer, E. A., Padua, D., and Tillisch, K. (2014). Altered brain-gut axis in autism: comorbidity or causative mechanisms? Bioessays 36, 933–939. doi: 10.1002/bies.201400075
Mcelhanon, B. O., Mccracken, C., Karpen, S., and Sharp, W. G. (2014). Gastrointestinal symptoms in autism spectrum disorder: a meta-analysis. Pediatrics 133, 872–883. doi: 10.1542/peds.2013-3995
Meehan, C. J., and Beiko, R. G. (2014). A phylogenomic view of ecological specialization in the Lachnospiraceae, a family of digestive tract-associated bacteria. Genome Biol. Evol. 6, 703–713. doi: 10.1093/gbe/evu050
Oksanen, J., Blanchet, F. G., Kindt, R., Legendre, P., Minchin, P. R., O'hara, B., et al. (2013). Vegan: Community Ecology. Available online at: https://cran.r-project.org/web/packages/vegan/index.html
Pulikkan, J., Maji, A., Dhakan, D. B., Saxena, R., Mohan, B., Anto, M. M., et al. (2018). Gut microbial dysbiosis in indian children with autism spectrum disorders. Microb. Ecol. 76, 1102–1114. doi: 10.1007/s00248-018-1176-2
Quast, C., Pruesse, E., Yilmaz, P., Gerken, J., Schweer, T., Yarza, P., et al. (2013). The SILVA ribosomal RNA gene database project: improved data processing and web-based tools. Nucleic Acids Res. 41, D590–596. doi: 10.1093/nar/gks1219
Rose, D. R., Yang, H., Serena, G., Sturgeon, C., Ma, B., Careaga, M., et al. (2018). Differential immune responses and microbiota profiles in children with autism spectrum disorders and co-morbid gastrointestinal symptoms. Brain Behav. Immun. 70, 354–368. doi: 10.1016/j.bbi.2018.03.025
Sampson, T. R., and Mazmanian, S. K. (2015). Control of brain development, function, and behavior by the microbiome. Cell Host Microbe 17, 565–576. doi: 10.1016/j.chom.2015.04.011
Schopler, E., Reichler, R. J., Devellis, R. F., and Daly, K. (1980). Toward objective classification of childhood autism: childhood autism rating scale (CARS). J. Autism Dev. Disord. 10, 91–103. doi: 10.1007/BF02408436
Sharon, G., Sampson, T. R., Geschwind, D. H., and Mazmanian, S. K. (2016). The central nervous system and the gut microbiome. Cell 167, 915–932. doi: 10.1016/j.cell.2016.10.027
Shen, A. (2012). Clostridium difficile toxins: mediators of inflammation. J. Innate Immun. 4, 149–158. doi: 10.1159/000332946
Singh, N., Gurav, A., Sivaprakasam, S., Brady, E., Padia, R., Shi, H., et al. (2014). Activation of Gpr109a, receptor for niacin and the commensal metabolite butyrate, suppresses colonic inflammation and carcinogenesis. Immunity 40, 128–139. doi: 10.1016/j.immuni.2013.12.007
Son, J. S., Zheng, L. J., Rowehl, L. M., Tian, X., Zhang, Y., Zhu, W., et al. (2015). Comparison of fecal microbiota in children with autism spectrum disorders and neurotypical siblings in the simons simplex collection. PLoS ONE 10:e0137725. doi: 10.1371/journal.pone.0137725
Stiles, B. G., Pradhan, K., Fleming, J. M., Samy, R. P., Barth, H., and Popoff, M. R. (2014). Clostridium and bacillus binary enterotoxins: bad for the bowels, and eukaryotic being. Toxins (Basel). 6, 2626–2656. doi: 10.3390/toxins6092626
Strati, F., Cavalieri, D., Albanese, D., De Felice, C., Donati, C., Hayek, J., et al. (2017). New evidences on the altered gut microbiota in autism spectrum disorders. Microbiome 5:24. doi: 10.1186/s40168-017-0242-1
Tomova, A., Husarova, V., Lakatosova, S., Bakos, J., Vlkova, B., Babinska, K., et al. (2015). Gastrointestinal microbiota in children with autism in Slovakia. Physiol. Behav. 138, 179–187. doi: 10.1016/j.physbeh.2014.10.033
Tonhajzerova, I., Ondrejka, I., Mestanik, M., Mikolka, P., Hrtanek, I., Mestanikova, A., et al. (2015). Inflammatory activity in autism spectrum disorder. Adv. Exp. Med. Biol. 861, 93–98. doi: 10.1007/5584_2015_145
Wang, L., Christophersen, C. T., Sorich, M. J., Gerber, J. P., Angley, M. T., and Conlon, M. A. (2011). Low relative abundances of the mucolytic bacterium Akkermansia muciniphila and Bifidobacterium spp. in feces of children with autism. Appl. Environ. Microbiol. 77, 6718–6721. doi: 10.1128/AEM.05212-11
Wang, L., Christophersen, C. T., Sorich, M. J., Gerber, J. P., Angley, M. T., and Conlon, M. A. (2013). Increased abundance of Sutterella spp. and Ruminococcus torques in feces of children with autism spectrum disorder. Mol. Autism 4, 42. doi: 10.1186/2040-2392-4-42
Wang, L., Conlon, M. A., Christophersen, C. T., Sorich, M. J., and Angley, M. T. (2014). Gastrointestinal microbiota and metabolite biomarkers in children with autism spectrum disorders. Biomark. Med. 8, 331–344. doi: 10.2217/bmm.14.12
Willett, W. C., Howe, G. R., and Kushi, L. H. (1997). Adjustment for total energy intake in epidemiologic studies. Am. J. Clin. Nutr. 65, 1220S−1228S. discussion: 1229S−1231S. doi: 10.1093/ajcn/65.4.1220S
Williams, B. L., Hornig, M., Buie, T., Bauman, M. L., Cho, P. M., Wick, I., et al. (2011). Impaired carbohydrate digestion and transport and mucosal dysbiosis in the intestines of children with autism and gastrointestinal disturbances. PLoS ONE 6:e24585. doi: 10.1371/journal.pone.0024585
World Medical Association (2013). World Medical Association Declaration of Helsinki: ethical principles for medical research involving human subjects. JAMA 310, 2191–2194. doi: 10.1001/jama.2013.281053
Xiao, J., Chen, H., Kang, D., Shao, Y., Shen, B., Li, X., et al. (2016). Qualitatively and quantitatively investigating the regulation of intestinal microbiota on the metabolism of panax notoginseng saponins. J. Ethnopharmacol. 194, 324–336. doi: 10.1016/j.jep.2016.09.027
Yang, Y. X., Wang, G. X., and Pan, X. C. (2009). China Food Composition, 2nd Edn. Beijing: Peking University Medical Press.
Yatsunenko, T., Rey, F. E., Manary, M. J., Trehan, I., Dominguez-Bello, M. G., Contreras, M., et al. (2012). Human gut microbiome viewed across age and geography. Nature 486, 222–227. doi: 10.1038/nature11053
Zhang, C. X., and Ho, S. C. (2009). Validity and reproducibility of a food frequency Questionnaire among Chinese women in Guangdong province. Asia Pac. J. Clin. Nutr. 18, 240–250. doi: 10.6133/apjcn.2009.18.2.13
Keywords: autism spectrum disorder, gut microbiota, 16S rRNA, Chinese children, case control
Citation: Ma B, Liang J, Dai M, Wang J, Luo J, Zhang Z and Jing J (2019) Altered Gut Microbiota in Chinese Children With Autism Spectrum Disorders. Front. Cell. Infect. Microbiol. 9:40. doi: 10.3389/fcimb.2019.00040
Received: 08 November 2018; Accepted: 07 February 2019;
Published: 06 March 2019.
Edited by:
Frederic Antonio Carvalho, INSERM U1107 Douleur et Biophysique Neurosensorielle (Neuro-Dol), FranceReviewed by:
Andreas Martin Grabrucker, University of Limerick, IrelandYuichiro Yamashiro, Juntendo University, Japan
Marco Severgnini, Istituto di Tecnologie Biomediche (CNR), Italy
Copyright © 2019 Ma, Liang, Dai, Wang, Luo, Zhang and Jing. This is an open-access article distributed under the terms of the Creative Commons Attribution License (CC BY). The use, distribution or reproduction in other forums is permitted, provided the original author(s) and the copyright owner(s) are credited and that the original publication in this journal is cited, in accordance with accepted academic practice. No use, distribution or reproduction is permitted which does not comply with these terms.
*Correspondence: Zheqing Zhang, enpxYWE1MDFAc211LmVkdS5jbg==
Jin Jing, amluZ2ppbkBtYWlsLnN5c3UuZWR1LmNu
†These authors have contributed equally to this work