 Ahmed Abdel-Razik1*
 Walaa Shabana1Ahmed Mohamed El Nakib1
 Mostafa Abdelsalam2Ahmed Abdelwahab2Ahmad S. Hasan3Rasha Elzehery3Rania Elhelaly3Aya Ahmed Fathy4Sally Abdallah Mostafa5Niveen El-Wakeel6Dalia Moemen6Waleed Eldars6
 Ahmed H. Yassen1
- 1Tropical Medicine Department, Faculty of Medicine, Mansoura University, Mansoura City, Egypt
- 2Nephrology and Dialysis Unit, Internal Medicine Department, Faculty of Medicine, Mansoura University, Mansoura City, Egypt
- 3Clinical Pathology Department, Faculty of Medicine, Mansoura University, Mansoura City, Egypt
- 4Public Health and Community Department, Faculty of Medicine, Mansoura University, Mansoura City, Egypt
- 5Medical Biochemistry and Molecular Biology Department, Faculty of Medicine, Mansoura University, Mansoura City, Egypt
- 6Medical Microbiology and Immunology Department, Faculty of Medicine, Mansoura University, Mansoura City, Egypt
Background and Purpose: The advanced glycation end products (AGEs) have been implicated in different diseases’ pathogenesis, but their role in hepatocellular carcinoma (HCC) is still a matter of debate. This study aims to investigate the association of AGEs with HCC development in patients with hepatitis C-related cirrhosis.
Methods: Only 153 of the 181 non-diabetic patients with cirrhosis were consecutively involved in this pilot cohort prospective study, along with 34 healthy control participants. Demographic characteristics, biochemical parameters, clinical data, and AGEs levels in all subjects at the starting point and every year after that for two years were assessed. Multivariable Cox regression analysis was used to settle variables that could predict HCC development within this period.
Results: HCC developed in 13 (8.5%) patients. Univariate Cox regression analysis reported that body mass index (P=0.013), homeostatic model assessment-insulin resistance (P=0.006), alpha-fetoprotein (P <0.001), and AGEs levels (P <0.001) were related to HCC development. After adjusting multiple confounders, the multivariable Cox regression model has revealed that AFP and AGEs were the powerful parameters related to the HCC occurrence (all P<0.05). AGEs at a cutoff value of more than 79.6 ng/ml had 100% sensitivity, 96.4% specificity, and 0.999 area under the curve (all P<0.001), using the receiver operating characteristic curve, for prediction of HCC development.
Conclusion: This work suggests that AGEs are associated with an increased incidence of HCC, particularly in cirrhosis, which is encouraging in decreasing the risk of HCC in these patients.
Introduction
Chronic hepatitis C virus (HCV) infection is a crucial factor in the etiology of hepatic fibrosis. HCV is a major environmental problem and the leading cause of chronic liver injury and neoplastic transformation. It is one of the most frequently stated problems with liver cancer and cirrhosis (Perz et al., 2006).
Hepatocellular carcinoma (HCC) is one of the most widespread cancers and causes tumor-related mortality (Colombo and Sangiovanni, 2015). That is why chronic liver disease in many HCC patients results from HCV or hepatitis B virus (HBV) infections (Perz et al., 2006). Since the detailed pathogenetic mechanisms of HCC remain unclear, several studies are investigating new pathways (Ružić et al., 2018).
Advanced glycation end products (AGEs), a heterogeneous cluster of irreversible reactive end products created by oxidation of lipids and proteins, and non-enzymatic glycation, have been embroiled in the pathogenesis of numerous disorders (Marta et al., 2004; Zhou et al., 2004; Hyogo et al., 2007; Piarulli et al., 2013; Abdel-Razik et al., 2020a) because they stimulate the oxidative stress generation and consequently induce inflammation (Yamagishi et al., 2012).
There is accumulating evidence to display that AGEs participate in the pathogenesis of various disorders such as alcoholic liver injury, diabetic vascular complications, Alzheimer’s disease, osteoporosis, non-alcoholic steatohepatitis (NASH), cancer growth, and metastasis (Hyogo and Yamagishi, 2008; Takeuchi and Yamagishi, 2008; Takino et al., 2012; Hayashi et al., 2013; Takeuchi et al., 2015).
As mentioned in the literature, there is a great deal of attention to the role of AGEs in cancer progression and initiation. Several reports have shown that AGEs have an attainable function in cancer invasion, migration, proliferation, and survival in prostate, lung cancer cell lines, and breast (Takino et al., 2010; Rodriguez-Teja et al., 2015; Sharaf et al., 2015). To date, far too little attention is paid to human researches. The higher rate of AGEs accretion is described in cancerous lesions than benign tissues (Palimeri et al., 2015).
These remarks lead us to hypothesize that AGEs could also participate in HCC pathogenesis, particularly in those with cirrhosis. To date, there is almost no evidence associating AGEs with HCC occurrence. This study explores the relationship of AGEs with the development of HCC in patients with hepatitis C-related cirrhosis.
Patients and Methods
This cohort pilot single-center prospective study was accomplished at the Department of Tropical Medicine (Mansoura University-Egypt) between September 2015 and November 2019. We registered 299 consecutive patients with liver cirrhosis examined in our department. Only 181 patients fulfilled the inclusion criteria and were involved in this study. Patients’ hematological, biochemical, clinical, and demographic data were appraised at the starting point and during this study.
Criteria for selecting the subjects were as follows; patients whom 1) aged ≥18 years, and 2) had liver cirrhosis.
The exclusion criteria were 1) liver cirrhosis due to autoimmune hepatitis, HBV, NASH, and cholestatic or metabolic liver diseases, 2) alcoholic liver disease, 3) lactation and pregnancy, 4) hematologic disorders and kidney diseases; 5) pancreatitis, 6) diabetes mellitus, 7) impaired glucose tolerance, 8) smoking, 9) peritoneal carcinomatosis, 10) osteoporosis, 11) abdominal tuberculosis, 12) uncontrolled thyroid disorders, 13) cancers including HCC at baseline 14) bone marrow suppression, 15) collagen vascular diseases, 16) heart failure, 17) Alzheimer’s disease or cerebrovascular accident, 18) immunosuppressive agents administration, 19) missing patient’s data, and 20) usage of anticoagulant or antiplatelet treatment, oral contraceptive drugs, hepatotoxic drugs, and NSAIDs.
The control group involved 34 healthy control subjects who were age- and sex-matched (female/male = 12/22).
The starting point records were gathered within seven days from the time of registration. The end-of-study records were picked up in the last seven days of the first and second follow-up years. By the end of the study, biochemical results, radiological findings, and clinical examination of the patients did not display any troubles that were not documented at the onset of this work affecting the follow-up variables in the subjects’ fitness.
Diagnosis of Liver Cirrhosis and Its Complications
We assessed liver cirrhosis by unequivocal biochemical results, clinical assessment, elastography, histopathological evaluation of hepatic tissue, abdominal ultrasonography (US), or endoscopic findings suggestive of portal hypertension plus stigmata of chronic liver disease (Abdel-Razik et al., 2020b). The severity of cirrhosis was evaluated based on the Model For End-Stage Liver Disease (MELD) scoring system (Kamath et al., 2001) and the Child-Turcotte Pugh (CTP) classification.
Complications of liver cirrhosis were managed according to the standardized therapeutic methods during the study period (Cardenas and Ginès, 2005).
Diagnosis of HCC
In all patients with cirrhosis, alpha-fetoprotein (AFP) and US- which are considered noninvasive diagnostic tools, especially for earlier stages of HCC- were performed every 3-6 months for surveillance purposes. HCC was confirmed if two imaging instances showed a focal hepatic lesion >2 cm in diameter with highlights of arterial hypervascularization or solitary radiologic finding with these highlights conjoined with a serum AFP level of >400 ng/ml (Wang et al., 2015). Management and surveillance of individuals with HCC were achieved according to clinical practice guidelines for hepatocellular carcinoma (Colombo and Sangiovanni, 2015).
Treatment
According to EASL recommendations (EASL, 2015), individuals with CTP-B and CTP-A cirrhosis, either naive patients or treatment-experienced- who had not attained sustained virologic response (SVR) after being treated with pegylated interferon (Peg IFN)/Sofosbuvir (SOF) or with Peg IFN and ribavirin (RBV)- or those treated with RBV/SOF only, were treated based on the study practice.
This study protocol was designed according to EASL guidelines for therapy of HCV, 2015 (EASL, 2015). Patients infected with HCV (genotype IV) received therapy with DCV (60 mg) and SOF (400 mg) once daily for 12 weeks, in addition to RBV daily according to their weight, i.e., 1200 mg for patients weighing ≥75 kg or 1000 mg for patients weighing <75 kg. The dose of RBV was adjusted according to the estimated glomerular filtration rate (eGFR) (El-Khayat et al., 2018). In subjects with contraindications to the use of RBV, the duration of therapy was extended to 24 weeks (EASL, 2015).
Treatment-experienced individuals were retreated with a combination of DCV plus SOF for 24 weeks without RBV or 12 weeks with RBV (EASL, 2015).
Monitoring of Treatment Efficacy
HCV RNA level was assessed at baseline, at the end of therapy (12 or 24 weeks), and 12 weeks after finishing therapy using the Roche COBAS Taq Man HCV assay version 2.0 (detection limit is 15 I.U./mL). Relapse is defined as detectable HCV RNA level during follow-up in a patient with a previously undetected level at the end of the therapy, and virological failure is referred to as nonresponse where HCV RNA levels are still detected at the end of the therapy. The primary virological response was the accomplishment of SVR12, described as the concentration in serum lower than 15 I.U./mL (El-Khayat et al., 2018).
The levels of AGEs were measured at the starting point and 12 weeks after finishing therapy.
Data Collection
Qualified examiners congregated data. To identify these data, they asked the participants to finish a standardized, self-validated questionnaire. These queries have provided us with info about employment, marital status, alcohol consumption, and medical history, particularly malignancy, diabetes, and smoking habits, alongside medication history. Body mass index (BMI) was calculated as weight (kg) divided by the square of height (m2).
Sampling
Fresh venous blood samples (6mL) were collected from all subjects after overnight fasting (4mL with no anticoagulants for serum testing and 2mL on EDTA for hemogram). The mixture was centrifuged for 10 min at 1000-3000 RPM. The serum samples were then divided into aliquots and frozen at −20°C until subsequent estimations.
Methodology
Routine blood tests, including complete blood count (CBC), liver function tests, serum creatinine, serum cholesterol and triglycerides were performed.
Serum AFP was evaluated by chemiluminescent immunometric technique on the Immulite 2000 system (Siemens Medical Solutions Diagnostics, Los Angeles, California, USA). The eGFR was estimated based on the following formula: (Levey et al., 1999). Quantitative assessments of serum AGEs were measured by ELISA kit (MyBioSource, San Diego, CA 92195-3308, USA, Cat No. MBS267540). The homeostasis model assessment (HOMA) method (Matthews et al., 1985) was evaluated as follows: Insulin resistance (HOMA-IR) =
Detection of HCV Genotype IV
Hepatitis C viral RNA was measured in patients’ sera by QIAamp Viral RNA Mini Kit (Qiagen, Hilden, Germany) (Ohno et al., 1997).
Ethics
Mansoura Institutional Review Board reviewed and accepted all procedures in this study protocol. Moreover, all participants gave informed consent before the onset of this study. This work was held according to the Helsinki Declaration’s rules. (Proposal Code: R.20.05.844.1R1).
Statistical Analysis
Data management and analysis were performed using the Social Package of Statistical Science (SPSS) software version 20 (SPSS Inc., Chicago, IL, USA). Quantitative data and non-normally distributed continuous data are designated as mean ± SD and Range or Interquartile range correspondingly. Student t-test, Mann-Whitney U test, and Chi-square test were used for normally distributed data, non-normally distributed continuous data, and categorical data, correspondingly. The relation between AGEs level and other parameters was executed by Spearman’s correlation analysis. At univariate analysis, parameters with a P value less than 0.05 were combined in the multivariable Cox regression analysis. Multivariable and univariate Cox regression models were calculated to reveal the independent factors related to predicting HCC. The area under the curve (AUC) and receiver operating characteristic curve (ROC) were applied, and the best cutoff values were estimated to expect the development of HCC. A two-tailed P value of less than 0.05 was considered significant.
Results
Patient Characteristics
One hundred fifty-three patients joined this study out of the one hundred eighty-one who fulfilled the inclusion criteria and were initially registered. Eighteen out of the involved one hundred eighty-one patients in this study died from complications of cirrhosis, e.g., hepatic encephalopathy (n=4), massive uncontrolled GIT bleeding (n=10), and hepatorenal syndrome (n=4), and we lost ten patients during the follow-up period as displayed in Figure 1. Table 1 provides the results obtained from the preliminary analysis of the enrolled individuals’ clinical, demographic, and biochemical characteristics at baseline.
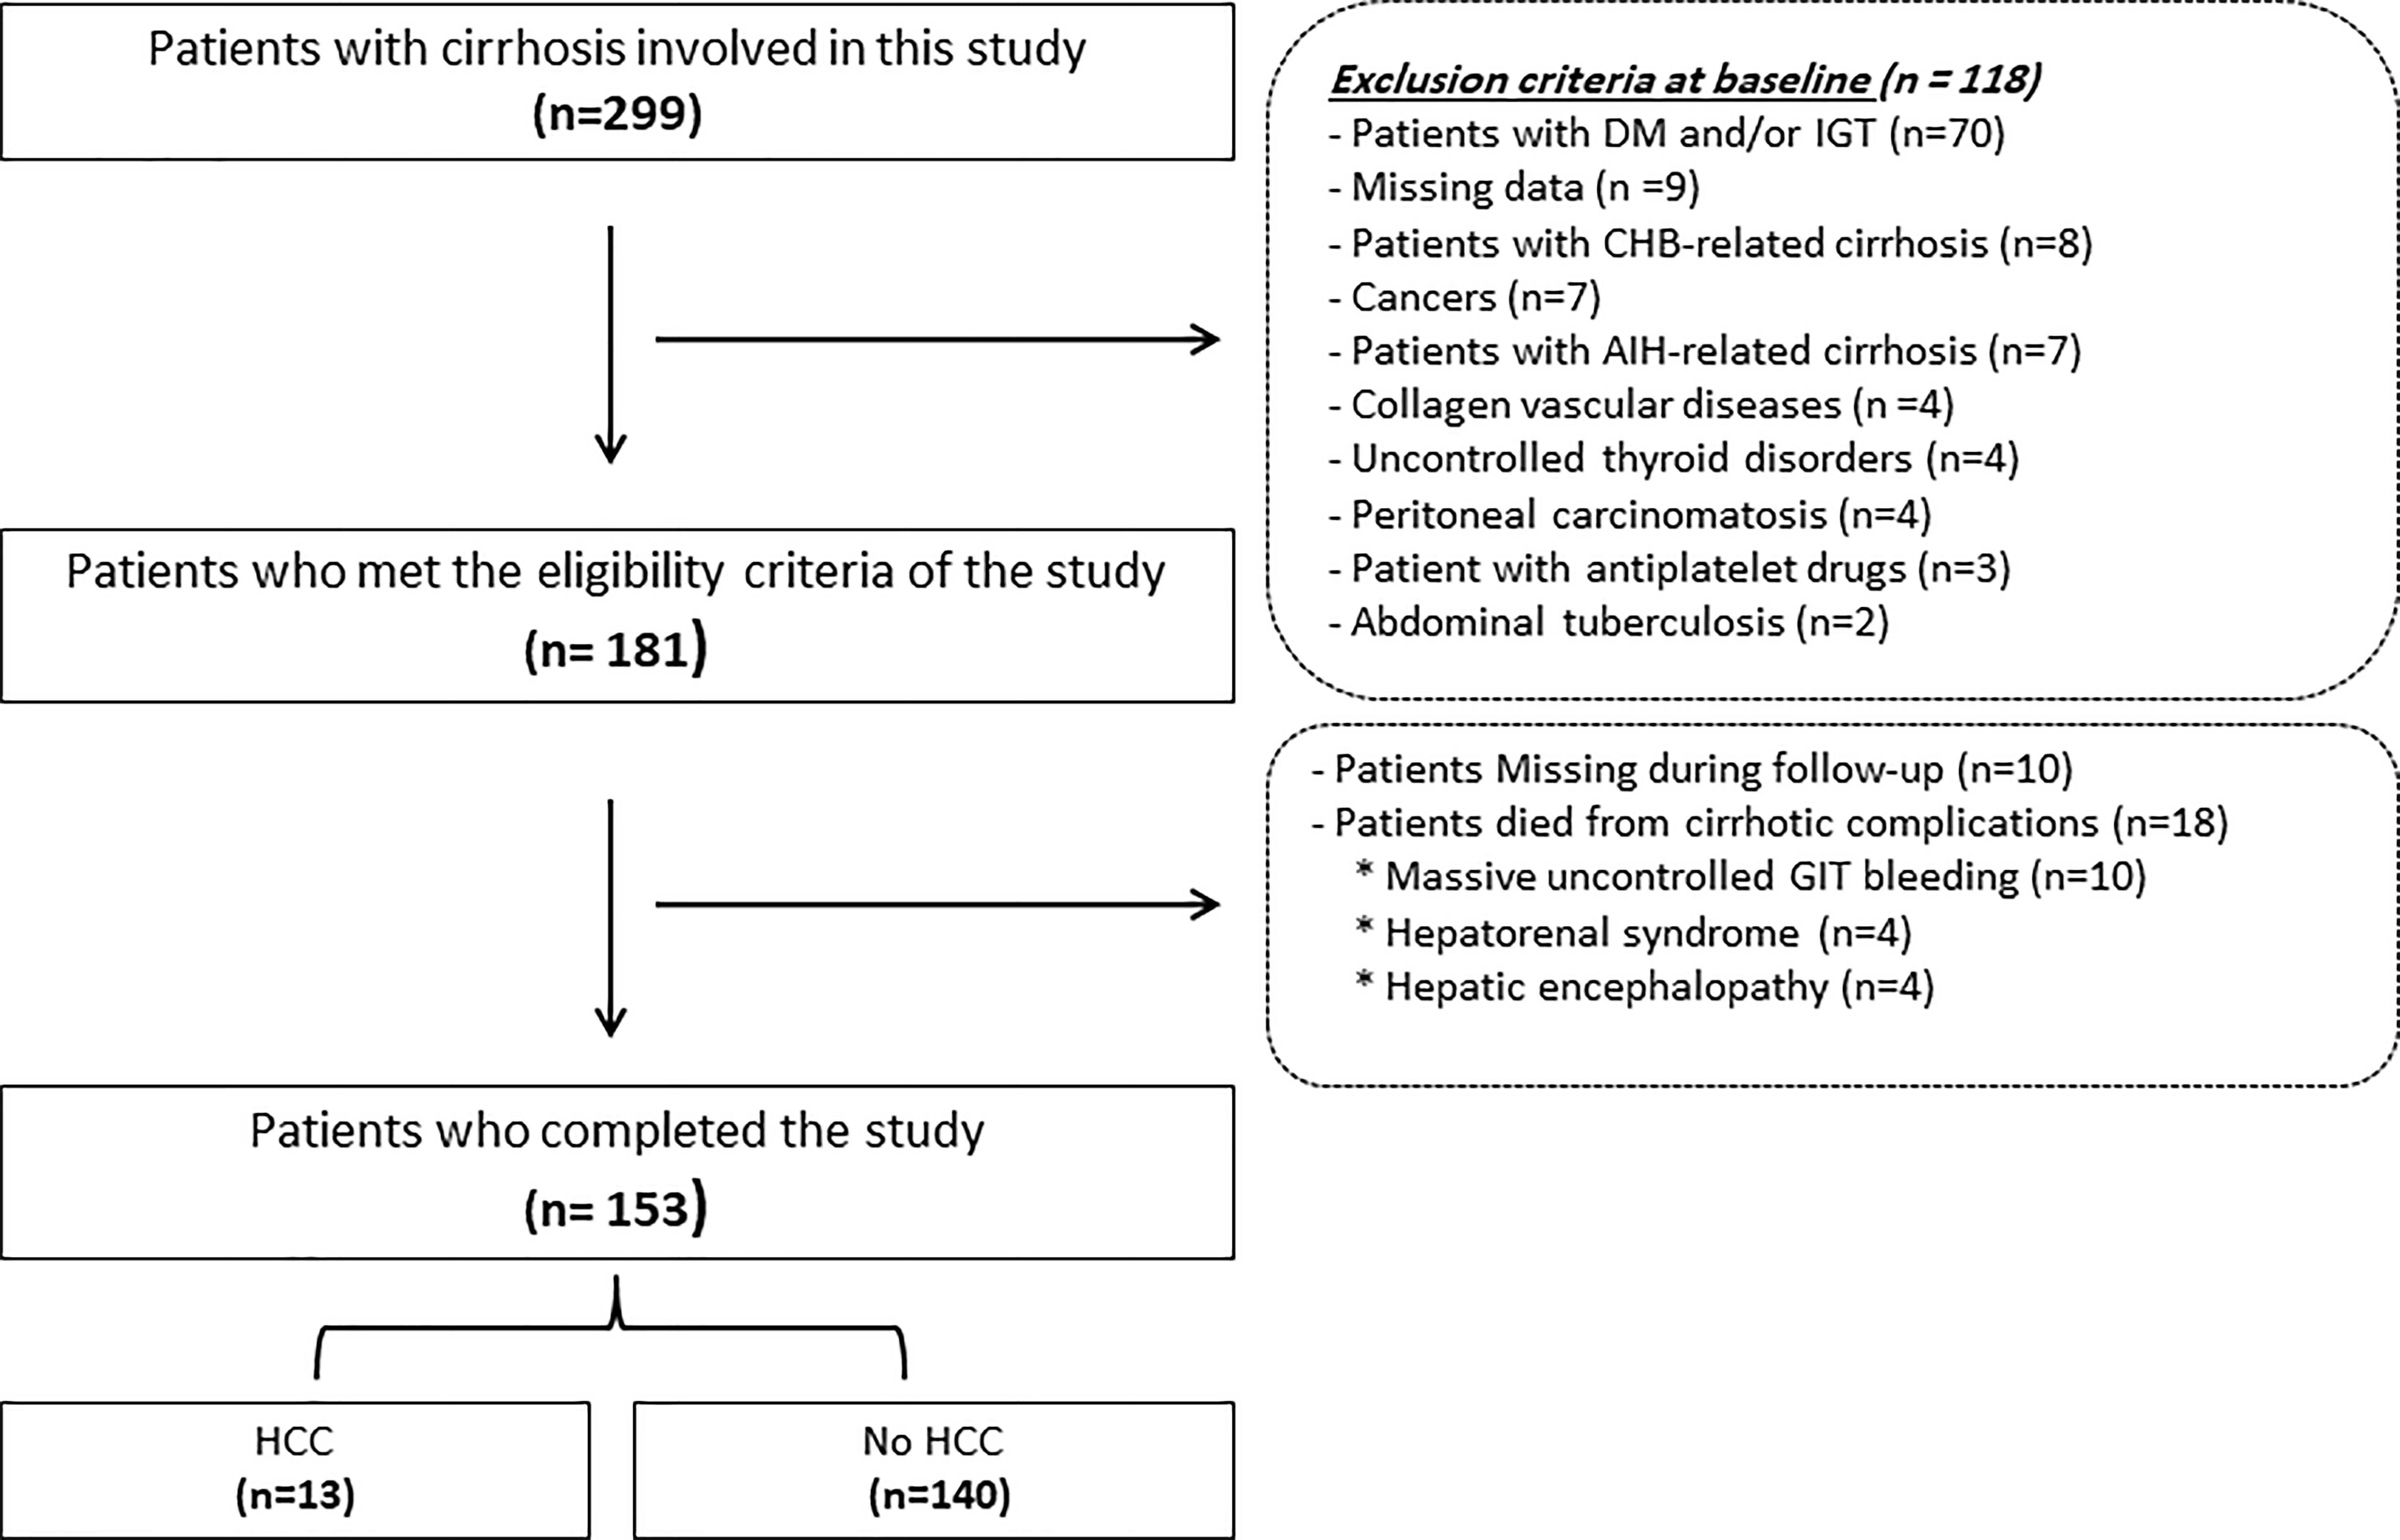
Figure 1 Flowchart of the patients included in this study. HCC, hepatocellular; DM, diabetes mellitus; AIH, autoimmune hepatitis; GIT, gastrointestinal tract; CHB, chronic hepatitis B.
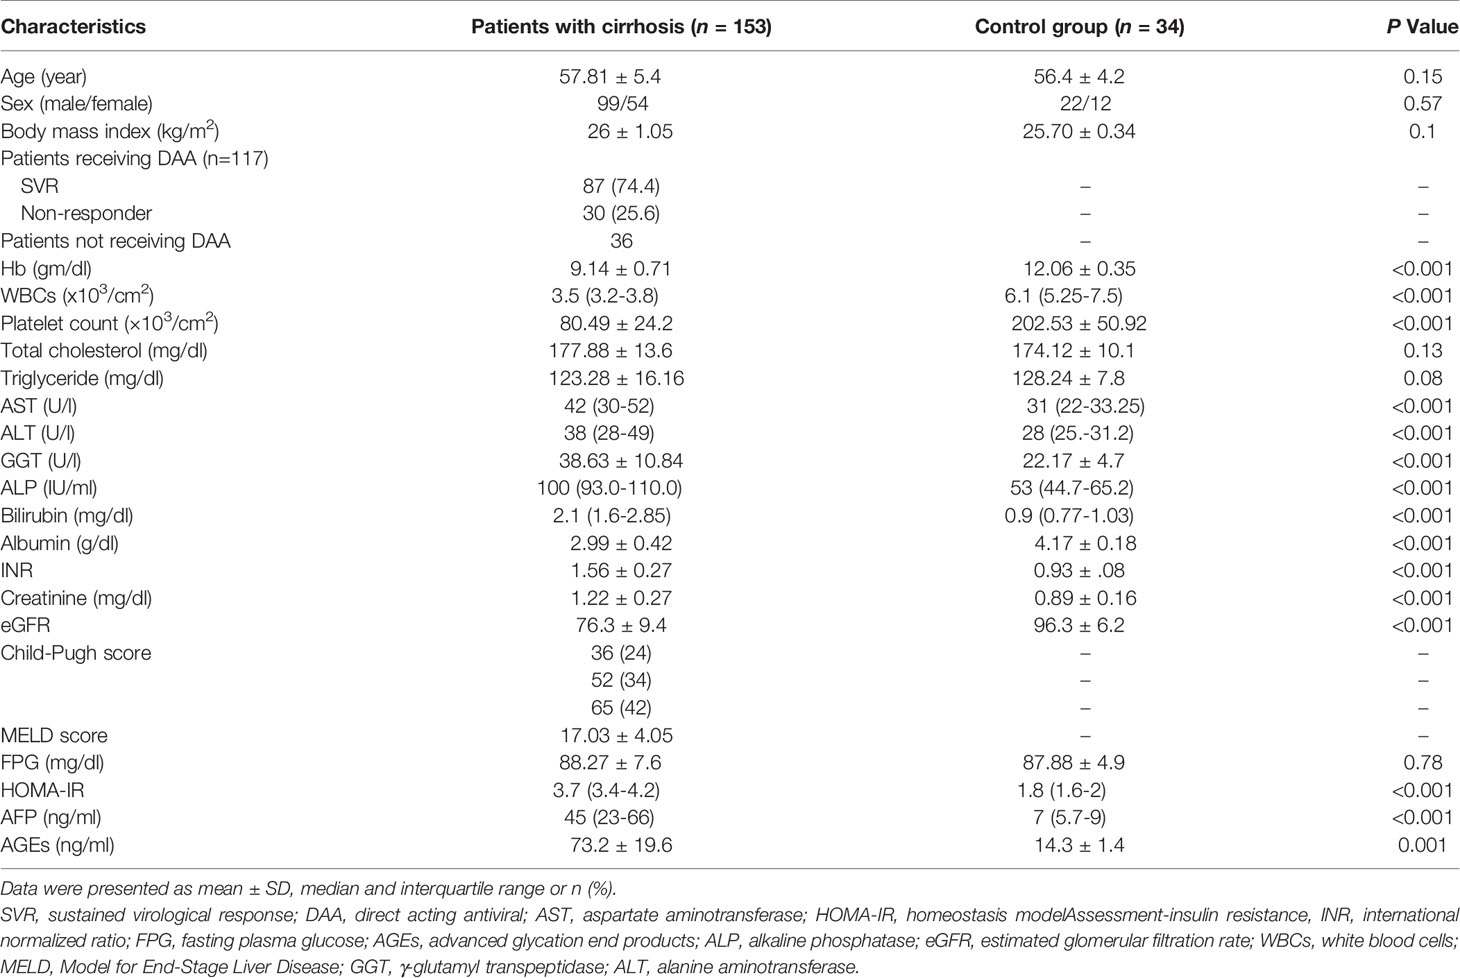
Table 1 Baseline biochemical, demographic, and clinical characteristics of enrolled participants.
Patients displayed a statistically significant increase in AST, ALP, ALT, GGT, serum creatinine, serum bilirubin, HOMA-IR, INR, AFP, and AGEs compared to healthy subjects (all p<0.05), and a statistically significant decrease in WBCs, hemoglobin, serum albumin, eGFR, and platelet count compared to healthy subjects (p<0.05).
After the primary assessment at baseline by biochemical and hematological blood tests, the participants were followed up every year for two years.
Out of all the patients assessed during the follow-up period (n=153), thirteen patients (8.5%) developed HCC. Figure 2 shows serum levels of AGEs in patients with HCC compared to patients without HCC.
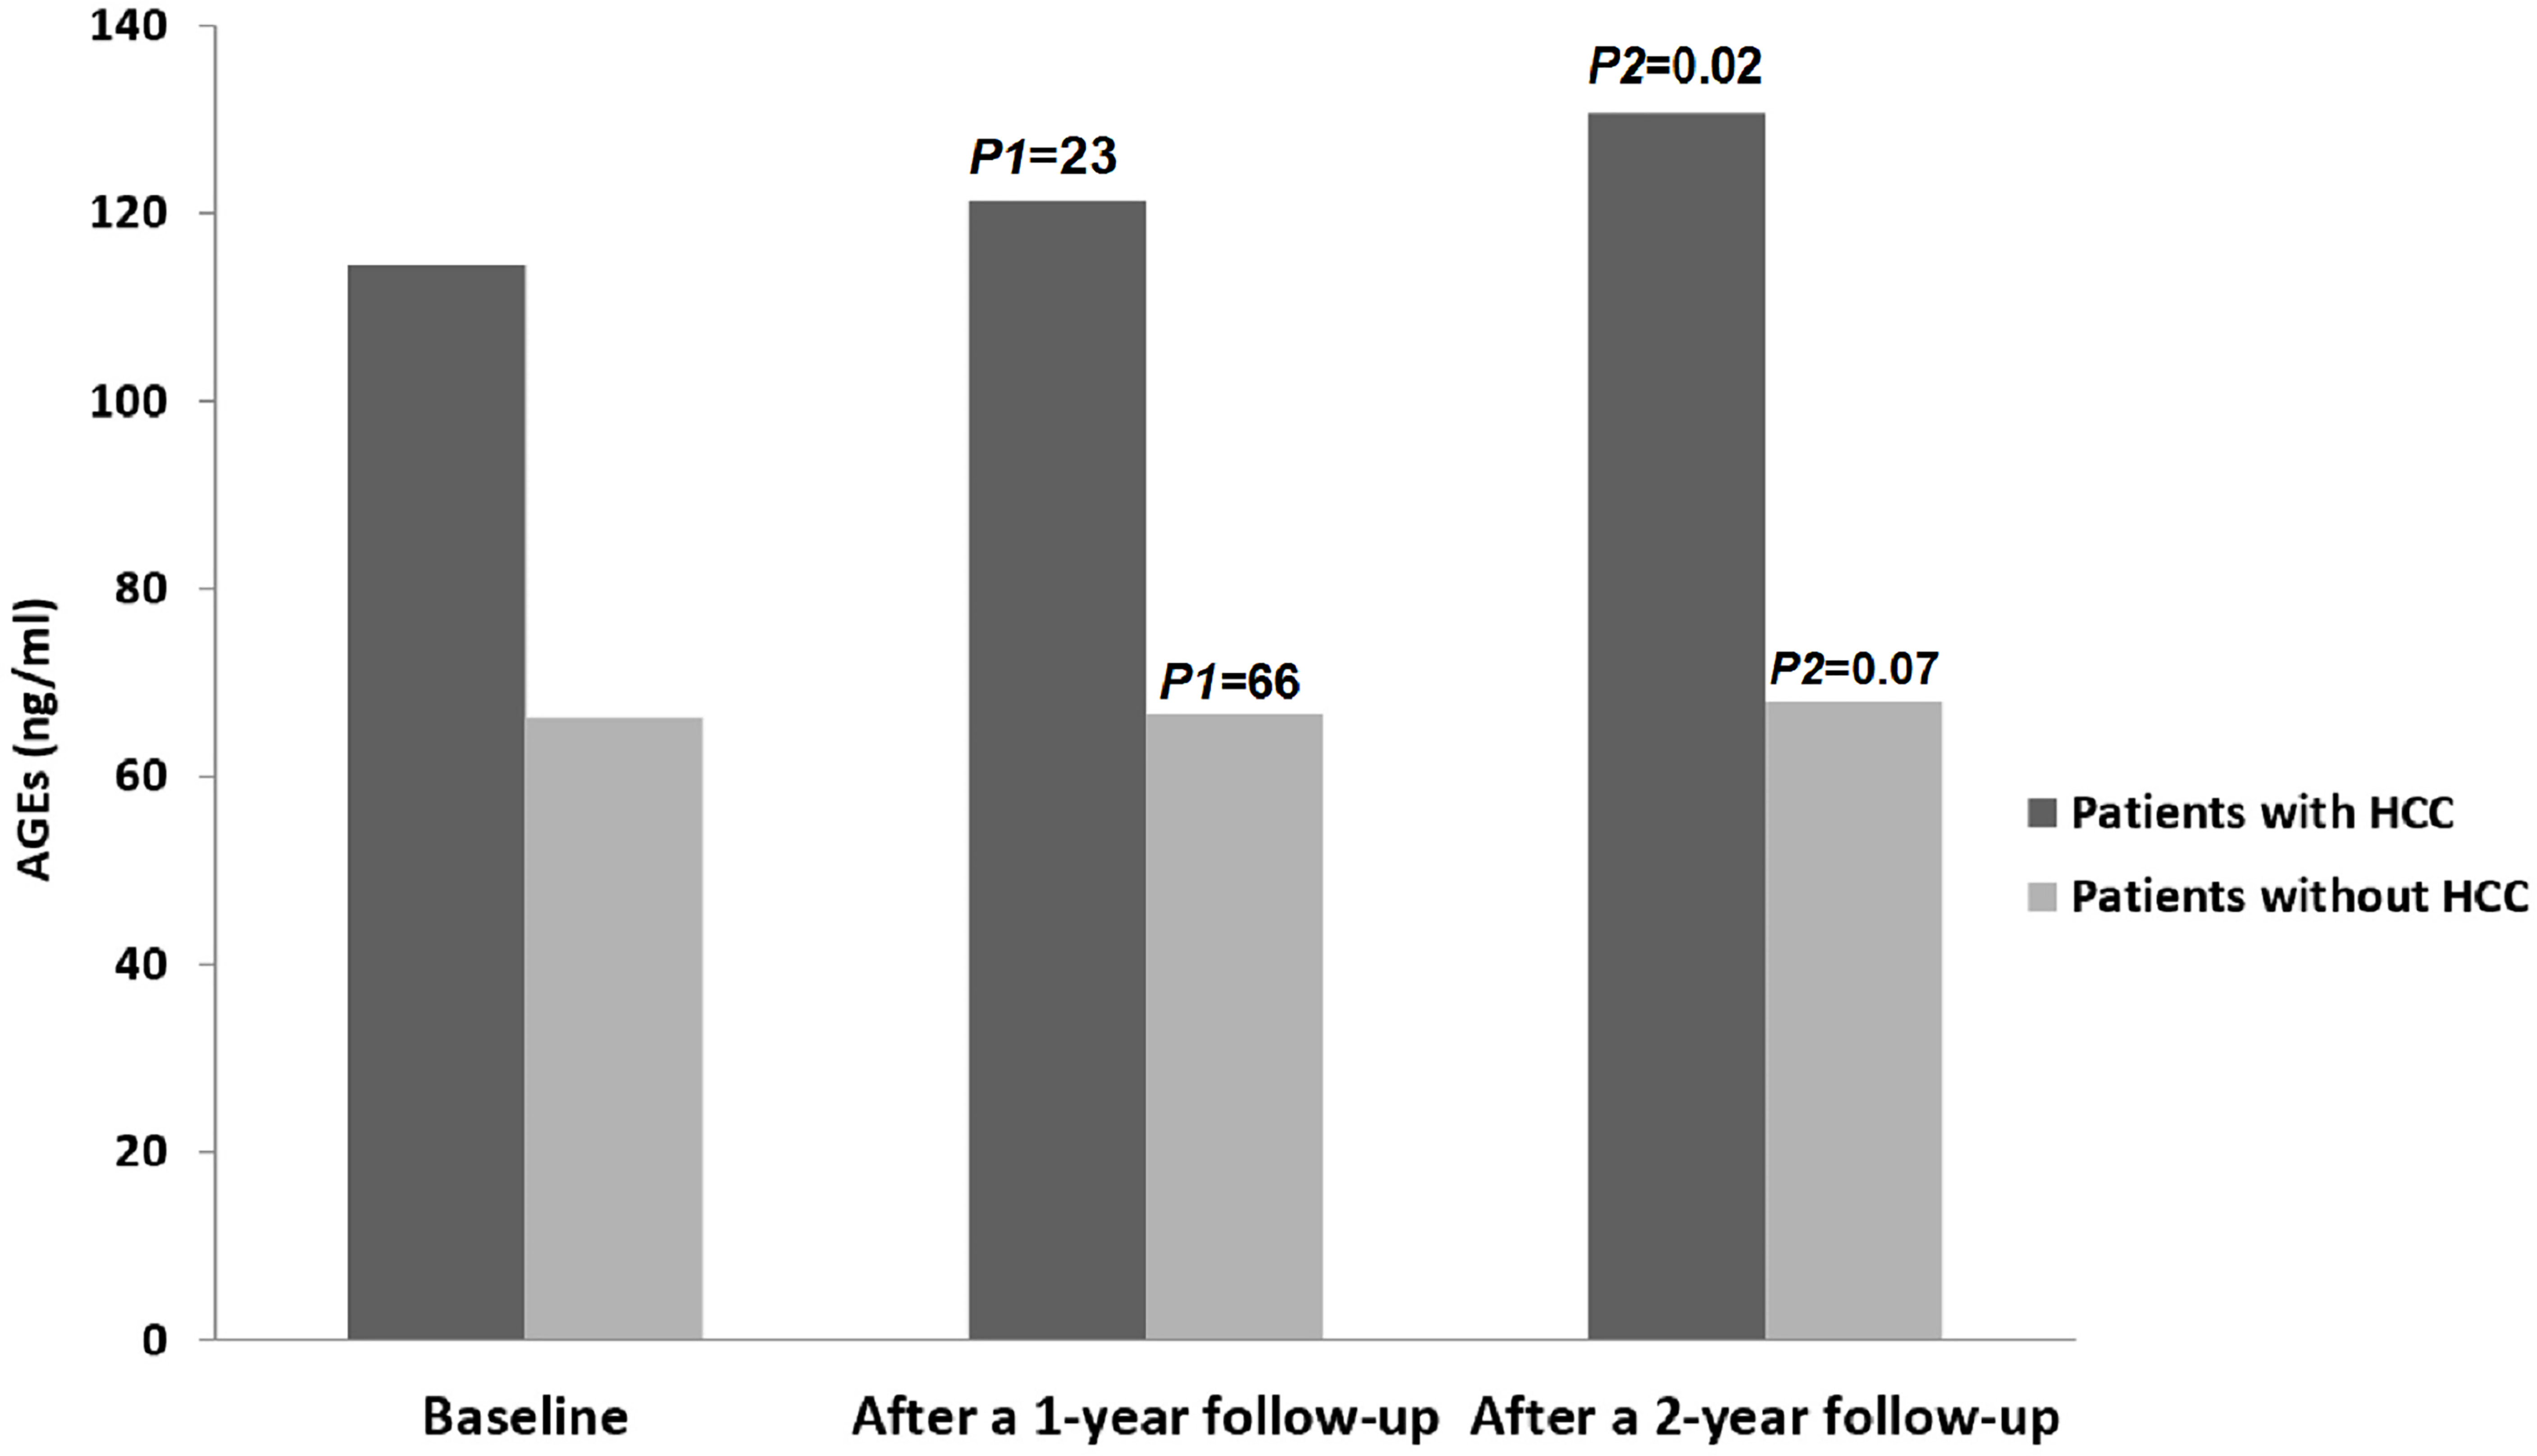
Figure 2 Levels of AGEs in all patients throughout the study period. HCC, hepatocellular; AGEs, Advanced glycation end products. P1 = Baseline vs. after 1 year follow-up; P2 = Baseline vs. after 2 year follow-up.
Regarding the control group, there were no statistically significant differences in the levels of AGEs between the starting point and at the end-of-study (15.3 ± 2.2 vs. 16.2 ± 2.3; P=0.09), and none of them developed HCC during the follow-up period.
Correlation Between Biochemical Parameters and AGEs in the Studied Patients
Spearman’s correlation analysis revealed there was a significant positive correlation between serum AGEs and fibrinogen, AFP, and HOMA-IR (rho=0.37, P<0.001; rho=0.71, P<0.001; and rho=0.81, P<0.001 individually) see Figure 3.
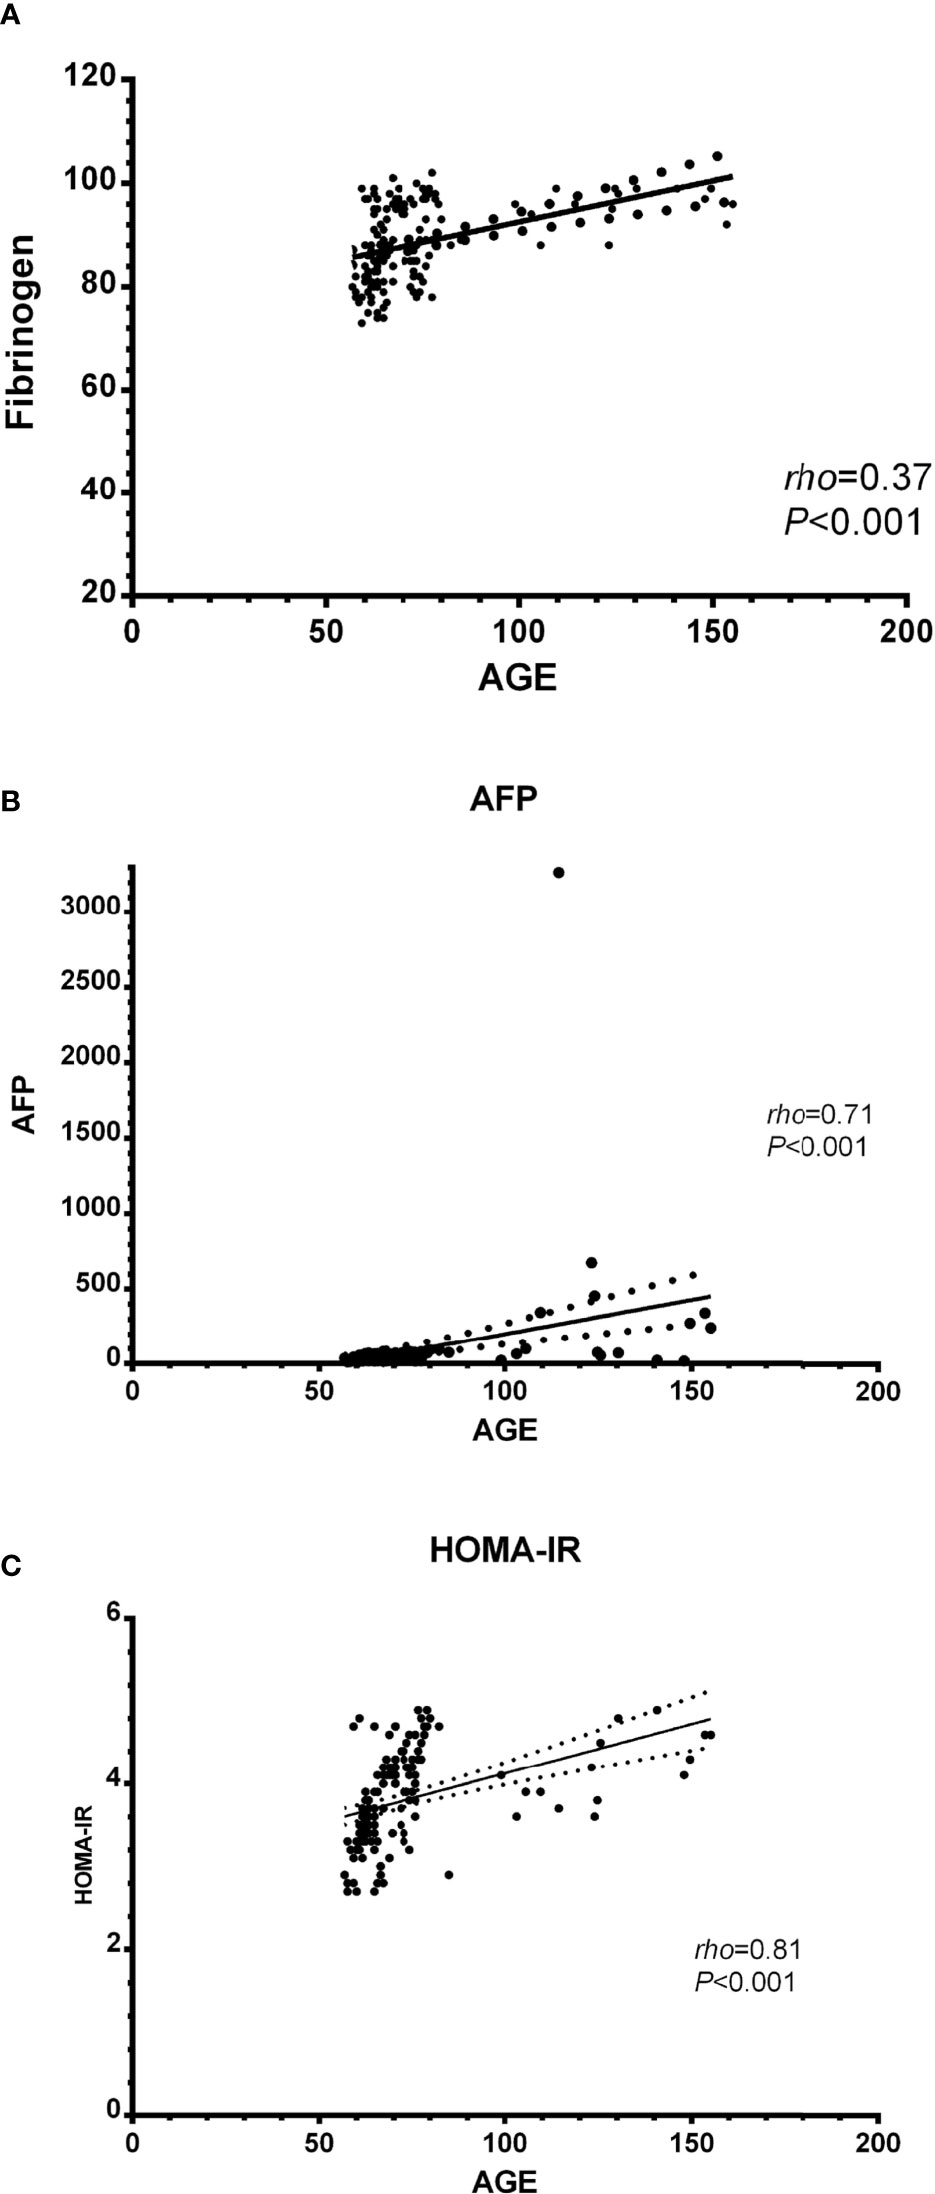
Figure 3 Correlation between biochemical parameters and AGEs in the studied patients; (A) AGEs and fibrinogen, (B) AGEs and AFP, and (C) AGEs and HOMA-IR. AGEs, Advanced glycation end products; AFP, alpha-fetoprotein; HOMA-IR, Homeostatic model assessment-insulin resistance.
Multivariable and Univariate Cox Regression Models Predicting HCC Within the Two Years Follow-Up Period
Table 2 presents an overview of the patients’ biochemical, clinical, and demographic features with and without HCC.
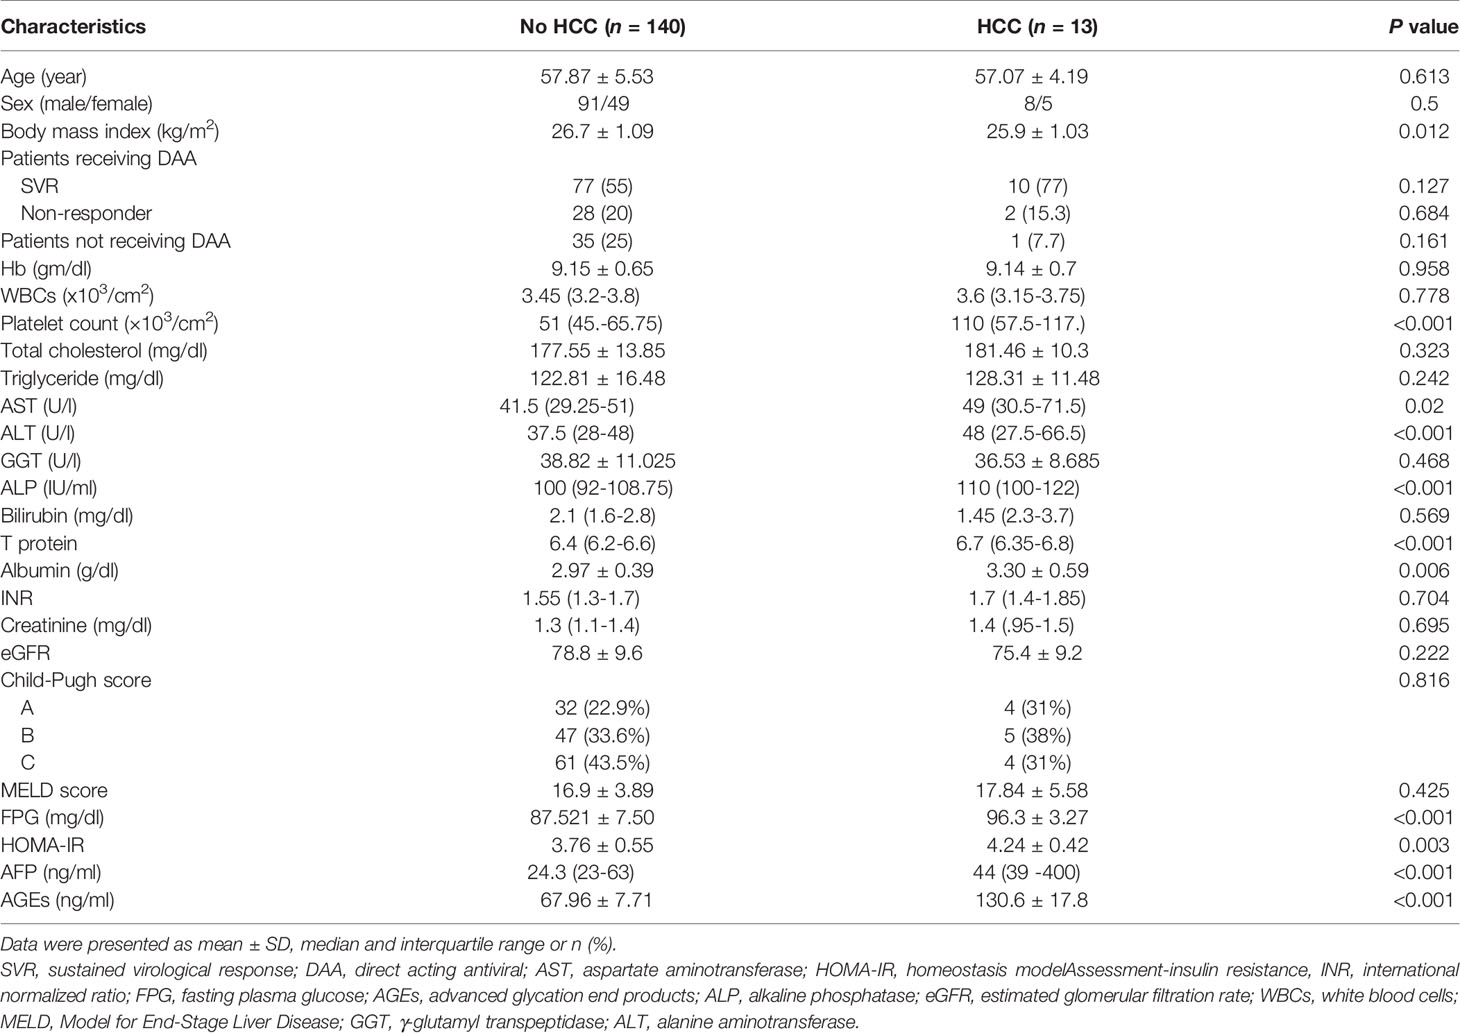
Table 2 Biochemical, demographic, and clinical characteristics of patients without and with HCC during the follow-up period.
There was no significant difference in total cholesterol, hemoglobin, sex, age, WBCs, serum triglyceride, GGT, INR, serum bilirubin, serum creatinine, CTP classification, MELD score, and eGFR between the two groups (all P>0.05). Univariate Cox regression analysis showed that BMI, HOMA-IR, AFP, and AGEs levels are statistically significant between the two groups (all P<0.05) in Table 3.

Table 3 Cox regression analysis models to predict the development of HCC in the studied patients.
The multivariable Cox regression analysis model outcomes were reassessed after adjusting multiple confounders, applying the formerly described variables at baseline associated with the development of HCC during the two-year follow-up period. This test showed that the only parameters independently related to the development of HCC are AFP and AGEs (Table 3).
Using the ROC curve, at a cutoff value of > 79.6 ng/ml, AGEs had 100% sensitivity, 96.4% specificity, 0.999 AUC, 100% negative predictive value, 72.2% positive predictive value, and P<0.001 for prediction of HCC, as presented in Figure 4.
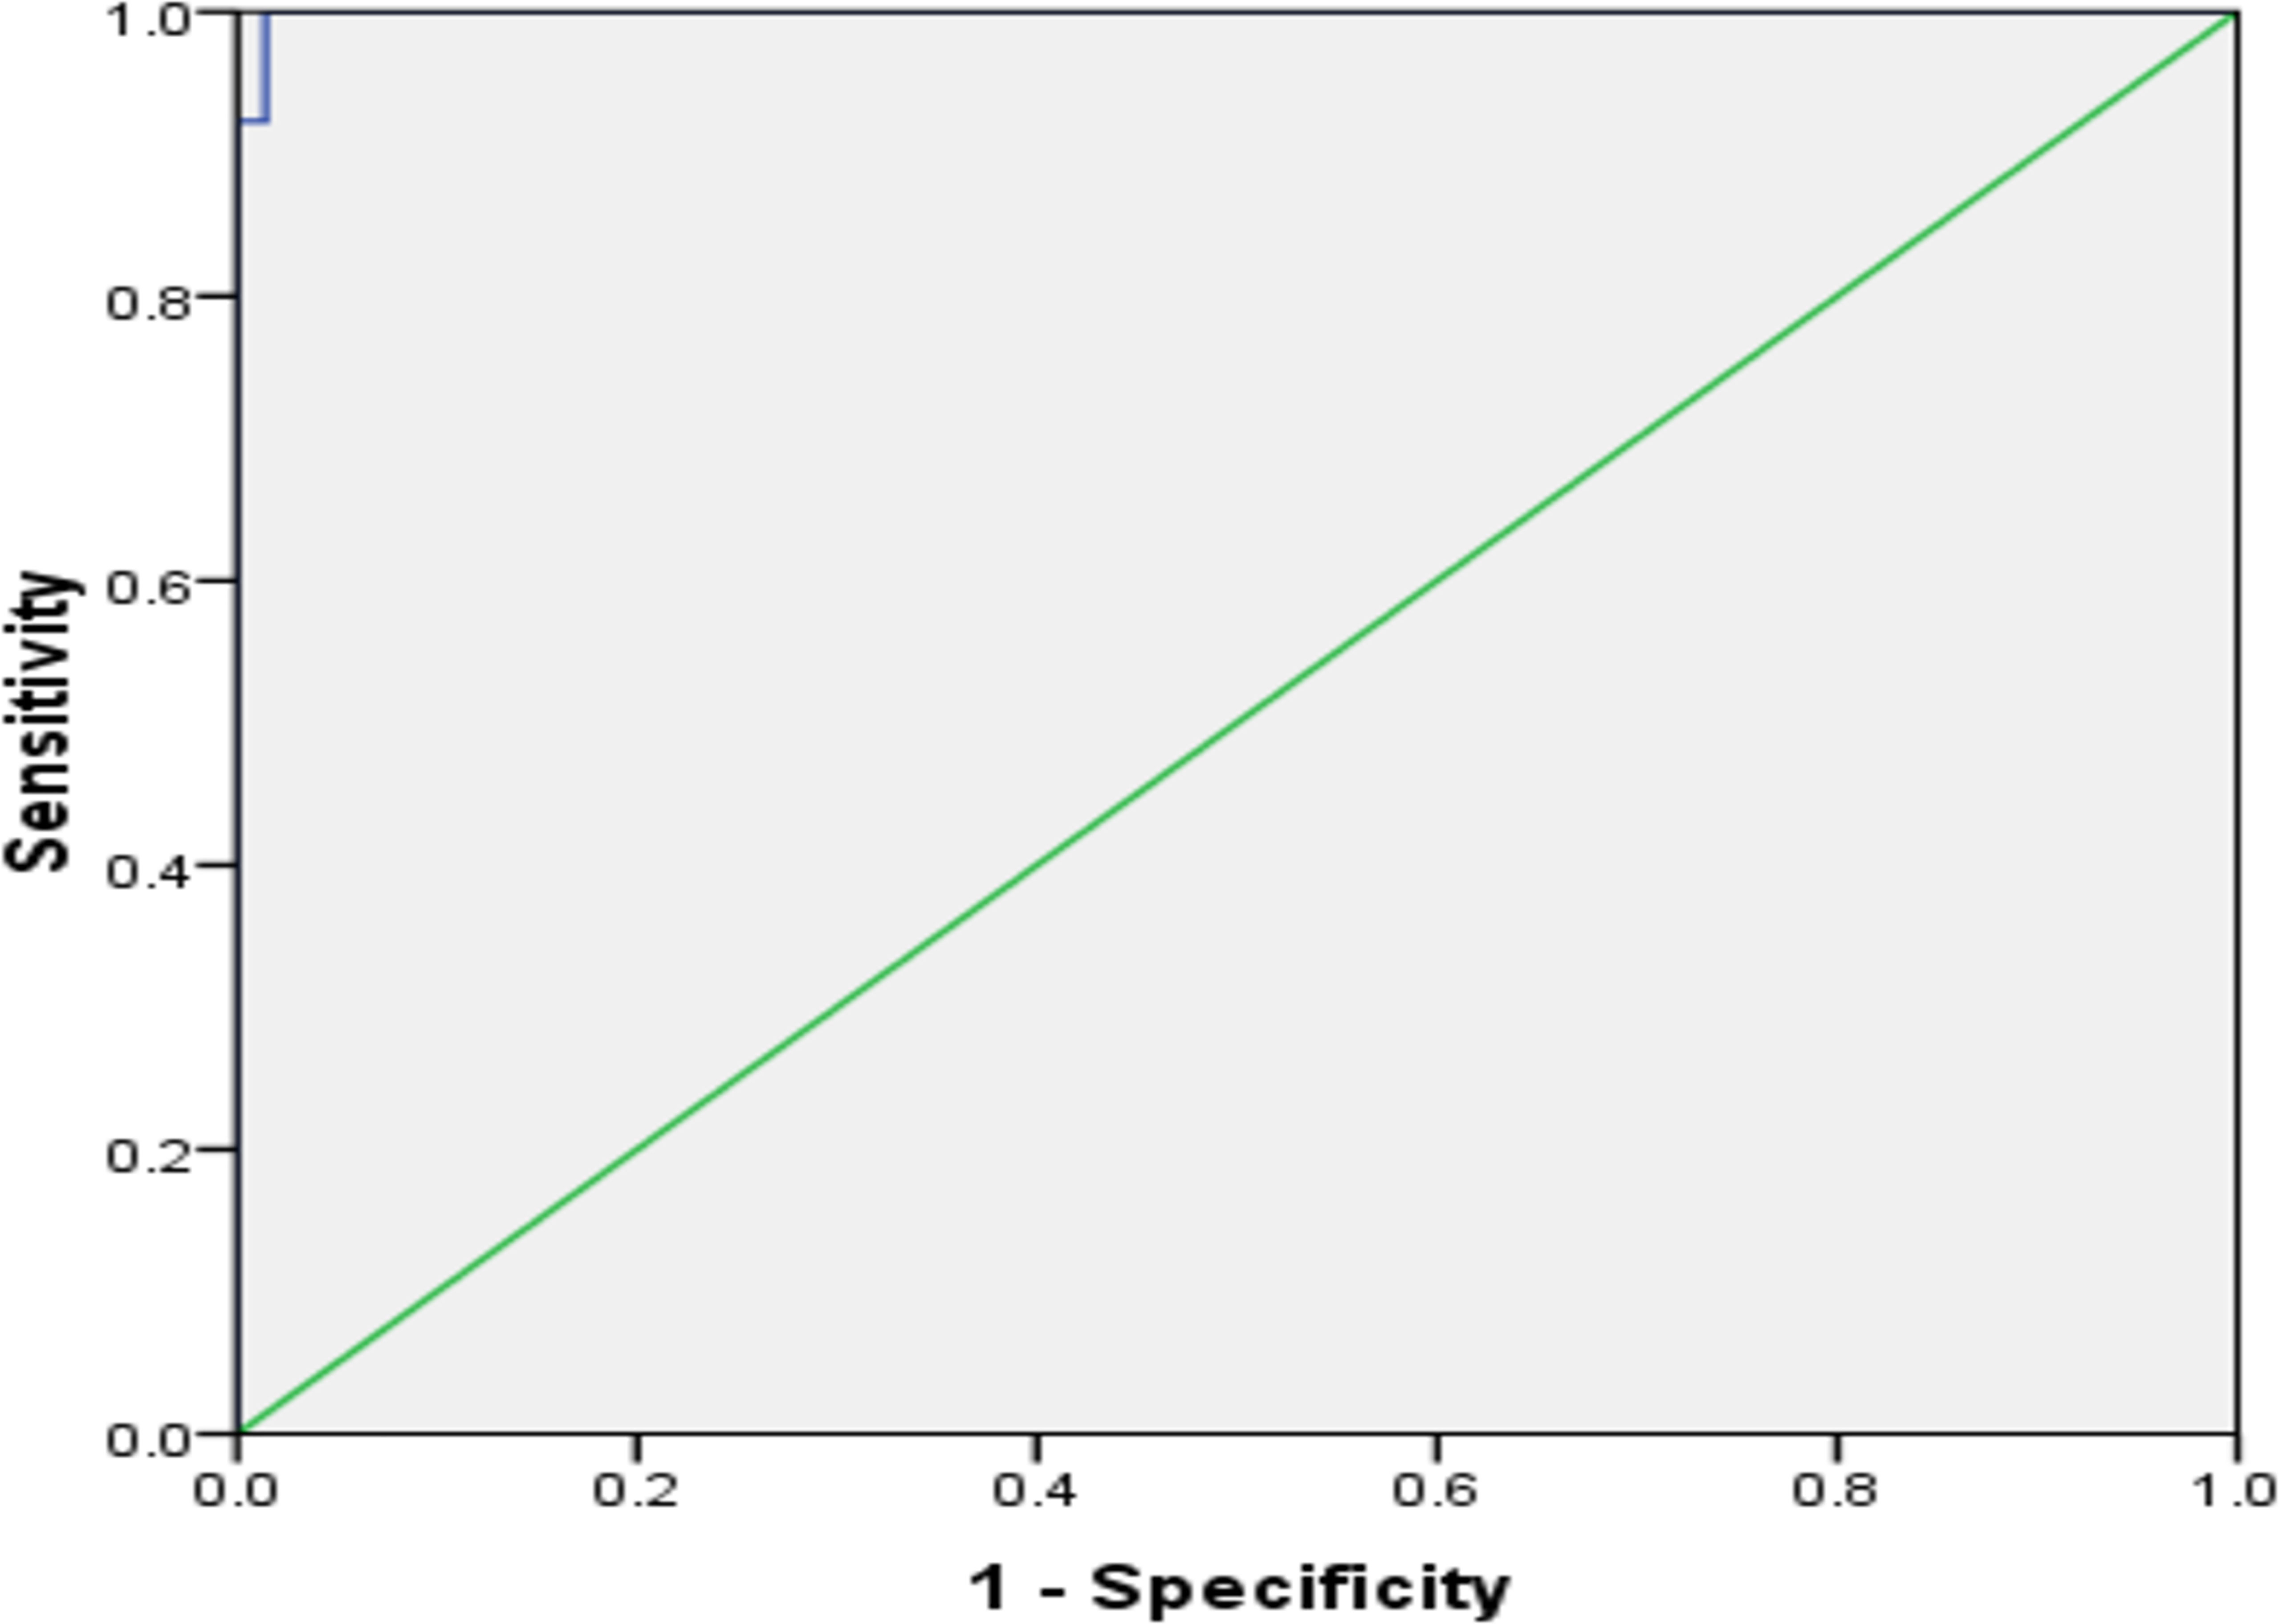
Figure 4 The receiver operating characteristic curve of AGEs in predicting HCC in patients with cirrhosis.
All patients were followed-up regularly (mean 26 ± 6 months) to check the different therapy modalities’ effectiveness for HCC. Regarding AGEs, there was a significant reduction of serum AGE at baseline and 3-months after therapy as follows (130.6 ± 17.7 vs. 66.84 ± 7.68; P<0.001).
Therapeutic Findings
According to our study protocol, participants with CTP-B (n=52) and CTP-A (n=65) cirrhosis received treatment. SVR showed in 87 (74.4%) patients. No significant difference was detected in AGEs after completion of therapy vs. at baseline (73.8 ± 20.8 vs. 78.6 ± 21.4; P=0.1).
AGEs presented no significant differences at starting point and at the end of treatment regarding relapse (n=11) (76.5 ± 20.2 vs. 80.6 ± 21.2; P=0.647), non-responder (n=19) (78.6 ± 21.5 vs. 82.1 ± 21.8; P=0.621), and SVR (n=87) (75.6 ± 21.3 vs. 80.2 ± 21.6; P=0.159).
There was no statistically significant change between patients who did not receive treatment and those who did (1/36 vs. 12/117; P= 0.161) correspondingly regarding the development of HCC.
Safety and Tolerability
The most popular side effects were pruritus (9.2% and 13.5%), headache (7.7% and 11.5%), hyperbilirubinemia (12.3% and 19.2%), RBV dose reductions (10.8% and 17.3%), anaemia (15.4% and 25%), and fatigue (13.8% and 27%) in CTP-A and CTP-B patients; correspondingly.
We registered critical adverse events in CTP-B cirrhotic patients more than CTPA; (6.2% and 9.6%) had GIT bleeding, (4.6% and 7.7%) had hepatic encephalopathy, (7.7% and 11.5%) developed ascites, (7.7% and 13.5%) had HCC, and (1.5% and 1.9%), had renal impairment in CTP-A and CTP-B respectively.
Discussion
The interaction of the receptor for advanced glycation end products (RAGE) with AGEs is believed to cause chronic pathophysiology through various processes (Tabrez et al., 2015). The relationship between the development of HCC and RAGE activation achieved consideration as a consequence of the liver’s role in the metabolism of AGE (Su et al., 2015). Experimental reports also proposed the RAGE-AGE axis role in initiating different hepatic disorders and tumorigenesis (Hyogo and Yamagishi, 2008; Hiwatashi et al., 2008).
Our patients’ most significant finding was that increased AGEs levels could be deemed an independent variable for predicting HCC occurrence.
AGEs-provoked reactive oxygen species (ROS) release might intercede via nuclear factor-kappa (NF-κB) independent and/or dependent manners. Stimulated NF-κB initiates tumor necrosis factor-alpha (TNF-α) release, which unites to tumor necrosis factor receptor 1 (TNFR-1) and then produces ROS (Neumann et al., 1999; Janssen-Heininger et al., 2000), which in turn run in a vicious series of TNF-α and ROS production. Numerous further intracellular signaling molecules, such as stress-activated protein kinase/c-Jun N-terminal kinase, mitogen-activated protein kinases (MAPK), as p38 extracellular signal-regulated kinase-1 are included in the AGE-stimulated TNF-α production and ROS release (Requena et al., 2009). These abnormalities can provoke the progression and development of HCC (Muriel, 2009; Zhao et al., 2015).
Furthermore, DNA’s oxidative injuries lead to mutagenic and carcinogenic effects by dividing cells with unpaired or mis-repaired injuries, which finally provoke the development and progression of HCC (Yang et al., 2014).
There is a striking observation, which is a sharp decline in serum AGEs after therapy for HCC. This may perhaps elucidate the role of RAGE in the pathogenesis of HCC, especially in altering carcinogenic signaling in the cancer microenvironment (Takino et al., 2010; Yaser et al., 2012; Pusterla et al., 2013). Takino et al., 2010 issued that anti-RAGE antibody therapy can prevent cancer development, protract survival rates, and suppress spontaneous lung metastases. Hepatic tissue samples of primary HCC patients detected markedly elevated levels of RAGE mRNA. This explains the possible role of RAGE in HCC propagation (Yaser et al., 2012). Chen et al., 2014 recorded repeatedly amplified expressions of RAGE, high mobility group box-1 (HMGB1), and extracellular HMGB in keeping with cell metastasis potentials in various HCC cell lines. The RAGE-HMGB1 axis encourages cell division, immigration, and incursion and raises the level of NF-κB in HCC cell lines (Chen et al., 2014). Additionally, the precise downstream signaling ways of the RAGE-HMGB1 axis in the evolution of HCC calls for additional studies. A decrease in RAGE holds up the onset of malignant conversion in the double knockout HCC mice model, which draws attention to the role of RAGE in the development of HCC (Pikarsky et al., 2004).
In this study, there is no evidence that treatment with DAA has an influence on HCC development. In accordance with the present results, previous studies have demonstrated that DAA therapy has no impact on tumor development (Waziry et al., 2017; Gitto et al., 2021). While some other studies concluded that HCV eradication leads to decreased inflammation levels leading to decreased cancer immunosurveillance by the patient and encourages HCC development (Reig et al., 2016). To date, this problem has received scant attention in the research literature.
If HCV triggered the elevation in AGE levels (He et al., 2015), they should have gotten back to their average values after therapy with DAAs. Nonetheless, we have not detected any diminish in the estimations of their values after follow-up and treatment compared to the baseline values for these patients. This implies that cirrhosis is the main cause behind this increase.
The RAGE–AGE axis is a principal etiology in the activation of HSC and the resulting liver cirrhosis. Decreasing the RAGE–AGE signaling by avoiding overcooked foods, sensitizing insulin function, controlling high glucose, and oxidant supplement digestion (Raffaelli et al., 2014) is an auguring approach to reducing the hazard of liver cirrhosis and HCC in CHC patients, particularly with raised AGEs.
To the best of our knowledge, this study is the first to contribute to this growing area of research by exploring the impact of AGEs in such patients. These results have significant effects on understanding how AGEs were implicated in HCC development.
To the best of our insight from the accessible results, we advocate further exploitation of inflammatory signaling cascades, MAPK, and NF-κB activation as a possible target to establish a direct linkage between glycation and HCC and study the effect of the anti-RAGE antibody treatment in HCC-related cirrhosis.
The precise mechanism of AGEs in cirrhosis still needs clarification. These findings suggest several pathways for AGEs in the pathogenesis of HCC. The findings of this study have several important implications for future practice. Further research in this field would be of great help in understanding the pathogenesis of HCC and the effect of the anti-RAGE antibody therapy in such patients.
The generalizability of these results is subject to certain limitations—first, small sample size. Second, a single-center study with a follow-up period of only two years could not reveal immunological or cytokine mediators’ levels. Third, the etiology of cirrhosis is only the hepatitis C virus. Fourth, overfitting the learning curves with high AUC was noted, and it is an abstruse drawback. Model validation is frequently applied to control and assess this problem. Conversely, these methods need someone to hold or collect a considerable amount of records for validation and are rarely utilized in research comprising human individuals, where data collection is usually extraordinarily costly (Vabalas et al., 2019). Lastly, the diagnosis of HCC depends mainly on radiological and biochemical findings, not histopathological evaluation.
In conclusion, AGEs were obviously associated with an increased incidence of HCC, particularly in patients with liver cirrhosis. This may be an implying approach to reduce the hazard of HCC and liver cirrhosis in those patients.
Data Availability Statement
The data that support the findings of this study are available on request from the corresponding author. The data is not publicly available as they contain data that could compromise the privacy of research participants.
Ethics Statement
The studies involving human participants were reviewed and approved by Mansoura Institutional Review Board. The patients/participants provided their written informed consent to participate in this study (Proposal Code: R.20.05.844.1R1).
Author Contributions
AA-R, and WS contributed to the study design and concept, conducted the literature search, supervised the study, and wrote the manuscript; MA, AA, AMN and AY made the tables and figures and contributed to the data analysis; RanE, RasE, and NE-W contributed to the collection of patients' samples and medical information; as well as contributed to the analysis of data and acquisition; and contributed to the acquisition of data; AH contributed to the study concept and critically revised the manuscript; AAF, SAM, DM and WE performed the statistical analysis and contributed to the analysis of data and acquisition. All the authors have accepted responsibility for the entire content of this submitted manuscript and approved submission. All authors approved the final version of the article, including the authorship list.
Conflict of Interest
The authors declare that the research was conducted in the absence of any commercial or financial relationships that could be construed as a potential conflict of interest.
Publisher’s Note
All claims expressed in this article are solely those of the authors and do not necessarily represent those of their affiliated organizations, or those of the publisher, the editors and the reviewers. Any product that may be evaluated in this article, or claim that may be made by its manufacturer, is not guaranteed or endorsed by the publisher.
Acknowledgments
The authors thank the staff and patients of the Tropical Medicine Department and the lab specialists for their significant aid.
Abbreviations
AGEs, advanced glycation end products; HCC, hepatocellular carcinoma; AFP, alpha-fetoprotein; DAAs, direct-acting antivirals; DM, diabetes mellitus; RAGE, Receptor for Advanced Glycation Endproducts; GIT, gastrointestinal tract; BMI, Basal metabolic index; NASH, non-alcoholic steatohepatitis; HCV, hepatitis C virus; DCV, daclatasvir; SOF, Sofosbuvir; MELD, Model for End-Stage Liver Disease; CTP, Child-Turcotte Pugh.
References
Abdel-Razik, A., Mousa, N., Zakaria, S., Abdelsalam, M., Eissa, M., Abd El-Ghany, M. I., et al. (2020a). Advanced Glycation End Products as a Predictor of Diabetes Mellitus in Chronic Hepatitis C-Related Cirrhosis. Front. Med. 7, 588519. doi: 10.3389/fmed.2020.588519
Abdel-Razik, A., Mousa, N., Elhelaly, R., Elzehery, R., Hasan, A. S., Abdelsalam, M., et al. (2020b). Helicobacter Pylori as an Initiating Factor of Complications in Patients With Cirrhosis: A Single-Center Observational Study. Front. Med. 7, 96. doi: 10.3389/fmed.2020.00096
Cardenas, A., Ginès, P. (2005). Management of Complications of Cirrhosis in Patients Awaiting Liver Transplantation. J. Hepatol. 42, S124–S133. doi: 10.1016/j.jhep.2004.12.007
Chen, R. C., Yi, P. P., Zhou, R. R., Xiao, M. F., Huang, Z. B., Tang, D. L., et al. (2014). The Role of HMGB1-RAGE Axis in Migration and Invasion of Hepatocellular Carcinoma Cell Lines. Mol. Cell Biochem. 390, 271–280. doi: 10.1007/s11010-014-1978-6
Colombo, M., Sangiovanni, A. (2015). Treatment of Hepatocellular Carcinoma: Beyond International Guidelines. Liver Int. 35, 129–138. doi: 10.1111/liv.12713
El-Khayat, H., Fouad, Y., Mohamed, H. I., El-Amin, H., Kamal, E. M., Maher, M., et al. (2018). Sofosbuvir Plus Daclatasvir With or Without Ribavirin in 551 Patients With Hepatitis C-Related Cirrhosis, Genotype 4. Aliment Pharmacol. Ther. 47, 674–679. doi: 10.1111/apt.14482
European Association for Study of Liver. (2015). EASL Recommendations on Treatment of Hepatitis C 2015. J. Hepatol. 63, 199–236. doi: 10.1016/j.jhep.2015.03.025
Gitto, S., Cursaro, C., Bartoli, A., Margotti, M., Andreone, P. (2021). Hepatitis C: Clinical Management and Debated Issues. Minerva Med. 112 (2), 228–237. doi: 10.23736/S0026-4806.20.07208-0
Hayashi, N., George, J., Takeuchi, M., Fukumura, A., Toshikuni, N., Arisawa, T., et al. (2013). Acetaldehyde-Derived Advanced Glycation End-Products Promote Alcoholic Liver Disease. PLoS One 8, e70034. doi: 10.1371/journal.pone.0070034
He, Y., Zhu, J., Huang, Y., Gao, H., Zhao, Y. (2015). Advanced Glycation End Product (AGE)-Induced Hepatic Stellate Cell Activation via Autophagy Contributes to Hepatitis C-Related fibrosis. Acta Diabetol. 52, 959–969. doi: 10.1007/s00592-015-0763-7
Hiwatashi, K., Ueno, S., Abeyama, K., Kubo, F., Sakoda, M., Maruyama, I., et al. (2008). A Novel Function of the Receptor for Advanced Glycation End-Products (RAGE) in Association With Tumorigenesis and Tumor Differentiation of HCC. Ann. Surg. Oncol. 15, 923–933. doi: 10.1245/s10434-007-9698-8
Hyogo, H., Yamagishi, S. (2008). Advanced Glycation End Products (AGEs) and Their Involvement in Liver Disease. Curr. Pharm. Des. 14, 969–972. doi: 10.2174/138161208784139701
Hyogo, H., Yamagishi, S., Iwamoto, K., Arihiro, K., Takeuchi, M., Sato, T., et al. (2007). Elevated Levels of Serum Advanced Glycation End Products in Patients With Non-Alcoholic Steatohepatitis. J. Gastroenterol. Hepatol. 22, 1112–1119. doi: 10.1111/j.1440-1746.2007.04943.x
Janssen-Heininger, Y. M., Poynter, M. E., Baeuerle, P. A. (2000). Recent Advances Towards Understanding Redox Mechanisms in the Activation of Nuclear Factor Kappab. Free Radic. Biol. Med. 28, 1317–1327. doi: 10.1016/s0891-5849(00)00218-5
Kamath, P. S., Wiesner, R. H., Malinchoc, M., Kremers, W., Therneau, T. M., Kosberg, C. L., et al. (2001). A Model to Predict Survival in Patients With End-Stage Liver Disease. Hepatology 33, 464–470. doi: 10.1053/jhep.2001.22172
Levey, A. S., Bosch, J. P., Lewis, J. B., Greene, T., Rogers, N., Roth, D. (1999). A More Accurate Method to Estimate Glomerular Filtration Rate From Serum Creatinine: A New Prediction Equation. Modification of Diet in Renal Disease Study Group. Ann. Intern. Med. 130, 461–470. doi: 10.7326/0003-4819-130-6-199903160-00002
Marta, K., Tomas, Z., Petr, P., Pavel, S., Martin, B., Soukupová, J., et al. (2004). Advanced Glycation End-Products in Patients With Chronic Alcohol Misuse. Alcohol Alcohol 39, 316–320. doi: 10.1093/alcalc/agh058
Matthews, D. R., Hosker, J. P., Rudenski, A. S., Naylor, B. A., Treacher, D. F., Turner, R. C. (1985). Homeostasis Model Assessment: Insulin Resistance and Beta-Cell Function From Fasting Plasma Glucose and Insulin Concentrations in Man. Diabetologia 28, 412–419. doi: 10.1007/BF00280883
Muriel, P. (2009). Role of Free Radicals in Liver Diseases. Hepatol. Int. 3, 526–536. doi: 10.1007/s12072-009-9158-6
Nault, J. C., Colombo, M. (2016). Hepatocellular Carcinoma and Direct Acting Antiviral Treatments: Controversy After the Revolution. J. Hepatol. 65, 663–665. doi: 10.1016/j.jhep.2016.07.004
Neumann, A., Schinzel, R., Palm, D., Riederer, P., Münch, G. (1999). High Molecular Weight Hyaluronic Acid Inhibits Advanced Glycation Endproduct-Induced NF-KappaB Activation and Cytokine Expression. FEBS Lett. 453, 283–287. doi: 10.1016/s0014-5793(99)00731-0
Ohno, O., Mizokami, M., Wu, R. R., Saleh, M. G., Ohba, K., Orito, E., et al. (1997). New Hepatitis C Virus (HCV) Genotyping System That Allows for Identification of HCV Genotypes 1a, 1b, 2a, 2b, 3a, 3b, 4, 5a, and 6a. J. Clin. Microbiol. 35, 201–207. doi: 10.1128/JCM.35.1.201207.1997
Palimeri, S., Palioura, E., Diamanti-Kandarakis, E. (2015). Current Perspectives on the Health Risks Associated With the Consumption of Advanced Glycation End Products: Recommendations for Dietary Management. Diabetes Metab. Syndr. Obes. 8, 415–426. doi: 10.2147/DMSO.S63089
Perz, J. F., Armstrong, G. L., Farrington, L. A., Hutin, Y. J., Bell, B. P. (2006). The Contributions of Hepatitis B Virus and Hepatitis C Virus Infections to Cirrhosis and Primary Liver Cancer Worldwide. J. Hepatol. 45, 529–538. doi: 10.1016/j.jhep.2006.05.013
Piarulli, F., Sartore, G., Lapolla, A. (2013). Glyco-Oxidation and Cardiovascular Complications in Type 2 Diabetes: A Clinical Update. Acta Diabetol. 50, 101–110. doi: 10.1007/s00592-012-0412-3
Pikarsky, E., Porat, R. M., Stein, I., Abramovitch, R., Amit, S., Kasem, S., et al. (2004). NF-KappaB Functions as a Tumour Promoter in Inflammation-Associated Cancer. Nature 431, 461–466. doi: 10.1038/nature02924
Pusterla, T., Nèmeth, J., Stein, I., Wiechert, L., Knigin, D., Marhenke, S., et al. (2013). Receptor for Advanced Glycation Endproducts (RAGE) Is a Key Regulator of Oval Cell Activation and Inflammation-Associated Liver Carcinogenesis in Mice. Hepatology 58, 363–373. doi: 10.1002/hep.26395
Raffaelli, F., Vignini, A., Giulietti, A., Alidori, A., Borroni, F., Sforza, G., et al. (2014). In Vitro Effects of Resveratrol on Oxidative Stress in Diabetic Platelets. Acta Diabetol. 51 (1), 61–69. doi: 10.1007/s00592-013-0480-z
Reig, M., Mariño, Z., Perelló, C., Iñarrairaegui, M., Ribeiro, A., Lens, S., et al. (2016). Unexpected High Rate of Early Tumor Recurrence in Patients With HCV-Related HCC Undergoing Interferon-Free Therapy. J. Hepatol. 65, 719–726. doi: 10.1016/j.jhep.2016.04.008
Requena, P., Daddaoua, A., Guadix, E., Zarzuelo, A., Suárez, M. D., Sánchez de Medina, F., et al. (2009). Bovine Glycomacropeptide Induces Cytokine Production in Human Monocytes Through the Stimulation of the MAPK and the NF-KappaB Signal Transduction Pathways. Br. J. Pharmacol. 157, 1232–1240. doi: 10.1111/j.1476-5381.2009.00195.x
Rodriguez-Teja, M., Gronau, J. H., Breit, C., Zhang, Y. Z., Minamidate, A., Caley, M. P., et al. (2015). AGE-Modified Basement Membrane Cooperates With Endo180 to Promote Epithelial Cell Invasiveness and Decrease Prostate Cancer Survival. J. Pathol. 235, 581–592. doi: 10.1002/path.4485
Ružić, M., Pellicano, R., Fabri, M., Luzza, F., Boccuto, L., Brkić, S., et al. (2018). Hepatitis C Virus-Induced Hepatocellular Carcinoma: A Narrative Review. Panminerva Med. 60 (4), 185–191. doi: 10.23736/S0031-0808.18.03472-9
Sharaf, H., Matou-Nasri, S., Wang, Q., Rabhan, Z., Al-Eidi, H., Al Abdulrahman, A., et al. (2015). Advanced Glycation Endproducts Increase Proliferation, Migration and Invasion of the Breast Cancer Cell Line MDA-MB-231. Biochim. Biophys. Acta 1852, 429–441. doi: 10.1016/j.bbadis.2014.12.009
Su, S. C., Hsieh, M. J., Chou, Y. E., Fan, W. L., Yeh, C. B., Yang, S. F. (2015). Effects of RAGE Gene Polymorphisms on the Risk and Progression of Hepatocellular Carcinoma. Med. (Baltimore) 94, e1396. doi: 10.1097/MD.0000000000001396
Tabrez, S., Al-Shali, K. Z., Ahmad, S. (2015). Lycopene Powers the Inhibition of Glycation-Induced Diabetic Nephropathy: A Novel Approach to Halt the AGE-RAGE Axis Menace. Biofactors 41, 372–381. doi: 10.1002/biof.1238
Takeuchi, M., Sakasai-Sakai, A., Takata, T., Ueda, T., Takino, J., Tsutsumi, M., et al. (2015). Serum Levels of Toxic AGEs (TAGE) May Be a Promising Novel Biomarker in Development and Progression of NASH. Med. Hypotheses 84 (5), 490–493. doi: 10.1016/j.mehy.2015.02.002
Takeuchi, M., Yamagishi, S. (2008). Possible Involvement of Advanced Glycation End-Products (AGEs) in the Pathogenesis of Alzheimer’s Disease. Curr. Pharm. Des. 14, 973–978. doi: 10.2174/138161208784139693
Takino, J., Yamagishi, S., Takeuchi, M. (2010). Cancer Malignancy Is Enhanced by Glyceraldehyde-Derived Advanced Glycation End-Products. J. Oncol. 2010, 739852. doi: 10.1155/2010/739852
Takino, J., Yamagishi, S., Takeuchi, M. (2012). Glycer-AGEs-RAGE Signaling Enhances the Angiogenic Potential of Hepatocellular Carcinoma by Upregulating VEGF Expression. World J. Gastroenterol. 18, 1781–1788. doi: 10.3748/wjg.v18.i15.1781
Vabalas, A., Gowen, E., Poliakoff, E., Casson, A. J. (2019). Machine Learning Algorithm Validation With a Limited Sample Size. PLoS One 14, e0224365. doi: 10.1371/journal.pone.0224365
Wang, C. H., Wey, K. C., Mo, L. R., Chang, K. K., Lin, R. C., Kuo, J. J. (2015). Current Trends and Recent Advances in Diagnosis, Therapy, and Prevention of Hepatocellular Carcinoma. Asian Pac. J. Cancer Prev. 16, 3595–3604. doi: 10.7314/apjcp.2015.16.9.3595
Waziry, R., Hajarizadeh, B., Grebely, J., Amin, J., Law, M., Danta, M., et al. (2017). Hepatocellular Carcinoma Risk Following Direct-Acting Antiviral HCV Therapy: A Systematic Review, Meta-Analyses, and Meta-Regression. J. Hepatol. 67 (6), 1204–1212. doi: 10.1016/j.jhep.2017.07.025
Yamagishi, S., Maeda, S., Matsui, T., Ueda, S., Fukami, K., Okuda, S. (2012). Role of Advanced Glycation End Products (AGEs) and Oxidative Stress in Vascular Complications in Diabetes. Biochim. Biophys. Acta 1820, 663–671. doi: 10.1016/j.bbagen.2011.03.014
Yang, S. F., Chang, C. W., Wei, R. J., Shiue, Y. L., Wang, S. N., Yeh, Y. T. (2014). Involvement of DNA Damage Response Pathways in Hepatocellular Carcinoma. BioMed. Res. Int. 2014, 153867. doi: 10.1155/2014/153867
Yaser, A. M., Huang, Y., Zhou, R. R., Hu, G. S., Xiao, M. F., Huang, Z. B., et al. (2012). The Role of Receptor for Advanced Glycation End Products (RAGE) in the Proliferation of Hepatocellular Carcinoma. Int. J. Mol. Sci. 13, 5982–5997. doi: 10.3390/ijms13055982
Zhao, H. F., Wang, J., Tony To, S. S. (2015). The Phosphatidylinositol 3-Kinase/Akt and C-Jun N-Terminal Kinase Signaling in Cancer: Alliance or Contradiction? (Review). Int. J. Oncol. 47, 429–436. doi: 10.3892/ijo.2015.3052
Keywords: hepatocellular carcinoma, direct-acting antivirals, hepatitis C virus, advanced glycation end products, liver cirrhosis
Citation: Abdel-Razik A, Shabana W, El Nakib AM, Abdelsalam M, Abdelwahab A, Hasan AS, Elzehery R, Elhelaly R, Fathy AA, Mostafa SA, El-Wakeel N, Moemen D, Eldars W and Yassen AH (2021) De Novo Hepatocellular Carcinoma in Hepatitis C-Related Cirrhosis: Are Advanced Glycation End Products a Key Driver? Front. Cell. Infect. Microbiol. 11:662431. doi: 10.3389/fcimb.2021.662431
Received: 01 February 2021; Accepted: 23 August 2021;
Published: 01 October 2021.
Edited by:
Rinaldo Pellicano, Molinette Hospital, ItalyReviewed by:
Sharmila Fagoonee, Institute of Biostructure and Bioimaging (CNR), ItalyGian Paolo Caviglia, University of Turin, Italy
Copyright © 2021 Abdel-Razik, Shabana, El Nakib, Abdelsalam, Abdelwahab, Hasan, Elzehery, Elhelaly, Fathy, Mostafa, El-Wakeel, Moemen, Eldars and Yassen. This is an open-access article distributed under the terms of the Creative Commons Attribution License (CC BY). The use, distribution or reproduction in other forums is permitted, provided the original author(s) and the copyright owner(s) are credited and that the original publication in this journal is cited, in accordance with accepted academic practice. No use, distribution or reproduction is permitted which does not comply with these terms.
*Correspondence: Ahmed Abdel-Razik, QWhtZWRhYmRlbHJhemlrNzZAZ21haWwuY29torcid.org/0000-0001-9924-9727