 Riley K. Wells1,2†
 Braden P. Kunihiro2,3†Krit Phankitnirundorn4,5Rafael Peres1,2
 Trevor A. McCracken2Lesley Umeda1,2
 Rosa H. Lee2
 Dong Yoon Kim2Ruben Juarez4,5
 Alika K. Maunakea1,2*
- 1Department of Molecular Biosciences and Bioengineering, University of Hawaii at Manoa, Honolulu, HI, United States
- 2Department of Anatomy, Biochemistry, and Physiology, John A. Burns School of Medicine, Honolulu, HI, United States
- 3Institutional Development Awards (IDeA) Networks of Biomedical Research Excellence (INBRE), University of Hawaii at Manoa, Honolulu, HI, United States
- 4Department of Economics, University of Hawaii at Manoa, Honolulu, HI, United States
- 5University of Hawaii Economic Research Organization (UHERO), University of Hawaii at Manoa, Honolulu, HI, United States
Native Hawaiians and Pacific Islanders (NHPIs) suffer from higher prevalence of and mortality to type 2 diabetes mellitus (T2DM) than any other major race/ethnic group in Hawaii. Health inequities in this indigenous population was further exacerbated by the SARS-CoV-2 pandemic. T2DM progression and medical complications exacerbated by COVID-19 are partially regulated by the gut microbiome. However, there is limited understanding of the role of gut bacteria in the context of inflammation-related diseases of health disparities including T2DM and obesity. To address these gaps, we used a community-based research approach from a cohort enriched with NHPI residents on the island of Oahu, Hawaii (N=138). Gut microbiome profiling was achieved via 16s rDNA metagenomic sequencing analysis from stool DNA. Gut bacterial capacity for butyrate-kinase (BUK)-mediated fiber metabolism was assessed using quantitative PCR to measure the abundance of BUK DNA and RNA relative to total bacterial load per stool sample. In our cohort, age positively correlated with hemoglobin A1c (%; R=0.39; P<0.001) and body mass index (BMI; R=0.28; P<0.001). The relative abundance of major gut bacterial phyla significantly varied across age groups, including Bacteroidetes (P<0.001), Actinobacteria (P=0.007), and Proteobacteria (P=0.008). A1c was negatively correlated with the relative levels of BUK DNA copy number (R=-0.17; P=0.071) and gene expression (R=-0.33; P=0.003). Interestingly, we identified specific genera of gut bacteria potentially mediating the effects of diet on metabolic health in this cohort. Additionally, α-diversity among gut bacterial genera significantly varied across T2DM and BMI categories. Together, these results provide insight into age-related differences in gut bacteria that may influence T2DM and obesity in NHPIs. Furthermore, we observed overlapping patterns between gut bacteria and T2DM risk factors, indicating more nuanced, interdependent interactions among these factors as partial determinants of health outcomes. This study adds to the paucity of NHPI-specific data to further elucidate the biological characteristics associated with pre-existing health inequities in this racial/ethnic group that is significantly underrepresented in biomedical research.
1 Introduction
Native Hawaiians and Pacific Islanders (NHPIs) suffer from a disproportionately higher prevalence of and mortality to type 2 diabetes mellitus (T2DM) than any other major race/ethnic group in Hawaii (Hawaii State Department of Health, 2019). In 2018, the age-adjusted diabetes death rate among NHPIs was reported at 48.1% - over 2.5 times higher than that of the general state population (Centers for Disease Control and Prevention [CDC], 2018). The following year, NHPIs accounted for 31.2% of reported diabetic cases among Hawaii residents. T2DM prevalence among NHPIs increases annually at a rate comparably faster than that of other racial/ethnic groups in the state (Uchima et al., 2019). In addition, this pre-existing health disparity has been implicated as a determinant of the heightened risk to severe COVID-19 (Gregory et al., 2020; Penaia et al., 2021; Zhou et al., 2021).
Given that health disparities including T2DM and severe COVID-19 are also compounded by data disparities arising from underrepresentation of NHPIs and other minority race/ethnic populations in biomedical research (McElfish et al., 2019; Uchima et al., 2019; Wang et al., 2020; Kamaka et al., 2021: Penaia et al., 2021), understanding the relationships between established or emerging biomarkers and anthropometric data relevant to cardiometabolic health in these populations are urgently needed. There are several established and emerging clinical indicators of cardiometabolic health, however the degree of variability of these indicators and their relationship to T2DM risk remain understudied in the NHPI population (Kamaka et al., 2021). Of the established indicators, the percentage of glycosylated hemoglobin A1c in blood has now become a wide-spread, point-of-care diagnostic standard for T2DM, where A1c levels are stratified into non-diabetic (less than 5.7%), pre-diabetic (between 5.7% and 6.5%), and diabetic (greater than 6.5%) categories (American Diabetes Association, 2021). Body mass index (BMI; kg/m2) scores are similarly considered indicative of cardiometabolic health upon stratification into normal (less than 25), overweight (between 25 and 30), and obese (greater than 30) categories (CDC, 2021). However, the applicability of BMI as an indicator of cardiometabolic health outcomes has been demonstrated to vary with age and ethnicity (Uchima et al., 2019).
A developing indicator of cardiometabolic health of increasing interest to clinical and biomedical research studies is the gut microbiome (Everard and Cani, 2013; Panwar et al., 2013; Tilg and Moschen, 2014; Upadhyaya and Banerjee, 2015; Gomez-Arango et al., 2016; Wen and Duffy, 2017; Chen et al., 2021). Recent metagenome-wide association studies have implicated the bidirectional relationship between the gut microbiome and host physiology as a partial determinant of cardiometabolic health outcomes (Tilg and Moschen, 2014; Upadhyaya and Banerjee, 2015; Chen et al., 2021). Exploratory, diet-based interventions leveraging this relationship have demonstrated sufficiency in enhancing blood glucose homeostasis (Panwar et al., 2013). This phenomenon is partially mediated by serum metabolites originating from gut microbes, many of which have been identified as direct determinants of T2DM pathophysiology and adjacent complications (Arpaia et al., 2013; Panwar et al., 2013; Wen and Duffy, 2017; Wang et al., 2018; Chen et al., 2021).
One such metabolite is butyrate, a short-chain fatty acid (SCFA) byproduct of bacterial fiber metabolism (Roediger, 1980; Arpaia et al., 2013; Menni et al., 2020). While prior studies have reported a negative relationship between the relative abundance of butyrate-producing bacteria and T2DM risk (Arora and Tremaroli, 2021), dynamic interactions among gut bacterial butyrate metabolism and cardiometabolic health outcomes in NHPIs is unclear (De la Cuesta-Zuluaga et al., 2019). Dietary adjustment is a non-invasive therapeutic strategy for modulating gut microbiome dynamics (Panwar et al., 2013; Karmally and Goldberg, 2021). Fiber-rich dietary tendencies have been demonstrated to reduce A1c levels (Panwar et al., 2013; Fu et al., 2022) and systemic inflammation (Nastasi et al., 2015; Wen and Duffy, 2017; Scheithauer et al., 2020), suggested in reducing T2DM risk. However, the relationship among dietary habits, gut bacterial population dynamics, and T2DM risk factors in NHPI populations is unknown and hinders efforts to comprehensively understand T2DM and obesity health disparities in this population (Kamaka et al., 2021). To address this gap in knowledge, we characterized the variability of the gut microbiome in a NHPI-enriched cohort in Hawaii with extensive anthropometric and other health-related data.
2 Materials and methods
2.1 Human subjects data collection
IRB approval was obtained from the University of Hawaii Institutional Review Board (UH IRB) under protocol number 2019-00376. All laboratory procedures were evaluated and approved by the Hawaii Institutional Biosafety Committee, under protocol number B22-100652.
Participants included in this cohort study (N=138; aged 16 to 79 years) mainly resided in one of two NHPI-enriched communities on Oahu, Hawaii (Waianae and Palolo). Informed consent, sociodemographic information, medical history, and behavioral risk factor data were collected using self-reported survey responses. Personal information was de-identified for each participant through assignment of unique numerical ID. Biometric data including height, weight, and A1c (PTS Diagnostics, Whitestown, IN) were collected upon survey completion. T2DM categories (non-diabetic, pre-diabetic, diabetic) and BMI categories (healthy, overweight, obese) were defined using A1c and BMI value cut points recommended by the American Diabetes Association (ADA) and the Centers for Disease Control and Prevention (CDC), respectively.
2.2 Stool sample storage and processing
Home stool sample self-collection kits were distributed to participants upon biometric data collection. Each kit included one sample tube containing RNAlater (5 ml; a sample preservative supplied by Thermofisher Scientific, Waltham, MA). Instructions for proper sample collection and storage (-20°C) were provided verbally and in print. Samples were submitted by mail or collected by a community facilitator within one week of biometric data collection.
DNA and RNA were simultaneously isolated using the AllPrep PowerFecal DNA/RNA Kit (Qiagen Inc., Valencia, CA, USA) and stored in -80°C until further processing. Quality and concentration of nucleic acid yields were assessed using the NanoDrop Microvolume Spectrophotometer (ThermoFisher Scientific, Waltham, MA, USA). An overview of workflow methodology for stool sample processing and analyses are illustrated in Figure 1.

Figure 1 Overview of methodology for stool sample processing.
2.3 16s metagenomic sequencing
DNA (40 ng) isolated from each stool sample were subjected to polymerase chain reaction (PCR) amplification targeting 16s rDNA hypervariable regions V2-4 and V6-9 (Figure 2; Ion Torrent 16s Metagenomics Kit; Thermo Fisher Scientific, Warrington, England).

Figure 2 ThermoFisher 16s rDNA hypervariable region (hvr) proprietary PCR primer coverage (Barb et al., 2016). Arrows are representative of target binding sites and directionality of amplification. Primer set 1 achieves amplification of hvr V3, V6, V7, and V9. Primer set 2 achieves amplification of hvr V2, V4, and V8.
Amplicon products were pooled (20 uL per primer set), purified (Agencourt Ampure XP Kit; Beckman Coulter, Brea, CA, USA), and quantified using the Qubit dsDNA BR Assay (ThermoFisher Scientific, Warrington, England). 16s rDNA libraries were prepared from 150 ng of pooled amplicons (Ion Plus Fragment Library Kit; Thermo Fisher Scientific, Austin, TX, USA) and barcoded using Ion Xpress Barcode Adapters (Life Technologies, Carlsbad, CA, USA). DNA libraries were pooled (80 pmol from up to 60 libraries) and loaded onto Ion 530™ chips (Ion S5 Next-Generation Sequencing System) in preparation for sequencing.
16s Metagenomics Kit analysis was performed using Ion Reporter™ Software v5.18.4.0 (ThermoFisher Scientific). Chimeric sequences were automatically identified and removed. Reads were mapped to reference databases Greengenes v13.5 and MicroSEQ ID v3.0. Gut microbiome profiles were compiled using metagenome taxonomic data via the Curated MicroSEQ(R) 16S Reference Library v2013.1. Raw abundance values were subsampled at 10,000 reads per sample to control for inequivalent read numbers across samples. Subsampling was performed on the species-level operational taxonomic unit (OTU) table via the rrarefy function of the vegan R package (Oksanen et al., 2022). Samples with less than 10,000 total reads were excluded from the dataset. Upstream taxonomic ranks were determined by systematically comparing family-level OTU data to the NCBI database via the classification function of the taxize R package (Chamberlain et al., 2020). Family-level OTU table was the preferred classification input due to large amounts of unclassified upstream classifications when using genus and species-level OTU tables. Genus and species-level OTU tables were joined onto the family-OTU table to form a comprehensive taxonomic classification. Subsampled reads on the species-level were converted to per-sample relative abundance values via the “transform” function of the microbiome R package (Lahti and Shetty, 2019). Shannon, Simpson and Chao-1 α-diversity values were computed via IonReporter v5.18.4.0.
2.4 Measuring BUK-mediated butyrate metabolism
RNA (40 ng per sample) isolated from stool specimens were converted to cDNA using SuperScript IV VILO Master Mix with ezDNase™ Enzyme (Thermo Fisher Scientific, Waltham, MA, USA). PCR primers were synthesized (Thermo Fisher Scientific, Custom DNA Oligos Synthesis Services, Waltham, MA, USA) using butyrate kinase (BUK) as a gene target. DNA and cDNA yields (20 uL per sample) were subjected to quantitative PCR (qPCR; PerfeCTa SYBR Green FastMix, Quantabio, Beverly, MA, USA) in duplicate reactions on 96-well plates using the StepOnePlus Real-Time PCR instrument (Thermo Fisher Scientific, Waltham, MA, USA). Thermal cycling was programmed as follows: 95°C for 2 min; 40 cycles of 55°C for 15 sec followed by 72°C for 1 min with a hold at 4°C for later storage. Target concentration was calculated using qPCR using the delta-Ct method.
Gut bacterial SCFA metabolic pathways primarily result in synthesis of acetate, propionate, and butyrate (Louis and Flint, 2017). Three bacterial enzymes have been identified as main catalysts for the final step in butyrate synthetic pathways: acetyl-Coenzyme A (CoA):acetoacetyl-CoA transferase (ATO), butyryl-CoA:acetate CoA-transferase (BUT), and butyrate kinase (BUK) (Anand et al., 2016). While expression and activity of any of these three enzymes may provide insight into bacterial butyrate production capacity, CoA-transferases commonly exhibit broad substrate specificity (Louis and Flint, 2017). BUT isolated from Roseburia hominis serves as a relevant example of this phenomenon, where although it has been identified as the bacterium’s primary catalyst for butyrate production, its dual affinity for propionyl-CoA and butyryl-CoA enable participation in multiple SCFA synthetic pathways (Charrier et al., 2006).
Although microenvironmental conditions may shift enzymatic substrate preferences for butyrate-producing CoA-transferases BUT and ATO (Diez-Gonzalez et al., 1999; Sauer and Eikmanns, 2005; Sato et al., 2016), BUK participates in butyrate synthesis via the hydrolytic conversion of a phosphorylated intermediate butyryl-phosphate (Eeckhaut et al., 2011; Anand et al., 2016). While a similar reaction step is mediated by acetate kinase (ACK; Hartmanis and Gatenbeck, 1984), BUK is distinct from ACK in its substrate specificity for butyryl-phosphate rather than other SCFA precursors or long-chain fatty acid (LCFA) precursors (Sirobhushanam et al., 2017; Bui et al., 2021; Imdad et al., 2022). For the purpose of this study, we focused on measuring the abundance of BUK gene copies and transcriptional products to investigate butyrate metabolism and its relationship with T2DM-related health outcomes among NHPI communities.
BUK qPCR primers were designed as previously described by Gomez-Arango et al., 2016: Forward: 5′ - TGCTGTWGTTGGWAGAGGYGGA - 3′; Reverse: 5′ - GCAACIGCYTTTTGATTTAATGCATGG - 3’.
BUK quantitation was normalized against concurrent amplification by universal 16s qPCR primers (labeled “BAC”) as a proxy for total bacterial load. BAC primers were designed as previously described by Castillo et al., 2006: 63F: 5′ - GCAGGCCTAACACATGCAAGTC - 3′; 355R: 5′ - CTGCTGCCTCCCGTAGGAGT - 3’
2.5 Data analysis
Intergroup comparisons of nominal distributions of biometric data were performed using Kruskal-Wallis one-way analysis of variance (ANOVA), followed by Dunn’s Multiple Comparison Test. P-values for multiple comparisons were adjusted via the Benjamini-Hochberg method. Categorical distributions were analyzed using Pearson’s chi-squared tests for independence. Relationships between variables were measured using Spearman rank-order correlation coefficients (R Core Team, 2021). Data was visualized via ggplot2 and ggpubr packages (Kassambara, 2020). Due to conceptual and technical limitations around integration of molecular and anthropometric variables, and sample size, statistical significance was determined at P<0.05 for molecular data analyses, and at P<0.10 for exploratory analyses with anthropometric variables. A flowchart describing quality control and inclusion/exclusion criteria used to arrive at the reported dataset is provided in Figure S1.
3 Results
3.1 Dynamic interactions among T2DM risk factors in NHPIs
Descriptive statistics summarizing our NHPI-enriched cohort are provided in Table 1. To control for considerable variance in age among participants (σ2= 288.3), the total study population was subdivided into four age groups: Early Adulthood (EA; 16-20 years), Young Adulthood (YA; 21-35 years), Mid-Adulthood (MA; 36-55 years), and Late Adulthood (LA; 56+ years). Individual membership to T2DM (Figure 3A; X2=25.5, P<0.001) and BMI (Figure 3B; X2=16.9, P=0.010) categories significantly varied across age groups. Furthermore, differences between EA-YA and MA-LA individuals were observed for both A1c (Figure 3C) and BMI (Figure 3D). A1c (P<0.001) and BMI (P=0.005) values both differed between age groups, increasing significantly across successively older groups.
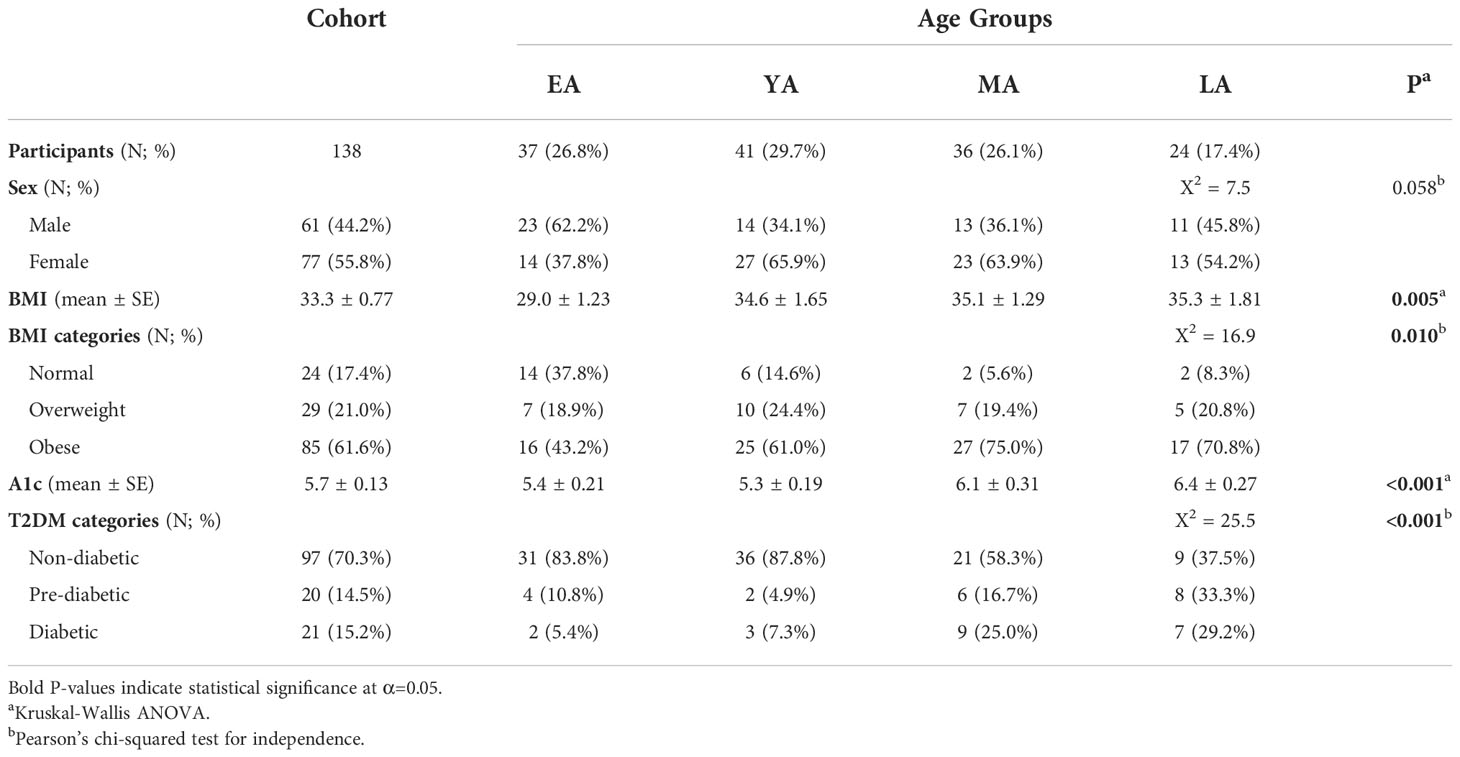
Table 1 Sociodemographic and biometric summary of the NHPI-enriched cohort stratified by age into four groups: Early Adulthood (EA; aged 16-20 years), Young Adulthood (YA; aged 21-35 years), Mid-Adulthood (MA; aged 36-55 years), and Late Adulthood (LA; aged 56-80 years).
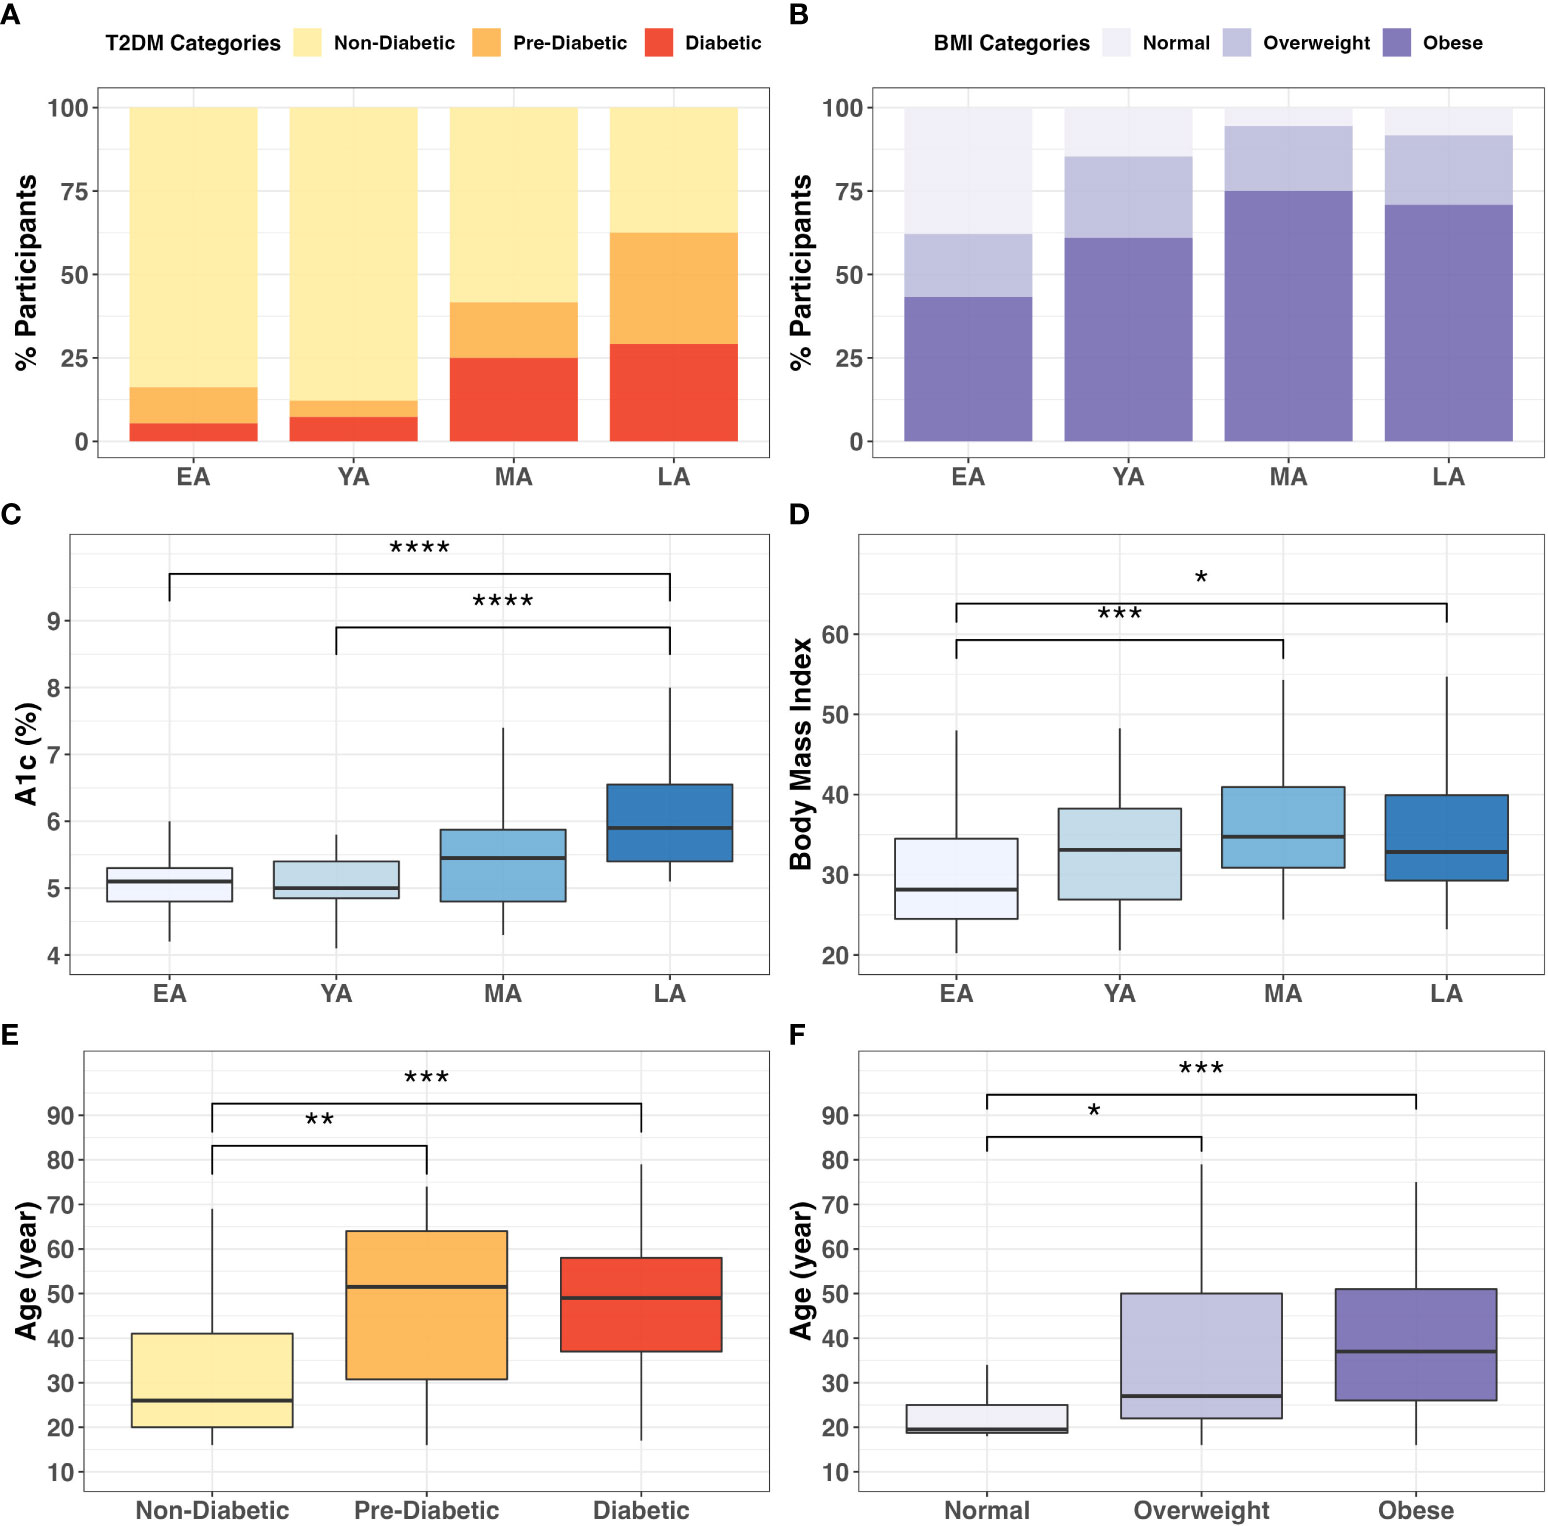
Figure 3 Categorical associations between age, T2DM, and BMI. The proportion individuals in the cohort in (A) T2DM (X2 = 27.6; P<0.001) and (B) BMI categories (X2 = 17.8; P<0.001) varied significantly across age groups. Intergroup comparison demonstrated significantly different (C) A1c (P<0.0001) and (D) BMI (P=0.005) values across age groups. Additionally, participant age significantly differed across (E) T2DM (P<0.001) and (F) BMI (P=0.001) categories. * = P<0.05; ** = P<0.01; *** = P<0.001; ****= P<0.0001.
These differences were verified by direct intergroup comparisons for T2DM (Figure 3E; P<0.001) and BMI (Figure 3F; P=0.001) categories. In our cohort, age increased across successive T2DM categories, as diabetics (P<0.001) and pre-diabetics (P<0.01) tended to be older than non-diabetic individuals (Figure 3E). Similarly, individuals in the obese (P<0.001) and overweight (P<0.01) BMI categories tended to be older than individuals with normal BMI (Figure 3F). These consistent and notable age-associated trends among T2DM risk and obesity reinforce conclusions from previous literature regarding the importance of age stratification in NHPI populations (Uchima et al., 2019).
3.2 Gut microbial population dynamics among T2DM risk factors
Relationships between gut bacterial taxa and age, T2DM risk, and BMI are summarized in Table 2. Taxa described as butyrate-producers in previous literature are denoted by an asterisk (Louis and Flint, 2009; Vital et al., 2014; van den Berg et al., 2021; Das et al., 2022; Jaagura et al., 2022; Lee et al., 2022; Sasaki et al., 2022). As an exploratory measure, we chose to consider gut bacterial relationships with biometric data at statistical significance of P<0.10. The average relative abundance of identified gut bacterial phyla across age groups, T2DM categories, and BMI categories is summarized in Figure 4.
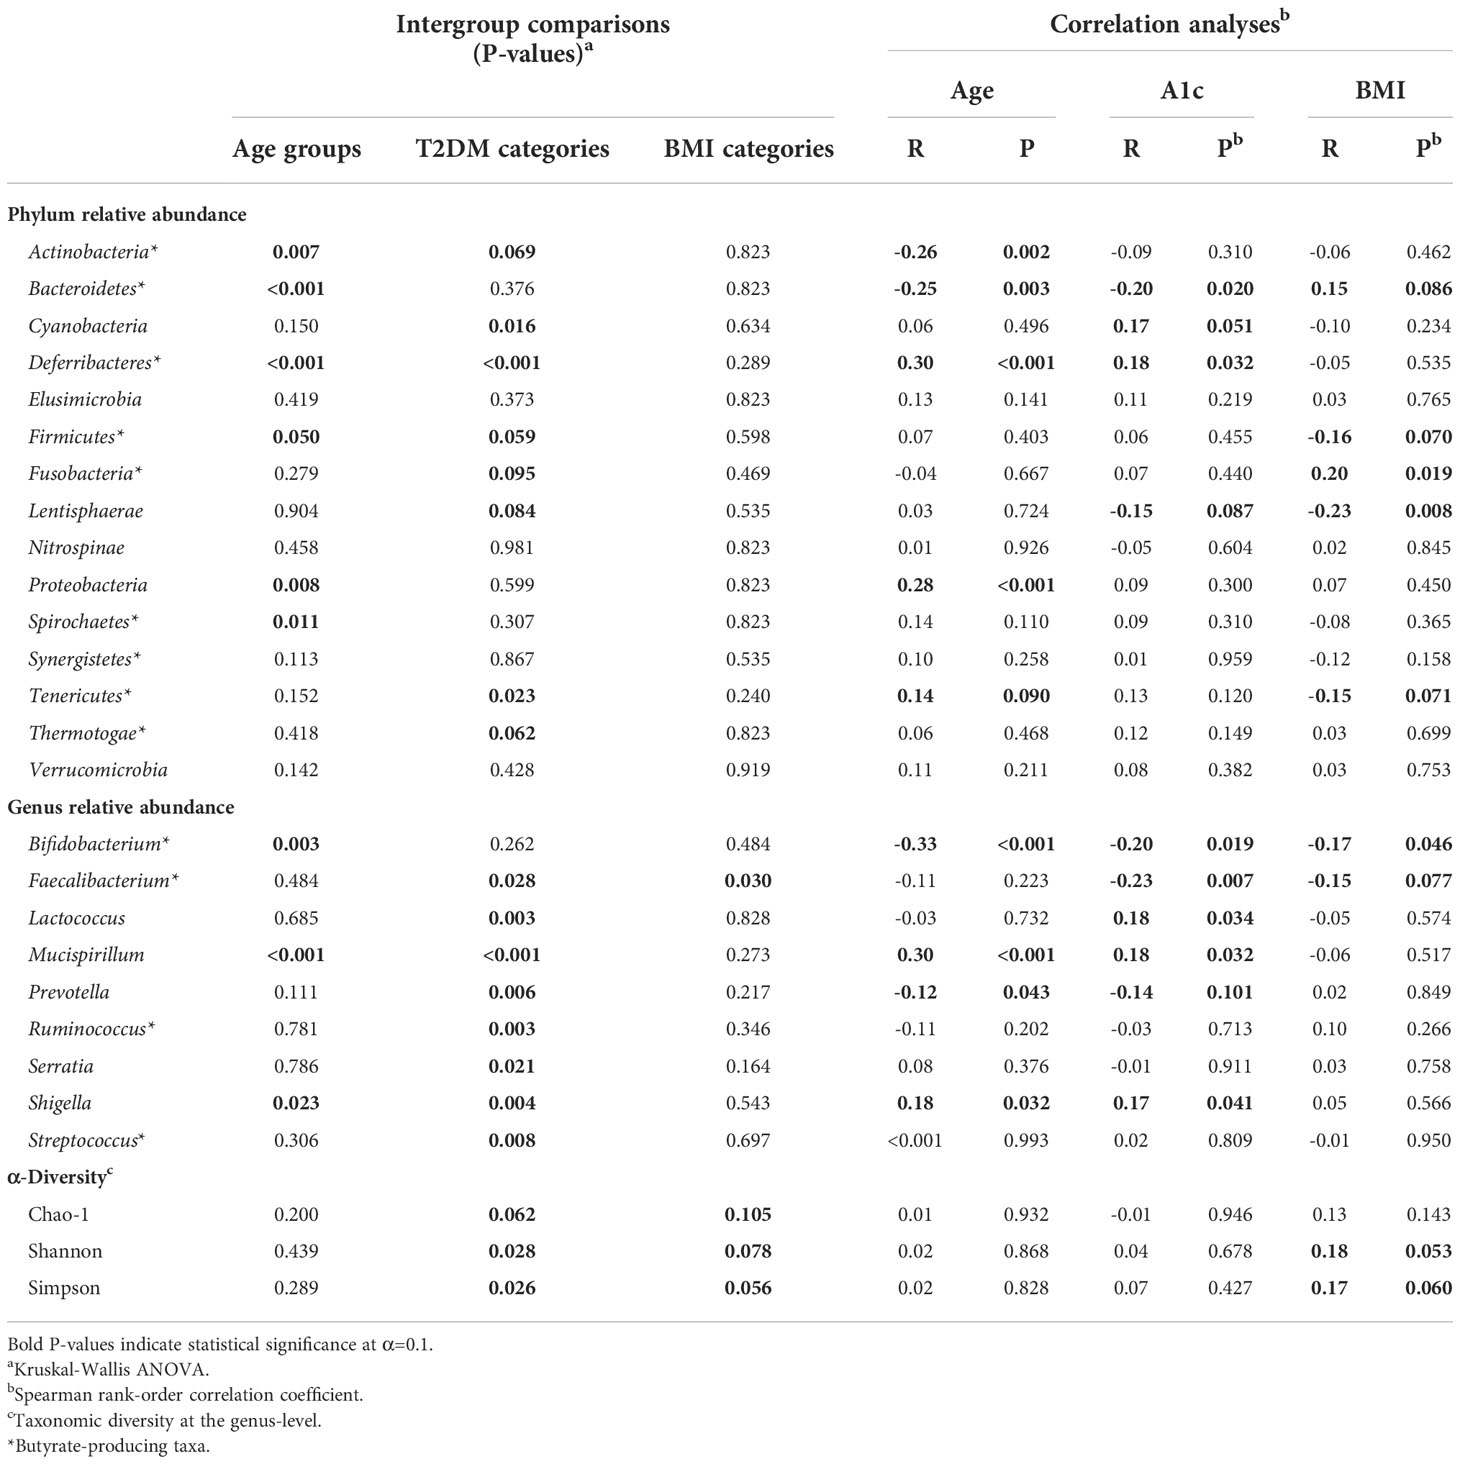
Table 2 Intergroup comparisons and correlation analyses for gut bacterial population distribution across age groups, T2DM categories, and BMI categories.
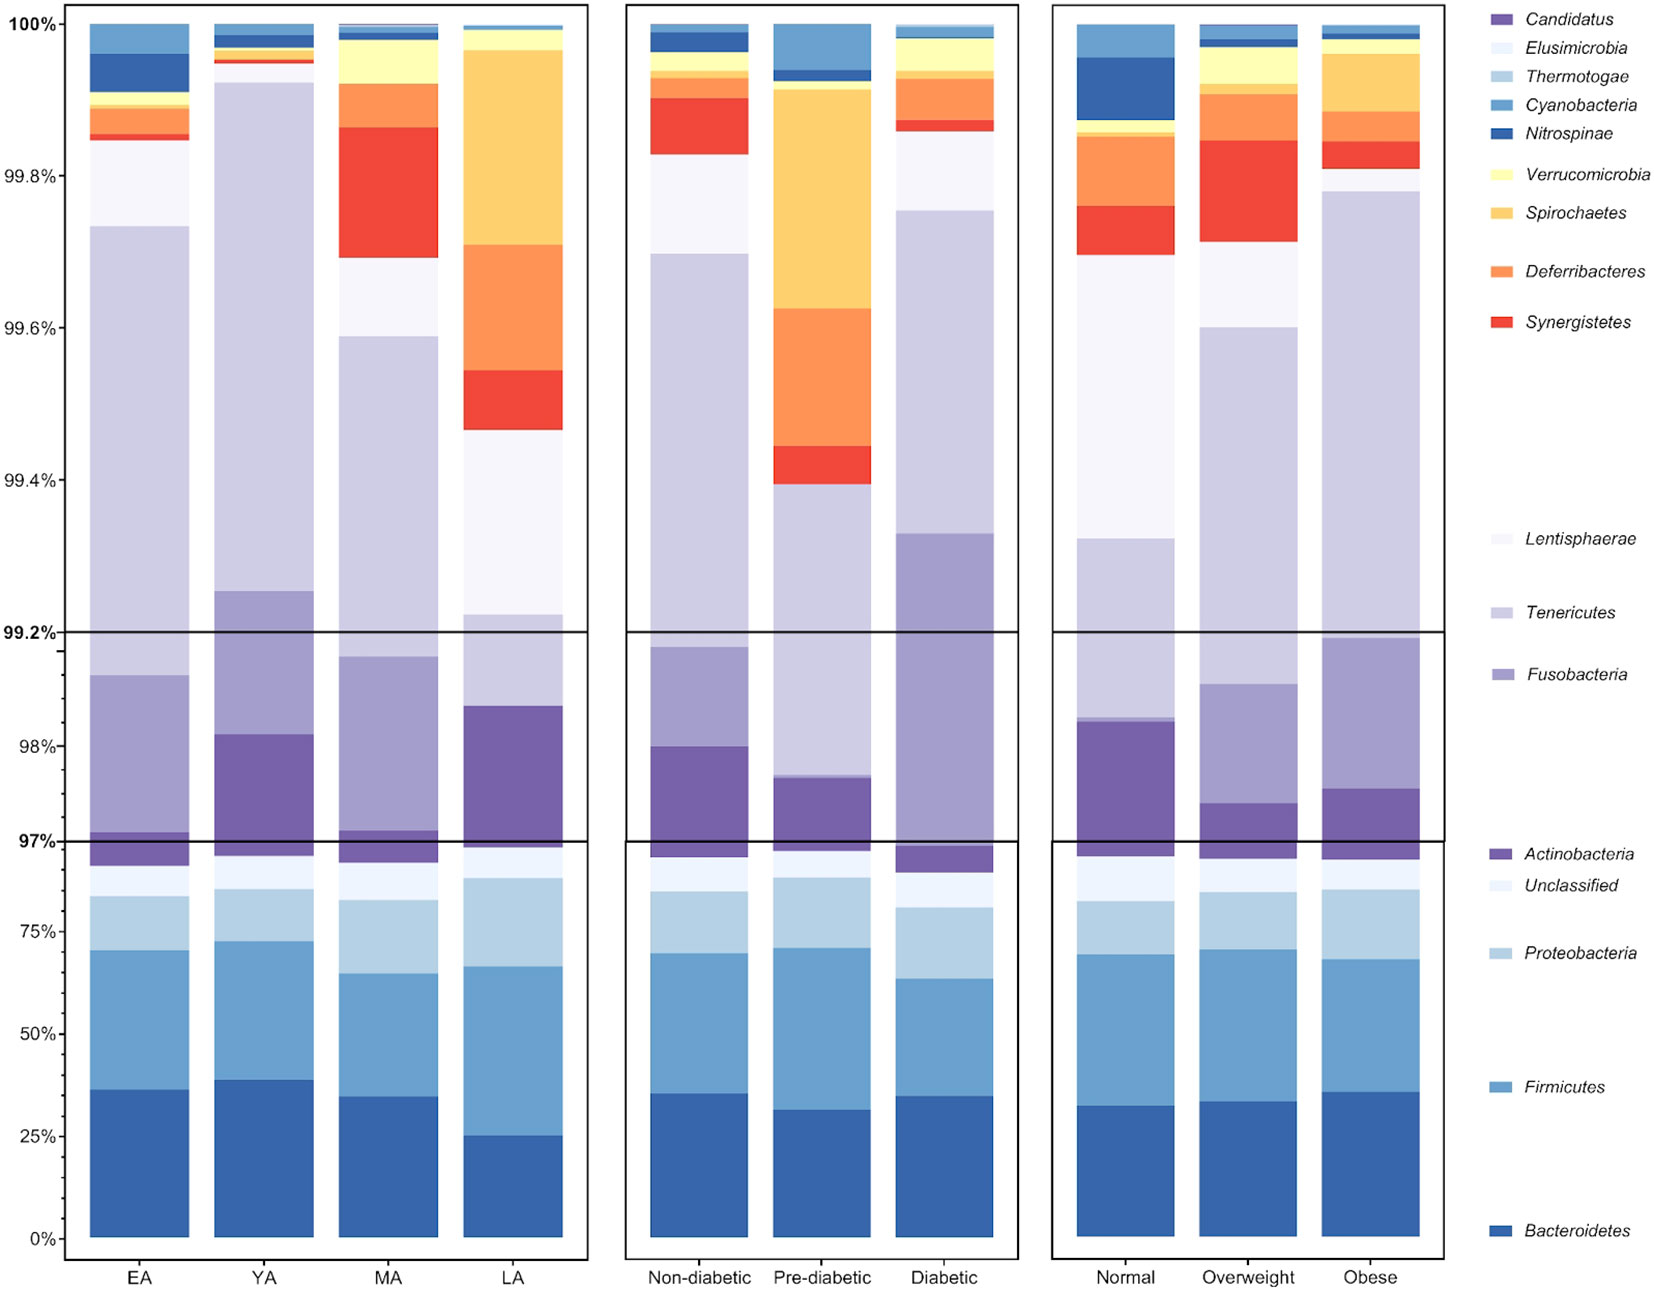
Figure 4 Average relative abundance of gut bacterial phyla across age groups, T2DM categories, and BMI categories. Bacterial phyla Bacteroidetes, Firmicutes, Proteobacteria, and Actinobacteria (among unclassified bacteria) largely compose an average of roughly 97% of the gut bacterial population in each group. The remaining 3% of gut bacteria are largely composed of members belonging to 12 additionally identified phyla: Fusobacteria, Tenericutes, Lentisphaerae, Synergistetes, Deferribacteres, Spirochaetes, Verrucomicrobia, Nitrospinae, Cyanobacteria, Thermotogae, Elusimicrobia, and Candidatus Thermoplasmatota.
Age group comparisons for the relative abundance of four major gut bacterial phyla are illustrated in Figure 5. The relative abundance of Bacteroidetes (Figure 5A; P<0.001), Firmicutes (Figure 5B; P=0.050), Actinobacteria (Figure 5C; P=0.007), Proteobacteria (Figure 5D; P=0.008), Deferribacteres (P<0.001), and Spirochaetes (P=0.011) significantly differed across age groups. Among these relationships, significant correlations were observed between age and Actinobacteria (R=-0.26, P=0.002), Bacteroidetes (R=-0.25; P=0.003), Deferribacteres (R=0.30; P<0.001), and Proteobacteria (R=0.28; P<0.001). It should be noted that Proteobacteria uniquely exhibited a significant correlation with age and differential relative abundance across age groups without demonstrating strong direct associations with indicators of T2DM risk or BMI.
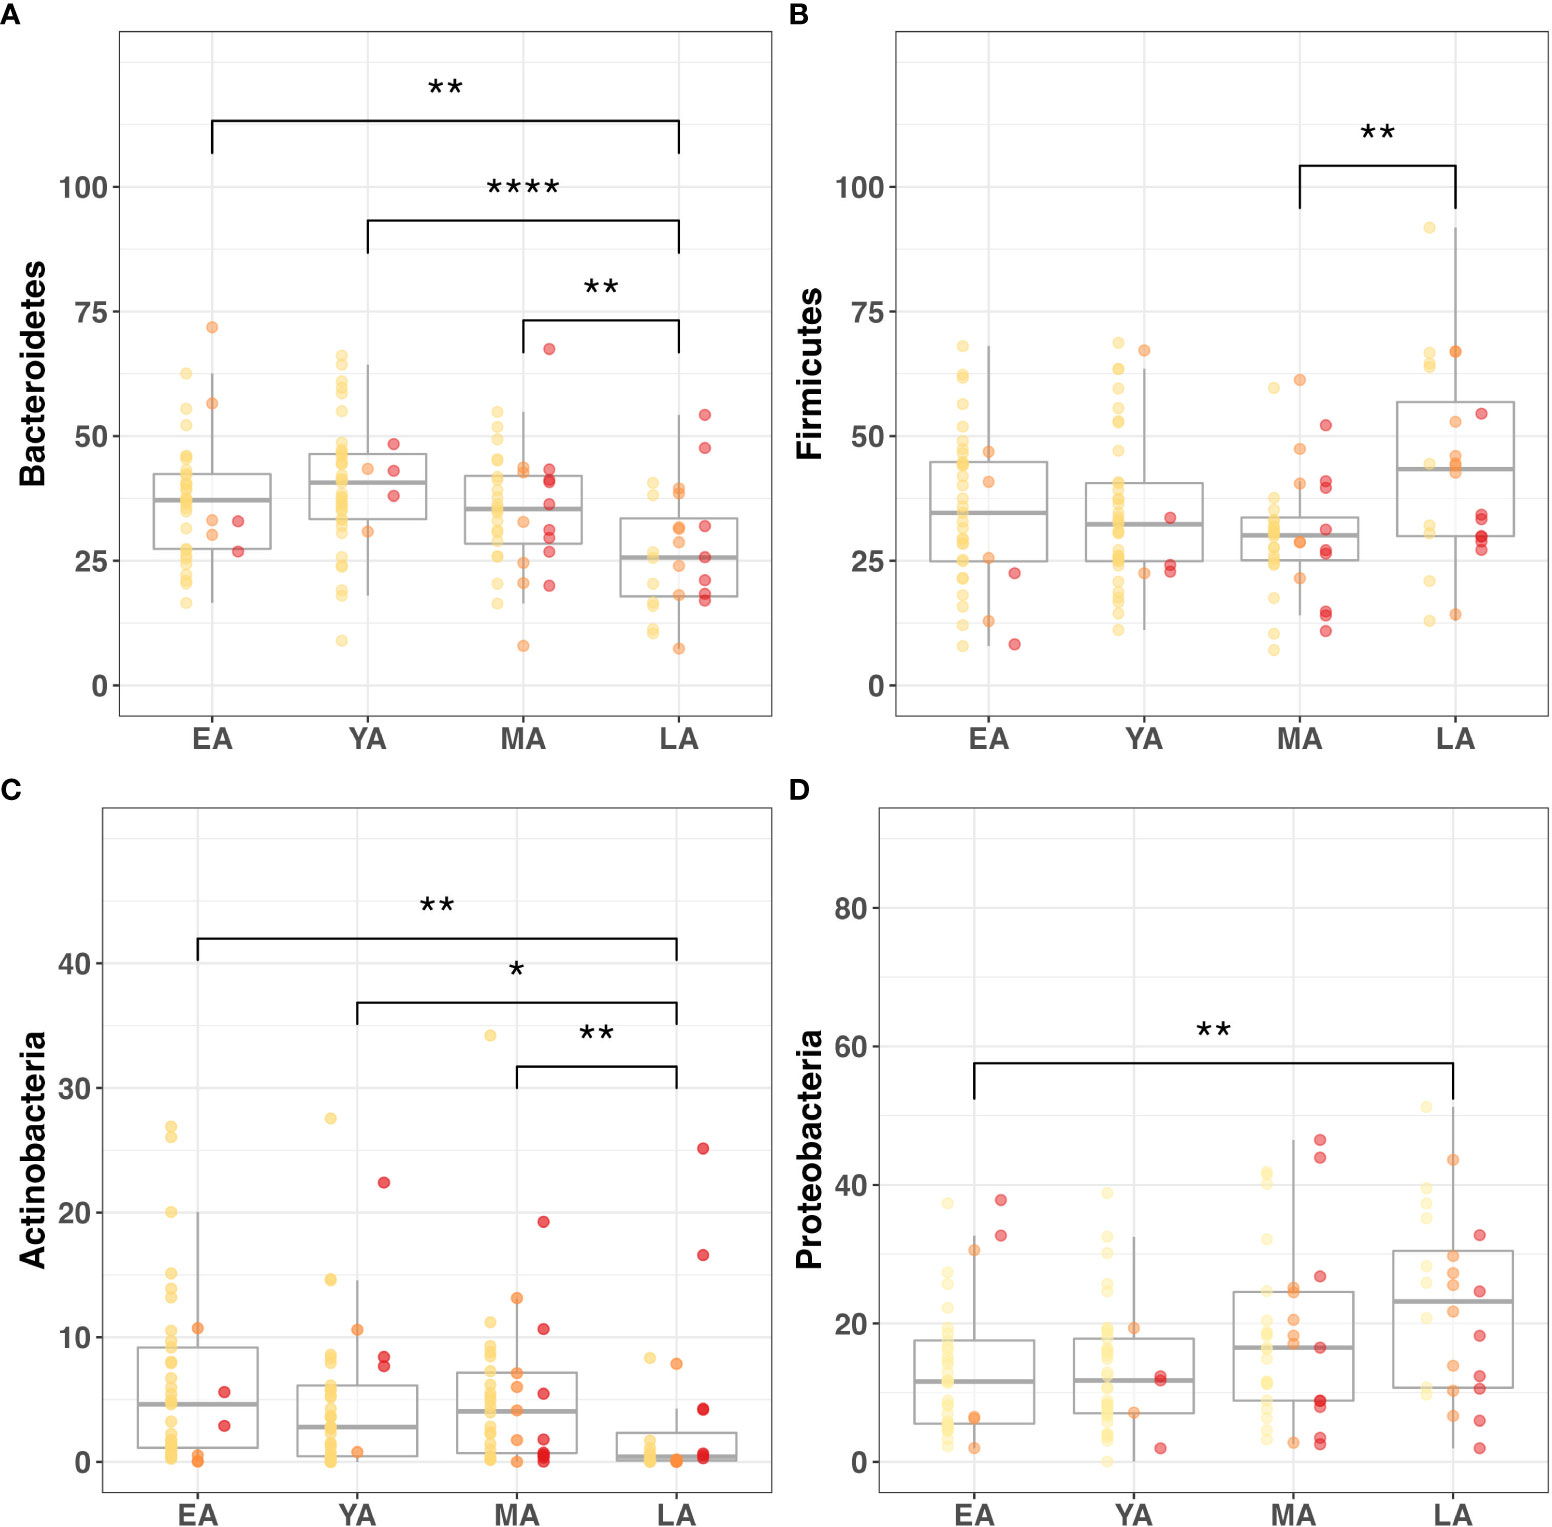
Figure 5 Gut microbiome composition dynamics upon age stratification. Graphical representation of significantly different relative abundance of four major gut bacterial phyla across age groups. Color-coded indications of individual data points categorized by T2DM risk: non-diabetic (yellow), pre-diabetic (orange), and diabetic (red). Visualized phyla include (A) Bacteroidetes, (B) Firmicutes, (C) Actinobacteria, (D) Proteobacteria. Statistical significance denoted in figures above using asterisks as follows: * (P<0.05); ** (P<0.01); **** (P<0.0001).
Age also demonstrated a marginally positive correlation with the relative abundance of Tenericutes (R=0.14; P=0.090). While this relationship with age uniquely accompanied a negative correlation with BMI (R=-0.15; P=0.077), intergroup variance for relative Tenericutes abundance was nonsignificant for age groups (P=0.152) and BMI categories (P=0.240). Interestingly, its relative abundance significantly varied across T2DM categories (P=0.023) while no such relationship was observed with nominal A1c values (P=0.120).
The relative abundance of Actinobacteria (P=0.069), Cyanobacteria (P=0.016), Deferribacteres (P<0.001), Firmicutes (P=0.059), Fusobacteria (P=0.095), Lentisphaerae (P=0.084), Tenericutes (P=0.023) and Thermotogae (P=0.062) significantly differed across T2DM categories. Among these trends, A1c significantly correlated with Cyanobacteria (R=0.17; P=0.051) and Deferribacteres (R=0.18; P=0.032), possibly suggesting an influential or bidirectional relationship between glucose homeostasis and gut bacterial members of these two phyla. Additionally, A1c correlated negatively with the relative abundance of Lentisphaerae (R=-0.15; P=0.087). This phylum had a notably parallel relationship with BMI (R=-0.23; P=0.008), exhibiting consistently negative directionality between increasing glycemia and obesity. However, implications of this integrated functional relevance coincide with nonsignificant variance in relative Lentisphaerae abundance across BMI categories (P=0.535).
Relative Bacteroidetes abundance similarly exhibited overlapping correlations with A1c and BMI. Relative Bacteroidetes abundance was observed to simultaneously decrease with glycemia (R=-0.20; P=0.020) and increase with obesity (R=0.15; P=0.086). Although relative abundance of this phylum did not significantly vary across T2DM (P=0.376) and BMI (P=0.823) categories, it uniquely correlated with age, A1c, and BMI.
Genera that were differentially abundant across age groups included Bifidobacterium (P=0.003), Mucispirillum (P<0.001) and Shigella (P=0.023). Of these genera, Bifidobacterium (R=-0.33; P<0.001) correlated negatively with age, while Mucispirillum (R=0.301; P<0.001) and Shigella (R=0.182; P=0.032) correlated positively. While it demonstrated no statistical difference across age groups, the relative abundance of Prevotella also correlated negatively with age (R=-0.17; P=0.043). Notably, each of these age-related genera demonstrated parallel correlations to A1c.
Genera exhibiting significant correlations to A1c included Bifidobacterium (P=-0.20; 0.019), Faecalibacterium (R=-0.23; P=0.007), Lactococcus (R=0.18; P=0.034), Mucispirillum (R=0.18; P=0.032), Prevotella (R=-0.14; P=0.101), and Shigella (R=0.17; P=0.041). The relative abundance of all genera discussed for the purpose of this study distributed differentially across T2DM groups except one, Bifidobacterium, the only genus to simultaneously exhibit negative correlations among age, A1c, and BMI (R=-0.017; P=0.046). The only other observed genus to simultaneously correlate with A1c and BMI in relative abundance was Faecalibacterium (R=-0.15; P=0.077), which was unique in its differential distribution across both T2DM (P=0.028) and BMI (P=0.030) categories. Notably, Faecalibacterium was the only taxon among reported phyla and genera with significant differences in abundance across BMI categories. While seemingly specific interactions with T2DM risk were observed for Lactococcus (P=0.003), Ruminococcus (P=0.003), Serratia (P=0.021), and Streptococcus (P=0.008), Lactococcus uniquely exhibited a corresponding correlation with A1c levels (R=0.18; P=0.034).
We then applied Dunn’s post-hoc test for multiple-comparisons to the genus-level α-diversity indices across age, T2DM risk and BMI categories, summarized in Figure 6. Chao-1 did not differ between age, T2DM risk and BMI groups (Figures 6A-C). Shannon index values did not significantly vary between age groups (Figure 6D) but were significantly higher in diabetics compared to non-diabetics (P=0.042) and pre-diabetics (P=0.018) (Figure 6E), and similarly higher in obese individuals compared to overweight individuals (P=0.031) (Figure 6F). Simpson index values demonstrated intergroup significance in all three categorical variables, EA and YA age groups (P=0.042) (Figure 6G), pre-diabetics and diabetics (P=0.018) and between overweight and obese (P=0.021) participants.
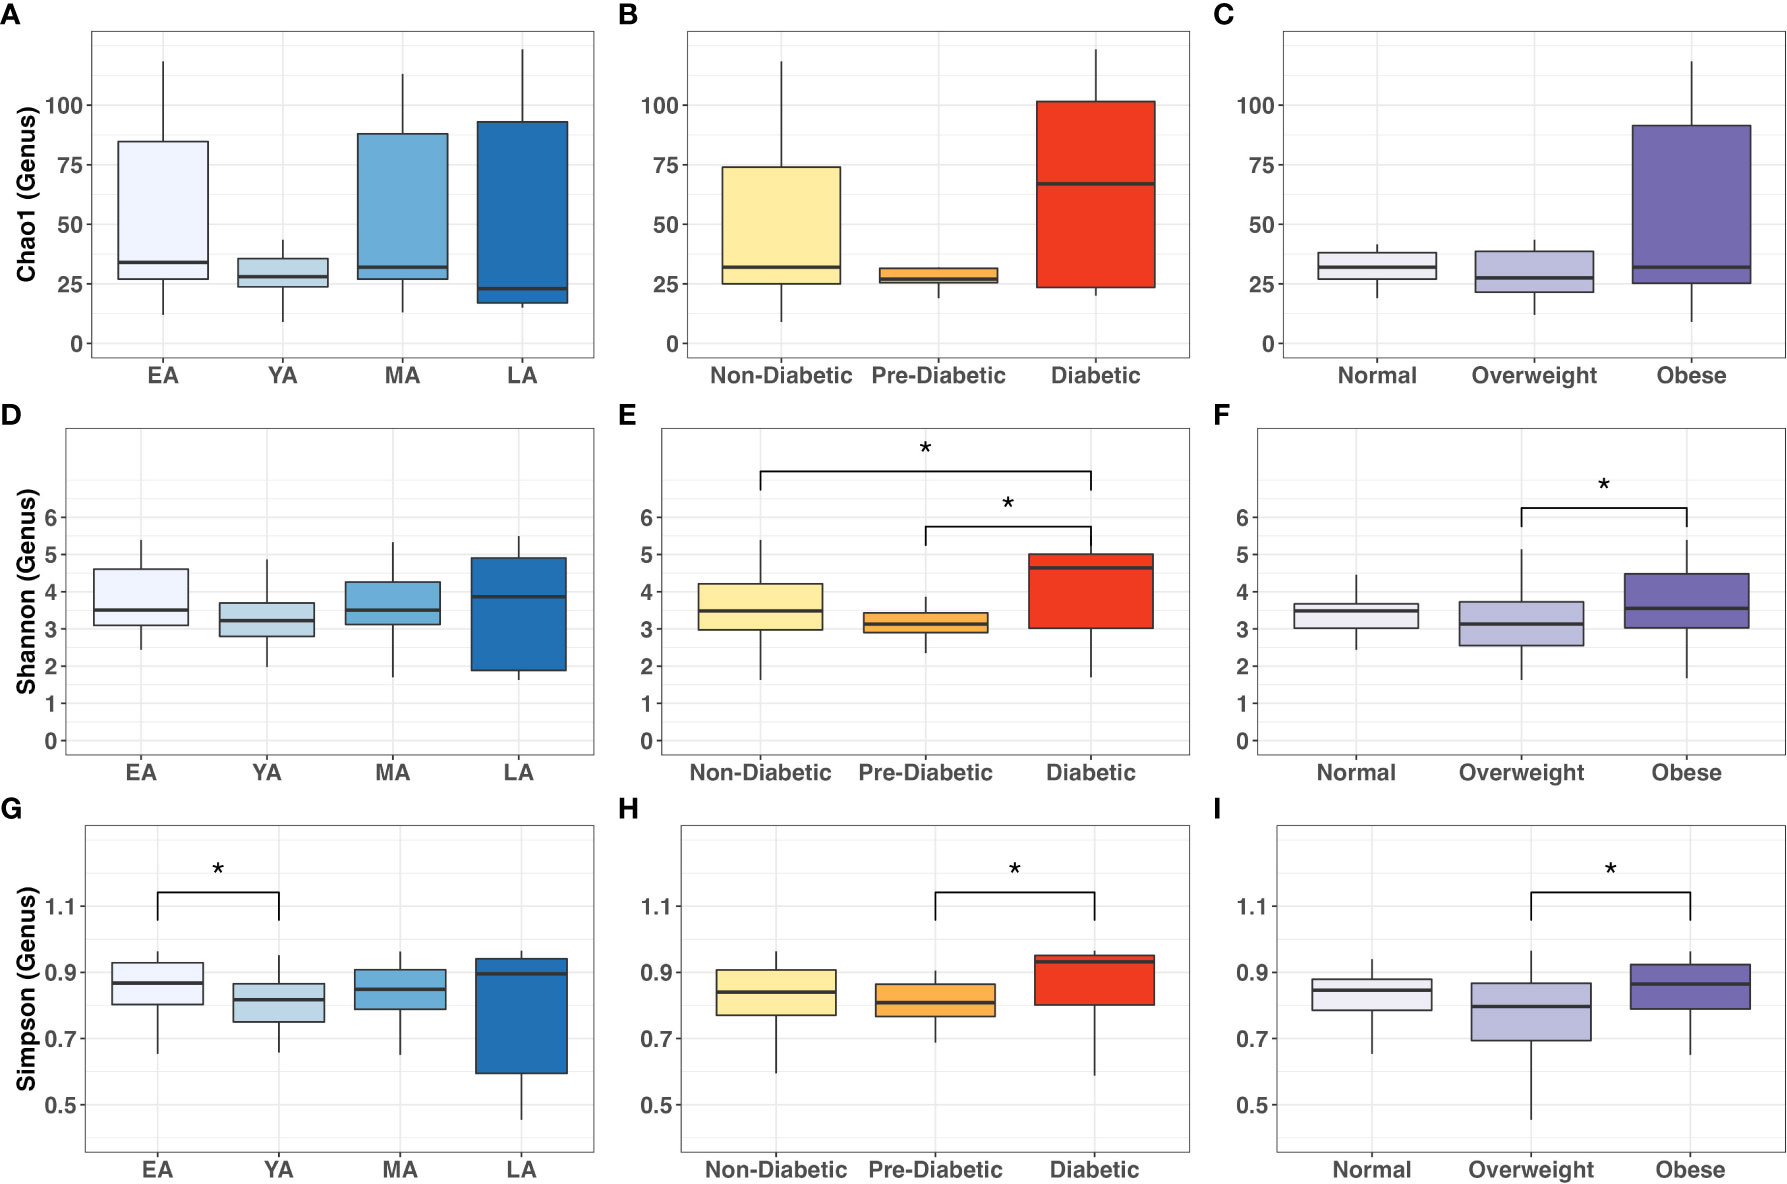
Figure 6 Intergroup comparisons for gut bacterial α-diversity at the genus level across age groups, T2DM categories, and BMI categories. Mean comparisons were performed across (A, D, G) age groups; (B, E, H) T2DM categories, and (C, F, I) BMI categories for Chao1, Shannon and Simpson indices, respectively. Statistical significance denoted: * (P<0.05).
3.3 BUK-mediated butyrate metabolism
To explore metabolic mechanisms underlying functional interactions between microflora and health outcomes in NHPIs, we quantified gut bacterial capacity for BUK-mediated butyrate metabolism by measuring the abundance of BUK DNA and RNA relative to total bacterial load per stool sample. Observed trends in relative levels of BUK abundance among age groups, T2DM categories, and BMI categories are summarized in Figure 7. While the relative abundance of BUK DNA did not significantly vary between age groups (Figure 7A), it significantly decreased across successive T2DM categories (Figure 7B; P=0.032) with a notable reduction in diabetics compared to non-diabetics (P<0.05). This relationship with host physiology did not extend to differential abundance across BMI categories (Figure 7C).
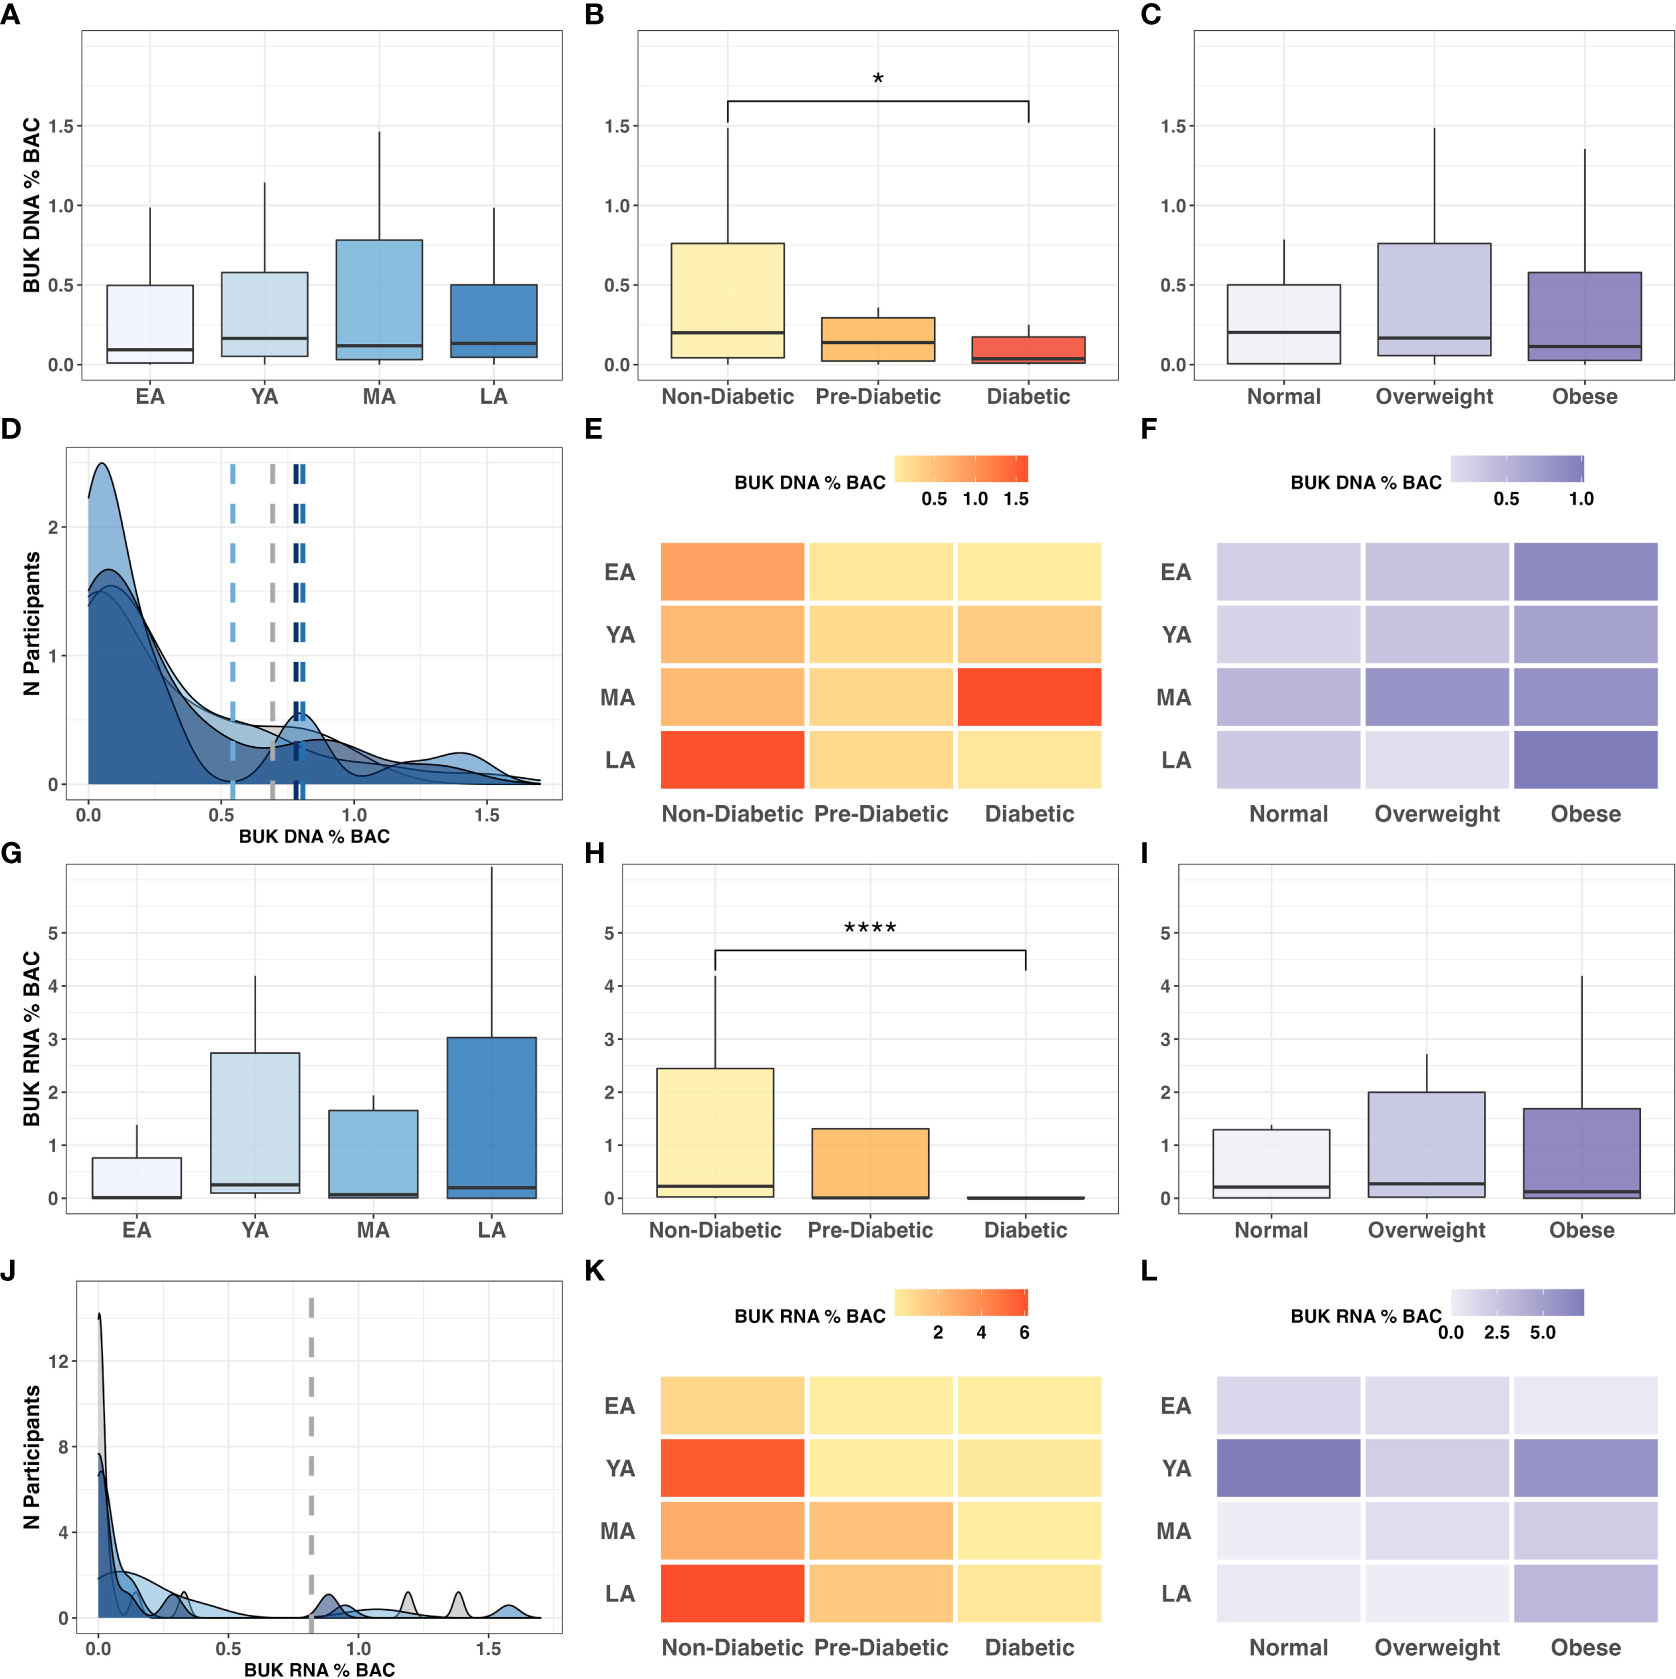
Figure 7 BUK gene abundance and expression relative to BAC across age, T2DM and BMI categories. Intergroup comparison of relative BUK gene abundance across (A) age groups (P=0.802), (B) T2DM categories (P=0.032), and (C) BMI categories (P=0.736). Frequency distribution of participants by age groups among binned BUK DNA values is summarized by a color-coded density plot fitted over a histogram (D). Heatmaps indicating the range of relative BUK DNA distributed across age groups and (E) T2DM categories and (F) BMI categories. Intergroup comparison of relative BUK RNA quantitation across (G) age groups (P=0.151), (H) T2DM categories (P<0.001). and (I) BMI categories (P=0.636). Frequency distribution of participants by age groups among binned BUK RNA values is summarized by a color-coded density plot fitted over a histogram (J). Heatmaps indicating the range of relative BUK RNA distributed across age groups and (K) T2DM categories and (L) BMI categories. Statistical significance denoted in figures above using asterisks as follows: * (P<0.05); **** (P<0.0001).
Without statistical indicators of direct interactions among BUK gene abundance and biometric data, we investigated these relationships more broadly. Variance in BUK levels between age groups was visualized using a fitted population density histogram (Figure 7D). Relatively low BUK gene abundance was observed most frequently in MA individuals compared to other age groups. While LA individuals exhibited low BUK DNA, the levels of which were similar to those of younger individuals (EA-YA), notable peaks were observed among LA individuals with moderate to high levels of BUK DNA. While exhibiting significant differences across T2DM categories, relative BUK DNA abundance did not show a clearly discernible pattern across intersecting age groups and T2DM categories (Figure 7E). Aside from an anomalously high BUK DNA abundance in diabetic MA individuals, increased BUK gene abundance seemed to tend toward non-diabetics, while demonstrating a more ambiguous distribution across age groups. This ambiguous relationship with age was consistent with that observed for BUK DNA levels across age groups and BMI categories, although elevated BUK gene abundance tended toward individuals with high BMI values (Figure 7F).
Compared to patterns observed for BUK DNA, low BUK RNA was observed at a notably higher frequencies across all age groups, with fewer observations of increased levels (Figure 7J). The relative abundance of BUK RNA distributed across age groups and T2DM categories revealed higher levels among non-diabetic individuals and showed an ambiguous distribution across age (Figure 7K). This ambiguity with age extended to age groups and BMI categories, with higher values observed among obese individuals, except for an anomalously high relative BUK RNA abundance in YA individuals with normal BMI (Figure 7L).
To better understand this ambiguity and as previous literature has reported strong associations between dietary habits and gut bacterial butyrate metabolism (Das et al., 2022), we investigated whether the relationship between the gut microbiome and host health outcomes may be modulated by fiber consumption, primarily from vegetable sources, as a potential avenue for T2DM risk reduction. To this end, we leveraged known metrics of dietary quality and developed a new dietary score based on self-reported data with a focus on vegetable sources of dietary fiber intake called “VEG2” defined below.
3.4 VEG2 as a measure of dietary quality in NHPIs
The Multi-Ethnic Cohort (MEC) study based at the University of Hawaii Cancer Center included data collected from 215,000 residents of Hawaii and Los Angeles through a 26-page questionnaire (including questions regarding behavioral risk factors and medical history) with follow-up questionnaires administered in five-year intervals (University of Hawaii). Biological samples were collected from more than 70,000 MEC members in 2001-2005. One MEC sub-study presented NHPI quintile distribution data for a number of conventionally accepted dietary quality indices (DQIs): the Approaches to Stop Hypertension (DASH) and the Healthy Eating Index (HEI-2010) (Jacobs et al., 2015). We accessed this data and obtained a summary of dietary index score quintile distribution data among NHPI men and women (provided in supplemental materials). Quintile distribution was based on dietary index range, from Q1 (lowest scores) to Q5 (highest scores). Participant scores were treated separately for men and women to control for sex-related differences.
For the purpose of our study, a modified DQI, VEG2, was formulated to assess fiber supplementation via vegetable consumption in NHPI populations. Survey questions used to collect dietary data were designed to quantify individuals’ variety and frequency of vegetable consumption relative to that of meats, fish, refined sugars, processed carbohydrates, and more using a point-value system assigned to diet-related survey responses. An overview of questions used for vegetable-related dietary data collection and their corresponding point-value assignment is provided in Table S3, followed by the formulas used to calculate the VEG2 metric. Chi-squared tests for independence comparing quintile distribution of NHPIs between DASH, HEI-2010, and VEG2 (Table S4) indices were nonsignificant (Table S5). Thus, we propose that the VEG2 DQI is functionally similar to established metrics in providing a general overview of self-reported dietary quality in NHPIs, with a focus on dietary sources of fiber intake.
In our cohort study, VEG2 correlated negatively with age (Table 3; R=-0.17; P=0.051), differed across age groups (Figure 8A; P<0.005), and did not significantly differ across T2DM categories (Figure 8B). VEG2 also correlated negatively with BMI (R=-0.25; P=0.004) and significantly varied across BMI categories (Figure 8C; P=0.005). Direct associations were not observed between VEG2 and BUK gene abundance (R=-0.05; P=0.573) or expression (R=0.02; P=0.804). The distribution of VEG2 score frequency clustered similarly among YA, MA, and LA age groups, while that of EA tended toward a higher median with higher frequency (Figures 8D). Mean VEG2 scores appeared to be dependent on BMI per age group, while the relationship was less clear in the context of T2DM risk (Figures 8E, F).
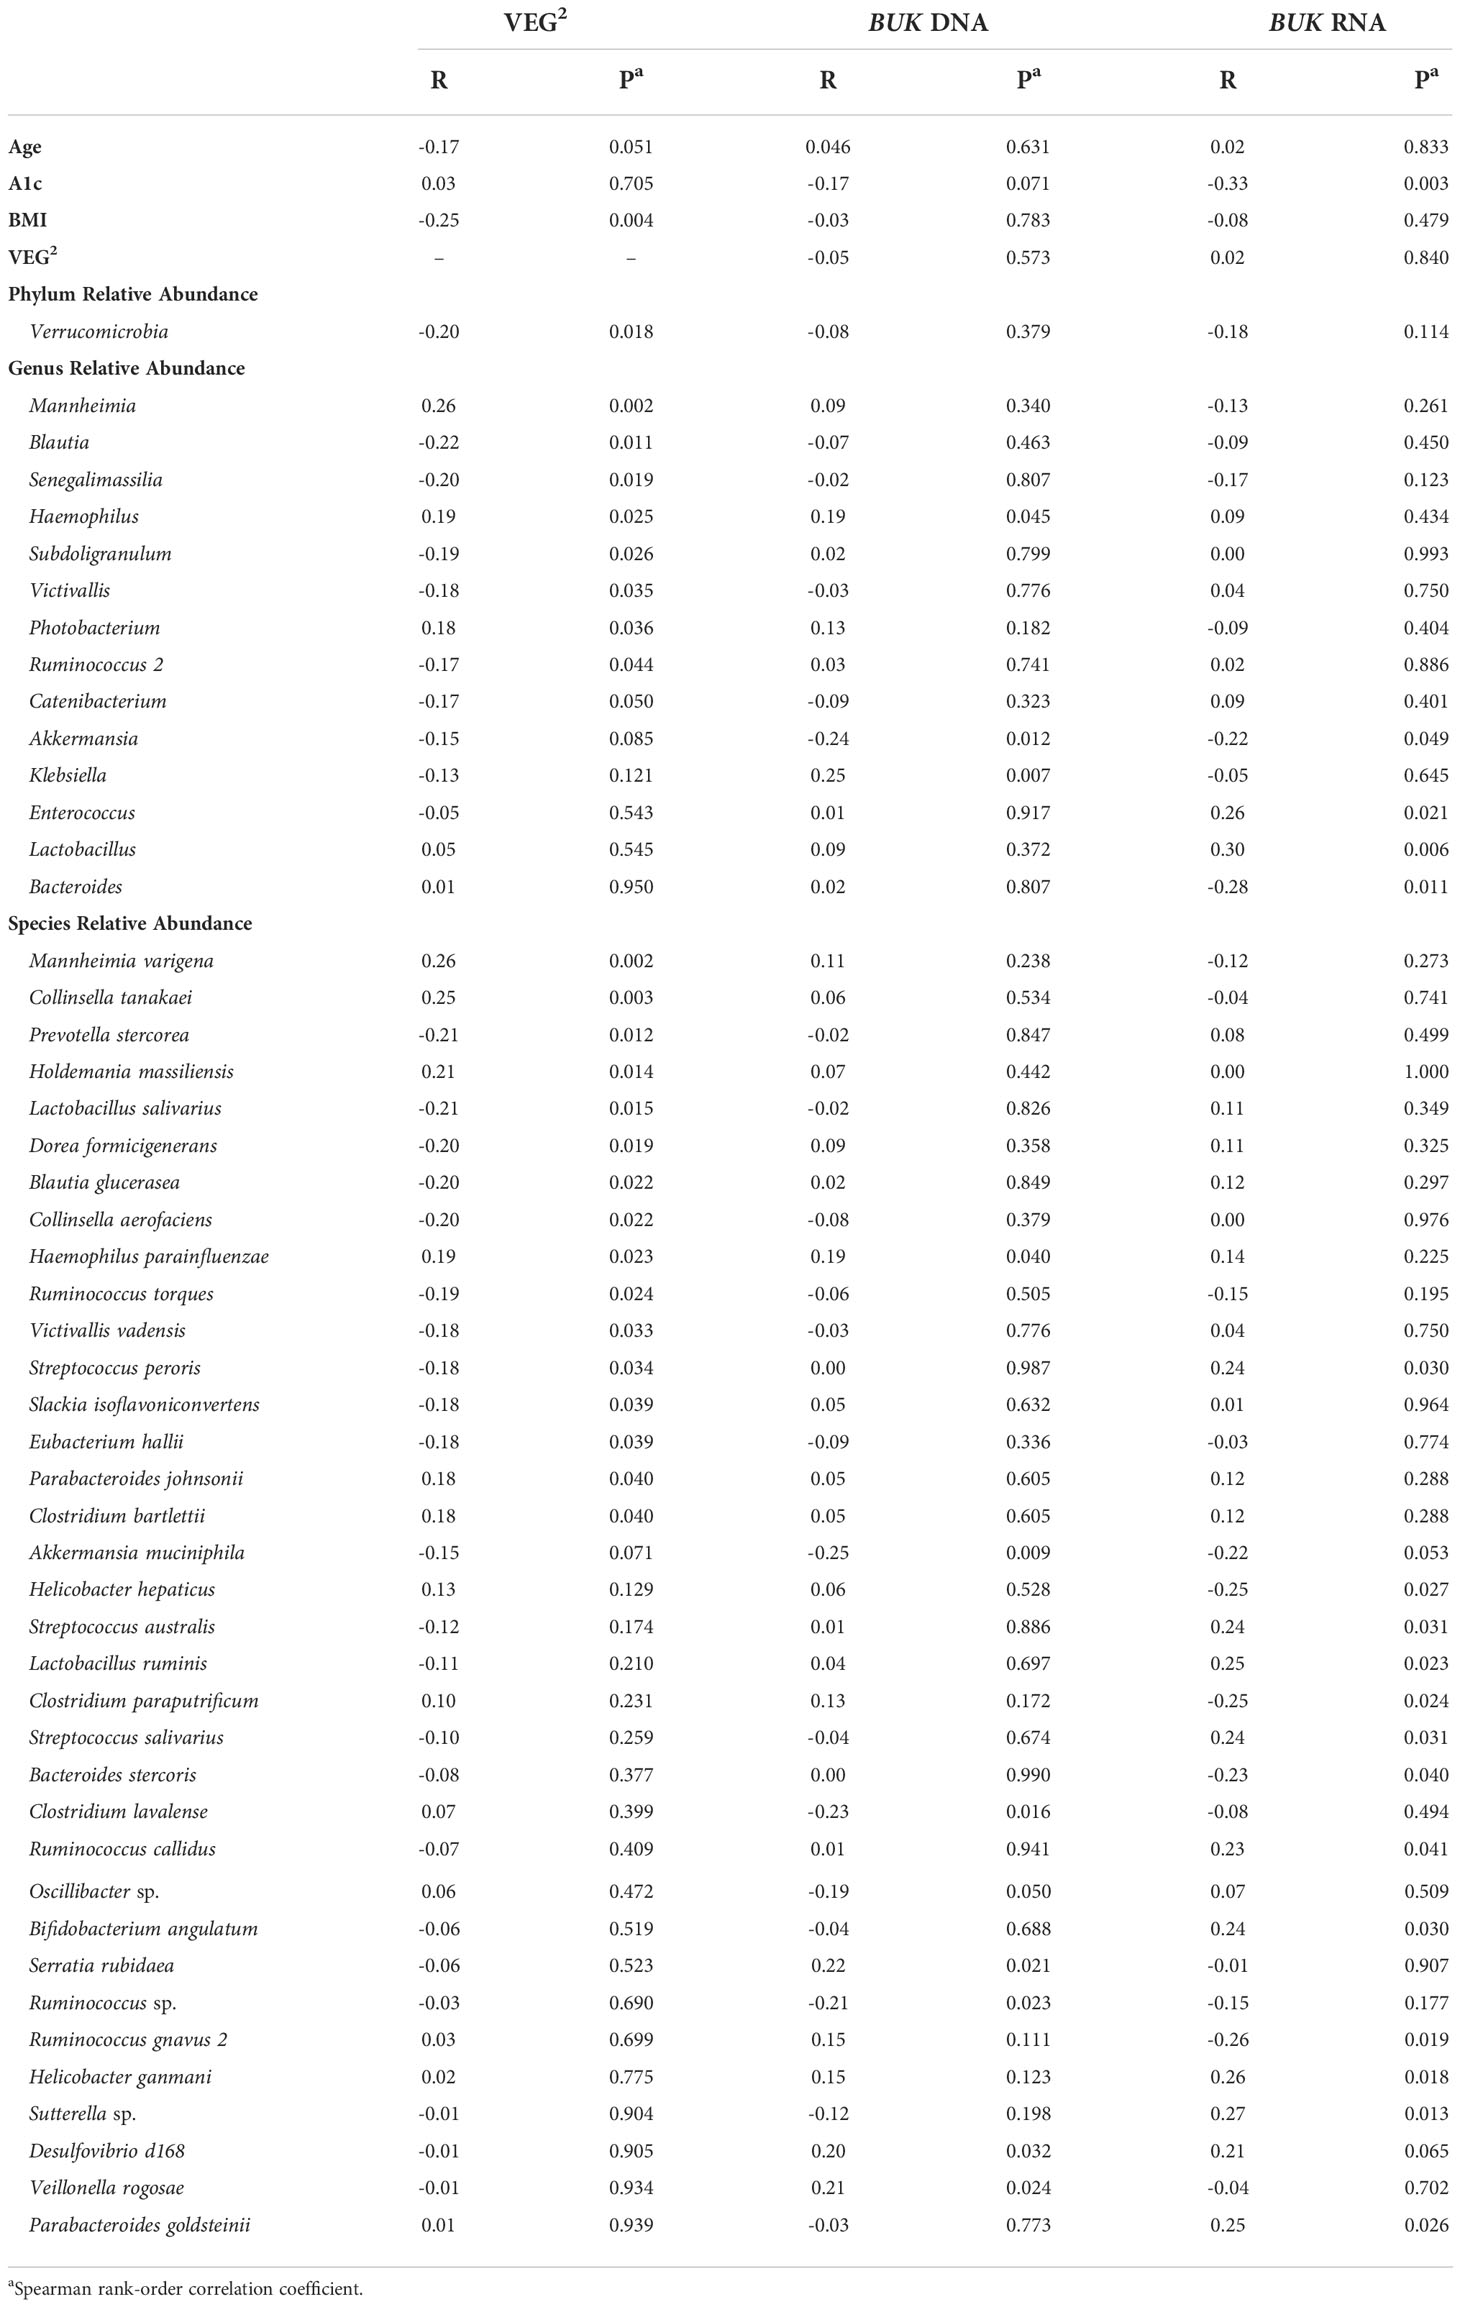
Table 3 Comparisons between biometrics, microbial abundances, VEG2 scores and BUK levels.
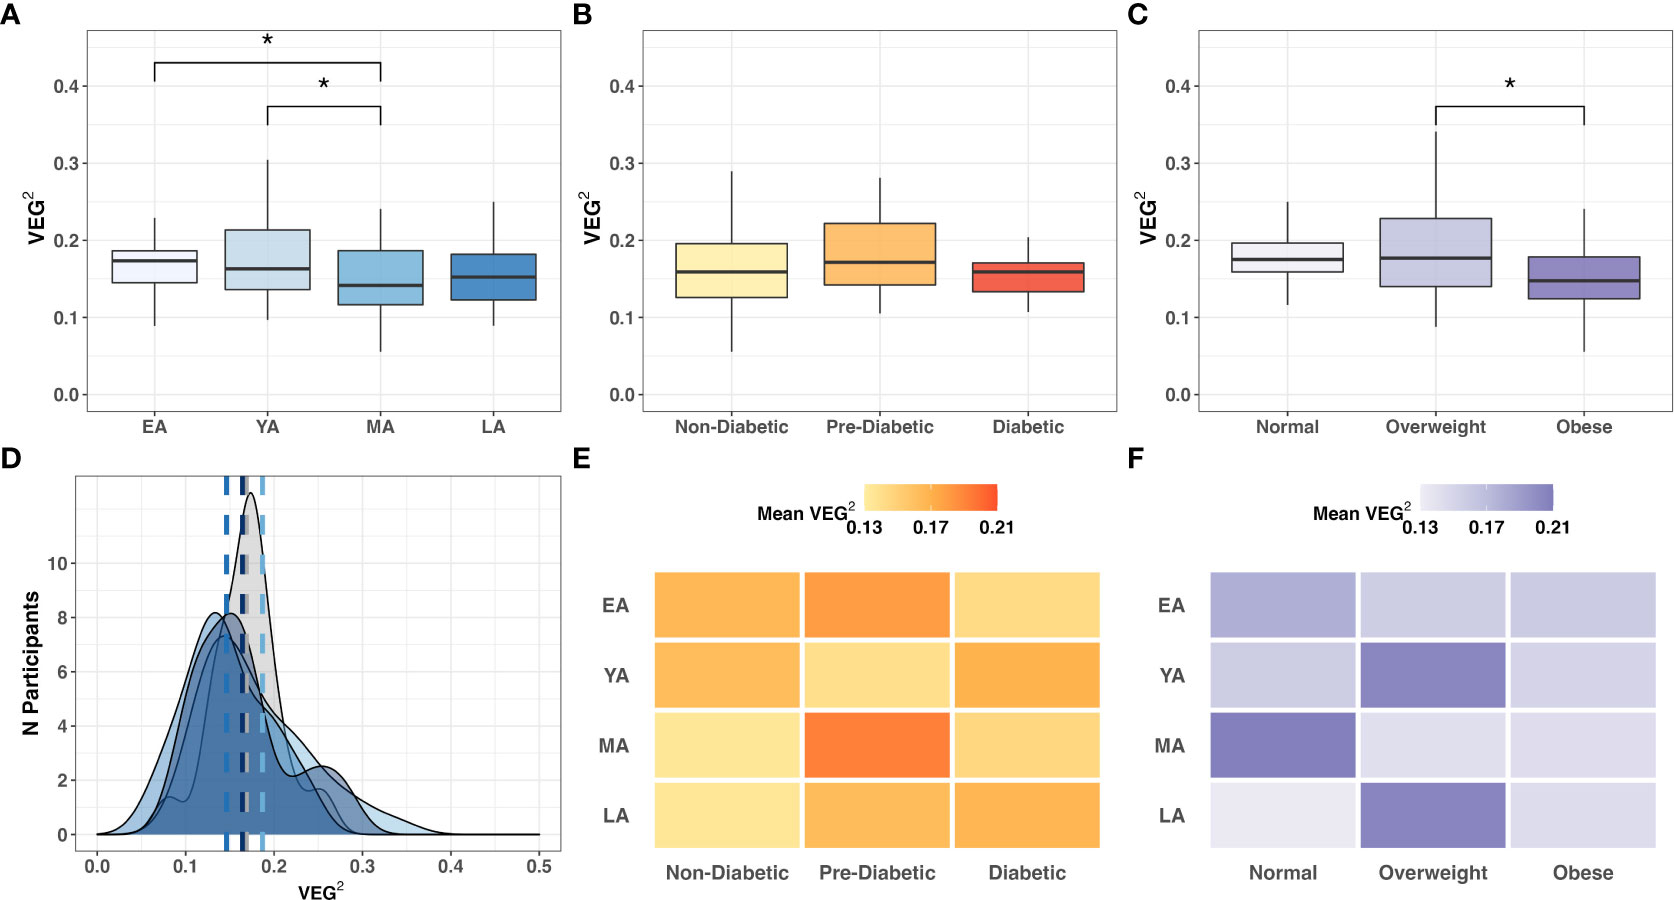
Figure 8 Intergroup comparison of VEG2 across (A) age groups (P=0.064); (B) T2DM categories (P=0.396); and (C) BMI categories (P=0.005). Frequency distribution of participants by age groups among binned VEG2 scores is summarized by a color-coded density plot fitted over a histogram (D) Heatmaps indicating the range of VEG2 scores distributed across age groups and (E) T2DM categories or (F) BMI categories. Statistical significance denoted: * (P<0.05).
A1c negatively correlated with BUK DNA (R=-0.17; P=0.071) and RNA (R=-0.33; P=0.031), suggesting a functional distinction between dietary and biometric interactions with gut bacteria. Relative Verrucomicrobia abundance uniquely correlated with VEG2 (R=-0.20; P=0.018) without exhibiting direct relationships between age, T2DM risk, or BMI (Table 2). Haemophilus was the only genus whose abundance significantly correlated with both VEG2 (R=0.19; P=0.025) and BUK gene abundance (R=0.19; P=0.045). Akkermansia was the only genus that demonstrated significant negative correlations with BUK gene abundance (R=-0.24; P=0.012) and expression (R=-0.22; P=0.049). Genera whose levels exhibited a positive correlation with BUK gene abundance were Mannheimia (R=0.26; P=0.002) and Photobacterium (R=0.18; P=0.036). Negative correlations were observed between Blautia (R=-0.22, P=0.011), Subdoligranulum (R=-0.19; P=0.026), Victivallis (R=-0.18; P=0.035), Ruminococcus 2 (R=-0.17; P=0.044) and Catenibacterium (R=-0.17; P=0.050). Genera that exhibited a positive correlation with BUK gene expression were Enterococcus (R=0.26; P=0.021) and Lactobacillus (R=0.30; P=0.006), with Bacteroides (R=-0.28; P=0.011) showing a negative relationship. Without indication of direct relationships with age or BMI (Table 3), the relative levels of BUK DNA and BUK RNA demonstrated marginal (R=-0.17; P=0.071) and strong (R=-0.33; P=0.031) negative correlations with A1c, respectively. Additional data regarding dietary associations are summarized in Table S6.
4 Discussion
Due to the underrepresentation of NHPIs in biomedical research studies, data from our NHPI cohort provides an example of potentially race/ethnic-specific relationships that would have not been previously recognized. Exploratory analyses of T2DM risk factors in our NHPI cohort revealed dynamic biometric and sociodemographic patterns, some of which were unexpected based on studies in other race/ethnic groups. Although A1c and BMI are commonly associated with each other, the positive correlation observed between the two (R=0.18; P=0.030) was not as strong as that of A1c and age (R=0.39; P<0.001).
The lack of overlap between A1c and BMI as predictors of T2DM-related health outcomes implicate the two metrics as inequivalent indicators of cardiometabolic disease risk. While conventional associations between obesity and T2DM risk have limited applicability to NHPI populations, age may be more effective as a predictor of cardiometabolic pathophysiology. Further discrepancies between documented trends among gut microbial influence on host physiology and those observed in our cohort emphasize unforeseen functional independence between BMI and T2DM risk in NHPIs. Significant differences in relative phylum abundance were not observed across BMI categories, contrasting with direct correlations observed between BMI values and five phyla (Table 2). This discrepancy may suggest that interactions between gut bacteria and host adiposity are functionally indirect. Further mediation analyses are required to assess indirect effects of these interactions.
Bifidobacterium is the most conventionally reported to be an antagonist against physiological determinants of T2DM-related complications (Ma et al., 2021). The negative correlation between Bifidobacterium and age (R=-0.32; P<0.001), consistent with reports from existing literature, was further supported by negative correlations with A1c (Table 2; R=-0.20; P=0.019) and BMI (R=-0.17; P=0.046). While exploratory statistics may implicate certain bacteria as partial determinants of glucose homeostasis or adiposity, their effects on host physiology are neither direct nor isolated, as the population dynamics and metabolic activity observed in gut bacteria are interdependent on one another.
Existing literature led us to expect an inverse relationship between gut bacterial α-diversity and T2DM risk. Cross-sectional studies have reported negative associations between α-diversity and insulin resistance in the majority of race/ethnic groups examined (Chen et al., 2021), suggesting a protective relationship between a diverse bacterial population and T2DM pathophysiology. While we observed contradictory results in our NHPI-cohort, further investigation, including increasing representation of NHPIs across diverse communities, is necessary to better understand these relationships.
Among the gut microbial features under our investigation in this study, we did not observe a direct relationship of relative BUK DNA abundance with age or BMI (Table 3). However, a positive relationship with A1c was observed (R=-0.17; P=0.071). The same trends were observed with BUK RNA levels, as a significant relationship was only observed with A1c (R=-0.33; P=0.031). These results suggest that reduced BUK activity in the gut corresponds with an increase in A1c and T2DM risk, likely through glucose homeostatic pathways.
Meta-analyses investigating the relationship between DQIs and health outcomes have found an inverse association between both DASH and HEI scores with the risk of incidence or mortality from cardiovascular disease and T2DM (Jacobs et al., 2015; Schwingshackl and Hoffmann, 2015). While such systematic reviews provide insight into conventional DQI score applications, it is unclear whether these trends are generalizable to indigenous populations, in particular to NHPIs. We propose the VEG2 score as a modified DQI with increased accessibility for members of NHPI communities. Due to the negative correlation between vegetable intake scores and age, we are unable to conclude whether a characteristic shift in diet with age is as significant a contributor to the shift in gut microbial population dynamics as is age alone. We note, however, that this decreased VEG2 score with age associated with increased BMI and T2DM risk in our NHPI-enriched cohort, implicating dietary deficiencies, in particular fiber intake, as a potential contributor to obesity and diabetes. Given the strong yet contrasting associations with VEG2 and BUK, our data implicates Haemophilus and Akkermansia, among others, in playing a role in potentially mediating the effects of diet on metabolic health in this cohort.
Our observations of dynamic interactions among age, gut microbiome, and T2DM risk factors support previous literature emphasizing the necessity for age stratification in health disparities research involving NHPI populations. Discrepancies in conclusions of relationships between gut microbial indicators of health outcomes may likely arise from race/ethnic variability, emphasizing that findings in other populations may not be generalizable to NHPI and other minority populations underpresented in biomedical research. Gut microbial mediation of host physiology affects obesity and T2DM risk in NHPIs in ways not yet well understood. NHPI-specific microbial dynamics may contribute to the cardiometabolic health disparity experienced by the NHPI community via microbial pathways that may be unique to this group. Thus, bridging the gap in biomedical data disparity for NHPI populations may allow for the development of more robust, community-based strategies to effectively address specific pathways underlying disparities among NHPIs.
Data availability statement
All data used for this project will be available de-identified when approved by the University of Hawaii Institutional Review Board upon reasonable request to the corresponding author. The data presented in the study are deposited in the figshare repository, accessible at: https://doi.org/10.6084/m9.figshare.21637547.v1.
Ethics statement
The studies involving human participants were reviewed and approved by University of Hawaii Institutional Review Board (UH IRB) under protocol number 2019-00376. The participants provided their written informed consent to participate in this study.
Author contributions
Funding for this study was obtained by AM, who also conceptualized, organized, and led the study. RW and BK performed experiments, conducted analysis of biometric data, and wrote the manuscript alongside AM. RP oversaw all experiments, provided edits to the manuscript, and conducted data analysis on NGS data. KP oversaw participant recruitment, data curation, and created the sociodemographic survey and VEG2 metric alongside RJ. LU, TM, RL, and DK performed experiments. All authors reviewed the manuscript and approved the final submission.
Funding
This project was supported in part by the National Institutes of Health (NIH), National Institute on Minority Health and Health Disparities (NIMHD) under grant numbers R56MD014630, U54MD007601-35, and R01MD016593 and by the National Institute of General Medical Sciences (NIGMS) under the Institutional Development Award (IDeA) Networks of Biomedical Research Excellence (INBRE) program (P20GM103466).
Acknowledgments
We would like to thank all participants who made this study possible. In particular, we are grateful to MA‘O Organic Farms, our community-based partner in Waianae, as well as the Palolo Valley community for advocating NHPI participation in this study. We greatly appreciate the support for this study from the National Institutes of Health (NIH), National Institute on Minority Health and Health Disparities (NIMHD), and the National Institute of General Medical Sciences (NIGMS). This manuscript and its contents are solely the responsibility of the authors and do not represent the official view of NIH, NIMHD or NIGMS. Illustrations were created using BioRender.com.
Conflict of interest
The authors declare that the research was conducted in the absence of any commercial or financial relationships that could be construed as a potential conflict of interest.
Publisher’s note
All claims expressed in this article are solely those of the authors and do not necessarily represent those of their affiliated organizations, or those of the publisher, the editors and the reviewers. Any product that may be evaluated in this article, or claim that may be made by its manufacturer, is not guaranteed or endorsed by the publisher.
Supplementary material
The Supplementary Material for this article can be found online at: https://www.frontiersin.org/articles/10.3389/fcimb.2022.1035641/full#supplementary-material
Supplementary Figure 1 | Inclusion-exclusion criteria for cohort participant data from the time of enrollment to metagenomic sequencing analysis.
Supplementary Figure 2 | Relative abundance of gut microbial phyla per individual across (A) age group, (B) T2DM category and (C) BMI category.
References
American Diabetes Association (2021) Understanding A1c. Available at: https://diabetes.org/diabetes/a1c (Accessed December 30, 2021).
Anand, S., Kaur, H., Mande, S. S. (2016). Comparative in silico analysis of butyrate production pathways in gut commensals and pathogens. Front. Microbiol. 7. doi: 10.3389/fmicb.2016.01945
Arora, T., Tremaroli, V. (2021). Therapeutic potential of butyrate for treatment of type 2 diabetes. Front. Endocrinol. 12. doi: 10.3389/fendo.2021.761834
Arpaia, N., Campbell, C., Fan, X., Dikiy, S., van der Veeken, J., deRoos, P., et al. (2013). Metabolites produced by commensal bacteria promote peripheral regulatory T-cell generation. Nature 504 (7480), 451–455. doi: 10.1038/nature12726
Barb, J. J., Oler, A. J., Kim, H.-S., Chalmers, N., Wallen, G. R., Cashion, A., et al. (2016). Development of an analysis pipeline characterizing multiple hypervariable regions of 16S rRNA using mock samples. PloS One 11 (2), e0148047. doi: 10.1371/journal.pone.0148047
Bui, T. P. N., Mannerås-Holm, L., Puschmann, R., Wu, H., Troise, A. D., Nijsse, B., et al. (2021). Conversion of dietary inositol into propionate and acetate by commensal anaerostipes associates with host health. Nat. Commun. 12 (1). doi: 10.1038/s41467-021-25081-w
Castillo, M., Martín-Orúe, S. M., Manzanilla, E. G., Badiola, I., Martín, M., Gasa, J. (2006). Quantification of total bacteria, enterobacteria and lactobacilli populations in pig digesta by real-time PCR. Vet. Microbiol. 114 (1), 165–170. doi: 10.1016/j.vetmic.2005.11.055
Centers for Disease Control and Prevention (2018) Summary health statistics: National health interview survey (Table a-4a). Available at: https://minorityhealth.hhs.gov/omh/browse.aspx?lvl=3&lvlid=65 (Accessed November 2021).
Centers for Disease Control and Prevention (2021) About adult BMI. Available at: https://www.cdc.gov/healthyweight/assessing/bmi/adult_bmi/ (Accessed December 21, 2021).
Chamberlain, S., Szoecs, E., Foster, Z., Arendsee, Z., Boettiger, C., Ram, K., et al. (2020) Taxize: Taxonomic information from around the web. Available at: https://github.com/ropensci/taxize (Accessed September 2022).
Charrier, C., Duncan, G. J., Reid, M. D., Rucklidge, G. J., Henderson, D., Young, P., et al. (2006). A novel class of CoA-transferase involved in short-chain fatty acid metabolism in butyrate-producing human colonic bacteria. Microbiology 152 (1), 179–185. doi: 10.1099/mic.0.28412-0
Chen, Z., Radjabzadeh, D., Chen, L., Kurilshikov, A., Kavousi, M., Ahmadizar, F., et al. (2021). Association of insulin resistance and type 2 diabetes with gut microbial diversity: A microbiome-wide analysis from population studies. JAMA Netw. Open 4 (7), e2118811–e2118811. doi: 10.1001/jamanetworkopen.2021.18811
Das, T. K., Pradhan, S., Chakrabarti, S., Mondal, K. C., Ghosh, K. (2022). Current status of probiotic and related health benefits. Appl. Food Res. 2 (2), 100185. doi: 10.1016/j.afres.2022.100185
De la Cuesta-Zuluaga, J., Mueller, N. T., Álvarez-Quintero, R., Velásquez-Mejía, E. P., Sierra, J. A., Corrales-Agudelo, V., et al. (2019). Higher fecal short-chain fatty acid levels are associated with gut microbiome dysbiosis, obesity, hypertension and cardiometabolic disease risk factors. Nutrients 11 (1), 51. doi: 10.3390/nu11010051
Diez-Gonzalez, F., Bond, D. R., Jennings, E., Russell, J. B. (1999). Alternative schemes of butyrate production in butyrivibrio fibrisolvens and their relationship to acetate utilization, lactate production, and phylogeny. Arch. Microbiol. 171 (5), 324–330. doi: 10.1007/s002030050717
Eeckhaut, V., Van Immerseel, F., Croubels, S., De Baere, S., Haesebrouck, F., Ducatelle, R., et al. (2011). Butyrate production in phylogenetically diverse firmicutes isolated from the chicken caecum. Microbial. Biotechnol. 4 (4), 503–512. doi: 10.1111/j.1751-7915.2010.00244.x
Everard, A., Cani, P. D. (2013). Diabetes, obesity and gut microbiota. Best Pract. Res. Clin. Gastroenterol. 27 (1), 73–83. doi: 10.1016/j.bpg.2013.03.007
Fu, J., Xu, K., Ni, X., Li, X., Zhu, X., Xu, W. (2022). Habitual dietary fiber intake, fecal microbiota, and hemoglobin A1c level in Chinese patients with type 2 diabetes. Nutrients 14 (5), 1003. doi: 10.3390/nu14051003
Gomez-Arango, L. F., Barrett, H. L., McIntyre, H. D., Callaway, L. K., Morrison, M., Nitert, M. D. (2016). Increased systolic and diastolic blood pressure is associated with altered gut microbiota composition and butyrate production in early pregnancy. Hypertension 68 (4), 974–981. doi: 10.1161/HYPERTENSIONAHA.116.07910
Gregory, J. M., Slaughter, J. C., Duffus, S. H., Smith, T. J., LeStourgeon, L. M., Jaser, S. S., et al. (2020). COVID-19 severity is tripled in the diabetes community: A prospective analysis of the pandemic’s impact in type 1 and type 2 diabetes. Diabetes Care 44 (2), 526–532. doi: 10.2337/dc20-2260
Hartmanis, M. G. N., Gatenbeck, S. (1984). Intermediary metabolism in clostridium acetobutylicum: Levels of enzymes involved in the formation of acetate and butyrate. Appl. Environ. Microbiol. 47 (6), 1277–1283. doi: 10.1128/aem.47.6.1277-1283.1984
Hawaii State Department of Health (2019). Diabetes - prevalence, Age Adjusted by Year and DOH Race/Ethnicity (2011+, new). Hawaii Health Data Warehouse Behavioral Risk Factor Surveillance System. Available at: https://hhdw.org/report/query/selection/brfss/_BRFSSSelection.html (Accessed December 21, 2021)
Imdad, S., Lim, W., Kim, J.-H., Kang, C. (2022). Intertwined relationship of mitochondrial metabolism, gut microbiome and exercise potential. Int. J. Mol. Sci. 23 (5), 2679. doi: 10.3390/ijms23052679
Jaagura, M., Part, N., Adamberg, K., Kazantseva, J., Viiard, E. (2022). Consumption of multi-fiber enriched yogurt is associated with increase of bifidobacterium animalis and butyrate producing bacteria in human fecal microbiota. J. Funct. Foods 88, 104899. doi: 10.1016/j.jff.2021.104899
Jacobs, S., Harmon, B. E., Boushey, C. J., Morimoto, Y., Wilkens, L. R., Le Marchand, L., et al. (2015). A priori-defined diet quality indexes and risk of type 2 diabetes: the multiethnic cohort. Diabetologia 58 (1), 98–112. doi: 10.1007/s00125-014-3404-8
Kamaka, M. L., Watkins-Victorino, L., Lee, A., Freitas, S. M., Ramsey, K. W., Quint, J., et al. (2021). Addressing native Hawaiian and pacific islander data deficiencies through a community-based collaborative response to the COVID-19 pandemic. Hawai'i J. Health Soc. welfare 80 (10 Suppl 2), 36–45.
Karmally, W., Goldberg, I. J. (2021). “Optimal diet for diabetes: Glucose control, hemoglobin A1c reduction, and CV risk,” in Prevention and treatment of cardiovascular disease: Nutritional and dietary approaches. Eds. Wilkinson, M. J., Garshick, M. S., Taub, P. R. (Cham: Springer International Publishing), 171–177. doi: 10.1007/978-3-030-78177-4_11
Kassambara, A. (2020) Ggpubr: 'ggplot2' based publication ready plots. Available at: https://CRAN.R-project.org/package=ggpubr (Accessed September 2022).
Lahti, Shetty (2019) Microbiome r package. Available at: http://microbiome.github.i (Accessed September 2022).
Lee, H., An, J., Kim, J., Choi, D., Song, Y., Lee, C.-K., et al. (2022). A novel bacterium, butyricimonas virosa, preventing HFD-induced diabetes and metabolic disorders in mice via GLP-1 receptor. Front. Microbiol. 13. doi: 10.3389/fmicb.2022.858192
Lee, J. G., Lee, J., Lee, A.-R., Jo, S. V., Park, C. H., Han, D. S., et al. (2022). Impact of short-chain fatty acid supplementation on gut inflammation and microbiota composition in a murine colitis model. J. Nutr. Biochem. 101, 108926. doi: 10.1016/j.jnutbio.2021.108926
Louis, P., Flint, H. J. (2009). Diversity, metabolism and microbial ecology of butyrate-producing bacteria from the human large intestine. FEMS Microbiol. Lett. 294 (1), 1–8. doi: 10.1111/j.1574-6968.2009.01514.x
Louis, P., Flint, H. J. (2017). Formation of propionate and butyrate by the human colonic microbiota. Environ. Microbiol. 19 (1), 29–41. doi: 10.1111/1462-2920.13589
Ma, T., Yao, C., Shen, X., Jin, H., Guo, Z., Zhai, Q., et al. (2021). The diversity and composition of the human gut lactic acid bacteria and bifidobacterial microbiota vary depending on age. Appl. Microbiol. Biotechnol. 105 (21), 8427–8440. doi: 10.1007/s00253-021-11625-z
McElfish, P. A., Purvis, R. S., Esquivel, M. K., Sinclair, K.’i.A., Townsend, C., Hawley, N. L., et al. (2019). Diabetes disparities and promising interventions to address diabetes in native Hawaiian and pacific islander populations. Curr. Diabetes Rep. 19 (5), 19. doi: 10.1007/s11892-019-1138-1
Menni, C., Zhu, J., Le Roy, C. I., Mompeo, O., Young, K., Rebholz, C. M., et al. (2020). Serum metabolites reflecting gut microbiome alpha diversity predict type 2 diabetes. Gut Microbes 11 (6), 1632–1642. doi: 10.1080/19490976.2020.1778261
Nastasi, C., Candela, M., Bonefeld, C. M., Geisler, C., Hansen, M., Krejsgaard, T., et al. (2015). The effect of short-chain fatty acids on human monocyte-derived dendritic cells. Sci. Rep. 5 (1), 16148. doi: 10.1038/srep16148
Oksanen, J., Simpson, G., Blanchet, F., Kindt, R., Legendre, P., Minchin, P., et al. (2022) Vegan: Community ecology package. Available at: https://CRAN.R-project.org/package=vegan (Accessed September 2022).
Panwar, H., Rashmi, H. M., Batish, V. K., Grover, S. (2013). Probiotics as potential biotherapeutics in the management of type 2 diabetes – prospects and perspectives. Diabetes/Metabolism Res. Rev. 29 (2), 103–112. doi: 10.1002/dmrr.2376
Penaia, C. S., Morey, B. N., Thomas, K. B., Chang, R. C., Tran, V. D., Pierson, N., et al. (2021). Disparities in native Hawaiian and pacific islander COVID-19 mortality: A community-driven data response. Am. J. Public Health 111 (S2), S49–S52. doi: 10.2105/ajph.2021.306370
R Core Team (2021). R: A language and environment for statistical computing (Vienna, Austria: R Foundation for Statistical Computing).
Roediger, W. E. (1980). Role of anaerobic bacteria in the metabolic welfare of the colonic mucosa in man. Gut 21 (9), 793–798. doi: 10.1136/gut.21.9.793
Sasaki, M., Schwab, C., Ramirez Garcia, A. (2022). The abundance of Ruminococcus bromii is associated with faecal butyrate levels and atopic dermatitis in infancy. Allergy. 00, 1–12. doi: 10.1111/all.15440
Sato, M., Yoshida, Y., Nagano, K., Hasegawa, Y., Takebe, J., Yoshimura, F. (2016). Three CoA transferases involved in the production of short chain fatty acids in porphyromonas gingivalis. Front. Microbiol. 7. doi: 10.3389/fmicb.2016.01146
Sauer, U., Eikmanns, B. J. (2005). The PEP–pyruvate—oxaloacetate node as the switch point for carbon flux distribution in bacteria: We dedicate this paper to Rudolf k. thauer, director of the max-Planck-Institute for terrestrial microbiology in marburg, Germany, on the occasion of his 65th birthday. FEMS Microbiol. Rev. 29 (4), 765–794. doi: 10.1016/j.femsre.2004.11.002
Scheithauer, T. P. M., Rampanelli, E., Nieuwdorp, M., Vallance, B. A., Verchere, C. B., van Raalte, D. H., et al. (2020). Gut microbiota as a trigger for metabolic inflammation in obesity and type 2 diabetes. Front. Immunol. 11. doi: 10.3389/fimmu.2020.571731
Schwingshackl, L., Hoffmann, G. (2015). Diet quality as assessed by the healthy eating index, the alternate healthy eating index, the dietary approaches to stop hypertension score, and health outcomes: a systematic review and meta-analysis of cohort studies. J. Acad. Nutr. Diet 115 (5), 780–800 e785. doi: 10.1016/j.jand.2014.12.009
Sirobhushanam, S., Galva, C., Saunders, L. P., Sen, S., Jayaswal, R., Wilkinson, B. J., et al. (2017). Utilization of multiple substrates by butyrate kinase from listeria monocytogenes. Biochim. Biophys. Acta (BBA) - Mol. Cell Biol. Lipids 1862 (3), 283–290.
Tilg, H., Moschen, A. R. (2014). Microbiota and diabetes: an evolving relationship. Gut 63 (9), 1513. doi: 10.1136/gutjnl-2014-306928
Uchima, O., Wu, Y. Y., Browne, C., Braun, K. L. (2019). Disparities in diabetes prevalence among native Hawaiians/Other pacific islanders and asians in hawai‘i. Preventing Chronic Dis. 16. doi: 10.5888/pcd16.180187
University of Hawaii Cancer Center The multiethnic cohort. Available at: https://www.uhcancercenter.org/mec (Accessed July 7, 2022).
Upadhyaya, S., Banerjee, G. (2015). Type 2 diabetes and gut microbiome: at the intersection of known and unknown. Gut Microbes 6 (2), 85–92. doi: 10.1080/19490976.2015.1024918
van den Berg, F. F., van Dalen, D., Hyoju, S. K., van Santvoort, H. C., Besselink, M. G., Wiersinga, W. J., et al. (2021). Western-Type diet influences mortality from necrotising pancreatitis and demonstrates a central role for butyrate. Gut 70 (5), 915. doi: 10.1136/gutjnl-2019-320430
Vital, M., Howe, A. C., Tiedje, J. M. (2014). Revealing the bacterial butyrate synthesis pathways by analyzing (Meta)genomic data. mBio 5 (2), e00889–e00814. doi: 10.1128/mBio.00889-14
Wang, D., Gee, G. C., Bahiru, E., Yang, E. H., Hsu, J. J. (2020). Asian-Americans and pacific islanders in COVID-19: Emerging disparities amid discrimination. J. Gen. Internal Med. 35 (12), 3685–3688. doi: 10.1007/s11606-020-06264-5
Wang, N., Zhu, F., Chen, L., Chen, K. (2018). Proteomics, metabolomics and metagenomics for type 2 diabetes and its complications. Life Sci. 212, 194–202. doi: 10.1016/j.lfs.2018.09.035
Wen, L., Duffy, A. (2017). Factors influencing the gut microbiota, inflammation, and type 2 diabetes. J. Nutr. 147 (7), 1468S–1475S. doi: 10.3945/jn.116.240754
Keywords: Native Hawaiian, age, microbiome, diabetes, body mass index, obesity
Citation: Wells RK, Kunihiro BP, Phankitnirundorn K, Peres R, McCracken TA, Umeda L, Lee RH, Kim DY, Juarez R and Maunakea AK (2022) Gut microbial indicators of metabolic health underlie age-related differences in obesity and diabetes risk among Native Hawaiians and Pacific Islanders. Front. Cell. Infect. Microbiol. 12:1035641. doi: 10.3389/fcimb.2022.1035641
Received: 03 September 2022; Accepted: 16 November 2022;
Published: 21 December 2022.
Edited by:
Laura Maria Andrade De Oliveira, Federal University of Rio de Janeiro, BrazilReviewed by:
Daniel Cerqueda-García, Instituto de Ecología (INECOL), MexicoSilvia Raineri, University of Copenhagen, Denmark
Copyright © 2022 Wells, Kunihiro, Phankitnirundorn, Peres, McCracken, Umeda, Lee, Kim, Juarez and Maunakea. This is an open-access article distributed under the terms of the Creative Commons Attribution License (CC BY). The use, distribution or reproduction in other forums is permitted, provided the original author(s) and the copyright owner(s) are credited and that the original publication in this journal is cited, in accordance with accepted academic practice. No use, distribution or reproduction is permitted which does not comply with these terms.
*Correspondence: Alika K. Maunakea, YW1hdW5ha2VAaGF3YWlpLmVkdQ==
†These authors have contributed equally to this work and share first authorship