 Congwei Gu1,2†
 Zihan Zhou1†Zehui Yu2†Manli He2
 Lvqin He2
 Zhengzhong Luo1Wudian Xiao2Qian Yang2Fangfang Zhao1Weiyao Li1Liuhong Shen1Jianhong Han2Suizhong Cao1Zhicai Zuo1Junliang Deng1Qigui Yan1Zhihua Ren1Mingde Zhao2*
 Shumin Yu1*
- 1College of Veterinary Medicine, Sichuan Agricultural University, Chengdu, China
- 2Laboratory Animal Centre, Southwest Medical University, Luzhou, China
In recent years, nonalcoholic fatty liver disease (NAFLD) has become the most common liver disease in the world. As an important model animal, the characteristics of gut microbiota alteration in mice with NAFLD have been studied but the changes in metabolite abundance in NAFLD mice and how the gut microbiota affects these intestinal metabolites remain unclear. In this experiment, a mouse model for NAFLD was established by a high-fat diet. The use of 16S rDNA technology showed that while there were no significant changes in the alpha diversity in the cecum of NAFLD mice, the beta diversity changed significantly. The abundance of Blautia, Unidentified-Lachnospiraceae, Romboutsia, Faecalibaculum, and Ileibacterium increased significantly in NAFLD mice, while Allobaculum and Enterorhabdus decreased significantly. Amino acids, lipids, bile acids and nucleotide metabolites were among the 167 significantly different metabolites selected. The metabolic pathways of amino acids, SFAs, and bile acids were significantly enhanced, while the metabolic pathways of PUFAs, vitamins, and nucleotides were significantly inhibited. Through correlation and MIMOSA2 analysis, it is suggested that gut microbiota does not affect the changes of lipids and bile acids but can reduce thiamine, pyridoxine, and promote L-phenylalanine and tyramine production. The findings of this study will help us to better understand the relationship between gut microbiota and metabolites in NAFLD.
Introduction
Recently, nonalcoholic fatty liver disease (NAFLD) has become one of the most common liver diseases in the world. NAFLD is also one of the main causes of liver transplantation in the United States (Gadiparthi et al., 2020) and has replaced Viral Hepatitis B as the most common chronic liver disease in China (Xiao et al., 2019). The implication of the gut microbiota in the regulation of host metabolic balance has been demonstrated in the last decade. Many studies conducted in both animal models and humans revealed a significant role of the gut microbiota in the pathogenesis of metabolic disorders, strongly influenced by diet and lifestyle modifications. The gut microbiota recently emerged as a pivotal transducer of environmental influences (dietary components and drug treatments) to exert protective or detrimental effects on several host tissues and systems, including regulation of intermediary metabolism, liver function, and cardiovascular disorders, either directly via translocation or indirectly through microbial metabolism or their function in metabolic disorders (Bäckhed et al., 2004).
The overall composition of the gut microbiota is determined by a number of factors including host genetics, environment, and hygiene (Repass et al., 2016). The composition of the gut microbiome is influenced by environmental factors more so than by host genetics, where diet represents the predominate environmental factor influencing the makeup of the intestinal microbiome community (Pilla et al., 2020).Diets can directly interact with microorganisms to promote or inhibit their growth, and the capability to extract energy from specific dietary constituents bestows a direct competitive advantage to selected members of the gut microbial community, rendering them more capable of proliferating at the expense of less-adept members. Diets not only affects the absolute and relative abundance of gut bacteria but also their growth kinetics (Korem et al., 2015; Zmora et al., 2019). Consumption of a high-fat diet (HFD) induces dysbiosis of gut microbiota, the relative abundance of Firmicutes and Proteobacteria increased, while the relative abundance of Bacteroidetes and Verrucomicrobia decreased (Walker et al., 2014b; Araujo et al., 2017; Wang et al., 2018). These changes were seen in the intestinal bacteria of both obese (Zhang et al., 2015; Chambers et al., 2019; Sergeev et al., 2020a) and NAFLD patients (Del Chierico et al., 2016; Hrncir et al., 2021), leading to metabolic dysfunction, insulin resistance, inflammation, obesity, and T2D (Sikalidis and Maykish, 2020), a major factor causing NAFLD. In contrast, consumption of a very-low-calorie ketogenic diet (VLCKD) can increase the abundance of SCFA-producing bacteria, such as Lactobacillus and Bifidobacterium spp., resulting in amelioration of adipose tissue inflammation in obesity and NAFLD (Cunha et al., 2020; Alsharairi, 2021).
Diet not only changes composition of intestinal bacteria but also is an important factor in changing intestinal metabolites such as amino acids, fatty acids, bile acids, and other metabolites (Yang et al., 2021). All the species interconnected in the gut produce an extremely diverse reservoir of metabolites from exogenous dietary components and/or endogenous compounds generated by microorganisms and the host (Agus et al., 2021).The gut microbiota can interact with the host by producing metabolites (Ye et al., 2019; Liang et al., 2021), which are small molecules (<1500 Da) representing intermediates or end-products of microbial metabolism. The beneficial or detrimental effects of specific microbiota-derived metabolites depend on the context and the host state, suggesting the primordial nature of the symbiotic microbiota in ensuring optimal health in humans. The liver and the intestine are tightly linked through the portal circulation. Consequently, intestinal metabolites primarily arriving at the liver may have pathogenic implications (Chassaing and Gewirtz, 2014; Brandl et al., 2017). It is currently believed that intestinal metabolites such as bile acids, lipids, amino acids, vitamins, and trimethylamine N-oxide are involved in regulating the occurrence and development of NAFLD. However, changes in the intestinal metabolites in NAFLD and which metabolite changes are caused by gut microbiota remain unclear.
In our experiment, 16S rDNA and Metabonomics technology were used to analyze the cecal microbiota and its metabolites in mice to study their characteristics and relationships and explore the regulation of gut microbiota and its metabolites on NAFLD development.
Materials and Methods
Animal Study
Animal Feeding and Sample Collection
Six-week-old specific pathogen-free male C57BL/6 mice (weighting 17-19 g) were purchased from Beijing Weitong Lihua Laboratory Animal Technology Co., LTD and housed at 22 ± 2°C and 50%-60% relative humidity in a specific pathogen-free facility maintained on a 12-hour light/dark cycle in the Laboratory Animal Center of Southwest Medical University. After one week of acclimatization, 20 mice were randomly divided into two groups for 12 weeks: CK group, (n=10, Standard chow diet), NAFLD group (n=10, High fat diet, HFD). The standard chow diet comprised 65.08 kcal% carbohydrates, 23.07 kcal% proteins and 11.85 kcal% fats, while the HFD diet contained 20 kcal% carbohydrates, 20 kcal% proteins and 60 kcal% fats. All experimental mice had free access to food and water. The physical activity, consumption of food and water, and defecation of experimental mice were observed daily.
At the end of the prescribed feeding period, all mice were fasted overnight and anesthetized with an intraperitoneal injection of 1% pentobarbital sodium (50 mg/kg body weight). After anesthetization, blood samples were collected from the cardiac artery. The liver samples were dissected and weighed immediately. The liver index was calculated using the following formula: liver wet weight/total body weight ×100%. After the liver was fixed with 4% paraformaldehyde, the tissue was sectioned and stained with hematoxylin-eosin (HE). The contents of the cecum were placed in liquid nitrogen and tested for the microbiome and metabolome. The experimental protocol was approved by the Animal Ethics Committee of Southwest Medical University (No. of Animal Ethics Approval: SWMU2019243).
Biochemical Analysis of Serum
Blood samples were acquired in the morning and centrifuged at 3500 r/min for 10 min at 4°C. Recovered supernatants were separated into 200 μl tubes and immediately frozen at -80°C. Liver function indexes such as alanine aminotransferase (ALT), aspartate aminotransferase (AST), triglyceride (TG), total cholesterol (TC), high-density lipoprotein (HDL) and low-density lipoprotein (LDL) were detected by a fully automatic veterinary biochemical analyzer.
Microbiota Analyses
Cecal DNA was isolated using the Qiagen Gel Extraction Kit (Qiagen, Hilden, Germany). The genomic DNA was amplified using fusion primers targeting the 16S V3-V4 rRNA gene with indexing barcodes. All samples were pooled for sequencing on the Illumina HiSeq platform according to the manufacturer’s specifications. Raw pyrosequencing reads were generated from FLASH (V1.2.7, http://ccb.jhu.Edu/software/FLASH/). Quality filtering, chimera removal and de novo operational taxonomic units (OTUs) clustering were carried out using the Uparse (V7.0.1001, http://drive5.com/uparse/), which identifies highly accurate OTUs from amplicon sequencing data with an identity threshold of 97%. Then the OTUs were used to screen effective sequences using Mothur (http://www.mothur.org/). The representative sequences of OTUs were used to analyze alpha-diversity (Chao1, Ace, Shannon and Simpson diversity index) based on their relative abundance. A heatmap was generated according to the relative abundance of OTUs by R software (V2.15.3, http://www.R-project.org). Principal Co-ordinates analysis (PCoA) based on UniFrac distance was performed with Qiime (V1.9.1, http://qiime.org/scripts/split_libraries_fastq.html). The linear discriminant analysis (LDA) with effect size measurements (LEfSe) was used to identify indicator bacterial groups specialized within the two groups.
Non-Targeted Metabolomics
Untargeted metabolomics were used to analyze 100 mg of cecal contents/sample. For LC-MS analysis, the samples were re-dissolved in 100 μL acetonitrile/water (1:1, v/v) solvent. Analyses were performed using a UHPLC (1290 Infinity LC, Agilent Technologies) coupled to a quadrupole time-of-flight (AB SciexTripleTOF 6600) in Shanghai Applied Protein Technology Co., Ltd. The positive and negative ionization modes of electrospray ionization (ESI) were used for mass spectrometry. The samples were separated by UHPLC and analyzed by Agilent 6550 mass spectrometer and the chromatographic and mass spectrometry conditions used are provided in the references (Luo et al., 2019).
For the data extracted using XCMS, ion peak data for which >50% of the data were missing within a group were deleted. After the data had been pre-processed by Pareto-scaling, pattern recognition was performed using SIMCA-P software (version 14.1, Umetrics, Umea, Sweden), consisting of unsupervised principal component analysis (PCA) and supervised orthogonal partial least squares discriminant analysis (OPLS-DA). The 7-fold cross-validation and response permutation testing were used to evaluate the robustness of the model. The variable importance in the projection (VIP) value of each variable in the OPLS-DA model was calculated to indicate its contribution to the classification. Metabolites with VIP value >1 were further applied to Students t-test at a univariate level to measure the significance of each metabolite and p-value less than 0.05 were considered statistically significant.
The metabolites were blasted against the online Kyoto Encyclopedia of Genes and Genomes (KEGG) database (http://geneontology.org/) to retrieve their KEGG orthologs (KOs) and were subsequently mapped to pathways in KEGG. KEGG pathway enrichment analyses were applied based on the Fisher’s exact test, considering the whole metabolites of each pathway as background dataset. Only pathways with p-value under a threshold of 0.05 were considered significant. The studied metabolites relative expression data was used to perform hierarchical clustering analysis. For this purpose, Cluster3.0 (http://bonsai.hgc.jp/~mdehoon/software/cluster/software.htm) and the Java Treeview software (http://jtreeview.sourceforge.net) were used.
Bioinformatic Analysis Using Multi-Omics Integration of Metabolome and Microbiome
Correlation Analysis Between Metabolome and Microbiome
The Spearman statistical method was used to analyze the correlation coefficients between the significant differences and metabolites screened in the experimental samples, as well as combine the R language (V2.15.3, http://www.R-project.org) and Cytoscape software (V3.8.2, https://cytoscape.org/) to perform matrix heat mapping, hierarchical clustering, and correlation network analysis. This allowed for exploration of the relationships between microbiota and metabolites from multiple angles.
Model-Based Integration of Metabolite Observations and Species Abundances 2
Integration of microbiome and metabolomics data was performed using Model-based Integration of Metabolite Observations and Species Abundances 2 (MIMOSA2), freely available at http://borensteinlab.com/software_MIMOSA2.html (Mchardy et al., 2013). MIMOSA2 summarizes paired microbiome–metabolome datasets to support mechanistic interpretation and hypothesis generation. MIMOSA2 applies a method for predicting relative metabolic turnover, using a metabolic network model to translate the resulting enzymatic gene abundance estimates into community-based metabolite potential (CMP) scores. Moreover, MIMOSA2 characterizes the relative capacity of community members to produce or consume metabolites based on a priori metabolic information of the activity of metabolic enzymes for each species from the KEGG database. It also describes how well each metabolite can be predicted by metabolic potential and estimates how much each taxon can explain each metabolite. While correlation-based statistical analyses of metabolomic measurements are not mechanistic, this framework has the advantage of proposing mechanisms for the contributions of species to the turnover of particular metabolites. A more detailed description of this framework can be found in previously published work by the developers (Mchardy et al., 2013; Noecker et al., 2016). However, the current version of MIMOSA2 has several limitations, including the inability to capture host metabolism and it does not consider the signaling processes, transcriptional regulation, or bounds on metabolic fluxes. Nevertheless, it assigns effects for enzymes catalyzing nonreversible reactions and presumably captures major metabolic fluxes for well-characterized microbes. However, the information is lost from reversible reactions, which may hinder the prediction of metabolites in other pathways (Chorna et al., 2020).
Statistical Analysis
Data are presented as mean ± SD. Statistical significance for body weight, fat weight, liver weight, liver index, serum indexes (TC, TG, HDL, LDL, AST, ALT), and relative abundance of bacteria were determined with Students t-test or Wilcoxon Rank Sum test. A p-value <0.05 was considered statistically significant. Statistical analysis was performed with SPSS software (Version 22, SPSS Inc., Chicago, USA)
Results
The Animal Model of NAFLD Was Successfully Established
Weight Gain and Fat Increase in NAFLD Mice
After being fed a high-fat diet for 3 months, the NAFLD mice were obviously enlarged (Figures 1A, B) with a markedly increased body weight (39.69 ± 4.31g, Figure 1C) and had significant differences as compared to normal mice (26.86 ± 1.08g, P<0.01) (Figure 1C). NAFLD mice had significantly more visceral fat (perirenal fat and epididymal fat) than normal mice (Figures 1D, E). The visceral fat weight of NAFLD mice (3.43 ± 0.77g) was significantly higher than that of the normal mice (0.61 ± 0.08, P<0.01) (Figure 1F).
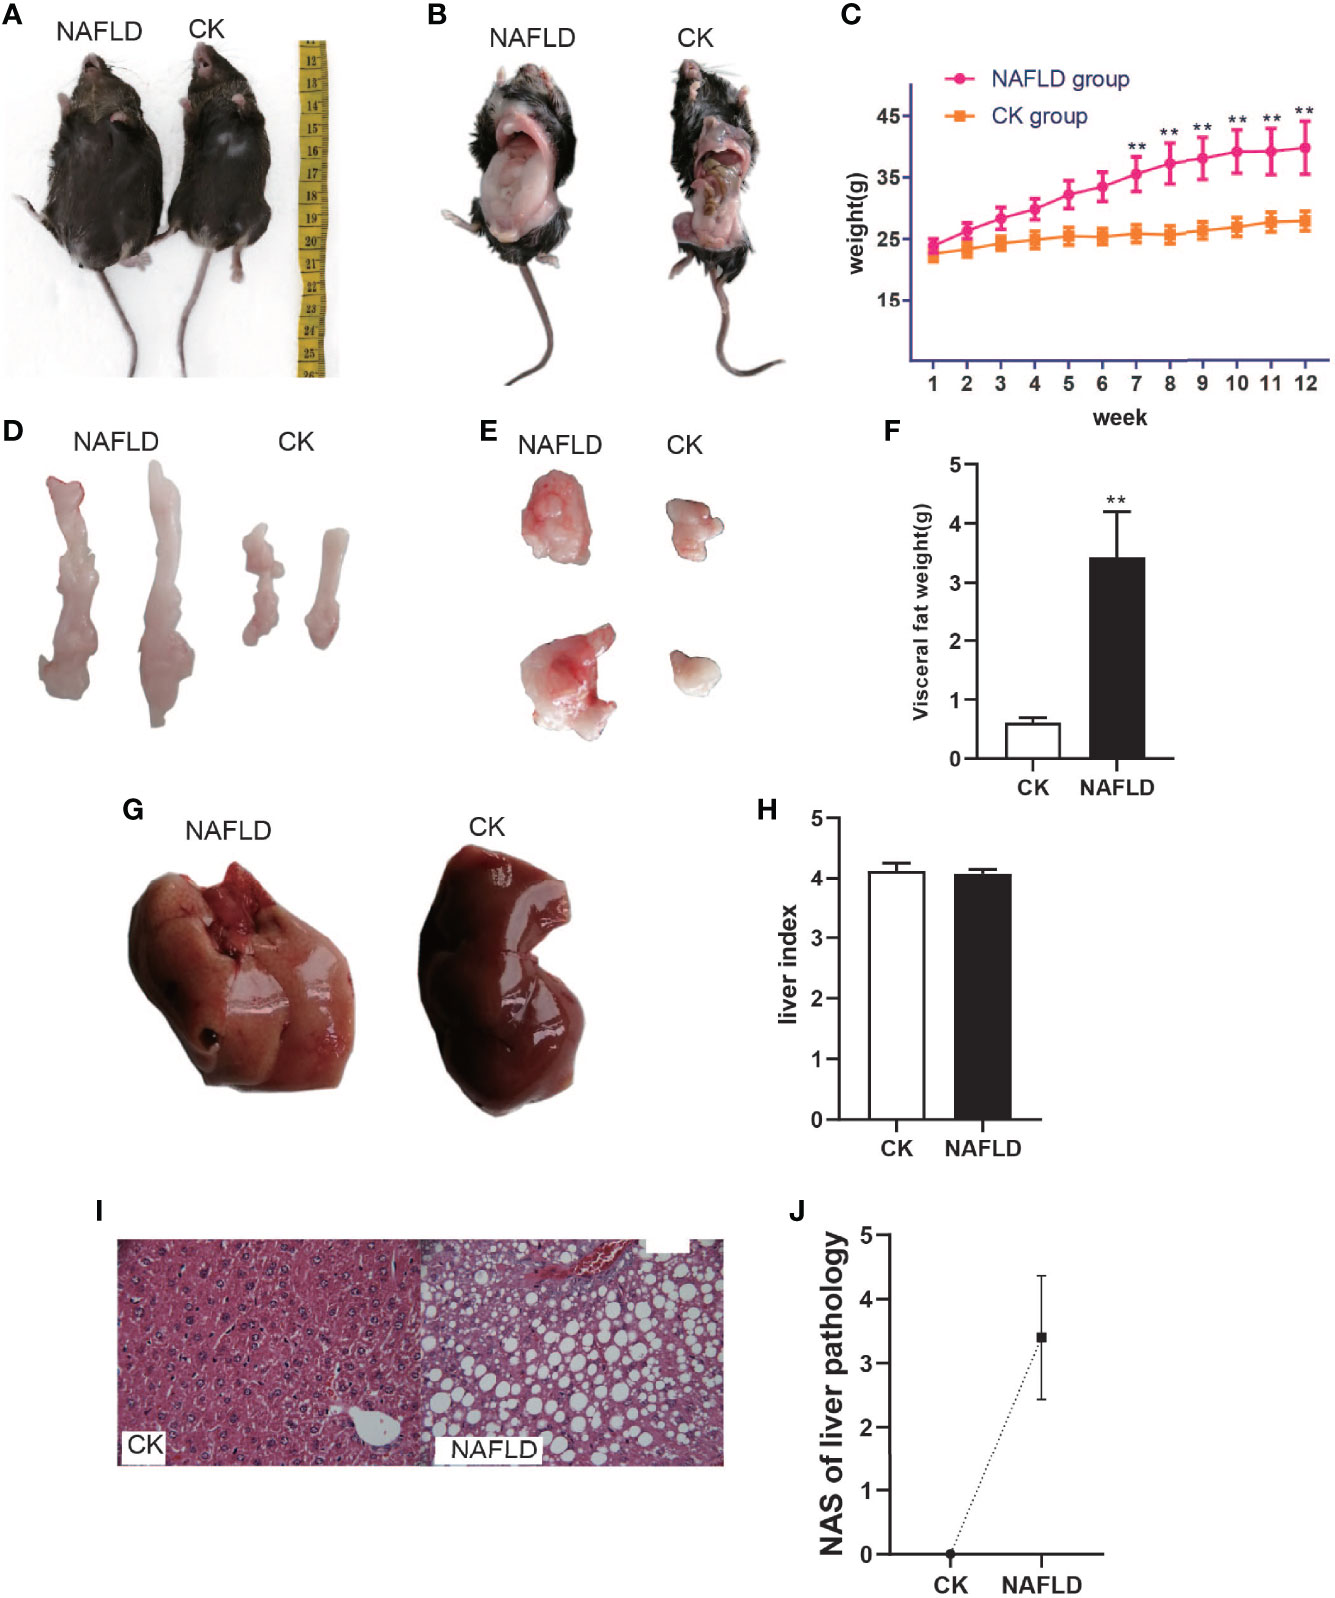
Figure 1 The body weight, fat mass, liver weight and Histopathology with CK and NAFLD mice, CK mice were fed Standard chow diet, NAFLD mice were fed HFD. (A, B) Representative pictures of CK and NAFLD mice, showing enormous discrepancy in body size. (C) Body weight changes in ND or HFD fed mice over 12 weeks. From week 7, the body weight of NAFLD group was significantly higher than CK group. (D, E) Representative pictures of perirenal fat and epididymal pad fat showing the difference of fat size between NAFLD mice and Control mice. (F) Tissue weight of perirenal fat and epididymal fat pads after 12 weeks of treatment. (G) Gross appearance of the liver. The liver of NAFLD mice was khaki yellow and that of normal mice was dark red. (H) There were no significant differences in liver index (% of body weight) between the groups. (I) Hematoxylin and eosin (H&E) staining of liver (400×), hepatocyte steatosis was obvious in NAFLD mice. (J) Through the NAS scoring system, the NAS score is 3.4, indicating moderate NAFLD. “**” indicated p-value < 0.01 (students t-test).
Liver Steatosis in NALFD Mice
To the naked eye, the liver of normal mice appeared to be dark red while the liver of NAFLD mice was khaki yellow (Figure 1G). Weighing the liver and calculating the liver index (% of body weight),liver index in NAFLD mice had no significant change (Figure 1H). Pathological sectioning showed that normal mouse liver cells were polygonal, arranged in hepatic cords, and distributed radially around the central vein with large round nuclei in the center of the cells, uniform cytoplasm, no lipid droplets, no steatosis, or inflammatory cell infiltration. The structure of the liver lobules of NAFLD mice was disordered, with the liver cells obviously swollen and lipid droplets of different sizes were present in the cytoplasm. The fusion of the lipid droplets caused the cell nucleus to shift or even disappear and some liver cells had ballooned in varying degrees (Figure 1I). Through the NAS scoring system, the NAS score was 3.4 (Figure 1J), indicating moderate NAFLD.
Serological testing found that the levels of liver injury indicators of NAFLD mice, total cholesterol (TC) (Figure 2A), triglycerides (TG) (Figure 2B), lipid indicators of low-density lipoprotein (LDL) (Figure 2D), alanine aminotransferase (ALT) (Figure 2E) and aspartate aminotransferase (AST) (Figure 2F), were significantly higher than the CK group. High-density lipoprotein (HDL) (Figure 2C) level was significantly lower than the CK group and each serum index had significant statistical significance (P<0.05).
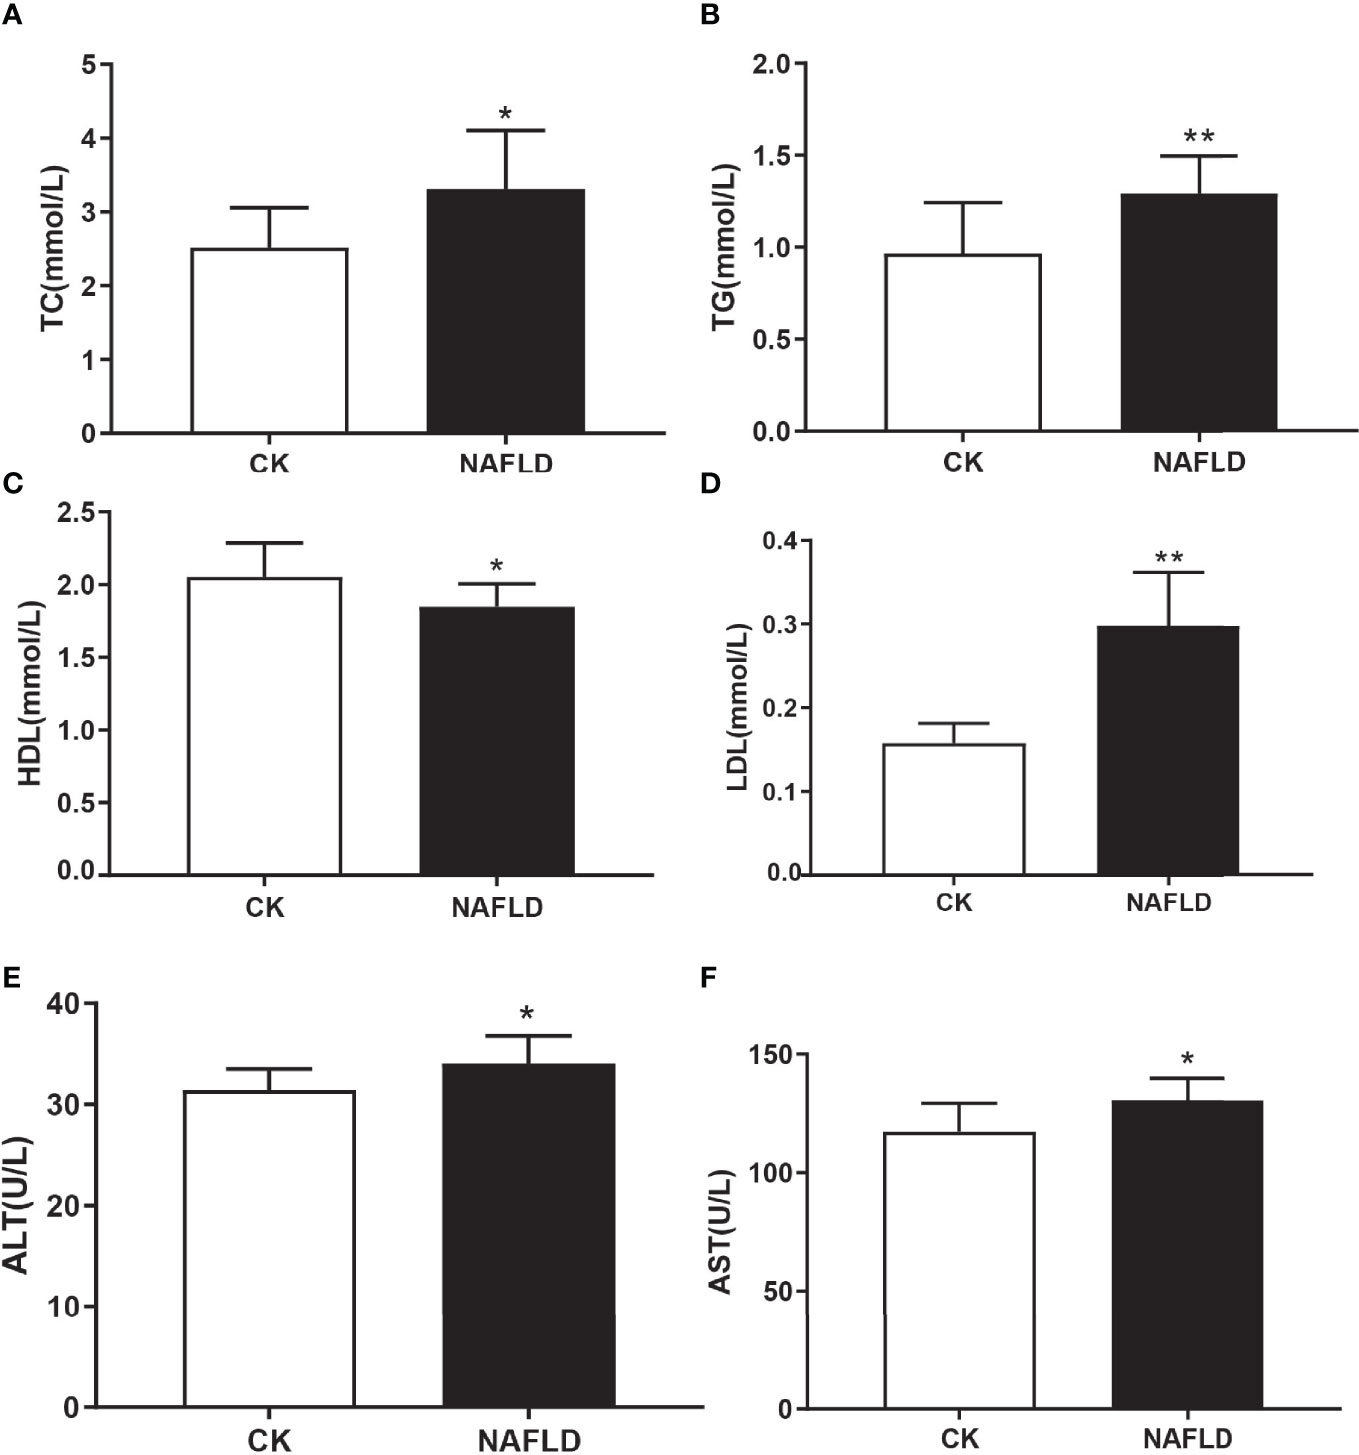
Figure 2 Serum lipid and liver function in Control and NAFLD mice. (A-F) Total cholesterol (TC), triglycerides (TG), high density lipoprotein (HDL), low density lipoprotein (LDL), aspartate aminotransferase-AST (E) and alanine aminotransferase (ALT) were significantly elevated in NAFLD mice. “*” indicated p-value < 0.05, “**” indicated p-value < 0.01 (Students t-test).
The Structure of Gut Microbiota in Mice With NAFLD Was Significantly Changed
The Alpha Diversity of Gut Microbiota Was Not Changed in NAFLD Mice
Different metrics have been devised to measure alpha diversity with emphasis on the different aspects of the community structure: Ace, Chao1, Shannon, and Simpson indexes (Figures 3A–D). Ace index and Chao1 index are used to evaluate the richness of microflora, while Shannon index and Simpson index are comprehensive indexes reflecting the richness and uniformity of microflora. The results showed that all four indexes analyzed had no significant difference (P>0.05), indicating that HFD did not change the alpha diversity of intestinal microbiota in mice.
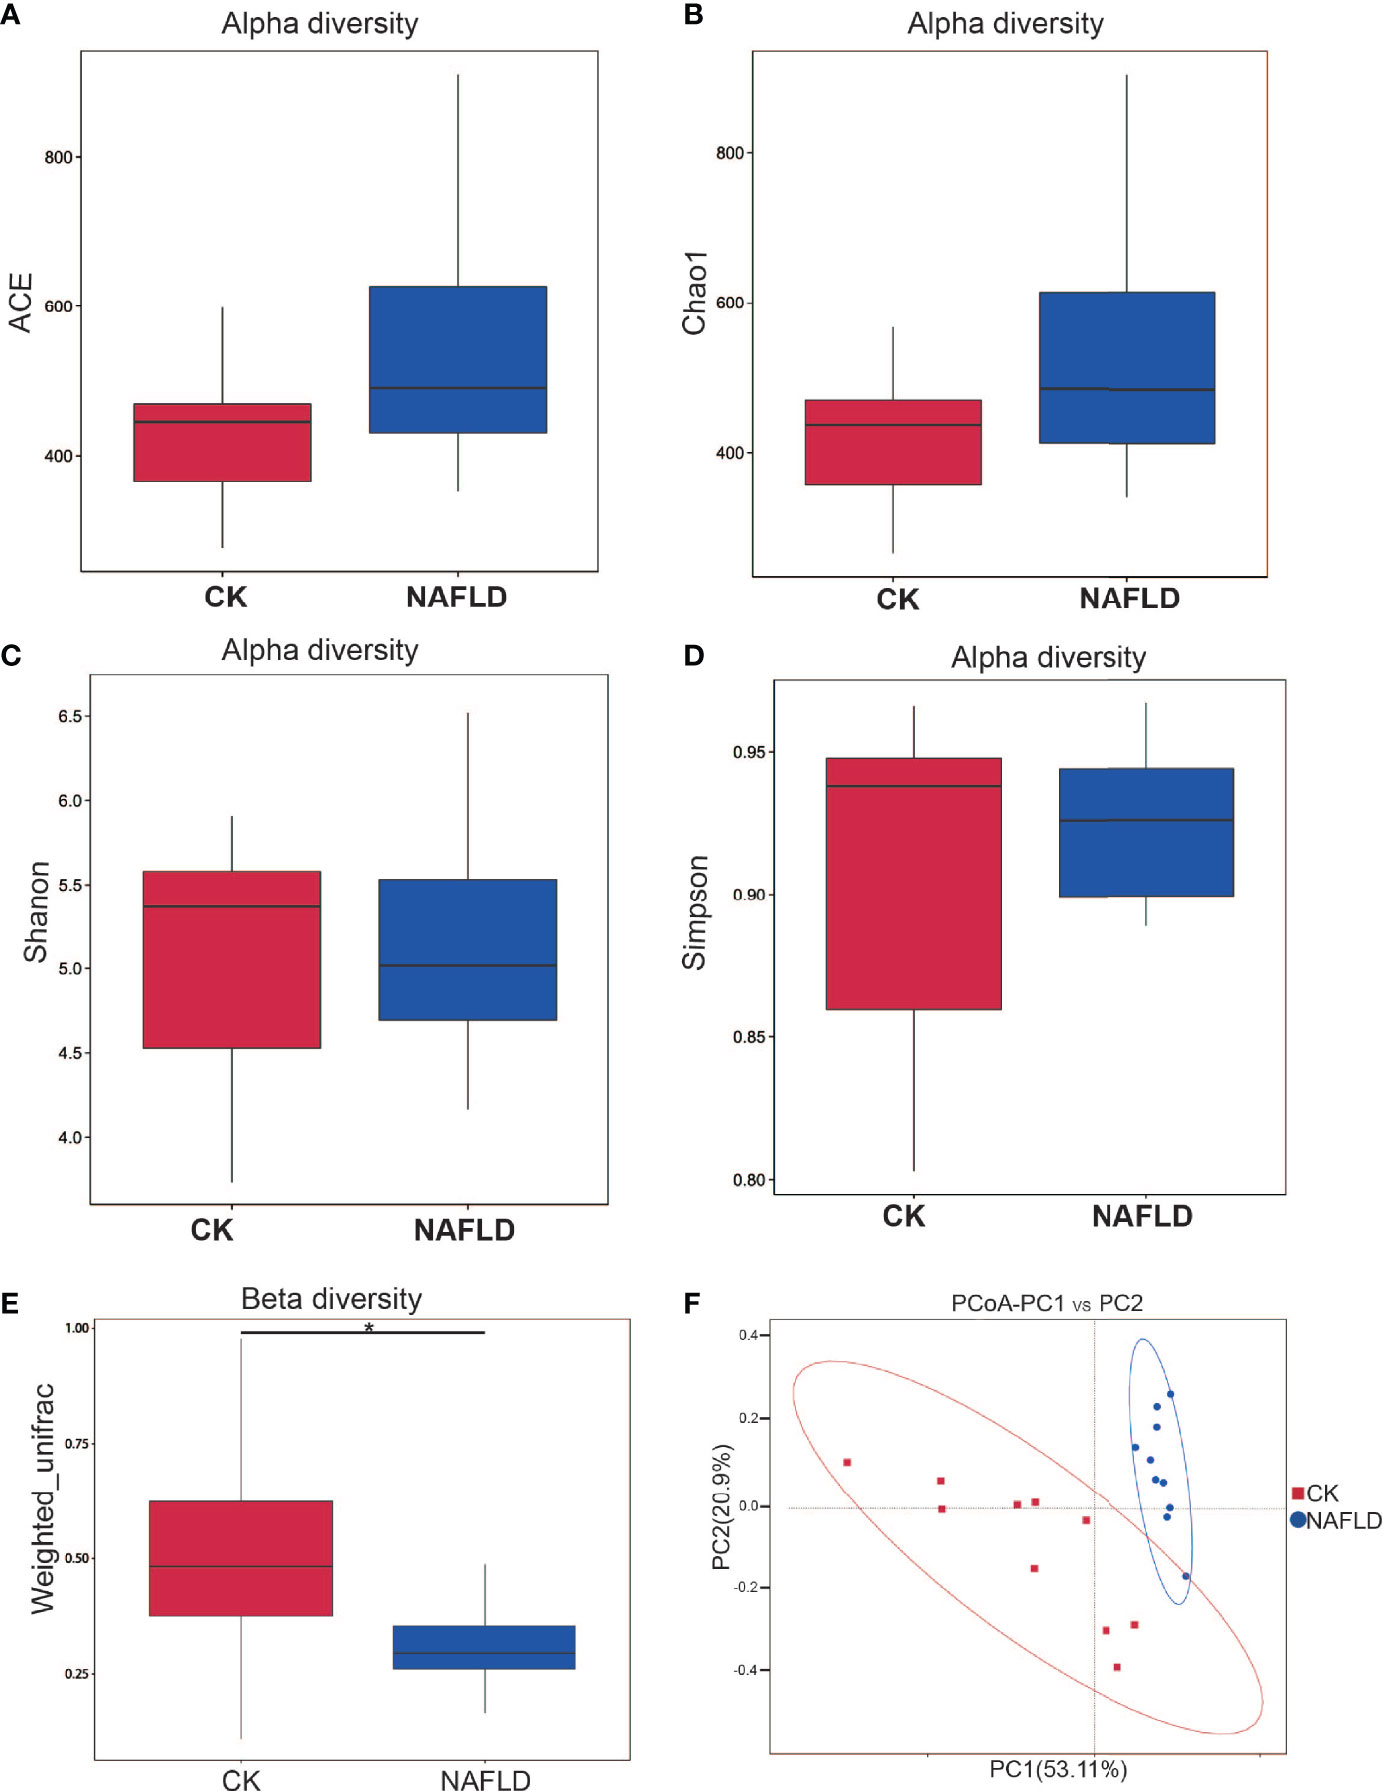
Figure 3 Alpha and beta diversity analysis of the bacterial community in the cecal contents of Control and NAFLD mice. (A-D) ACE, Chao1, Shannon, Simpson indexes had no significant difference between Control and NAFLD mice. (E, F) Beta diversity assessed by using PCoA of weighted UniFrac distance metrices had significant difference between Control and NAFLD mice. “*” indicated p-value < 0.05, (Wilcox Rank-Sum test).
The Beta Diversity of Gut Microbiota Was Changed in NAFLD Mice
Beta diversity measuring the variations in community membership across the different groups was performed to prove the differentiation between groups using OTU abundance with weighted Unifrac metrics, weighing species abundances with phylogenetic relationships among taxa. In principal coordinate analysis (PCoA) plots of cecal microbiota, there was significant difference between normal mice and NAFLD mice (Figures 3E, F).
The Abundance of Major Bacteria Was Changed in NAFLD Mice
We analyzed the 10 phyla, classes, families and genera with the highest relative abundance. Intergroup comparison was done by Students t-test, if data were normally distributed, or otherwise by Wilcoxon rank-sum test. It was found that the relative abundance of Firmicutes (P=0.025), Unidentified_Bacteria (P=0.013) and Deferribacteres (P=0.001) increased significantly, while Bacteroidetes (P<0.001) and Tenericutes (P=0.01) decreased significantly at the phylum level (Figure 4A). At the class level, Clostridia (P<0.001), Unidentified_Bacteria (P=0.013), Gammaproteobacteria (P=0.007), Unidentified_Actinobacteria (P=0.001) and Unidentified_Deferribacteres (P=0.001) increased significantly, while Bacteroidia (P<0.001) decreased significantly (Figure 4B). At the family level, Lachnospiraceae (P=0.002), Atopobiaceae (P<0.001), Helicobacteraceae (P=0.004), Burkholderiaceae (P=0.005) and Muribaculaceae (P<0.001) increased significantly, while Eggerthellaceae (P=0.002) and Ruminococcaceae (P=0.038) decreased significantly (Figure 4C). At the genus level, Blautia (P=0.003), Ileibacterium (P=0.049), Faecalibaculum (P=0.034), Helicobacter (P=0.004) and unidentified_Lachnospiraceae (P=0.003) increased significantly, while Allobaculum (P=0.001) and Enterorhabdus (P=0.003) decreased significantly (Figure 4D). Through LEfSle analysis, two different phyla (Unidentifined_Bacteria and Bacteroides), four classes (Bacteroides, Clostridium, Gamma-Proteobacteria and Unidentified-Bacteria), three orders (Bacteroides, Clostridium and Campylobacter), seven families (Lachnospiraceae, Helicobacteraceae, Eggerthellaceae, Muribaculaceae, Atopobiaceae, Peptostreptococcaceae and Ruminococcaceae), eight genera (Helicobacter, Blautia, Romboutsia, Ileibacterium, Faecalibaculum, Enterorhabdus, Allobaculum and Unidentified-Lachnospiraceae) and three species (Helicobacter-bilis, Lachnospiraceae-bacterium-M18-1 and Ileibacterium-valens) were found (Figures 4E, F).
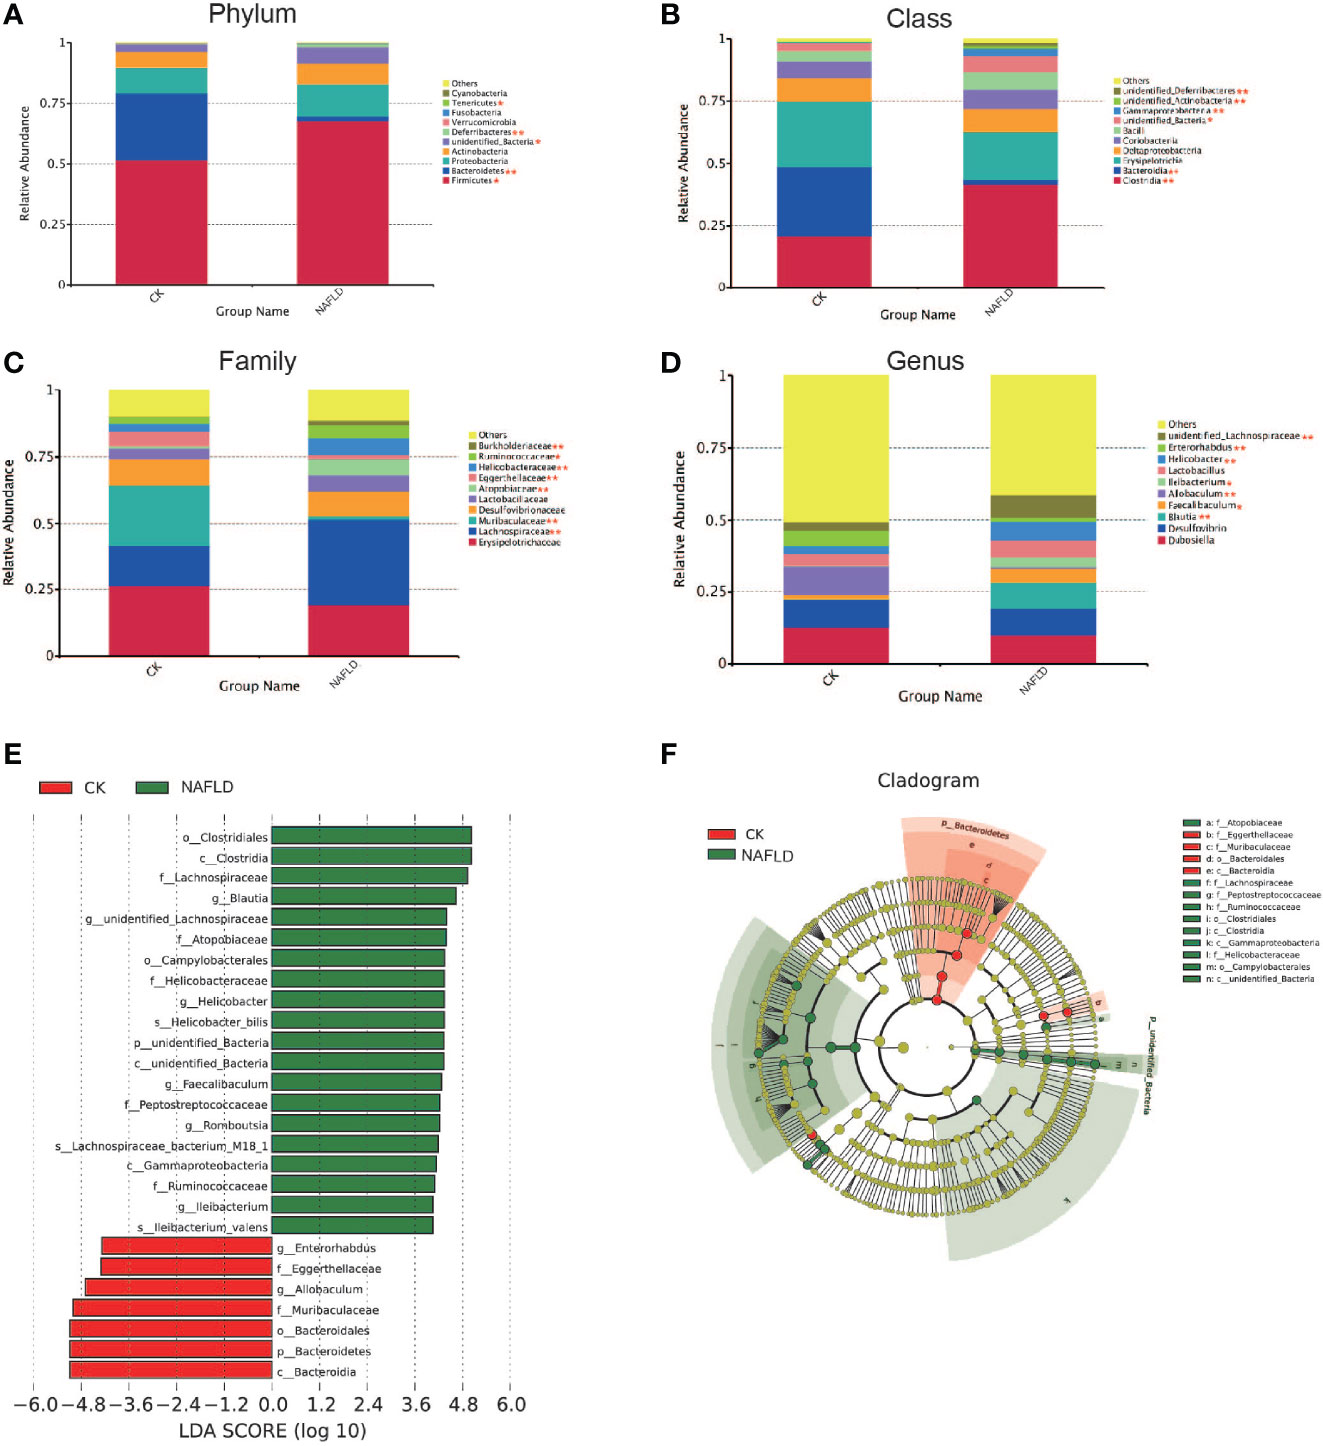
Figure 4 The distribution and composition of the bacterial community at each classification level. (A-D) Cecal bacterial profiles at the Phylum, Class, Family and Genus levels displaying relative abundance of the partial cecal microbiota. (E) Functional biomarkers found by linear discriminant analysis effect size (LEfSe); (F) Functional cladogram obtained from LEfSe. “*” indicated p-value < 0.05, “**” indicated p-value < 0.01 (Wilcox Rank-Sum test).
Intestinal Metabolite Profiles in NAFLD Mice Were Changed
To explore the mechanism by which intestinal microbiota influences the formation of NAFLD, we used an untargeted metabolome to detect cecal contents in mice. Firstly, we compared the total ion chromatograms (TIC) of 10 QC samples in positive or negative ion modes, including the retention time (RT), peak, intensity and degree of separation. Overlap of the TIC of QC samples was good, indicating that the method used was robust, with high repeatability and stability. The sample TIC showed that the peak shape was intact and that adjacent peaks were well separated from each other, indicating that the chromatographic and mass spectrometric conditions were suitable for sample identification (Figures S1A, B). Pearson correlation analysis was conducted on QC samples. Correlation coefficients of three QC samples in positive and negative ion mode were all greater than 0.99, indicating good correlation between QC samples (Figures S1C, D). QC samples fluctuated within the range of positive and negative three standard deviations in MCC, indicating that the test data were reliable (Figures S1E, F).
The PCA score plot showed that the interpretation rates of model (R2X) for normal mice and NAFLD mice under the positive and negative ion mode conditions were R2X=0.554 and 0.569 (Figures S2A, B), respectively. The two groups of samples were well separated and samples in the same group were well aggregated together (Figures S2A, B). The OPLS-DA supervised model was used to highlight the differences between groups. In the positive ion mode of the OPLS-DA score plot, R2X=0.438, R2Y=0.987(Figure S2C), Q2 = 0.962, whereas in the negative ion mode, R2X=0.435, R2Y=0.992, Q2 = 0.948 (Figure S2D). Both R2Y and Q2 values were close to 1, indicating that the model was stable and reliable. The OPLS-DA models were validated based on interpretation of variation in Y (R2Y) and forecast ability based on the model (Q2) in cross-validation and permutation tests by applying 200 iterations. The Q2 intercept values were less than 0.05, indicating that there was no overfitting and the OPLS-DA model had good predictability (Figures S2E, F). We used Fold Change Analysis (FC) and Students t-test to obtain the FC value and P value respectively to make a volcano map. In this experiment, using FC>1.5 and P<0.05 as the screening conditions to obtain the volcano map, 123 metabolites were screened in the positive ion mode and 78 metabolites were screened in the negative ion mode. All metabolites in the positive and negative ion mode were seen to be normally distributed. By combining the VIP values obtained from the OPLS-DA model and using VIP>1 and P<0.05 as the screening conditions for significantly different metabolites, 167 significantly different metabolites were obtained (Figures S3A, B).
In order to further screen the marker metabolites, the 167 significantly different metabolites selected in this experiment were analyzed by Hierarchical Clustering and KEGG metabolic pathways through the MetaboAnalyst 4.0 online analysis platform. The enrichment results of KEGG pathway (top 20) are shown in Figure 5, indicating that metabolites are mainly involved in the following metabolic pathways, including ABC transporter, protein digestion and absorption, aminoacyl-tRNA and arginine biosynthesis, glycine, serine and threonine metabolism, alanine, aspartic acid and glutamate metabolism, histidine metabolism, arginine and proline metabolism, unsaturated fatty acid biosynthesis, fatty acid biosynthesis, Pyrimidine metabolism, and purine metabolism.
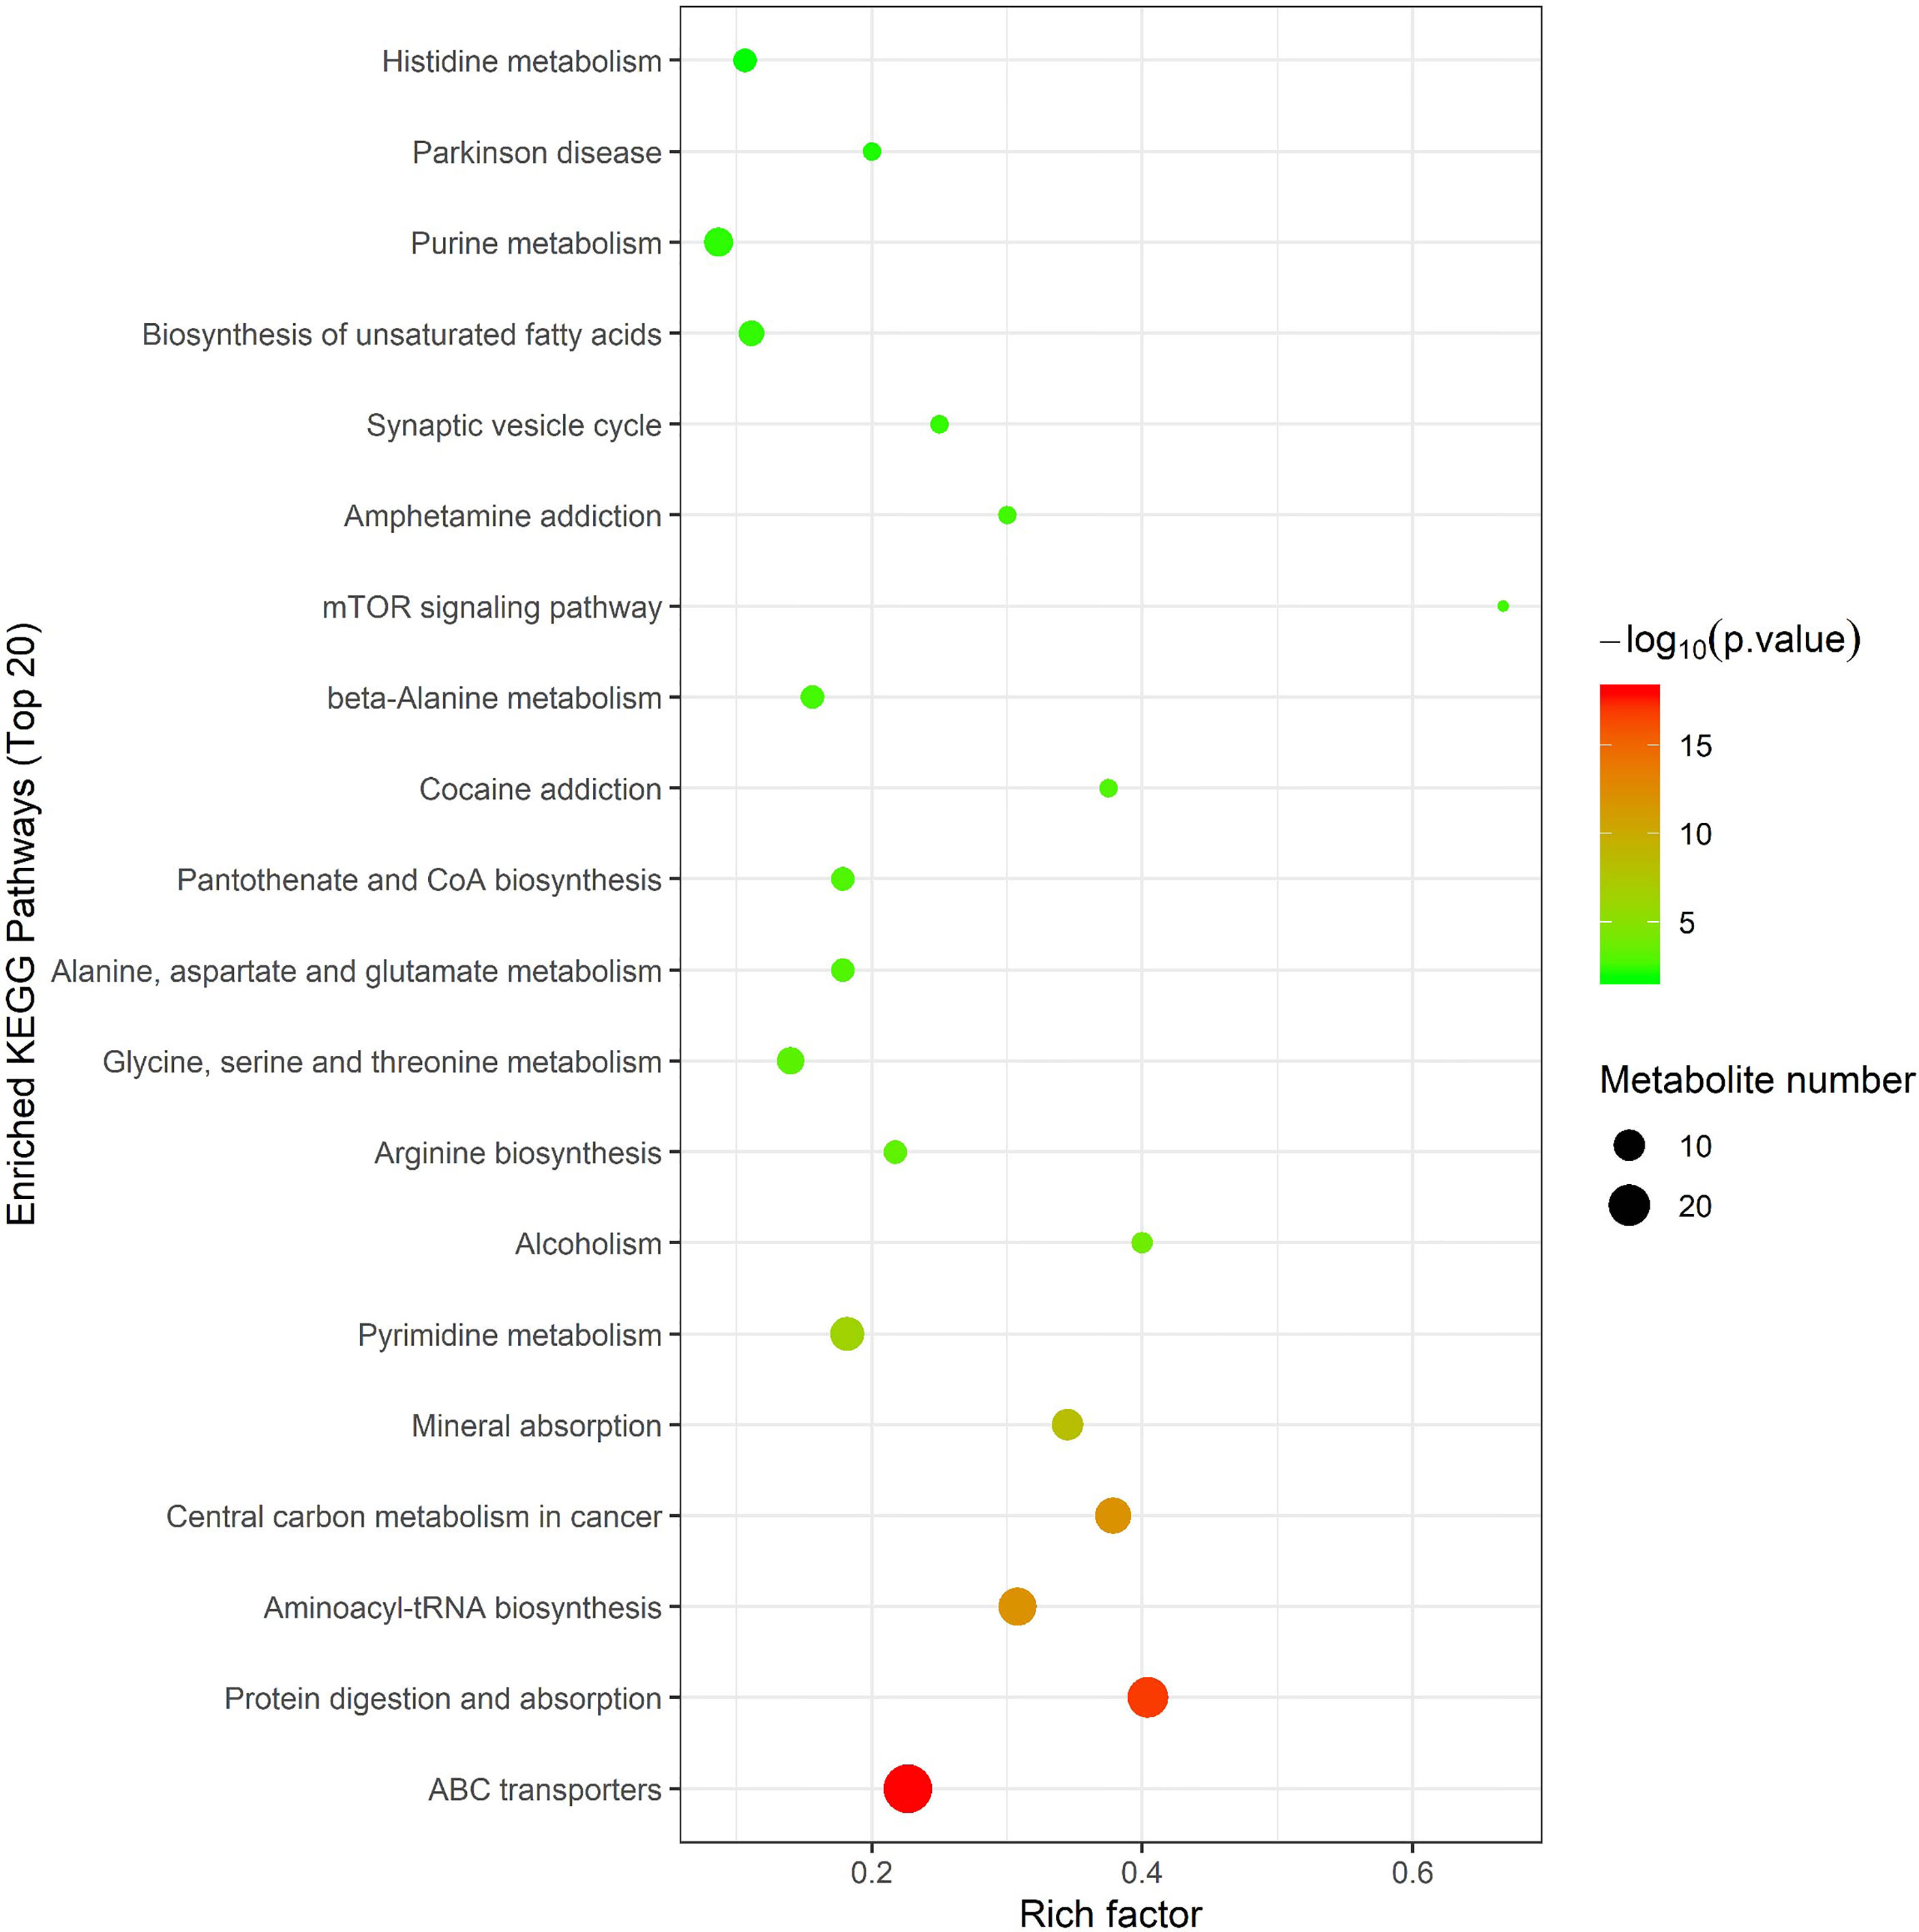
Figure 5 Metabolic pathway analysis using MetaboAnalyst 4.0 (http://www.metaboanalyst.ca). x-axis: Rich factor, y-axis: metabolic pathway. Circle color represents -log10(p-value) and the size of the circle represent the number of metabolites enriched in metabolic pathway.
Some of the Metabolite Changes Are Caused by the Gut Microbiota
The Spearman statistical method was used to analyze the correlation coefficients between the 8 genera with significant differences in the cecal microbiota screened by 16S rDNA technology and the 167 differential metabolites screened by metabolomics (Figure S4). The results showed that 8 kinds of genera are related to 70 amino acids and their derivatives (Figure 6), 32 lipids (Figure 7), 6 bile acids (Figure 8A), 20 nucleotides (Figure 8B) and vitamins (Figure 8C). However, whether intestinal bacteria are involved in the metabolism of these 167 metabolites is still unclear.
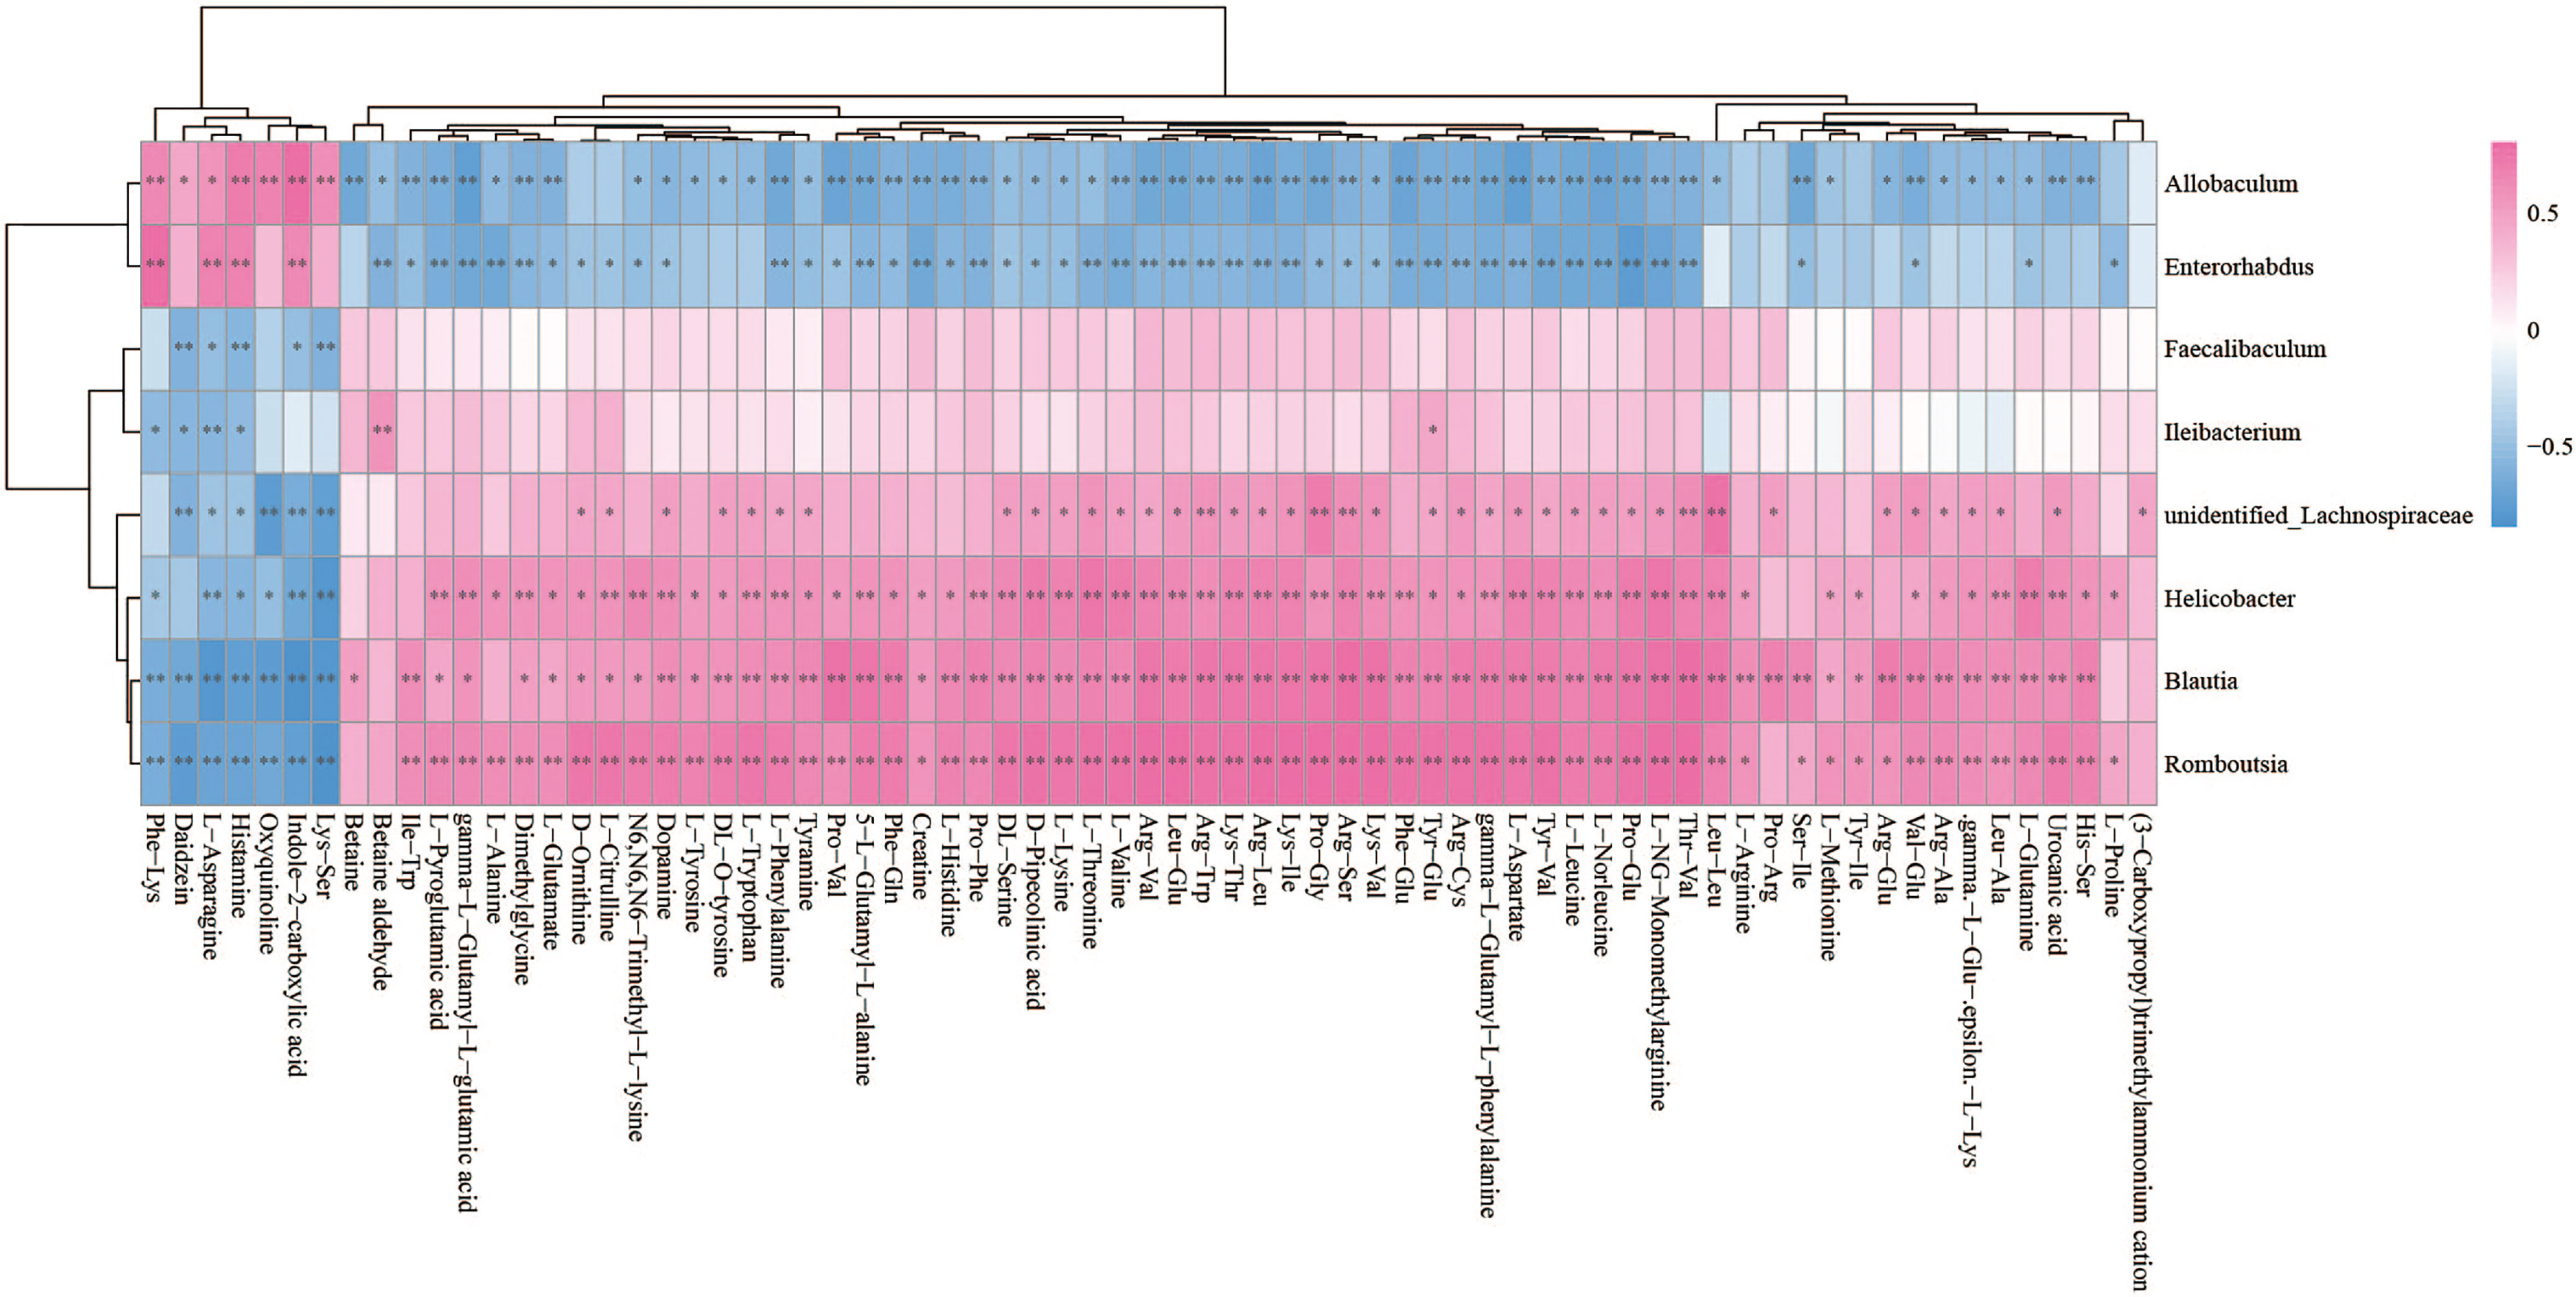
Figure 6 Spearman correlations between significant bacteria based on LEfSe and differential amino acids and their derivatives are presented in the form of a correlation coefficient matrix heat map. The correlation coefficient r is shown in color. r >0, positive correlation, shown in red; r < 0 represents a negative correlation, shown in blue, and the darker the color, the stronger the correlation. “*” indicated p-value < 0.05, “**” indicated p-value < 0.01.
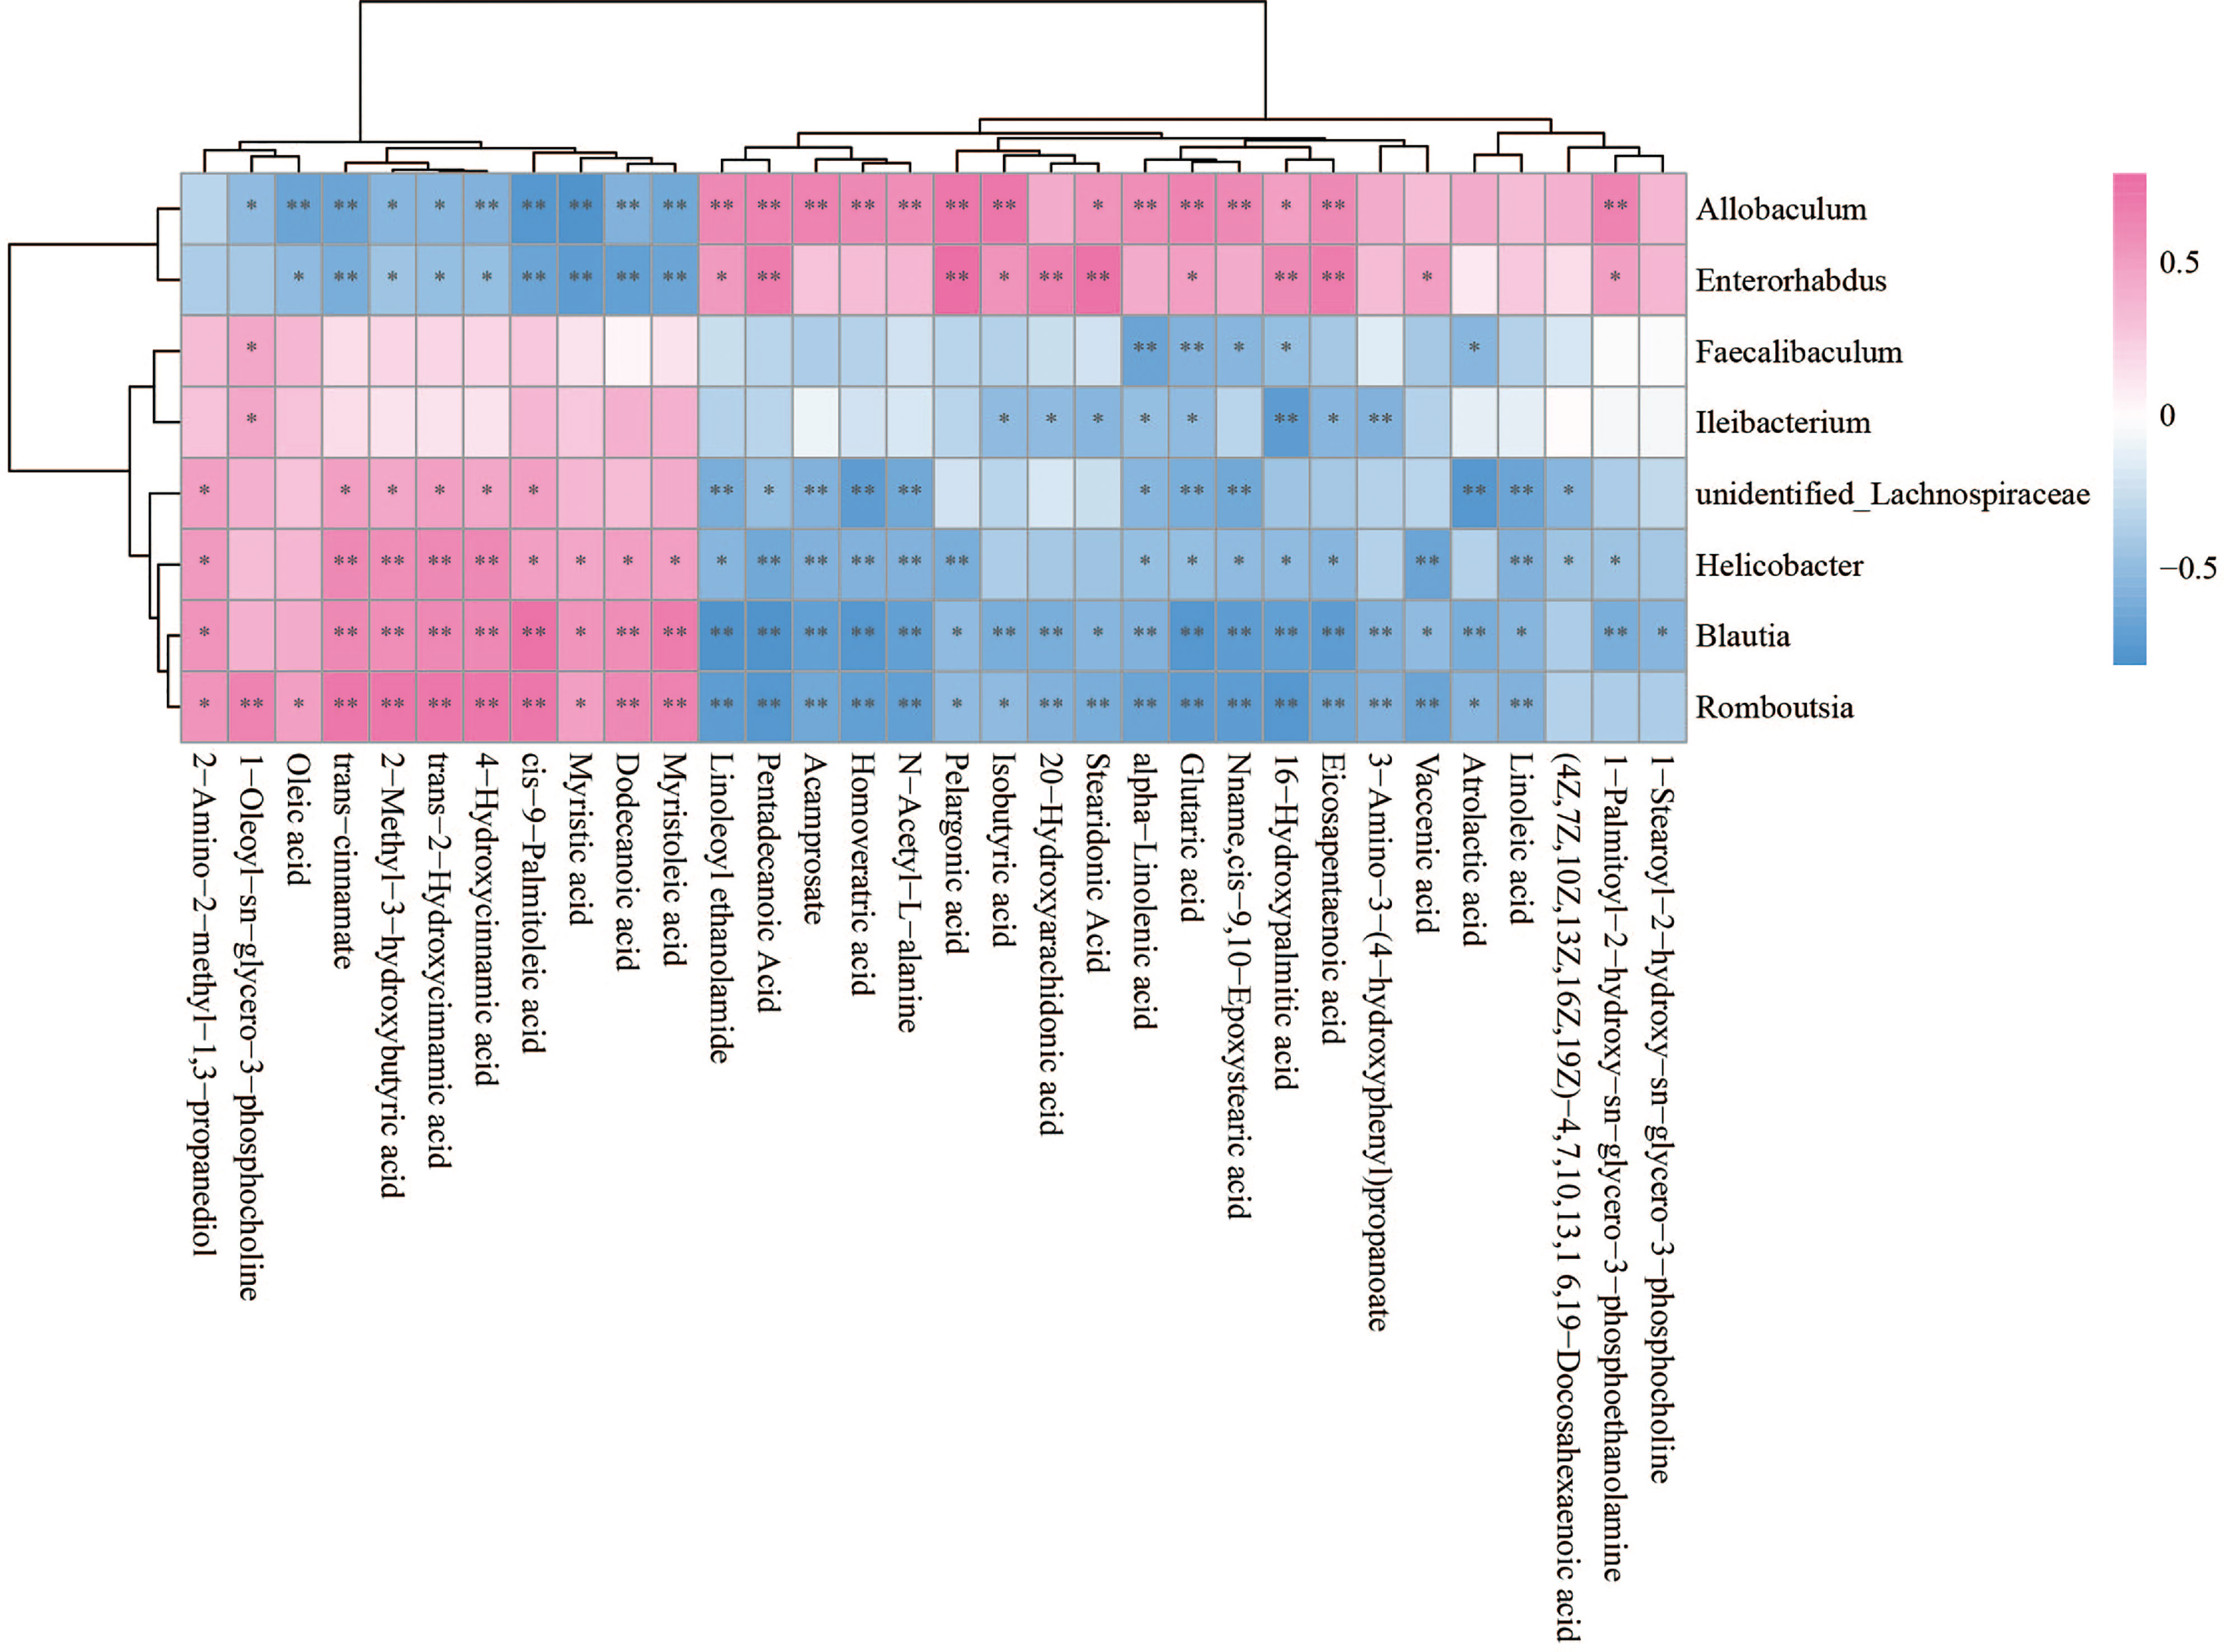
Figure 7 Spearman correlations between significant bacteria based on LEfSe and differential lipid are presented in the form of a correlation coefficient matrix heat map. The correlation coefficient r is shown in color. r >0, positive correlation, shown in red; r < 0 represents a negative correlation, shown in blue, and the darker the color, the stronger the correlation. “*” indicated p-value < 0.05, “**” indicated p-value < 0.01.
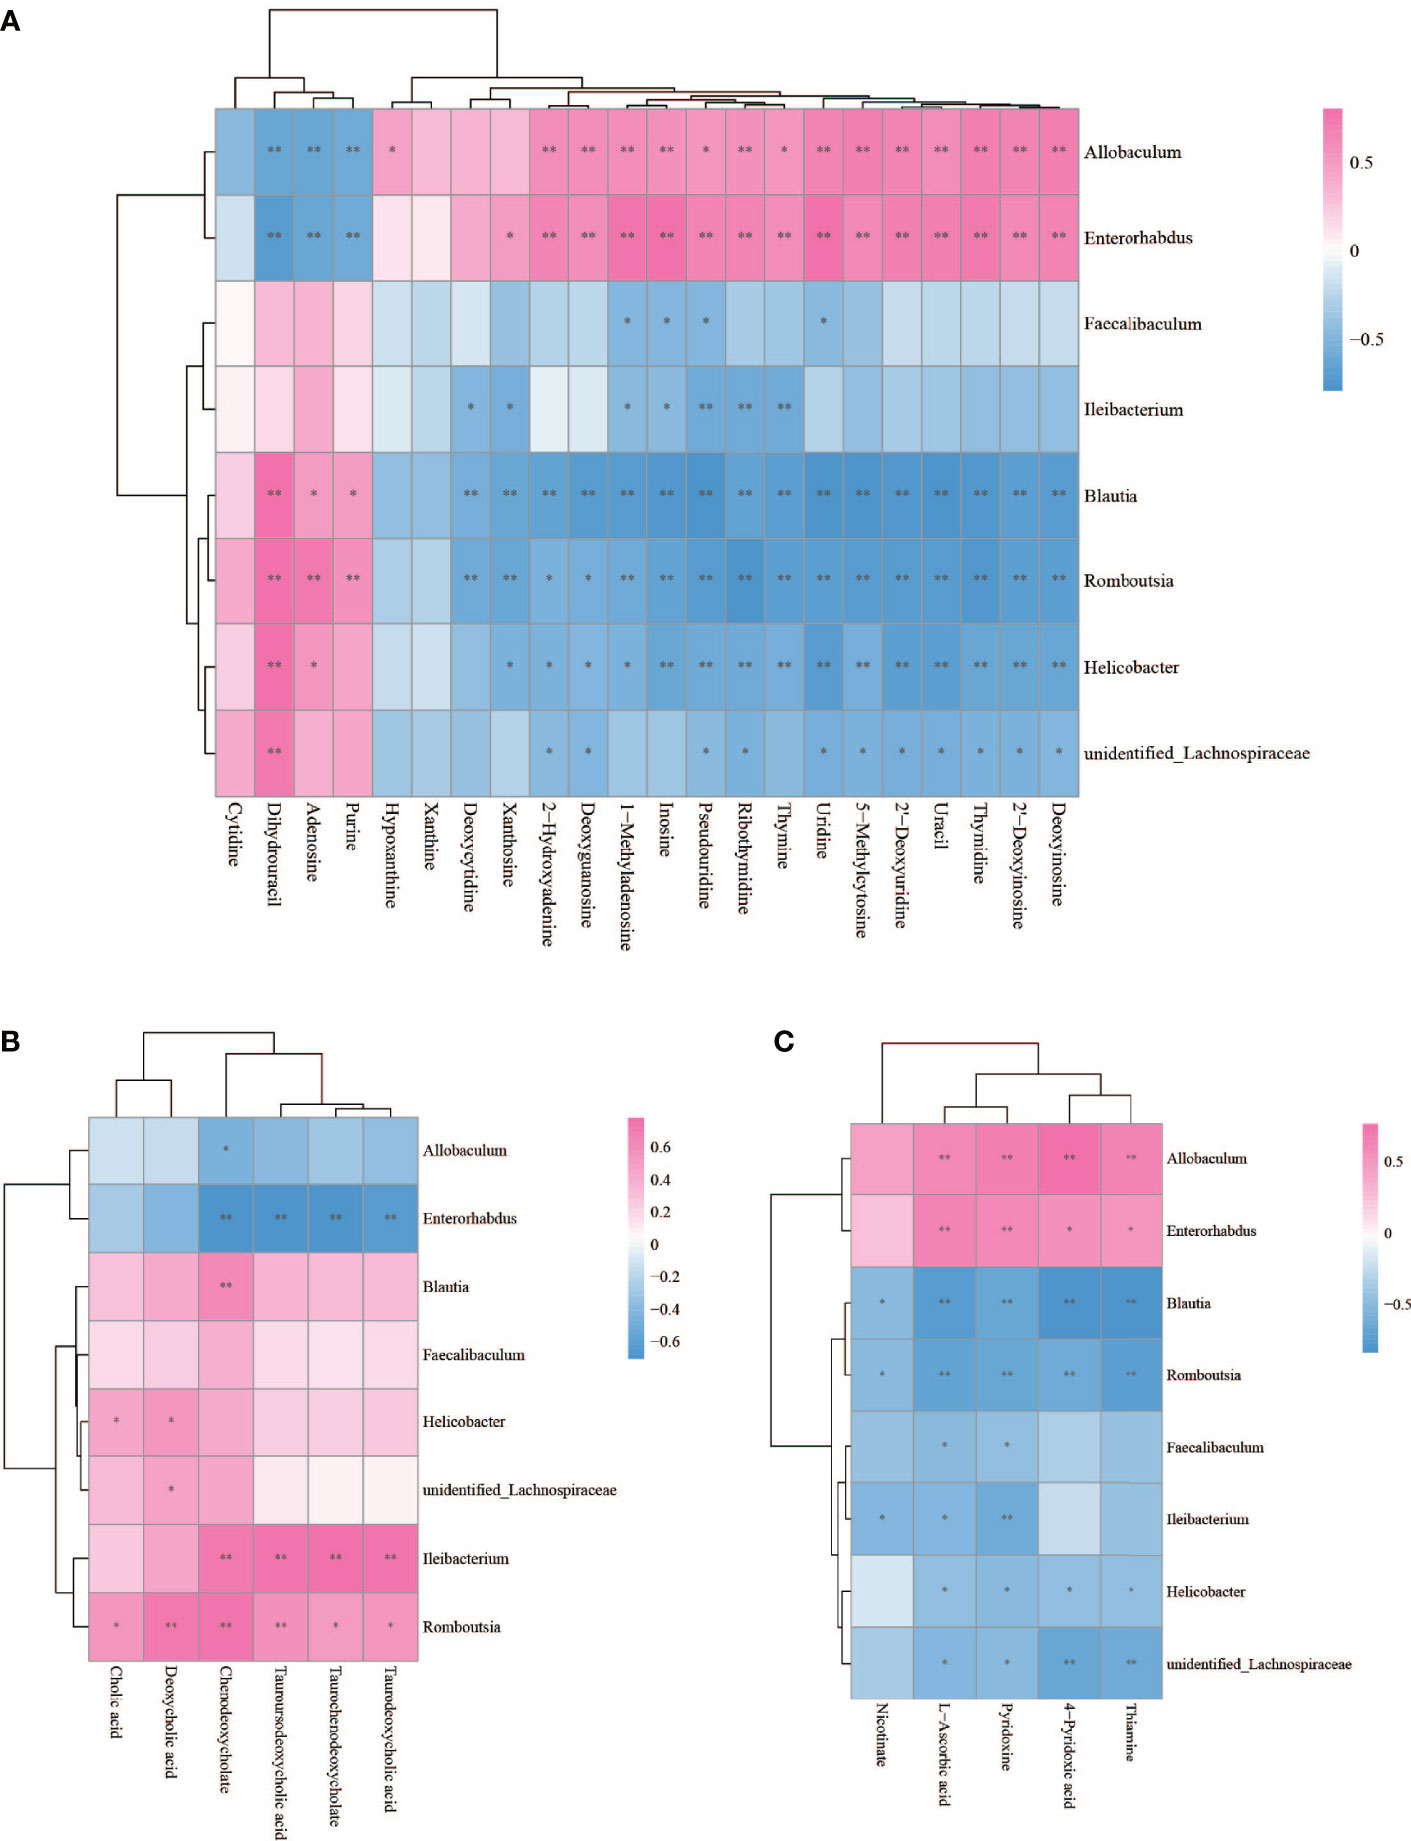
Figure 8 Spearman correlations between significant bacteria based on LEfSe and differential nucleotide (A), bile acid (B), vitamin (C) are presented in the form of a correlation coefficient matrix heat map. The correlation coefficient r is shown in color. r >0, positive correlation, shown in red; r < 0 represents a negative correlation, shown in blue, and the darker the color, the stronger the correlation. “*” indicated p-value < 0.05, “**” indicated p-value < 0.01.
To evaluate the relative ability of members of the cervicovaginal microbial community in each sample groupings to produce or utilize individual metabolites (Chorna et al., 2020), we compared the contribution of individual species to the calculated community metabolic profile (CMP) scores on the MIMOSA2 website. MIMOSA2 is an extension of MIMOSA, a novel framework for mechanistically linking microbiome ecology and metabolomic data (Noecker et al., 2016; Nalbantoglu and Sayood, 2019; Chorna et al., 2020; Gallardo et al., 2020). Well-predicted metabolites were identified by the CMP score model in CK and NAFLD groups by examining the total pool of metabolites with a positive model slope and a model p-value<0.1. The gut microbiota contributed to the changes in the abundance of 7 metabolites: thiamine, hypoxanthine, L-phenylalanine, tyramine, betaine, 5-Methylcytosine and pyridoxine (Figure 9A and Table S2). According to the literature, of the seven metabolites, betaine, thiamine, phenylalanine and tyramine exert a potential inhibitory effect on fatty liver. By MIMOSA2 analysis, intestinal microbiota promoted upregulation of betaine, L-phenylalanine, and tyramine and down-regulation of thiamine and pyridoxine. An unknown bacterium (Greengene ID#184451) has the ability to express betaine-aldehyde dehydrogenase (KEGG ID#K00130) and is the major bacterium responsible for the change in betaine abundance. f_Coriobacteriaceae (Greengene ID#269986), g_Helicobacter (Greengene ID#4339015), f_Peptostreptococcaceae (Greengene ID#258904), f_Lachnospiraceae (Greengene ID#246246) and unknown bacterium (Greengene ID#184451) can express chorismate mutase (KEGG ID#K14170), phenylalanyl-tRNA synthetase alpha chain (KEGG ID#K01889) and phenylalanyl-tRNA synthetase beta chain (KEGG ID#K01890), and are the main bacteria causing the upregulation of L-phenylalanine in NAFLD mice. Dorea (Greengene ID#839200) and g_Turicibacter(Greengene ID#216933), which can express Monoamine oxidase (KEGG ID#K00274), are the main bacteria causing the upregulation of tyramine. g_Ruminococcus (Greengene ID#306914), unknown bacterium (Greengene ID#184451) and f_Coriobacteriaceae (Greengene ID#269986), which can express pyridoxine kinase (KEGG ID#K00868), are the main bacteria causing the downregulation of pyrdoxine. g_Allobaculum (Greengene ID#135952) can express thiamine phosphate phosphatase (KEGG ID#K06949) and since its downregulation promotes thiamine downregulation, it is also one of the main reasons for L-phenylalanine upregulation (Figure 9B and Table S2).
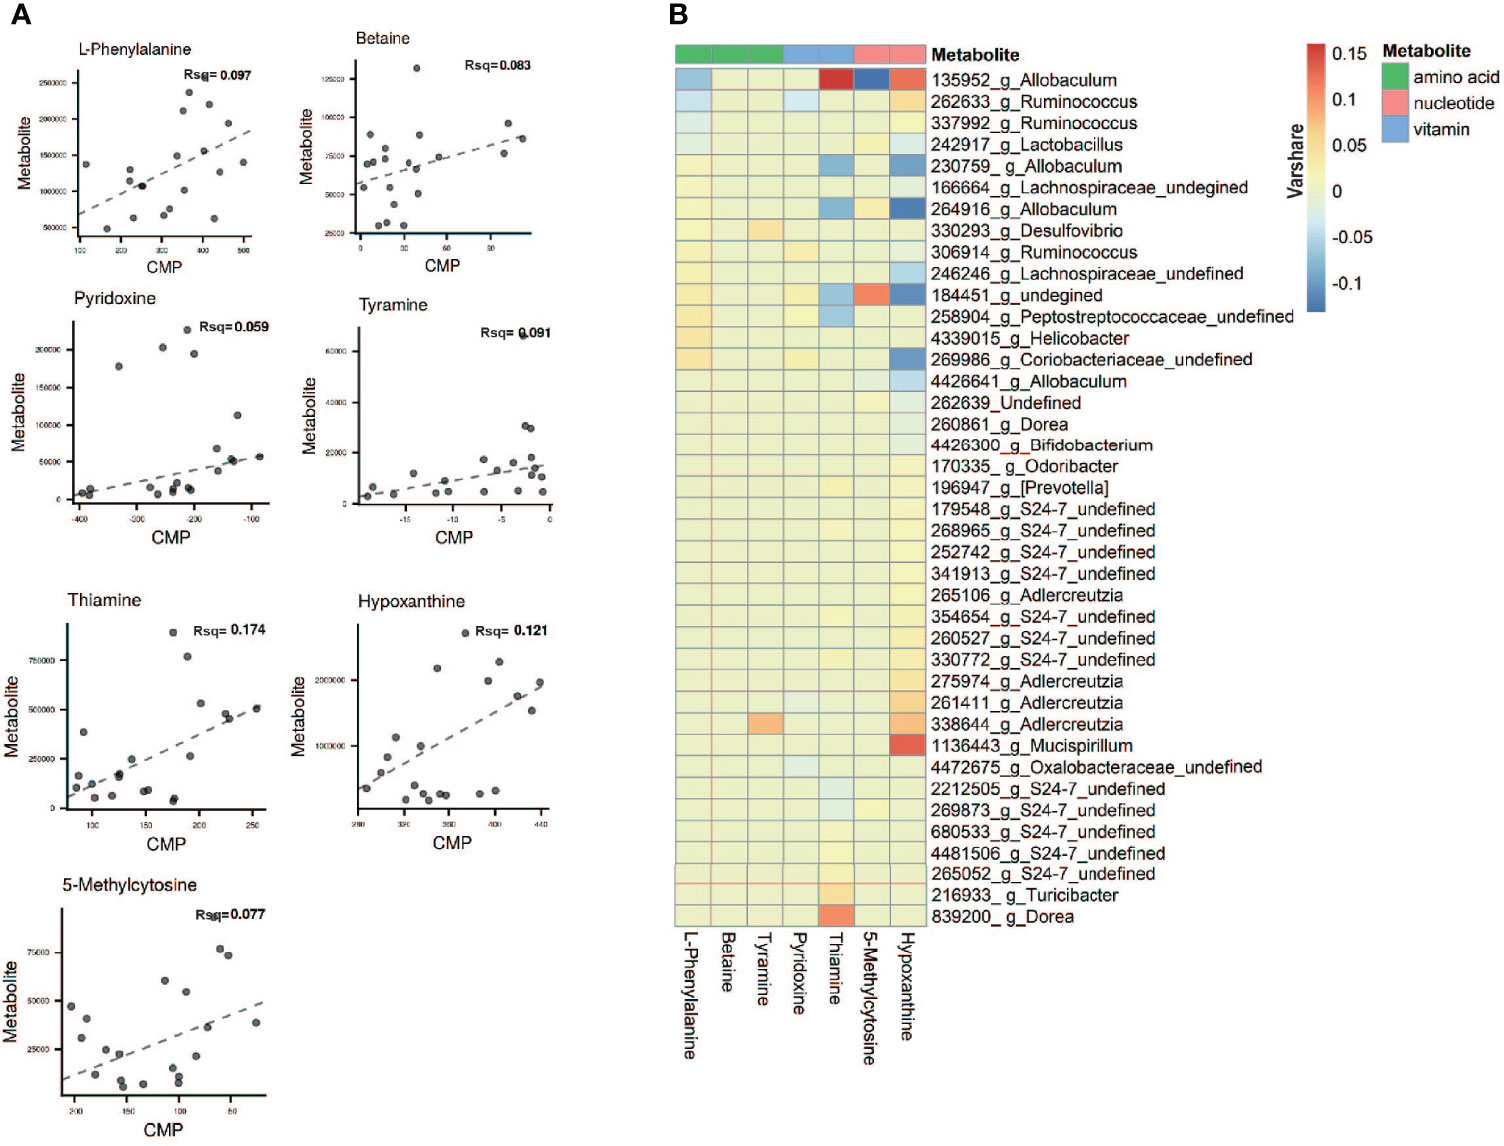
Figure 9 Microbial contribution to metabolite variance based on MIMOSA2. (A) Comprison plots showed the overall relationship between community-level metabolic potential scores (CMP) and metabolite measurements. R-square (Rsq) of the regression model used for prediction represents the sum of the contributions of all listed taxa to the metabolite variance. Contribution results are only included for metabolites with a model p-value less than 0.1 and positive slope of model. (B) Contribution heatmap showed the major taxonomic contributors with Varshare more than 0.01 to variation for each metabolite, red represents positive contribution; blue represents negative contribution; the darker the color, the greater the contribution. “Varshare” represents the fraction of the variation in each metabolite explained by the taxon in question, according to the overall community model.
Discussion
In order to explore the role of gut microbiota and its metabolites in the formation of NAFLD, we induced liver steatosis by HFD. We used HFD induction rather than methionine-choline deficiency diets because HFD models better mimic fatty liver disease in humans (Arao et al., 2020). Studies also showed that while the HFD-induced NAFLD mouse model was reversible, the liver of NAFLD mice induced by methionine deficiency diet showed obvious inflammation and liver fibrosis, which was in an irreversible state. Therefore, it is recommended to use HFD induction if studying the early stages of fatty liver and methionine-choline deficient feed induction if studying the severe stages of fatty liver. Only about 20% of NAFLD in humans will enter the fibrosis stage (Matteoni et al., 1999; Sanyal, 2019). While our histopathological section also showed significant steatosis of the liver, it was still mainly steatosis without massive hepatocyte necrosis and fibrosis.
The cecal contents of mice was collected as the research focus. Alpha diversity analysis based on 16S rDNA showed no significant differences in the Chao1, Ace, Shannon, and Simpson indexes between NAFLD mice and normal mice (Figures 3A–D). The results indicate that the diversity and richness of gut microbiota in NAFLD mice did not change. The beta diversity analysis showed a significant change in the PCoA index, indicating that while the HFD had not changed the types of bacteria taxa present, it had changed the relative abundance of bacteria at different classification levels. Thus, the structure of gut microbiota was changed but since the changes were not severe, it was still in the reversible stage. This is also a common feature of gut microbiota after HFD induction (Walker et al., 2014; Xiao et al., 2017; Wallis et al., 2020). After returning to a normal diet, the gut microbiota returns to its original characteristics (Xiao et al., 2017). Consequently, we propose that the changes in intestinal structure are mainly caused by diet (Xiao et al., 2017).
At the phylum level, it was found that Firmicutes in the NAFLD mice increased significantly while the Bacteroides decreased significantly. This is supported by the results of other studies (Lambert et al., 2015). After a HFD, the abundance of murine Firmicutes increased while that of Bacteroides decreased (Walker et al., 2014). In the human gut, the abundance of Firmicutes in people with obesity (Sergeev et al., 2020), fatty liver (Lambert et al., 2015) or diabetes (Palacios et al., 2020) also increased and the abundance of Bacteroides decreased. Hildebrandt et al. (Hildebrandt et al., 2009) believed that after the normal diet was changed to a high fat diet, regardless of the obesity status of the mice, the number of Bacteroides in their gut decreased, while the numbers of Firmicutes and Proteobacteria increased. This shows that the changes in gut microbiota are due to diet instead of obesity or fatty liver.
LEfSe analysis highlights statistical significance and biological correlation and can identify diagnostic markers. LEfse analysis showed that the abundance of six bacteria genera increased significantly, while two other genera showed a significant decrease in the cecum of NAFLD mice. The abundance of Helicobacter, unidentified_Lachnospiraceae, Blautia, Romboutisa, Faecalibaculum and Ileibacterium significantly increased in our experiment. Helicobacter is considered as an intestinal pathogenic bacterium, belonging to Campylobacteraceae with Helicobacter pylori. Some studies believe that Helicobacter is a contributing factor in the development of NAFLD and that eradication of Helicobacter is an effective preventive or therapeutic measure (Sumida et al., 2015; Waluga et al., 2015) but this remains a controversial issue at present (Baeg et al., 2016; Kim et al., 2017). Blautia is also another controversial bacterium. The abundance of Blautia is positively correlated with obesity (Goffredo et al., 2016) and serum TG (Tang et al., 2018; Carbajo-Pescador et al., 2019), suggesting that Blautia may be involved in the early occurrence of obesity-related NAFLD. However, in some studies, Blautia has been shown to be a potentially beneficial bacterium (Li et al., 2016; Fu et al., 2018) which can ameliorate NAFLD or obesity (Zhang et al., 2019; Zhou and Fan, 2019; Zheng et al., 2020). There are few studies on Romboutsia, Faecalibaculum (Li et al., 2018; Hu et al., 2019) and Ileibacterium (Bai et al., 2019). In those studies, these bacteria were significantly increased in NAFLD mice, although their physiological effects on NAFLD are not clear. Results of LEfSe analysis showed that Allobaculum and Enterorhabdus significantly decreased in NAFLD mice. Other experiments also found that Allobaculum was also significantly decreased after HFD induction (Raza et al., 2017; Ghaffarzadegan et al., 2018). Allobaculum was confirmed to be an important functional bacterium (Zhang et al., 2012; Everard et al., 2014) that is negatively correlated with obesity, especially subcutaneous fat content (Hu et al., 2019). It has been reported that Allobaculum, as a beneficial bacterium, is associated with weight loss in mice with normal metabolism, manifested as insulin sensitivity and remission of systemic inflammation. Some researchers hypothesized that the increased abundance of Allobaculum can help young mice resist the development of obesity (Hildebrandt et al., 2009) and assist in improving the integrity of the intestinal barrier (Le Roy et al., 2013). Enterorhabdus is a gram-negative bacterium that exists only in mice and its association with obesity has been controversial (Guo et al., 2020). In conclusion, the relationship between these bacteria and NAFLD requires further study.
To further explore the relationship between gut microbiota and NAFLD, we performed metabolome analysis of cecal content. We successfully screened 167 differential metabolites. Through correlation analysis between differential metabolites and gut microbiota, we found that although changes in gut microbiota have a certain correlation with changes in lipid metabolites (Figure 7), MIMOSA2 analysis showed that the difference in microbiota did not contribute to changes in lipid metabolites (Figure 9A and Table S2). The HFD which we used contains 34% lard. Oleic acid is the largest component of lard (with a content of 31.97%-50.52%), followed by Palmitic acid (19.97%-27.75%), Stearic acid (6.37%-17.81%), LA (11.7%-23.84%) and α-LA (0.23%-2.09%) (Shestakov Iu and Piroxhnik, 1976; Jensen et al., 1999). Metabolome analysis found that Oleic acid and Palmitic acid significantly increased, while LA, α-LA, AA, Stearidonic acid, EPA and DHA were significantly reduced in NAFLD mice. Therefore, we speculated that the HFD, instead of the gut microbiota, was responsible for the decrease of ω3-PUfas and the increase of saturated fatty acids and oleic acid in the intestinal tract of NAFLD mice, thus leading to the accumulation of liver lipids (Figure 10).
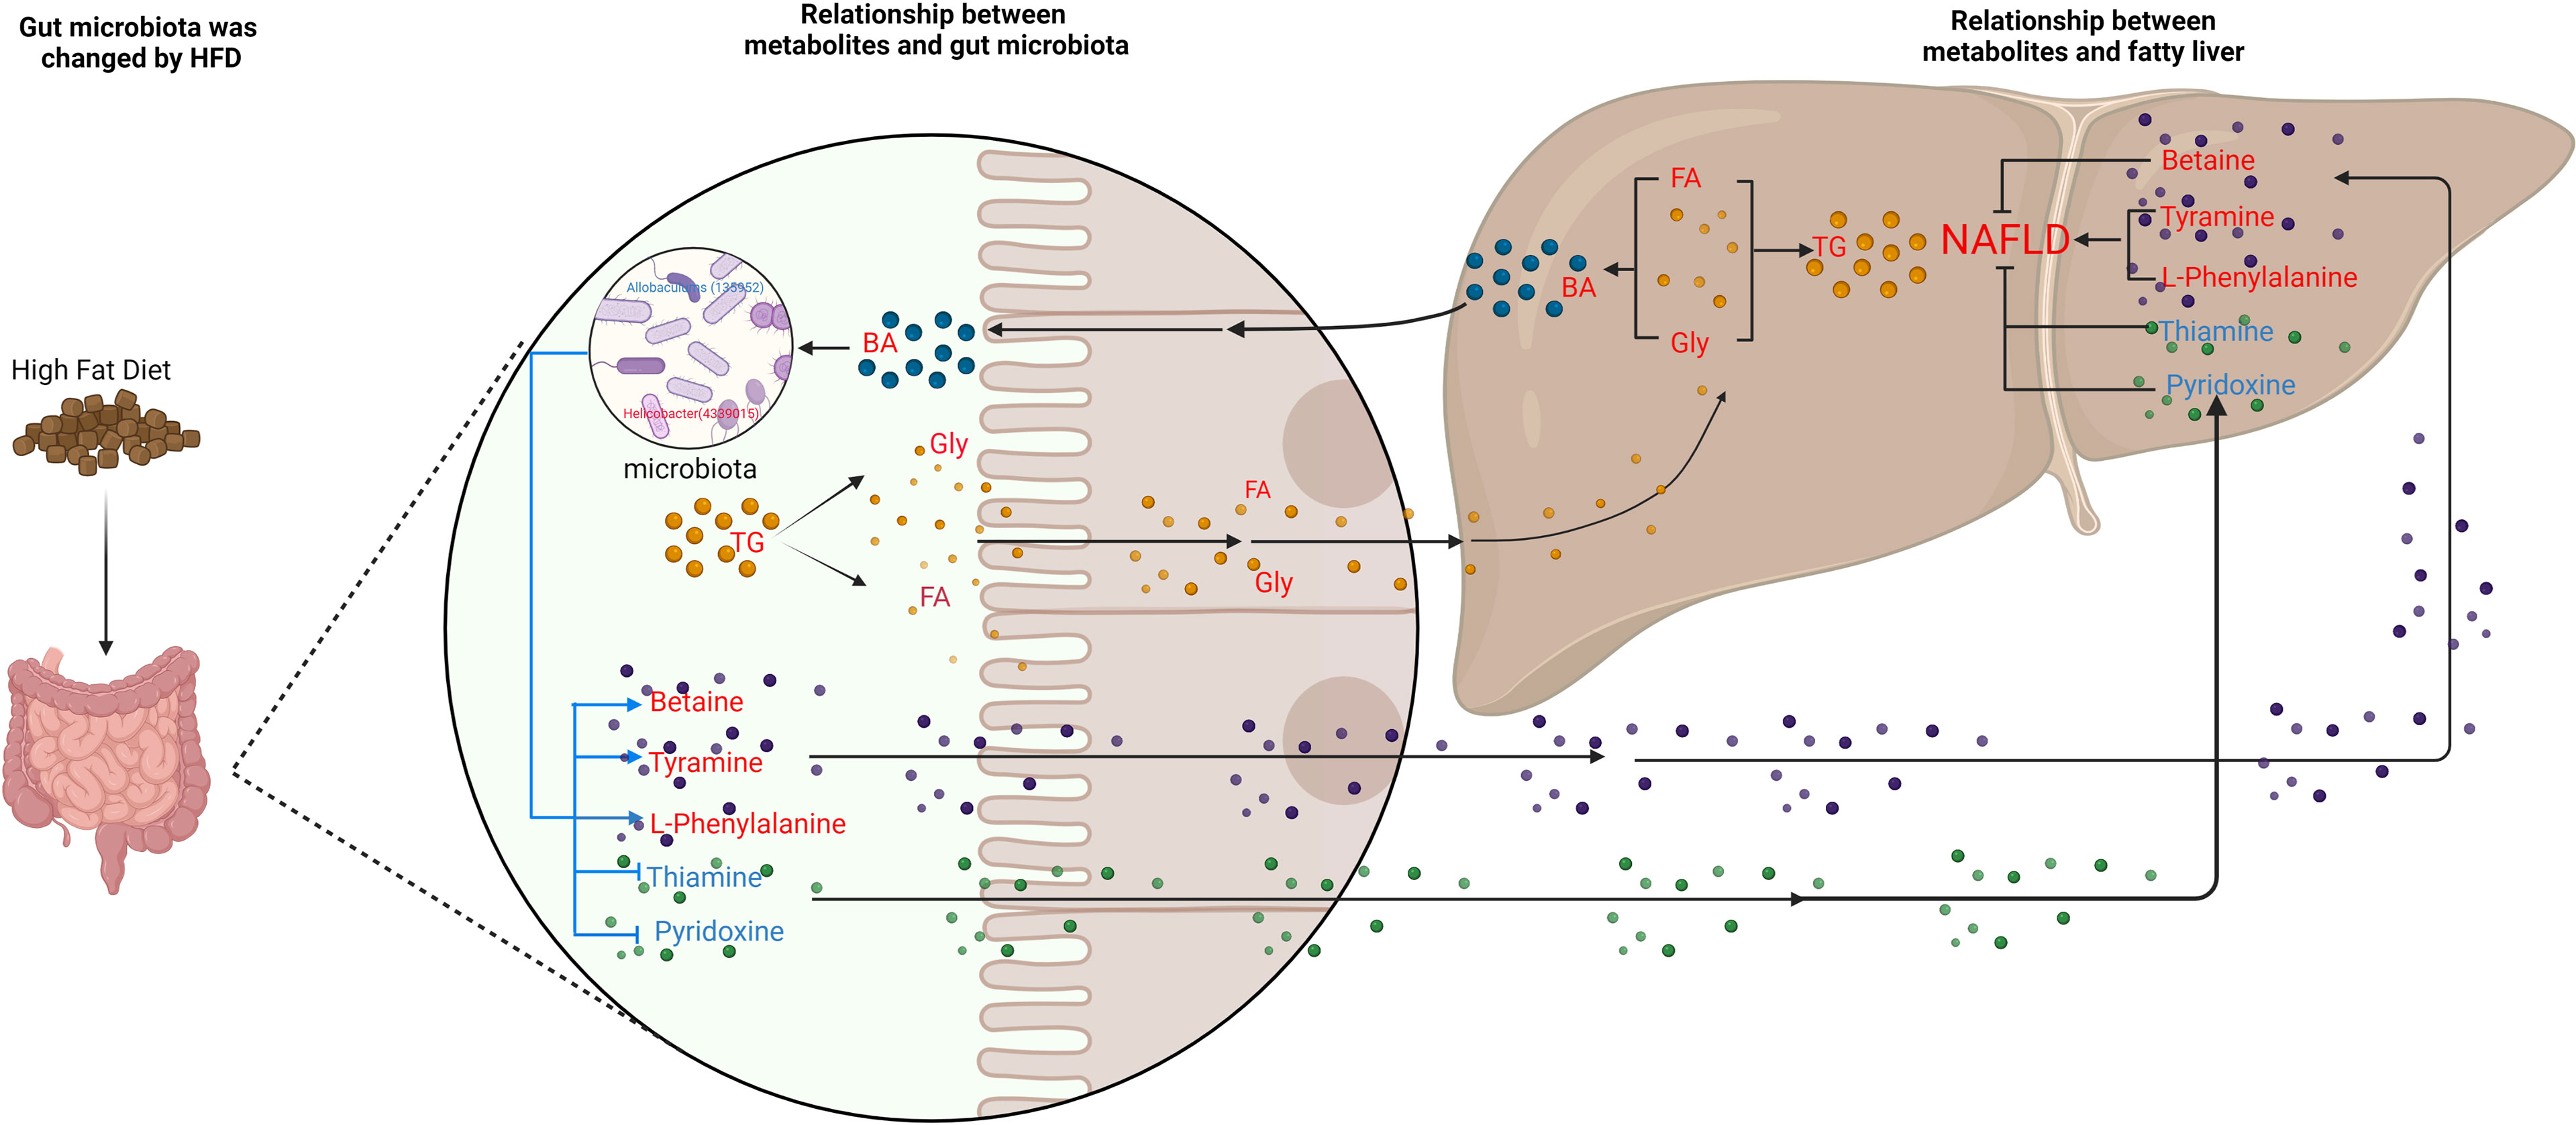
Figure 10 Schematic figure illustrating the relationship between gut microbiota and metabolites, and its effect on NAFLD. Red font represent up-regulated metabolites; blue font represent down-regulated metabolites. The blue line represents the pathways studied in this experiment, and the black line represents the pathways supported by the literature.
Our experiment found that the levels of bile acids, an important metabolite in cecum of NAFLD mice, were also changed with a significant increase in six bile acids (Table S1). High level of TG leads to an increase in cholesterol. Since cholesterol is the precursor of bile acid production, the increase in cholesterol leads to the upregulation of bile acid. Previous studies suggest that high-fat and high-cholesterol diets alter the composition of bile acids in the gut, causing imbalances in the gut microbiota and aggravating bile acid metabolism disorders (Liu et al., 2020; Rao et al., 2021). A common link among many NASH pathogenesis pathways is the disruption of BA homeostasis. Bile acids bind to farnesoid X receptor (FXR), which is critically involved in maintaining BA, glucose, and lipid homeostasis (Chen et al., 2019). Also, dysbiosis of gut microbiota is able to modify the profile of BAs in patients with NAFLD (Aragonès et al., 2019). However, through MIMOSA2 analysis, we found that gut microbiota did not contribute to the changes in bile acids. Hence, we hypothesize that a HFD causes an increase in triglycerides and cholesterol, which in turn causes an increase in bile acids and thus, leads to changes in gut microbiota (Figure 9A and Table S2). Our experiments confirmed that the serum cholesterol content of NAFLD group was significantly higher than that of CK group and that six bile acids, CA, DCA, DTA, CDCA, LCA and TUDCA in the intestine, were significantly upregulated. Therefore, based on the correlation analysis results, we suggest that the upregulation of these six bile acids inhibited Allobaculum and Enterorhabdus but promoted the proliferation of Helicobacter, Blautia, Unidentified-Lachnospiraceae, Romboutsia, Faecalibaculum and Ileibacterium (Figure 10).
Metabonomics analysis found that most of the metabolites in the intestinal tract that were significantly changed were amino acids, with six amino acid metabolic pathways being enriched, including arginine biosynthesis; alanine, glutamic acid, and aspartic acid metabolism; histidine metabolism; arginine and proline metabolism; glycine, serine and threonine metabolism; valine, leucine and isoleucine biosynthesis (Figure 5). Previous studies have investigated how aspartate, glutamine, glutamate, arginine, alanine and L-citrulline can inhibit the formation of fatty liver. Leng et al. (Leng et al., 2014) found that aspartate can slow down LPS-induced liver injury, specifically by inhibiting the expression of pro-inflammatory factors (TNF-α and COX-2) and reversely regulating the expression of genes related to TLR4 and NOD signaling pathway. Glutamine and glutamate are the precursors of glutathione. Glutamine can improve lipid metabolism, enhance anti-inflammation, and antioxidant capacity while a variation of glutamate content can indicate metabolic damage caused by obesity (Jobgen et al., 2009a). Supplementation with glutamine in obese rats was also associated with a reduction of the proinflammatory cytokines TNF-α and interleukin-6 in serum and peripheral tissues (Greenfield et al., 2009), suggesting that glutamine may have anti-inflammatory effects. Arginine possesses antioxidative and anti-inflammatory capacities (Bronte and Zanovello, 2005; Gogoi et al., 2016) and participates in the ornithine cycle to promote urea formation, playing an important role in intestinal inflammation through immune responses and oxidative reactions. In addition, arginine supplementation reduces adiposity and improves glucose tolerance in obese rodents and humans (Popov et al., 2002; Fu et al., 2005; Jobgen et al., 2009b; Monti et al., 2012). Supplementation of HFD mice with alanine acutely suppresses weight gain in association with lower gene expression of fatty acid synthase in the liver and higher gene expression of adipose triglyceride lipase in the epididymal fat (Freudenberg et al., 2013). Thiago R. Araujo et al. (Araujo et al., 2016) verified that alanine and arginine supplementation effectively prevents fat deposition. Furthermore, alanine supplementation is more effective than arginine, since alanine managed to decrease the two abdominal fat stores evaluated. L-citrulline has anti-inflammatory and anti-oxidative properties and can break down fats, (Jegatheesan et al., 2015; Jegatheesan et al., 2016). According to MIMOSA2 analysis, the increase in these amino acids is not due to the action of gut microbiota, but may be caused by diet or body metabolism. Isoleucine, valine and leucine are collectively referred to branched chain amino acids (BCAAs). In our study, valine and leucine significantly increased in NAFLD mice, while isoleucine had no significant change. The metabolic dysregulation is often associated with an increase in the levels of valine and leucine (Floegel et al., 2013; Mardinoglu et al., 2014; Rosso et al., 2016; Gaggini et al., 2018). The dysregulation of BCAAs metabolism in patients with NAFLD, with BCAAs in blood and urine being higher (Hoyles et al., 2018; Zhou and Fan, 2019). High levels of BCAAs lead to obesity-related IR and glucose intolerance and serve as sensitive indicators of abnormal metabolism of insulin-related proteins (Gevi et al., 2018). Animal studies showed that BCAAs supplementation reduced obesity induced by a high-fat diet but caused significant liver damage in high-fat induced mice, which was associated with lipolysis abnormalities (Zhang et al., 2016). Therefore, BCAAs can reflect hepatic steatosis level independently of conventional metabolic risk factors and its metabolic abnormalities may to some extent precede the development of NAFLD (Kaikkonen et al., 2017). MIMOSA2 analysis showed that changes in valine and leucine were also not caused by gut microbiota. Only betaine, L-phenylalanine, and tyramine were affected by gut microbiota (Figure 9A and Table S2). Betaine, a trimethyl derivative of glycine, participates in liver metabolism as a methyl donor in the liver. It can regulate LXRα/PPARα pathway, reduce ER stress and predict cardiovascular outcomes. Therefore, it mainly plays a role in liver protection and confers antioxidant and anti-inflammatory benefits (Bertoldo et al., 2013). Phenylalanine is an aromatic amino acid along with tyrosine and tryptophan (AAAs), which degrade to produce a wide range of anti-inflammatory agents and phenolic compounds that act as toxins or neurotransmitters. AAAs have been shown to increase significantly in HFD-induced obesity and cardiovascular diseases such as type 2 diabetes (Liu et al., 2017). In our study, there was a significant increase in tyramine in NAFLD mice. Tyramine is produced by tyrosine decarboxylate under the action of certain intestinal bacteria, including Enterococcus and Enterobacteriaceae, followed by further deamination and oxidation to produce toxic substances such as phenol and paracresol, which destroy cellular structures and increase permeability (Murooka et al., 1978; Bargossi et al., 2015; Liu et al., 2017; Park et al., 2020). In addition, MIMOSA2 analysis also found that gut microbiota influenced pyridoxine and thiamine levels. Thiamine and pyridoxine inhibit the formation of fatty liver (Mayengbam et al., 2015; Kalyesubula et al., 2021). Analysis of the single OTU found that most of the strains played dual roles and it was difficult to analyze their roles in the occurrence and development of NAFLD. However, g_Allobaculums (GreenGene ID#135952) may inhibit the formation of NAFLD, while g_Helicobacter (GreenGene ID#4339015) may promote the formation of fatty liver. MIMOSA2 analysis showed that g_Allobaculums (GreenGene ID#135952) contributed significantly to the changes in the abundance of three metabolites. g_Allobaculums (GreenGene ID#135952) can produce thiamine phosphate phosphatase and promote thiamine production. Thus, thiamine was downregulated due to a decrease in the abundance of g_Allobaculums (GreenGene ID#135952). g_Allobaculums (GreenGene ID#135952) may play a role in inhibiting the formation of fatty liver. In addition, the upregulation of g_Helicobacter (Greengene ID#4339015) only contributed to the upregulation of L-phenylalanine. Therefore, we hypothesized that g_Helicobacter (Greengene ID#4339015) could promote the development of fatty liver by producing L-phenylalanine (Figure 9B and Figure 10).
Conclusion
The gut microbiota of NAFLD mice changed significantly. The abundance of Blautia, Unidentified-Lachnospiraceae, Romboutsia, Faecalibaculum, Ileibacterium increased significantly in NAFLD mice, while Allobaculum and Enterorhabdus decreased significantly. A total of 167 metabolites in the intestinal tract of NAFLD mice also exhibited significant changes. Although there was a significant correlation between differential bacteria genera and differential metabolites in the cecum of NAFLD mice, MIMOSA2 analysis showed that the alterations in only seven metabolites were caused by gut microbiota, and the alterations in lipid and bile acid were not caused by gut microbiota. Gut microbiota may promote the formation of NAFLD by downregulating thiamine and pyridoxine, while upregulating L-phenylalanine and tyramine. g_Allobaculums (GreenGene ID#135952) may inhibit the formation of NAFLD by producing thiamine and degrading L-phenylalanine. g_Helicobacter (Greengene ID#4339015) promotes the formation of NAFLD by promoting L-phenylalanine production.
Data Availability Statement
16S rDNA sequence data presented in the study are deposited in NCBI Sequence Read Archive(SRA), Accession number: PRJNA813033.
Ethics Statement
The animal study was reviewed and approved by Ethics Committee of Laboratory Animals, Southwest Medical University.
Author Contributions
CG and ZiZ designed and conceptualized study, analyzed the data, drafted the manuscript for intellectual content of the manuscript, carried out the statistical analysis, and interpreted the data. MH, LH, WX and JH carried out animal experiment. ZY, ZL, FZ, WL, QY, and LS analyzed the data. SC, ZhZ, JD and MZ reviewed experimental protocols and manuscripts., QY and ZR participated in the revision of the manuscript, SY conceptualized and designed the study and revised the manuscript. All authors contributed to the article and approved the submitted version.
Conflict of Interest
The authors declare that the research was conducted in the absence of any commercial or financial relationships that could be construed as a potential conflict of interest.
Publisher’s Note
All claims expressed in this article are solely those of the authors and do not necessarily represent those of their affiliated organizations, or those of the publisher, the editors and the reviewers. Any product that may be evaluated in this article, or claim that may be made by its manufacturer, is not guaranteed or endorsed by the publisher.
Supplementary Material
The Supplementary Material for this article can be found online at: https://www.frontiersin.org/articles/10.3389/fcimb.2022.870785/full#supplementary-material
References
Agus, A., Clement, K., Sokol, H. (2021). Gut Microbiota-Derived Metabolites as Central Regulators in Metabolic Disorders. Gut 70, 1174–1182. doi: 10.1136/gutjnl-2020-323071
Alsharairi, N. A. (2021). The Role of Short-Chain Fatty Acids in Mediating Very Low-Calorie Ketogenic Diet-Infant Gut Microbiota Relationships and Its Therapeutic Potential in Obesity. Nutrients 13, 3702. doi: 10.3390/nu13113702
Aragonès, G., Colom-Pellicer, M., Aguilar, C., Guiu-Jurado, E., Martínez, S., Sabench, F., et al. (2019). Circulating Microbiota-Derived Metabolites: A “Liquid Biopsy? Int. J. Obes. 44, 875–885. doi: 10.1038/s41366-019-0430-0
Arao, Y., Kawai, H., Kamimura, K., Kobayashi, T., Nakano, O., Hayatsu, M., et al. (2020). Effect Of Methionine/Choline-Deficient Diet and High-Fat Diet-Induced Steatohepatitis on Mitochondrial Homeostasis in Mice. Biochem. Biophys. Res. Commun. 527, 365–371. doi: 10.1016/j.bbrc.2020.03.180
Araujo, T. R., Freitas, I. N., Vettorazzi, J. F., Batista, T. M., Santos-Silva, J. C., Bonfleur, M. L., et al. (2016). Benefits Of L-Alanine Or L-Arginine Supplementation Against Adiposity and Glucose Intolerance in Monosodium Glutamate-Induced Obesity. Eur. J. Nutr. 56, 2069–2080. doi: 10.1007/s00394-016-1245-6
Araujo, J. R., Tomas, J., Brenner, C., Sansonetti, P. J. (2017). Impact of High-Fat Diet on the Intestinal Microbiota and Small Intestinal Physiology Before and After the Onset of Obesity. Biochimie 141, 97–106. doi: 10.1016/j.biochi.2017.05.019
Bäckhed, F., Ding, H., Wang, T., Hooper, L. V., Koh, G. Y., Nagy, A., et al. (2004). The Gut Microbiota as an Environmental Factor That Regulates Fat Storage. Proc. Natl. Acad. Sci. United States America 101, 15718–15723. doi: 10.1073/pnas.0407076101
Baeg, M. K., Yoon, S. K., Ko, S. H., Noh, Y. S., Lee, I. S., Choi, M. G. (2016). Helicobacter Pylori Infection Is Not Associated With Nonalcoholic Fatty Liver Disease. World J. Gastroenterol. 22, 2592–2600. doi: 10.3748/wjg.v22.i8.2592
Bai, Y. F., Wang, S. W., Wang, X. X., Weng, Y. Y., Fan, X. Y., Sheng, H., et al. (2019). The Flavonoid-Rich Quzhou Fructus Aurantii Extract Modulates Gut Microbiota and Prevents Obesity in High-Fat Diet-Fed Mice. Nutr. Diabetes 9, 30. doi: 10.1038/s41387-019-0097-6
Bargossi, E., Gardini, F., Gatto, V., Montanari, C., Torriani, S., Tabanelli, G. (2015). The Capability of Tyramine Production and Correlation between Phenotypic and Genetic Characteristics of Enterococcus faecium and Enterococcus faecalis Strains. Front. Microbiol. 6, 1371. doi: 10.3389/fmicb.2015.01371
Bertoldo, M. J., Nadal-Desbarats, L., Gerard, N., Dubois, A., Holyoake, P. K., Grupen, C. G. (2013). Differences in the Metabolomic Signatures of Porcine Follicular Fluid Collected From Environments Associated With Good and Poor Oocyte Quality. Reproduction 146, 221–231. doi: 10.1530/REP-13-0142
Brandl, K., Kumar, V., Eckmann, L. (2017). Gut-Liver Axis at the Frontier of Host-Microbial Interactions. Am. J. Physiol. Gastrointest. Liver Physiol. 312, G413–g419. doi: 10.1152/ajpgi.00361.2016
Bronte, V., Zanovello, P. (2005). Regulation of Immune Responses by L-Arginine Metabolism. Nat. Rev. Immunol. 5, 641–654. doi: 10.1038/nri1668
Carbajo-Pescador, S., Porras, D., Garcia-Mediavilla, M. V., Martinez-Florez, S., Juarez-Fernandez, M., Cuevas, M. J., et al. (2019). Beneficial Effects of Exercise on Gut Microbiota Functionality and Barrier Integrity, and Gut-Liver Crosstalk in Anin vivo Model of Early Obesity and Non-Alcoholic Fatty Liver Disease. Dis. Model Mech. 12, dmm039206. doi: 10.1242/dmm.039206
Chambers, E. S., Byrne, C. S., Morrison, D. J., Murphy, K. G., Preston, T., Tedford, C., et al. (2019). Dietary Supplementation With Inulin-Propionate Ester or Inulin Improves Insulin Sensitivity in Adults With Overweight and Obesity With Distinct Effects on the Gut Microbiota, Plasma Metabolome and Systemic Inflammatory Responses: A Randomised Cross-Over Trial. Gut 68, 1430–1438. doi: 10.1136/gutjnl-2019-318424
Chassaing, B., Gewirtz, A. T. (2014). Gut Microbiota, Low-Grade Inflammation, and Metabolic Syndrome. Toxicol. Pathol. 42, 49–53. doi: 10.1177/0192623313508481
Chen, J., Thomsen, M., Vitetta, L. (2019). Interaction of Gut Microbiota With Dysregulation of Bile Acids in the Pathogenesis of Nonalcoholic Fatty Liver Disease and Potential Therapeutic Implications of Probiotics. J. Cell Biochem. 120, 2713–2720. doi: 10.1002/jcb.27635
Chorna, N., Romaguera, J., Godoy-Vitorino, F. (2020). Cervicovaginal Microbiome and Urine Metabolome Paired Analysis Reveals Niche Partitioning of the Microbiota in Patients with Human Papilloma Virus Infections. Metabolites 10, 36. doi: 10.3390/metabo10010036
Cunha, G. M., Guzman, G., Correa De Mello, L. L., Trein, B., Spina, L., Bussade, I., et al. (2020). Efficacy of a 2-Month Very Low-Calorie Ketogenic Diet (VLCKD) Compared to a Standard Low-Calorie Diet in Reducing Visceral and Liver Fat Accumulation in Patients With Obesity. Front. Endocrinol. 11. doi: 10.3389/fendo.2020.00607
Del Chierico, F., Nobili, V., Vernocchi, P., Russo, A., De Stefanis, C., Gnani, D., et al. (2016). Gut Microbiota Profiling of Pediatric Nonalcoholic Fatty Liver Disease and Obese Patients Unveiled by an Integrated Meta-Omics-Based Approach. Hepatology 65, 451–464. doi: 10.1002/hep.28572
Everard, A., Lazarevic, V., Gaia, N., Johansson, M., Stahlman, M., Backhed, F., et al. (2014). Microbiome of Prebiotic-Treated Mice Reveals Novel Targets Involved in Host Response During Obesity. Isme J. 8, 2116–2130. doi: 10.1038/ismej.2014.45
Floegel, A., Stefan, N., Yu, Z., Mühlenbruch, K., Drogan, D., Joost, H. G., et al. (2013). Identification of Serum Metabolites Associated With Risk of Type 2 Diabetes Using a Targeted Metabolomic Approach. Diabetes 62, 639–648. doi: 10.2337/db12-0495
Freudenberg, A., Petzke, K. J., Klaus, S. (2013). Dietary L-Leucine and L-Alanine Supplementation Have Similar Acute Effects in the Prevention of High-Fat Diet-Induced Obesity. Amino Acids 44, 519–528. doi: 10.1007/s00726-012-1363-2
Fu, X., Cao, C., Ren, B., Zhang, B., Huang, Q., Li, C. (2018). Structural Characterization and in vitro Fermentation of a Novel Polysaccharide From Sargassum Thunbergii and Its Impact on Gut Microbiota. Carbohydr. Polym. 183, 230–239. doi: 10.1016/j.carbpol.2017.12.048
Fu, W. J., Haynes, T. E., Kohli, R., Hu, J., Shi, W., Spencer, T. E., et al. (2005). Dietary L-Arginine Supplementation Reduces Fat Mass in Zucker Diabetic Fatty Rats. J. Nutr. 135, 714–721. doi: 10.1093/jn/135.4.714
Gadiparthi, C., Spatz, M., Greenberg, S., Iqbal, U., Kanna, S., Satapathy, S. K., et al. (2020). NAFLD Epidemiology, Emerging Pharmacotherapy, Liver Transplantation Implications and the Trends in the United States. J. Clin. Trans. Hepatol. 8, 215–221. doi: 10.14218/JCTH.2020.00014
Gaggini, M., Carli, F., Rosso, C., Buzzigoli, E., Marietti, M., Della Latta, V., et al. (2018). Altered Amino Acid Concentrations in NAFLD: Impact of Obesity and Insulin Resistance. Hepatology 67, 145–158. doi: 10.1002/hep.29465
Gallardo, P., Izquierdo, M., Vidal, R. M., Soto, F., Ossa, J. C., Farfan, M. J. (2020). Gut Microbiota-Metabolome Changes in Children With Diarrhea by Diarrheagenic E. Coli. Front. Cell. Infect. Microbiol. 10. doi: 10.3389/fcimb.2020.00485
Gevi, F., Fanelli, G., Zolla, L. (2018). Metabolic Patterns in Insulin-Resistant Male Hypogonadism. Cell Death Dis. 9, 671–671. doi: 10.1038/s41419-018-0587-9
Ghaffarzadegan, T., Zhong, Y., Fak Hallenius, F., Nyman, M. (2018). Effects of Barley Variety, Dietary Fiber and Beta-Glucan Content on Bile Acid Composition in Cecum of Rats Fed Low- and High-Fat Diets. J. Nutr. Biochem. 53, 104–110. doi: 10.1016/j.jnutbio.2017.10.008
Goffredo, M., Mass, K., Parks, E. J., Wagner, D. A., Mcclure, E. A., Graf, J., et al. (2016). Role of Gut Microbiota and Short Chain Fatty Acids in Modulating Energy Harvest and Fat Partitioning in Youth. J. Clin. Endocrinol. Metab. 101, 4367–4376. doi: 10.1210/jc.2016-1797
Gogoi, M., Datey, A., Wilson, K. T., Chakravortty, D. (2016). Dual Role of Arginine Metabolism in Establishing Pathogenesis. Curr. Opin. Microbiol. 29, 43–48. doi: 10.1016/j.mib.2015.10.005
Greenfield, J. R., Farooqi, I. S., Keogh, J. M., Henning, E., Habib, A. M., Blackwood, A., et al. (2009). Oral Glutamine Increases Circulating Glucagon-Like Peptide 1, Glucagon, and Insulin Concentrations in Lean, Obese, and Type 2 Diabetic Subjects. Am. J. Clin. Nutr. 89, 106–113. doi: 10.3945/ajcn.2008.26362
Guo, W. L., Chen, M., Pan, W. L., Zhang, Q., Xu, J. X., Lin, Y. C., et al. (2020). Hypoglycemic and Hypolipidemic Mechanism of Organic Chromium Derived From Chelation of Grifola Frondosa Polysaccharide-Chromium (III) and Its Modulation of Intestinal Microflora in High Fat-Diet and STZ-Induced Diabetic Mice. Int. J. Biol. Macromol. 145, 1208–1218. doi: 10.1016/j.ijbiomac.2019.09.206
Hildebrandt, M. A., Hoffmann, C., Sherrill-Mix, S. A., Keilbaugh, S. A., Hamady, M., Chen, Y. Y., et al. (2009). High-Fat Diet Determines the Composition of the Murine Gut Microbiome Independently of Obesity. Gastroenterology 137, 1716–1724.e1711-1712. doi: 10.1053/j.gastro.2009.08.042
Hoyles, L., Fernandez-Real, J. M., Federici, M., Serino, M., Abbott, J., Charpentier, J., et al. (2018). Molecular Phenomics and Metagenomics of Hepatic Steatosis in Non-Diabetic Obese Women. Nat. Med. 24, 1070–1080. doi: 10.1038/s41591-018-0061-3
Hrncir, T., Hrncirova, L., Kverka, M., Hromadka, R., Machova, V., Trckova, E., et al. (2021). Gut Microbiota and NAFLD: Pathogenetic Mechanisms, Microbiota Signatures, and Therapeutic Interventions. Microorganisms 9, 957. doi: 10.3390/microorganisms9050957
Hu, S., Xu, Y., Gao, X., Li, S., Jiang, W., Liu, Y., et al. (2019). Long-Chain Bases from Sea Cucumber Alleviate Obesity by Modulating Gut Microbiota. Mar. Drugs 17, 455. doi: 10.3390/md17080455
Jegatheesan, P., Beutheu, S., Freese, K., Waligora-Dupriet, A.-J., Nubret, E., Butel, M.-J., et al. (2016). Preventive Effects of Citrulline on Western Diet-Induced Non-Alcoholic Fatty Liver Disease in Rats. Br. J. Nutr. 116, 191–203. doi: 10.1017/S0007114516001793
Jegatheesan, P., Beutheu, S., Ventura, G., Nubret, E., Sarfati, G., Bergheim, I., et al. (2015). Citrulline and Nonessential Amino Acids Prevent Fructose-Induced Nonalcoholic Fatty Liver Disease in Rats. J. Nutr. 145, 2273–2279. doi: 10.3945/jn.115.218982
Jensen, J., Bysted, A., Dawids, S., Hermansen, K., Hølmer, G. (1999). The Effect of Palm Oil, Lard, and Puff-Pastry Margarine on Postprandial Lipid and Hormone Responses in Normal-Weight and Obese Young Women. Br. J. Nutr. 82, 469–479. doi: 10.1017/S0007114599001725
Jobgen, W., Fu, W. J., Gao, H., Li, P., Meininger, C. J., Smith, S. B., et al. (2009a). High Fat Feeding and Dietary L-Arginine Supplementation Differentially Regulate Gene Expression in Rat White Adipose Tissue. Amino Acids 37, 187–198. doi: 10.1007/s00726-009-0246-7
Jobgen, W., Meininger, C. J., Jobgen, S. C., Li, P., Lee, M. J., Smith, S. B., et al. (2009b). Dietary L-Arginine Supplementation Reduces White Fat Gain and Enhances Skeletal Muscle and Brown Fat Masses in Diet-Induced Obese Rats. J. Nutr. 139, 230–237. doi: 10.3945/jn.108.096362
Kaikkonen, J. E., Wurtz, P., Suomela, E., Lehtovirta, M., Kangas, A. J., Jula, A., et al. (2017). Metabolic Profiling of Fatty Liver in Young and Middle-Aged Adults: Cross-Sectional and Prospective Analyses of the Young Finns Study. Hepatology 65, 491–500. doi: 10.1002/hep.28899
Kalyesubula, M., Mopuri, R., Asiku, J., Rosov, A., Yosefi, S., Edery, N., et al. (2021). High-Dose Vitamin B1 Therapy Prevents the Development of Experimental Fatty Liver Driven by Overnutrition. Dis. Model Mech. 14, dmm048355. doi: 10.1242/dmm.048355
Kim, T. J., Sinn, D. H., Min, Y. W., Son, H. J., Kim, J. J., Chang, Y., et al. (2017). A Cohort Study on Helicobacter Pylori Infection Associated With Nonalcoholic Fatty Liver Disease. J. Gastroenterol. 52, 1201–1210. doi: 10.1007/s00535-017-1337-y
Korem, T., Zeevi, D., Suez, J., Weinberger, A., Avnit-Sagi, T., Pompan-Lotan, M., et al. (2015). Growth Dynamics of Gut Microbiota in Health and Disease Inferred From Single Metagenomic Samples. Science 349, 1101–1106. doi: 10.1126/science.aac4812
Lambert, J. E., Parnell, J. A., Eksteen, B., Raman, M., Bomhof, M. R., Rioux, K. P., et al. (2015). Gut Microbiota Manipulation With Prebiotics in Patients With Non-Alcoholic Fatty Liver Disease: A Randomized Controlled Trial Protocol. BMC Gastroenterol. 15, 169. doi: 10.1186/s12876-015-0400-5
Leng, W., Liu, Y., Shi, H., Li, S., Zhu, H., Pi, D., et al. (2014). Aspartate Alleviates Liver Injury and Regulates mRNA Expressions of TLR4 and NOD Signaling-Related Genes in Weaned Pigs After Lipopolysaccharide Challenge. J. Nutr. Biochem. 25, 592–599. doi: 10.1016/j.jnutbio.2014.01.010
Le Roy, T., Llopis, M., Lepage, P., Bruneau, A., Rabot, S., Bevilacqua, C., et al. (2013). Intestinal Microbiota Determines Development of Non-Alcoholic Fatty Liver Disease in Mice. Gut 62, 1787–1794. doi: 10.1136/gutjnl-2012-303816
Liang, H., Jiang, F., Cheng, R., Luo, Y., Wang, J., Luo, Z., et al. (2021). A High-Fat Diet and High-Fat and High-Cholesterol Diet May Affect Glucose and Lipid Metabolism Differentially Through Gut Microbiota in Mice. Exp. Anim. 70, 73–83. doi: 10.1538/expanim.20-0094
Li, T. T., Liu, Y. Y., Wan, X. Z., Huang, Z. R., Liu, B., Zhao, C. (2018). Regulatory Efficacy of the Polyunsaturated Fatty Acids from Microalgae Spirulina platensis on Lipid Metabolism and Gut Microbiota in High-Fat Diet Rats. Int. J. Mol. Sci. 19, 3075. doi: 10.3390/ijms19103075
Liu, R., Hong, J., Xu, X., Feng, Q., Zhang, D., Gu, Y., et al. (2017). Gut Microbiome and Serum Metabolome Alterations in Obesity and After Weight-Loss Intervention. Nat. Med. 23, 859–868. doi: 10.1038/nm.4358
Liu, L., Liu, Z., Li, H., Cao, Z., Li, W., Song, Z., et al. (2020). Naturally Occurring TPE-CA Maintains Gut Microbiota and Bile Acids Homeostasis via FXR Signaling Modulation of the Liver-Gut Axis. Front. Pharmacol. 11, 12. doi: 10.3389/fphar.2020.00012
Li, Y., Xu, Q., Huang, Z., Lv, L., Liu, X., Yin, C., et al. (2016). Effect of Bacillus Subtilis CGMCC 1.1086 on the Growth Performance and Intestinal Microbiota of Broilers. J. Appl. Microbiol. 120, 195–204. doi: 10.1111/jam.12972
Luo, Z. Z., Shen, L. H., Jiang, J., Huang, Y. X., Bai, L. P., Yu, S. M., et al. (2019). Plasma Metabolite Changes in Dairy Cows During Parturition Identified Using Untargeted Metabolomics. J. Dairy Sci. 102, 4639–4650. doi: 10.3168/jds.2018-15601
Mardinoglu, A., Agren, R., Kampf, C., Asplund, A., Uhlen, M., Nielsen, J. (2014). Genome-Scale Metabolic Modelling of Hepatocytes Reveals Serine Deficiency in Patients With Non-Alcoholic Fatty Liver Disease. Nat. Commun. 5, 3083. doi: 10.1038/ncomms4083
Matteoni, C. A., Younossi, Z. M., Gramlich, T., Boparai, N., Liu, Y. C., Mccullough, A. J. (1999). Nonalcoholic Fatty Liver Disease: A Spectrum of Clinical and Pathological Severity. Gastroenterology 116, 1413–1419. doi: 10.1016/S0016-5085(99)70506-8
Mayengbam, S., Raposo, S., Aliani, M., House, J. D. (2015). Oral Exposure to the Anti-Pyridoxine Compound 1-Amino D-Proline Further Perturbs Homocysteine Metabolism Through the Transsulfuration Pathway in Moderately Vitamin B6 Deficient Rats. J. Nutr. Biochem. 26, 241–249. doi: 10.1016/j.jnutbio.2014.10.014
Mchardy, I. H., Goudarzi, M., Tong, M., Ruegger, P. M., Schwager, E., Weger, J. R., et al. (2013). Integrative Analysis of the Microbiome and Metabolome of the Human Intestinal Mucosal Surface Reveals Exquisite Inter-Relationships. Microbiome 1, 17. doi: 10.1186/2049-2618-1-17
Monti, L. D., Setola, E., Lucotti, P. C., Marrocco-Trischitta, M. M., Comola, M., Galluccio, E., et al. (2012). Effect of a Long-Term Oral L-Arginine Supplementation on Glucose Metabolism: A Randomized, Double-Blind, Placebo-Controlled Trial. Diabetes Obes. Metab. 14, 893–900. doi: 10.1111/j.1463-1326.2012.01615.x
Murooka, Y., Higashiura, T., Harada, T. (1978). Genetic Mapping of Tyramine Oxidase and Arylsulfatase Genes and Their Regulation in Intergeneric Hybrids of Enteric Bacteria. J. Bacteriol. 136, 714–722. doi: 10.1128/jb.136.2.714-722.1978
Nalbantoglu, O. U., Sayood, K. (2019). MIMOSA: Algorithms for Microbial Profiling. IEEE/ACM Trans. Comput. Biol. Bioinf. 16, 2023–2034. doi: 10.1109/TCBB.2018.2830324
Noecker, C., Eng, A., Srinivasan, S., Theriot, C. M., Young, V. B., Jansson, J. K., et al. (2016). Metabolic Model-Based Integration of Microbiome Taxonomic and Metabolomic Profiles Elucidates Mechanistic Links Between Ecological and Metabolic Variation. mSystems 1, e00013-15. doi: 10.1128/mSystems.00013-15
Palacios, T., Vitetta, L., Coulson, S., Madigan, C. D., Lam, Y. Y., Manuel, R., et al. (2020). Targeting the Intestinal Microbiota to Prevent Type 2 Diabetes and Enhance the Effect of Metformin on Glycaemia: A Randomised Controlled Pilot Study. Nutrients 12, 2041. doi: 10.3390/nu12072041
Park, Y. K., Jin, Y. H., Lee, J. H., Byun, B. Y., Lee, J., Jeong, K. C., et al. (2020). The Role of Enterococcus Faecium as a Key Producer and Fermentation Condition as an Influencing Factor in Tyramine Accumulation in Cheonggukjang. Foods 9, 915. doi: 10.3390/foods9070915
Pilla, R., Law, T. H., Pan, Y., Zanghi, B. M., Li, Q., Want, E. J., et al. (2020). The Effects of a Ketogenic Medium-Chain Triglyceride Diet on the Feces in Dogs With Idiopathic Epilepsy. Front. Vet. Sci. 7, 541547. doi: 10.3389/fvets.2020.541547
Popov, D., Costache, G., Georgescu, A., Enache, M. (2002). Beneficial Effects of L-Arginine Supplementation in Experimental Hyperlipemia-Hyperglycemia in the Hamster. Cell Tissue Res. 308, 109–120. doi: 10.1007/s00441-001-0509-4
Rao, Y., Kuang, Z., Li, C., Guo, S., Xu, Y., Zhao, D., et al. (2021). Gut Akkermansia Muciniphila Ameliorates Metabolic Dysfunction-Associated Fatty Liver Disease by Regulating the Metabolism of L-Aspartate via Gut-liver Axis. Gut Microbes 13, 1–19. doi: 10.1080/19490976.2021.1927633
Raza, G. S., Putaala, H., Hibberd, A. A., Alhoniemi, E., Tiihonen, K., Makela, K. A., et al. (2017). Polydextrose Changes the Gut Microbiome and Attenuates Fasting Triglyceride and Cholesterol Levels in Western Diet Fed Mice. Sci. Rep. 7, 5294. doi: 10.1038/s41598-017-05259-3
Repass, J., Maherali, N., Owen, K., Reproducibility Project Cancer, B (2016). Registered Report: Fusobacterium Nucleatum Infection Is Prevalent in Human Colorectal Carcinoma. eLife 5, e10012. doi: 10.7554/eLife.10012
Rosso, C., Mezzabotta, L., Gaggini, M., Salomone, F., Gambino, R., Marengo, A., et al. (2016). Peripheral Insulin Resistance Predicts Liver Damage in Nondiabetic Subjects With Nonalcoholic Fatty Liver Disease. Hepatology 63, 107–116. doi: 10.1002/hep.28287
Sanyal, A. J. (2019). Past, Present and Future Perspectives in Nonalcoholic Fatty Liver Disease. Nat. Rev. Gastroenterol. Hepatol. 16, 377–386. doi: 10.1038/s41575-019-0144-8
Sergeev, I. N., Aljutaily, T., Walton, G., Huarte, E. (2020). Effects of Synbiotic Supplement on Human Gut Microbiota, Body Composition and Weight Loss in Obesity. Nutrients 12, 222. doi: 10.3390/nu12010222
Shestakov Iu, M., Piroxhnik, V. A. (1976). [Fatty Acid Composition of Lard Following Different Types of Pig Fattening]. Vopr. Pitan, (1) 77–78.
Sikalidis, A. K., Maykish, A. (2020). The Gut Microbiome and Type 2 Diabetes Mellitus: Discussing A Complex Relationship. Biomedicines 8, 8. doi: 10.3390/biomedicines8010008
Sumida, Y., Kanemasa, K., Imai, S., Mori, K., Tanaka, S., Shimokobe, H., et al. (2015). Helicobacter Pylori Infection Might Have a Potential Role in Hepatocyte Ballooning in Nonalcoholic Fatty Liver Disease. J. Gastroenterol. 50, 996–1004. doi: 10.1007/s00535-015-1039-2
Tang, W., Yao, X., Xia, F., Yang, M., Chen, Z., Zhou, B., et al. (2018). Modulation of the Gut Microbiota in Rats by Hugan Qingzhi Tablets during the Treatment of High-Fat-Diet-Induced Nonalcoholic Fatty Liver Disease. Oxid. Med. Cell Longev. 2018, 7261619. doi: 10.1155/2018/7261619
Walker, A., Pfitzner, B., Neschen, S., Kahle, M., Harir, M., Lucio, M., et al. (2014). Distinct Signatures of Host-Microbial Meta-Metabolome and Gut Microbiome in Two C57BL/6 Strains Under High-Fat Diet. Isme J. 8, 2380–2396. doi: 10.1038/ismej.2014.79
Wallis, K. F., Melnyk, S. B., Miousse, I. R. (2020). Sex-Specific Effects of Dietary Methionine Restriction on the Intestinal Microbiome. Nutrients 12, 781. doi: 10.3390/nu12030781
Waluga, M., Kukla, M., Żorniak, M., Bacik, A., Kotulski, R. (2015). From the Stomach to Other Organs: Helicobacter Pylori and the Liver. World J. Hepatol. 7, 2136–2146. doi: 10.4254/wjh.v7.i18.2136
Wang, H., Guan, L., Li, J., Lai, M., Wen, X. (2018). The Effects of Berberine on the Gut Microbiota in Apc (min/+) Mice Fed with a High Fat Diet. Mol. (Basel Switzerland) 23, 2298. doi: 10.3390/molecules23092298
Xiao, L., Sonne, S. B., Feng, Q., Chen, N., Xia, Z., Li, X., et al. (2017). High-fat Feeding Rather Than Obesity Drives Taxonomical and Functional Changes in the Gut Microbiota in Mice. Microbiome 5, 43–43. doi: 10.1186/s40168-017-0258-6
Xiao, J., Wang, F., Wong, N. K., He, J., Zhang, R., Sun, R., et al. (2019). Global Liver Disease Burdens and Research Trends: Analysis From a Chinese Perspective. J. Hepatol. 71, 212–221. doi: 10.1016/j.jhep.2019.03.004
Yang, M., Khoukaz, L., Qi, X., Kimchi, E. T., Staveley-O’carroll, K. F., Li, G. (2021). Diet and Gut Microbiota Interaction-Derived Metabolites and Intrahepatic Immune Response in NAFLD Development and Treatment. Biomedicines 9, 1893. doi: 10.3390/biomedicines9121893
Ye, L., Mueller, O., Bagwell, J., Bagnat, M., Liddle, R. A., Rawls, J. F. (2019). High Fat Diet Induces Microbiota-Dependent Silencing of Enteroendocrine Cells. eLife 8, e48479. doi: 10.7554/eLife.48479.sa2
Zhang, C., Yin, A., Li, H., Wang, R., Wu, G., Shen, J., et al. (2015). Dietary Modulation of Gut Microbiota Contributes to Alleviation of Both Genetic and Simple Obesity in Children. EBioMedicine 2, 968–984. doi: 10.1016/j.ebiom.2015.07.007
Zhang, F., Zhao, S., Yan, W., Xia, Y., Chen, X., Wang, W., et al. (2016). Branched Chain Amino Acids Cause Liver Injury in Obese/Diabetic Mice by Promoting Adipocyte Lipolysis and Inhibiting Hepatic Autophagy. EBioMedicine 13, 157–167. doi: 10.1016/j.ebiom.2016.10.013
Zhang, X., Zhao, Y., Zhang, M., Pang, X., Xu, J., Kang, C., et al. (2012). Structural Changes of Gut Microbiota During Berberine-Mediated Prevention of Obesity and Insulin Resistance in High-Fat Diet-Fed Rats. PloS One 7, e42529. doi: 10.1371/journal.pone.0042529
Zhang, D. Y., Zhu, L., Liu, H. N., Tseng, Y. J., Weng, S. Q., Liu, T. T., et al. (2019). The Protective Effect and Mechanism of the FXR Agonist Obeticholic Acid via Targeting Gut Microbiota in Non-Alcoholic Fatty Liver Disease. Drug Des. Devel Ther. 13, 2249–2270. doi: 10.2147/DDDT.S207277
Zheng, J., Zhang, J., Guo, Y., Cui, H., Lin, A., Hu, B., et al. (2020). Improvement on Metabolic Syndrome in High Fat Diet-Induced Obese Mice Through Modulation of Gut Microbiota by Sangguayin Decoction. J. Ethnopharmacol. 246, 112225. doi: 10.1016/j.jep.2019.112225
Zhou, D., Fan, J. G. (2019). Microbial Metabolites in Non-Alcoholic Fatty Liver Disease. World J. Gastroenterol. 25, 2019–2028. doi: 10.3748/wjg.v25.i17.2019
Keywords: nonalcoholic fatty liver disease (NAFLD), mice, 16SrDNA, metabonomics, MIMOSA2
Citation: Gu C, Zhou Z, Yu Z, He M, He L, Luo Z, Xiao W, Yang Q, Zhao F, Li W, Shen L, Han J, Cao S, Zuo Z, Deng J, Yan Q, Ren Z, Zhao M and Yu S (2022) The Microbiota and It’s Correlation With Metabolites in the Gut of Mice With Nonalcoholic Fatty Liver Disease. Front. Cell. Infect. Microbiol. 12:870785. doi: 10.3389/fcimb.2022.870785
Received: 27 February 2022; Accepted: 25 April 2022;
Published: 27 May 2022.
Edited by:
Steven Gill, University of Rochester, United StatesReviewed by:
Azita Hekmatdoost, National Nutrition and Food Technology Research Institute, IranMing Yang, University of Missouri, United States
Copyright © 2022 Gu, Zhou, Yu, He, He, Luo, Xiao, Yang, Zhao, Li, Shen, Han, Cao, Zuo, Deng, Yan, Ren, Zhao and Yu. This is an open-access article distributed under the terms of the Creative Commons Attribution License (CC BY). The use, distribution or reproduction in other forums is permitted, provided the original author(s) and the copyright owner(s) are credited and that the original publication in this journal is cited, in accordance with accepted academic practice. No use, distribution or reproduction is permitted which does not comply with these terms.
*Correspondence: Mingde Zhao, Nzg2NDk3NzE0QHFxLmNvbQ==; Shumin Yu, eWF5dXNodW1pbkBzaWNhdS5lZHUuY24=
†These authors have contributed equally to this work