 Ana Virseda-Berdices1,2†
 Rubén Martín-Escolano1,2†Juan Berenguer2,3,4Juan González-García2,5,6Oscar Brochado-Kith1,2David Rojo7
 Amanda Fernández-Rodríguez1,2Leire Pérez-Latorre2,3,4Victor Hontañón2,5,6
 Coral Barbas7
 Salvador Resino1,2*†
 María Ángeles Jiménez-Sousa1,2*†
- 1Unidad de Infección Viral e Inmunidad, Centro Nacional de Microbiología (CNM), Instituto de Salud Carlos III (ISCIII), Madrid, Spain
- 2Centro de Investigación Biomédica en Red en Enfermedades Infecciosas (CIBERINFEC), Instituto de Salud Carlos III (ISCIII), Madrid, Spain
- 3Unidad de Enfermedades Infecciosas/VIH, Hospital General Universitario “Gregorio Marañón”, Madrid, Spain
- 4Instituto de Investigación Sanitaria Gregorio Marañón (IiSGM), Madrid, Spain
- 5Servicio de Medicina Interna-Unidad de VIH, Hospital Universitario La Paz, Madrid, Spain
- 6Instituto de Investigación Sanitaria La Paz (IdiPAZ), Madrid, Spain
- 7Centre of Metabolomics and Bioanalysis (CEMBIO), Facultad de Farmacia, Universidad San Pablo-CEU, CEU Universities, Boadilla del Monte, Spain
Background: Combination antiretroviral therapy (ART) has transformed human immunodeficiency virus (HIV) infection in people with HIV (PWH). However, a chronic state of immune activation and inflammation is maintained despite achieving HIV suppression and satisfactory immunological recovery. We aimed to determine whether the plasma metabolomic profile of PWH on long-term suppressive ART and immunologically recovered approximates the normality by comparison with healthy controls with similar age and gender.
Methods: We carried out a cross-sectional study in 17 PWH on long-term ART (HIV-RNA <50 copies/mL, CD4+ ≥500 cells/mm3, and CD4+/CD8+ ≥1) and 19 healthy controls with similar age and gender. Metabolomics analysis was performed by gas chromatography-mass spectrometry (GC-MS) and liquid chromatography-mass spectrometry (LC-MS). The statistical association analysis was performed by principal component analysis (PCA), partial least squares discriminant analysis (PLS-DA), and Generalized Linear Models (GLM) with a gamma distribution (log-link). Significance levels (p-value) were corrected for multiple testing (q-value).
Results: PCA and PLS-DA analyses found no relevant differences between groups. Adjusted GLM showed 14 significant features (q-value<0.20), of which only three could be identified: lysophosphatidylcholine (LysoPC) (22:6) (q-value=0.148), lysophosphatidylethanolamine (LysoPE) (22:6) (q-value=0.050) and hydroperoxy-octadecatrienoic acid (HpOTrE)/dihydroperoxy-octadecatrienoic acid (DiHOTrE)/epoxy-octadecadienoic acid (EpODE) (q-value=0.136). These significant identified metabolites were directly correlated to plasma inflammatory biomarkers in PWH and negatively correlated in healthy controls.
Conclusion: PWH on long-term ART have a metabolomic profile that is almost normal compared to healthy controls. Nevertheless, residual metabolic alterations linked to inflammatory biomarkers persist, which could favor the development of age-related comorbidities among this population.
Introduction
People with human immunodeficiency virus (HIV) (PWH) on combination antiretroviral therapy (ART) usually achieve undetectable viral load and CD4+ ≥500 cells/mm3, decreasing the risk of developing acquired immune deficiency syndrome (AIDS)-related events, mortality, and transforming HIV infection into a chronic disease (Zicari et al., 2019). However, ART does not eradicate HIV from the body, promoting a chronic state of immune activation and inflammation that leads to the development of non-AIDS comorbidities despite viral suppression (Zicari et al., 2019). Besides, PWH on suppressive ART generally presents persistently elevated CD8+ T cell counts and a low CD4+/CD8+ ratio, linked to a higher immune dysfunction (immune activation, inflammation, immunosenescence, among others), viral reservoir size, aging, comorbidities, and mortality (Lu et al., 2015; Zicari et al., 2019; Chen et al., 2022). Therefore, besides CD4+ ≥500 cells/mm3, CD4+/CD8+ ratio ≥1 is another goal for immune reconstitution in PWH on suppressive ART (Lu et al., 2015). In this context, previous studies have reported that only one-third of PWH on long-term ART achieve a restoration of the CD4+/CD8+ ratio, its normalization being slow (Caby, 2017; Han et al., 2018).
Metabolomics is based on studying and analyzing metabolites and metabolic pathways involved in a specific process. Serum and plasma derived from PWH revealed altered metabolites involved in lipid and mitochondrial pathways as well as fatty acids and organic acids (Cassol et al., 2013). The ability of ART to rectify HIV-induced metabolic dysregulation is unclear, and a robust characterization of the metabolic alterations experienced is needed to determine the effect of ART on these pathways. In this regards, Peltenburg et al. found increased lipid metabolites in PWH after 12 months of ART (Peltenburg et al., 2018). Regarding younger cohorts of PWH, significant changes in the levels of several metabolites were found between HIV untreated patients, HIV patients on ART, and healthy controls (Munshi et al., 2013). In PWH on long-term suppressive ART, Babu et al. (2019) reported plasma metabolomic abnormalities related to amino acids and energy metabolism, urea, and tricarboxylic acid cycle compared to healthy controls. Their findings also showed alterations in the lipid complex, which could be markers of inflammation, oxidative stress, and immune cell function. Gelpi et al. (2018) have also reported an independent association between HIV infection and hypertension, hypertriglyceridemia, and abdominal obesity. Nevertheless, they included PWH with a CD4+/CD8+ ratio <1, which could play a significant role in the differences. However, to our knowledge, no previous studies have evaluated metabolomic dysregulation in PWH on long-term ART with CD4+/CD8+ ≥1. In this population subgroup, these studies must assess the risk of inflammaging, immunosenescence, and age-related comorbidities.
This study aimed to determine whether the plasma metabolomic profile of PWH on long-term suppressive ART and immunologically recovered approximates the normality by comparison with healthy controls with similar age and gender.
Methods
Study subjects
We carried out a cross-sectional study in PWH (n=17) on long-term suppressive ART and significant immunological recovery in two Hospitals in Madrid (Hospital Universitario “La Paz” and Hospital General Universitario “Gregorio Marañón”). The selection criteria of PWH were: i) ART with HIV viral load <50 copies/ml and CD4+ T-cell counts ≥500 cells/mm3 during more than one year before blood extraction, and ii) CD4+/CD8+ ratio recovery to normal levels (≥1) at time of blood extraction. Patients with active hepatitis B virus (HBV) or hepatitis C virus (HCV) coinfections were excluded.
To evaluate normal plasma metabolite levels, we also selected a group of age- and gender-matched healthy controls (HC-group, n=19) that were negative for HIV, HBV, and HCV.
The study was approved by the Research Ethics Committee of the Institute of Health Carlos III (CEI PI 23_2011, CEI PI 41_2020-v2) and was carried out according to the Declaration of Helsinki. Before registration, all participants signed written consent.
Clinical data and samples
Participant characteristics were collected from medical records. Peripheral blood samples were collected in EDTA tubes, and plasma samples were separated by centrifugation and stored at -80°C in the Spanish HIV HGM Biobank until use.
Non-targeted metabolomics
The list of reagents and standards, metabolite extraction, and sample preparation are available in Appendix A. Metabolomic analysis was performed by two complementary analytical platforms: gas chromatography–mass spectrometry (GC-MS) system (Agilent Technologies 7890A) and liquid chromatography–mass spectrometry (LC-MS) (LC: 1290 infinity II Agilent, MS: Agilent 6550 iFunnel). Detailed methods can be found in Appendix A.
In GC-MS, the deconvolution and identification were performed using MassHunter Quantitative Unknowns Analysis (B.07.00, Agilent), alignment with MassProfiler Professional software (version 13.0, Agilent), and peak integration using MassHunter Quantitative Analysis (version B.07.00, Agilent). In LC-MS, the Molecular Feature Extraction and the Recursive Feature Extraction algorithms in the MassHunter Profinder software (B.08.00, Agilent) were used for the deconvolution and alignment of the raw data. After data reprocessing, the metabolic features were filtered (full description in Supplementary File - Appendix A).
Multiplex immunoassays and ELISA
ProcartaPlexTM multiplex immunoassay (Bender MedSystems GmbH, Vienna, Austria) was used to measure several plasma biomarkers according to the manufacturer’s specifications using a Luminex 200TM analyzer (Luminex Corporation, Austin, TX, United States). The plasma biomarkers measured by ELISA multiplex were anti-inflammatory/suppressor markers – interleukin 10 (IL-10), transforming growth factor-beta 1 (TGF-β1), IL-1 receptor antagonist (IL-1RA) and IL-4 –, pro-inflammatory chemokine markers – human interferon-inducible protein 10 (IP-10), monocyte chemoattractant protein-1 (MCP-1)] and IL-8 –, pro-inflammatory cytokine markers – IL-1β, IL- 18, IL-6, tumor necrosis factor-alpha (TNF-α), interferon-gamma (IFN-γ), IL-12p70, IL-2 and IL-17A –, endothelial dysfunction markers – soluble vascular cell adhesion molecule-1 (sVCAM-1), soluble intercellular adhesion molecule-1 (sICAM-1) and soluble tumor necrosis factor receptor-1 (sTNFR-1) –, and coagulopathy markers – D-Dimer and plasminogen activator inhibitor-1 (PAI-1)–.
A Commercial ELISA was used to measure bacterial translocation markers – sCD14 and fatty acid-binding protein 2 (FABP2) (Raybiotech, Georgia, USA) and lipopolysaccharide-binding protein (LBP) (R&D Systems, Minneapolis, USA) – and the anti-transforming growth factor beta 1 (TGF-β1; Bender MedSystems GmbH, Vienna, Austria) as the multiplex immunoassay was not available. The lipopolysaccharide (LPS; Hycult Biotech, Uden, The Netherlands) was evaluated by a Limulus amebocyte lysate (LAL) chromogenic endpoint ELISA.
Statistical analysis
For the group description, variables were expressed as median [25th; 75th percentile] for continuous and as absolute numbers [percentage] for categorical data. The Mann–Whitney U and Chi-square tests were used to analyze continuous and categorical variables, respectively.
For the metabolomics analysis, variables from GC-MS and LC-MS were log-transformed (log10) and auto-scaled to make individual features more comparable. Next, we performed an unsupervised analysis by principal component analysis (PCA) and a supervised analysis by partial least squares discriminant analysis (PLS-DA) for features detected in GC-MS and LC-MS [positive and negative electrospray ionization (ESI)]. The optimal number of PLS-DA components was determined with the leave-one-out cross-validation (LOOCV) method, using R2 and Q2 values as performance measures. Permutation was carried out by separation distance (B/W) with a permutation number of 1000 to confirm the model’s validity.
Generalized Linear Models (GLM) with gamma distribution (log-link) were used to independently analyze the differences between the study groups for each metabolite. This test provides the arithmetic mean ratio (AMR) and its significance level (p-value), which was corrected for multiple testing using the False Discovery Rate (FDR) with Benjamini and Hochberg procedure (q-value). Additionally, GLM models were adjusted by baseline characteristics (age, gender, and body mass index) previously selected by a stepwise method by the Akaike information criterion (AIC) (forward, p<0.05; q-value<0.20).
Correlation between significant metabolites and plasma biomarkers was performed using the Spearman correlation test. Those suitable correlations (r>0.5 or r<-0.5) and a significance value (p<0.05; q-value<0.20) were considered relevant.
The statistical analysis was done with MetaboAnalyst 4.0 software (http://www.metaboanalyst.ca/) and R statistical package version v3.5.1 (R Foundation for Statistical Computing, Vienna, Austria).
Metabolite identification
The significant metabolites (q-value<0.2) were identified. In GC-MS, the identification was made based on FiehnLib (Kind et al., 2009) and NIST 14 libraries. In LC-MS, the list of accurate masses was searched using the CEU Mass Mediator search tool (http://ceumass.eps.uspceu.es/; error ± 5 ppm) to obtain tentative identifications. Each of them were manually curated based on their MS adducts (Salek et al., 2013; Godzien et al., 2016). In the cases that it was applicable, the elution order was also considered to discard spurious identifications. Eventually, the biological role of each compound was evaluated, and unrelated identifications such as pesticides, drugs, or not possible chemical structures were excluded. The metabolites are reported in agreement with the criteria of the Metabolomics Standards Initiative (10.1007/s11306-007-0070-6) with a confidence level grade 2 (putatively annotated compounds), which certitude is increased after manual curation of the final list.
Results
Patient characteristics
The epidemiological and clinical data of participants are shown in Table 1. In brief, the median age of PWH was 57 years, 64.7% were males, 47.1% had prior AIDS diagnosis, and the median time on ART was 10.7 years. Although all PWH had a CD4+/CD8+ ratio ≥1, healthy controls had significantly higher values (p-value<0.001).
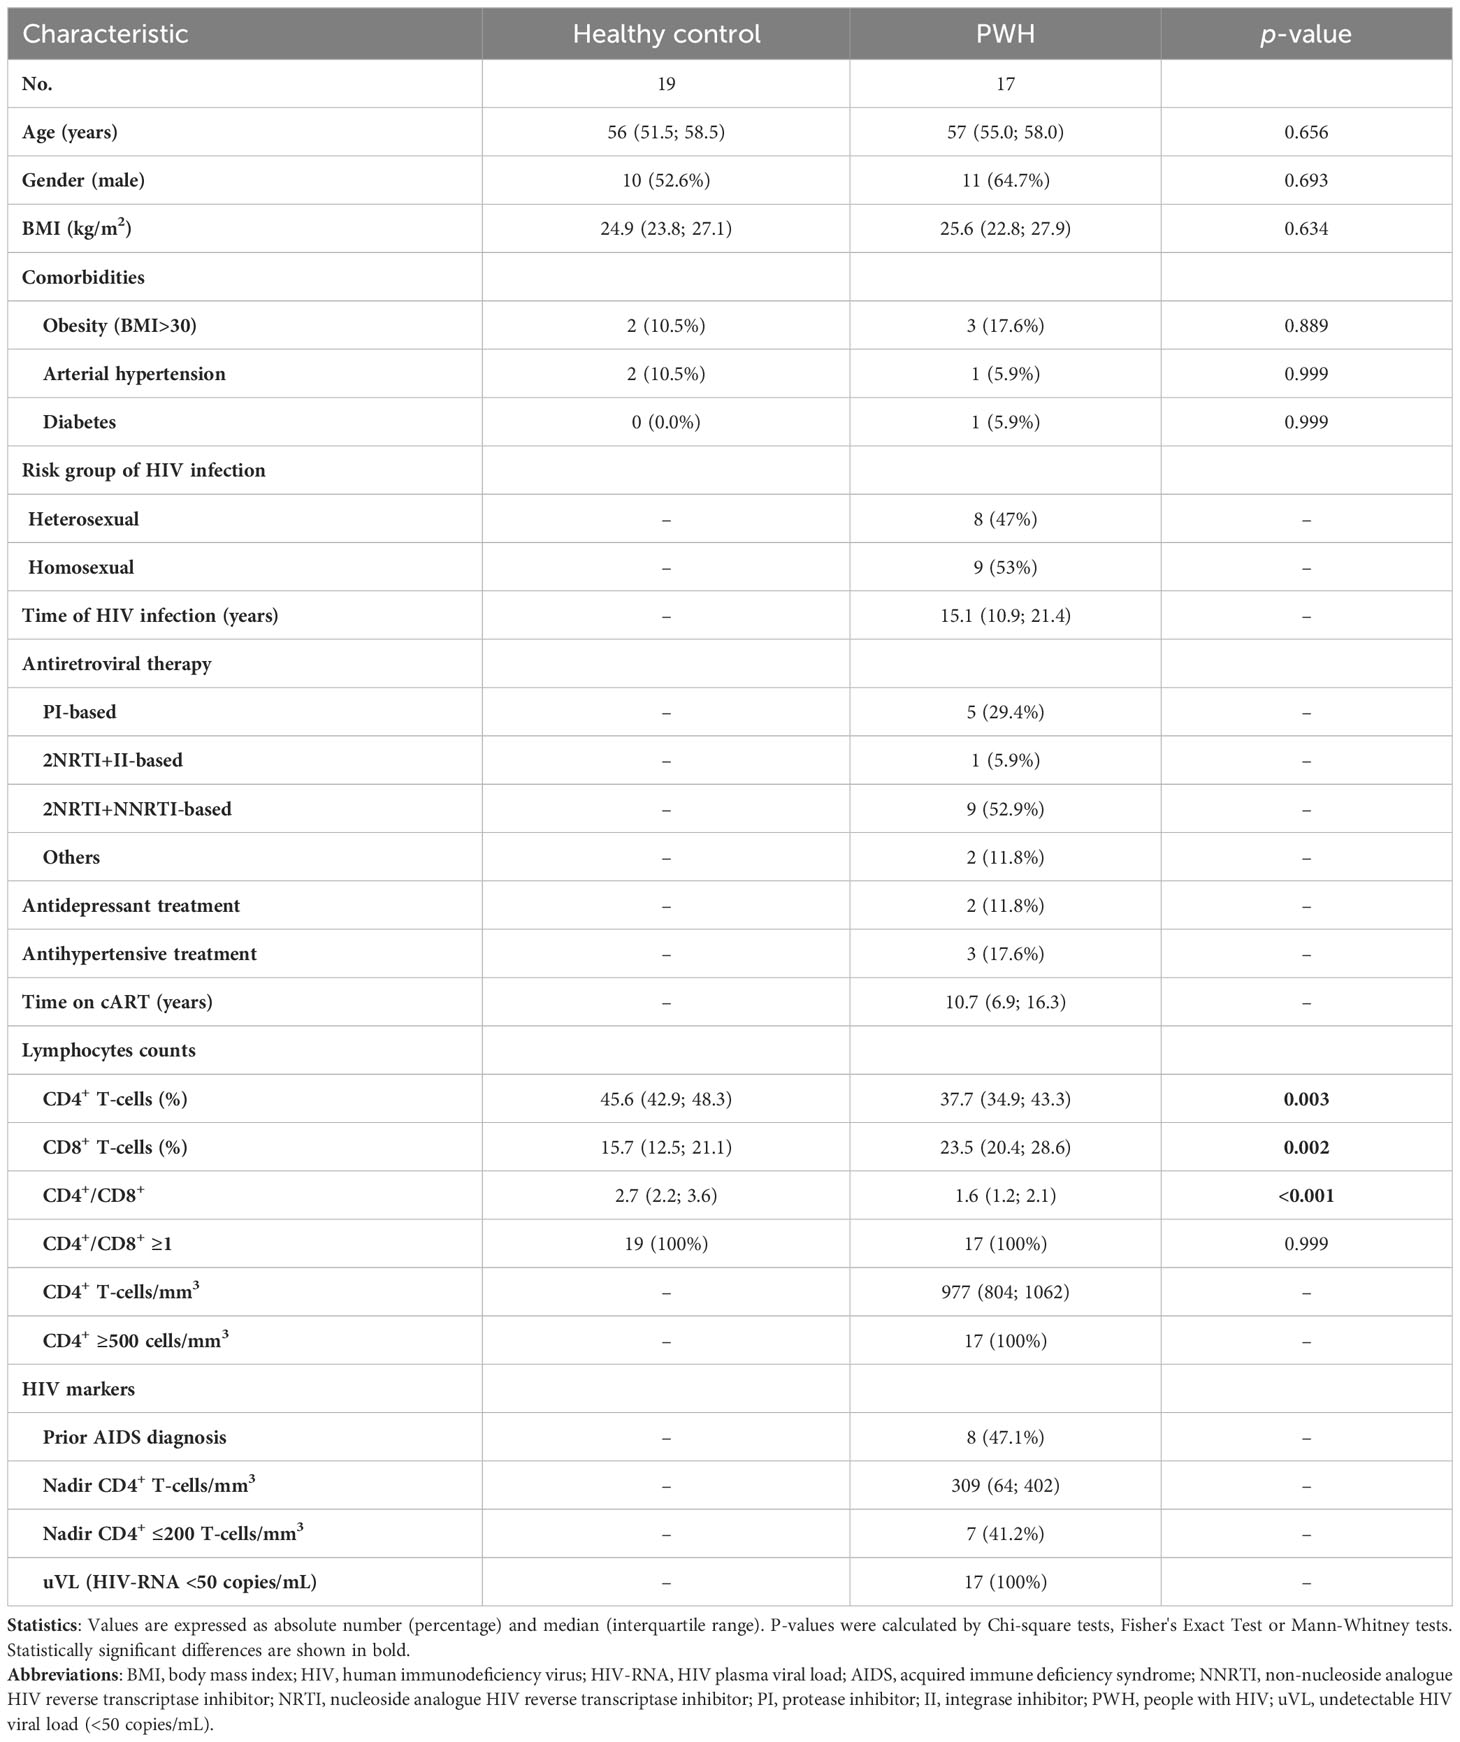
Table 1 Clinical and epidemiological characteristics of PLW on long-term suppressive ART and healthy controls.
Reliability analysis
PCA indicated that quality control (QC) samples were tightly clustered together in the center of the plot, thus validating the signal stability and technical reproducibility (Supplementary Figure 1).
Metabolite association analysis
PCA showed similarity between the sample groups for all the platforms used (Figure 1A). PLS-DA was performed for features detected in GC-MS (R2 = 0.377 and Q2 = 0.002; one component), LC-MS ESI+ (R2 = 0.658 and Q2=-0.076; three components), and LC-MS ESI- (R2 = 0.884 and Q2 = 0.232; five components) (Figure 1B). However, PLS-DA could not be validated by permutation for any of the platforms: GC-MS (p=0.323), LC-MS ESI+ (p=0.221), and LC-MS ESI- (p=0.548) (Supplementary Figure 2). Therefore, PCA and PLS-DA showed no significant differences between the two study groups. Similarly, differences between types of ART (PI-based, 2NRTI+NNRTI-based, and others) (Supplementary Figure 3) and nadir CD4+ levels (<200 cells/mm3 and ≥200 cells/mm3) (Supplementary Figure 4) in PWH group were not found.
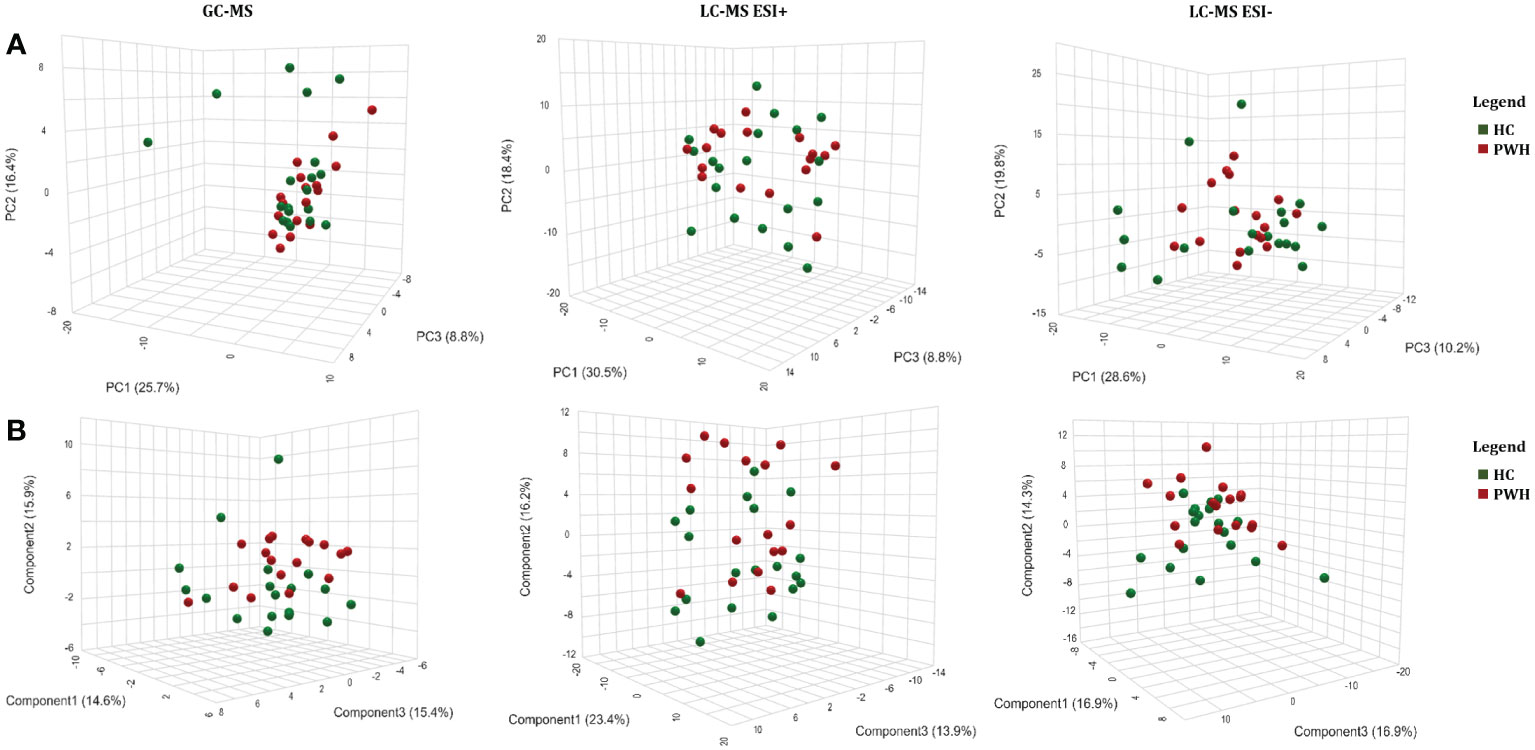
Figure 1 Multivariate metabolomic analysis in people with HIV (PWH) on long-term suppressive ART compared to healthy controls. (A) Principal component analysis (PCA) plot; (B) partial least squares - discriminant analysis (PLS-DA). PWH, people with human immunodeficiency virus; HC, healthy controls; GC-MS, gas chromatography–mass spectrometry; LC-MS, and liquid chromatography–mass spectrometry; ESI, electrospray ionization; PC, principal component.
GLM analysis adjusted by the most relevant covariates showed 63 significant features (p<0.05), of which 14 had a q<0.20 after correcting by FDR (Table 2). Of these, identification data were only obtained for three metabolites. Briefly, while lysophosphatidylcholine [LysoPC (22:6)] and lysophosphatidylethanolamine [LysoPE (22:6)] showed reduced levels [aAMR=0.59 (p=0.005; q=0.148) and aAMR=0.68 (p=0.001; q=0.050), respectively], an oxidized lipid not fully identified had increased levels [aAMR=1.11 (p=0.004; q=0.136)] among PWH compared to healthy controls (Supplementary Figure 5). The possible tentative identifications for this oxidized lipid were: 12-hydroperoxy-octadecatrienoic acid (HpOTrE), 13-HpOTrE, 13S-HpOTrE, 15,16-epoxy-octadecadienoic acid (EpODE), 16-HpOTrE, 7,8-dihydroperoxy-octadecatrienoic acid (DiHOTrE), 9H-12(13)-EpODE, 9-HpOTrE, or 9S-HpOTrE (HpOTrE/DiHOTrE/EpODE).
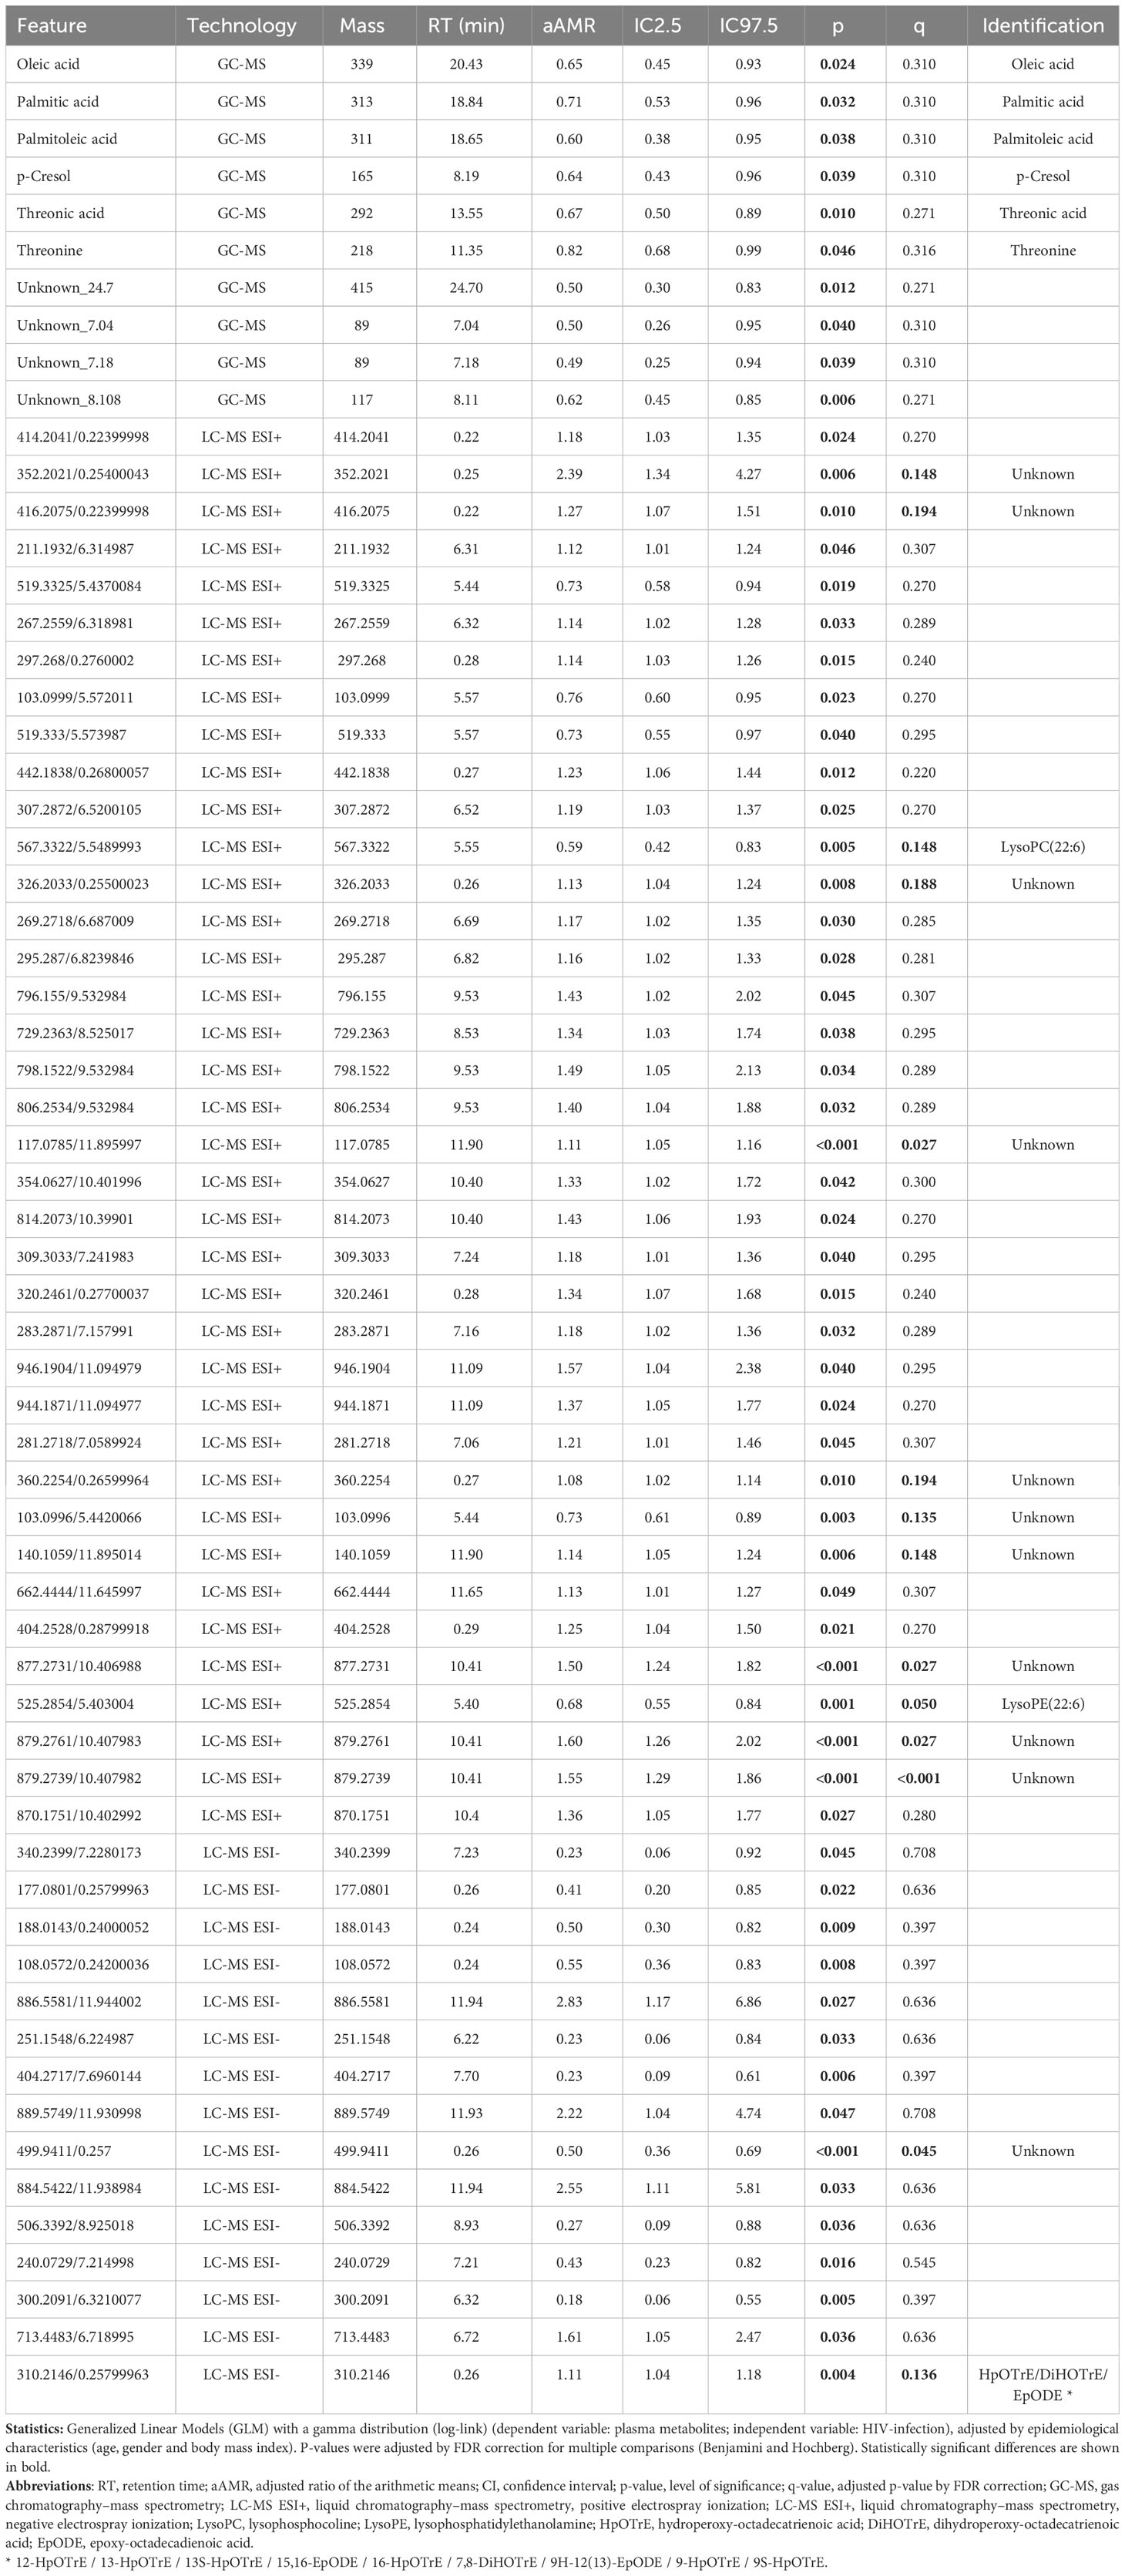
Table 2 Association of individual metabolites with HIV infection among PWH on long-term ART and immunologically recovered compared to healthy controls.
Correlation analysis between metabolites and plasma biomarkers
The plasma biomarkers concentrations in both HC and PWH groups are shown in Supplementary Table 1. The correlations between significant identified metabolites and plasma biomarkers are shown in Figure 2 (full description in Supplementary Tables 2, 3). Several correlations were found significant, even after FDR correction (r>0.5 or r<-0.5; p<0.05; q-value<0.20). LysoPC (22:6) was negatively correlated with MCP-1 in PWH and the HC-group (p=0.037 and p=0.002, respectively). Besides, while no significant correlations were found for LysoPE (22:6) in PWH, negative correlations were found between LysoPE (22:6) and IL-12p70 (p=0.012), IL-17A (p=0.040), and sCD14 (p=0.002) in the HC-group. HpOTrE/DiHOTrE/EpODE was also positively correlated with sICAM-1 (p=0.004) and sTNFR-I (p=0.009) in PWH. However, we found negative correlations between HpOTrE/DiHOTrE/EpODE and sICAM-1 (p=0.001), sVCAM-1 (p=0.016), IL-12p70 (p=0.018), IL-1β (p=0.011), IL-8 (p=0.027), IL-4 (p=0.021) in the HC-group.
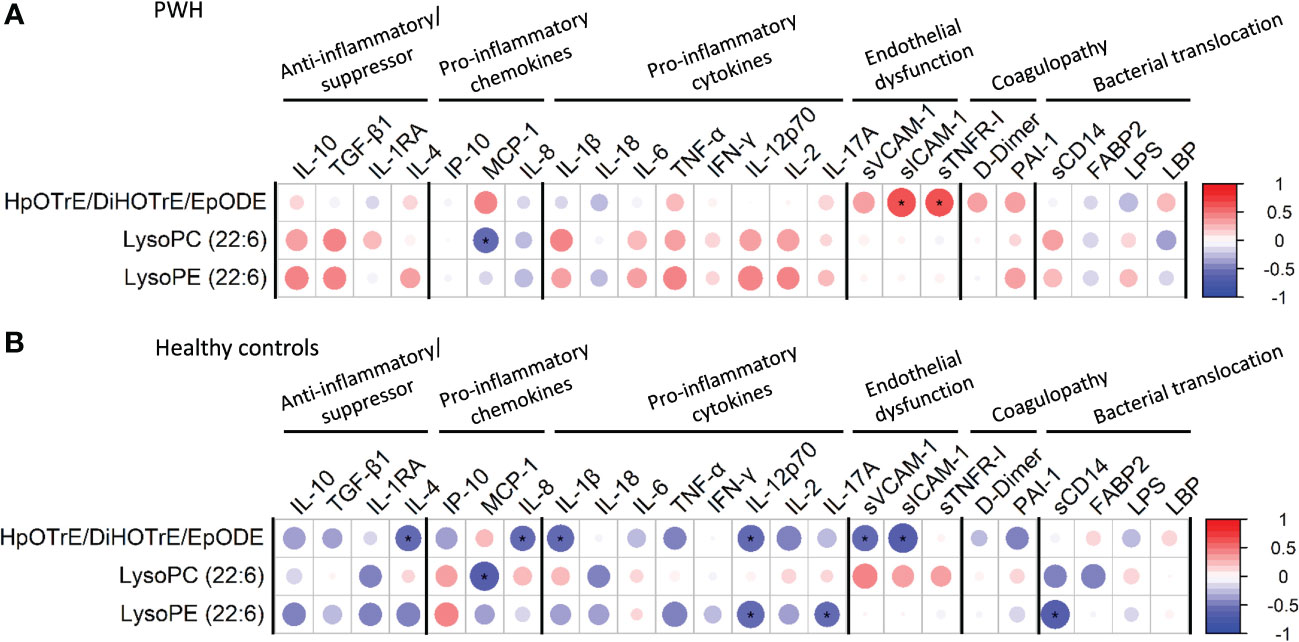
Figure 2 Spearman correlation plot between significant metabolites and plasma cytokines/chemokines: (A) people with HIV (PWH); (B) healthy controls. The size of the circles is proportional to the strength of the correlation, and the color represents the direction (color legends are shown on the right), where large dark blue represents a strong negative correlation, and a large dark red circle represents a strong positive correlation. Metabolites are on the vertical axis, and cytokines/chemokines are on the horizontal axis. Those correlations with rho>0.5 o rho<-0.5, p-value<0.05, and q-value<0.2 are shown with an asterisk. IL, interleukin; TGF-β1, transforming growth factor beta 1; IL-1RA, IL-1 receptor antagonist; IP-10, human interferon-inducible protein 10; MCP-1, monocyte chemoattractant protein-1; TNF-α, tumor necrosis factor alpha; IFN-γ, interferon gamma; sVCAM-1, soluble vascular cell adhesion molecule-1; sICAM-1, soluble intercellular adhesion molecule-1; sTNFR-1, soluble tumour necrosis factor receptor-1; PAI-1, plasminogen activator inhibitor-1; FABP2, fatty acid-binding protein 2; LPS, lipopolysaccharide; LBP, lipopolysaccharide binding protein.
Discussion
We found little differences in the metabolic profile between PWH with immunological recovery after long-term suppressive ART and healthy controls.
PCA and PLS-DA multivariate analysis showed no relevant results for any platforms used. Previous metabolomic studies have shown a clear separation between PWH and HC groups (Hewer et al., 2006; Herbert et al., 2023), even for PWH on long-term successful antiretroviral therapy (Babu et al., 2019), in which alterations in amino-acid levels, energetics, and lipids have been found. However, PWH did not achieve a CD4/CD8 ratio >1 in most studies, which could contribute to the differences observed in these studies in contrast to ours. Besides, several articles have described a metabolomic signature associated with immunological CD4+ T-cell recovery after long-term of antiretroviral therapy. However, it has been also studied in PWH whose immunological recovery did not exceed the CD4 T-cell count of 500 (Rodriguez-Gallego et al., 2018; Nystrom et al., 2021; Qian et al., 2021), which limits comparisons with our study. In this sense, different overlapping metabolic profiles between PWH and HC has been found probably due to different disease stage of individuals (Williams et al., 2012), which indicates that the characteristics of patients and their level of immunological recovery are crucial to interpret the findings. Thus, further studies including PWH with longer periods of successful ART and improved immune reconstitution (CD4+/CD8+ ≥1) would be needed to corroborate the near-normal metabolomic profile found in our study.
However, although, to our knowledge, no previous metabolomic studies have been performed in PWH on long-term ART with CD4+/CD8+ ≥1compared to healthy controls, the finding of an almost normalization of the metabolic profile in this subgroup of PWH is concordant with previous studies, in which a normalization of different immune-related molecular markers has been described. In this same cohort, Brochado-Kith et al. showed that peripheral blood mononuclear cells gene expression and peripheral blood biomarkers in PWH, with normalized CD4+/CD8+ ratio, had a similar profile compared to healthy controls (BroChado-Kith et al., 2020). Serrano-Villar et al. found that PWH on ART with a normalized CD4+/CD8+ ratio demonstrated traits of a nearly healthy immune system (Serrano-Villar et al., 2014). Sperk et al. showed that some pro-inflammatory cytokines and chemokines return to healthy levels in PWH with nearly twenty years of ART (Sperk et al., 2018).
Additionally, the GLM analysis of each metabolite showed scarce differences between groups. Decreased levels of lysoPCs (22:6) and lysoPE (22:6) were found in PWH on long-term ART compared to healthy controls. Although these specific metabolites have not been described in previous studies, an altered level of phosphatidylcholine and phosphatidylethanolamine has been found comparing PWH on long-term successful antiretroviral therapy and HC groups (Babu et al., 2019). Likewise, Lu et al. described that glycerophospholipid metabolism was one of the pathways with highest impact (Lu et al., 2023), which is in line with our findings. Additionally, lower level of these lysophospholipids has been also associated to other human diseases, such as metabolic, cardiovascular, and neurodegenerative disorders, all non-AIDS-defining events (NADEs) among PWH (Law et al., 2019). Likewise, lower lysoPCs (22:6) and lysoPE (22:6) levels have also been associated with more advanced cirrhosis stages among HIV/HCV-coinfected patients (Salguero et al., 2020). In addition, decreased concentrations of different LysoPCs species have been associated with the risk of obesity (Barber et al., 2012), linked to inflammaging, insulin resistance, metabolic syndrome, and non-alcoholic fatty liver disease, among others. Regarding ART, several diabetes-associated lipid species are perturbed in ART-treated PWH, as ART disrupts lipid metabolism (Brown and Glesby, 2011).
The metabolites whose levels differed between groups have been associated with inflammaging and immune activation (Lee et al., 2016; Toledo et al., 2017; Law et al., 2019), which can lead to premature aging and NADEs (Zicari et al., 2019). In this setting, we analyzed the correlation of these metabolites with several plasma biomarkers and found a significant negative correlation between LysoPC (22:6) and the pro-inflammatory chemokine MCP-1 in PWH, supporting the inflammaging and immune activation state in these patients. No significant correlations were found for LysoPE (22:6) in PWH. Regarding the oxidized lipid, significant positive correlations were found with sICAM-1 and sTNFR-1 in PWH, both being endothelial dysfunction markers and associated with increased risk of cardiovascular disease, cancers, and atherosclerosis, among others (Gross et al., 2012; Zicari et al., 2019; Bui et al., 2020). Interestingly, phospholipid metabolism has been previously found to be altered in studies including younger PWH on long-term ART compared HC (mean age of 45 years in both groups) (Babu et al., 2019; Lu et al., 2023), which could indicate that similar molecular mechanisms may also occur in younger cohorts, although further studies are needed.
Although the introduction of ART has increased the life expectancy of PWH (Zicari et al., 2019), our study suggests it does not restore health ad-integrum. We observed that even patients with a normalized CD4+/CD8+ ratio presented alteration of specific metabolites that could be involved in the pathogenesis of different age-related comorbidities due to chronic immune activation, immunosenescence, and inflammaging.
Therefore, it is essential to carry out further studies that corroborate the role of metabolic changes during ART among PWH. Likewise, metabolomics can offer an alternative view of the inflammatory state of patients.
Some limitations should be considered for a correct interpretation of the data. Firstly, the sample size was limited, which could have restricted the statistical power to detect metabolic differences between groups. In addition, the modest sample size may also increase the false positive rate, but our positive findings were FDR-corrected, lending robustness to our results. Second, this study has a cross-sectional design, which may introduce some bias and limit the interpretation of our findings. Thirdly, clinical data related to the individual cognitive status were unavailable, which would be interesting as neurocognitive disorders have been shown to impact the lipidome. Finally, more studies would be needed in other patient cohorts, such as among PWH with different age ranges, to confirm whether similar results are found.
Conclusions
In conclusion, our data suggests that PWH on long-term ART, with CD4+/CD8+ ratio ≥1, have a metabolomic profile that is almost normal compared to healthy controls. Nevertheless, residual metabolic alterations linked to inflammatory biomarkers persist, which could favor the development of age-related comorbidities among this population.
Data availability statement
The original contributions presented in the study are included in the article/Supplementary Material. Further inquiries can be directed to the corresponding author.
Ethics statement
The studies involving humans were approved by The study was approved by the Research Ethics Committee of the Institute of Health Carlos III (CEI PI 23_2011, CEI PI 41_2020-v2) and was carried out according to the Declaration of Helsinki. Before registration, all participants signed written consent. The studies were conducted in accordance with the local legislation and institutional requirements. The participants provided their written informed consent to participate in this study.
Author contributions
AV-B: Data curation, Formal analysis, Investigation, Methodology, Visualization, Writing – original draft. RM-E: Data curation, Formal analysis, Investigation, Visualization, Writing – original draft. JB: Conceptualization, Investigation, Writing – review & editing. JG-G: Investigation, Writing – review & editing. OB-K: Formal analysis, Investigation, Writing – review & editing. DR: Investigation, Writing – review & editing. AF-R: Investigation, Writing – review & editing. LP-L: Investigation, Writing – review & editing. VH: Investigation, Writing – review & editing. CB: Investigation, Writing – review & editing. SR: Conceptualization, Funding acquisition, Project administration, Resources, Supervision, Validation, Visualization, Writing – review & editing. MAJ-S: Conceptualization, Funding acquisition, Project administration, Resources, Supervision, Validation, Visualization, Writing – review & editing.
Funding
The author(s) declare financial support was received for the research, authorship, and/or publication of this article. This study was supported by the Instituto de Salud Carlos III (ISCIII; grant numbers CP17CIII/00007, PI18CIII/00028 and PI21CIII/00033 to MAJS, PI17/00657 and PI20/00474 to JB, PI17/00903 and PI20/00507 to JG-G, PI18CIII/00020 to AF-R, and PI17CIII/00003 and PI20CIII/00004 to SR) and Ministerio de Ciencia e Innovación (AEI, PID2021-126781OB-I00 to AF-R). CB and DR acknowledge funding from the Ministerio de Ciencia e Innovación (RTI2018-095166-B-I00). The study was also funded by the CIBER -Consorcio Centro de Investigación Biomédica en Red- (CB 2021), Instituto de Salud Carlos III, Ministerio de Ciencia e Innovación and Unión Europea – NextGenerationEU (CB21/13/00044). MAJ-S is Miguel Servet researcher supported and funded by ISCIII (grant numbers CP17CIII/00007). RME is César Nombela researcher supported and funded by Comunidad de Madrid (CAM) (grant number 2023-T1/SAL-GL28980).
Acknowledgments
This study would not have been possible without the collaboration of all the patients, medical and nursery staff, and data managers who have taken part in the project. We want to acknowledge the patients in this study for their participation and the HIV BioBank integrated into the Spanish AIDS Research Network and collaborating Centres (http://hivhgmbiobank.com/donor-area/hospitals-and-centres-transferring-samples/?lang=en) for the generous gifts of clinical samples used in this work. The HIV BioBank, integrated into the Spanish AIDS Research Network, is partially funded by the RD16/0025/0019 project as part of the Plan Nacional R + D + I and cofinanced by ISCIII- Subdirección General de Evaluación and Fondo Europeo de Desarrollo Regional (FEDER).
Conflict of interest
The authors declare that the research was conducted in the absence of any commercial or financial relationships that could be construed as a potential conflict of interest.
Publisher’s note
All claims expressed in this article are solely those of the authors and do not necessarily represent those of their affiliated organizations, or those of the publisher, the editors and the reviewers. Any product that may be evaluated in this article, or claim that may be made by its manufacturer, is not guaranteed or endorsed by the publisher.
Supplementary material
The Supplementary Material for this article can be found online at: https://www.frontiersin.org/articles/10.3389/fcimb.2024.1340610/full#supplementary-material
Abbreviations
AIDS, Acquired immune deficiency syndrome; AMR, Arithmetic mean ratio; ART, Combination antiretroviral therapy; DiHOTrE, Dihydroperoxy-octadecatrienoic acid; FDR, False discovery rate; GC-MS, Gas chromatography–mass spectrometry; GLM, Generalized Linear Models; EpODE, Epoxy-octadecadienoic acid; HC-group, Healthy control group; HIV, Human immunodeficiency virus; HpOTrE, Hydroperoxy-octadecatrienoic acid; IL, Interleukin; LOOCV, Leave-one-out cross-validation; LC-MS, Liquid chromatography–mass spectrometry; LysoPC, Lysophosphatidylcholine; LysoPE, Lysophosphatidyletanolamine; MCP-1, Monocyte chemoattractant protein-1; PLS-DA, Partial least squares discriminant analysis; PWH, People with HIV; PCA, Principal component analysis; sCD14, Soluble cluster of differentiation 14; sICAM-1, Soluble intercellular adhesion molecule-1;sVCAM-1, Soluble vascular cell adhesion molecule-1.
References
Babu, H., Sperk, M., Ambikan, A. T., Rachel, G., Viswanathan, V. K., Tripathy, S. P., et al. (2019). Plasma metabolic signature and abnormalities in HIV-infected individuals on long-term successful antiretroviral therapy. Metabolites 9 (10), 210. doi: 10.3390/metabo9100210
Barber, M. N., Risis, S., Yang, C., Meikle, P. J., Staples, M., Febbraio, M. A., et al. (2012). Plasma lysophosphatidylcholine levels are reduced in obesity and type 2 diabetes. PloS One 7 (7), e41456. doi: 10.1371/journal.pone.0041456
BroChado-Kith, O., Martinez, I., Berenguer, J., Medrano, L. M., Gonzalez-Garcia, J., Garcia-Broncano, P., et al. (2020). Near normalization of peripheral blood markers in HIV-infected patients on long-term suppressive antiretroviral therapy: a case-control study. AIDS 34 (13), 1891–1897. doi: 10.1097/QAD.0000000000002645
Brown, T. T., Glesby, M. J. (2011). Management of the metabolic effects of HIV and HIV drugs. Nat. Rev. Endocrinol. 8 (1), 11–21. doi: 10.1038/nrendo.2011.151
Bui, T. M., Wiesolek, H. L., Sumagin, R. (2020). ICAM-1: A master regulator of cellular responses in inflammation, injury resolution, and tumorigenesis. J. Leukoc. Biol. 108 (3), 787–799. doi: 10.1002/JLB.2MR0220-549R
Caby, F. (2017). CD4+/CD8+ ratio restoration in long-term treated HIV-1-infected individuals. AIDS 31 (12), 1685–1695. doi: 10.1097/QAD.0000000000001533
Cassol, E., Misra, V., Holman, A., Kamat, A., Morgello, S., Gabuzda, D. (2013). Plasma metabolomics identifies lipid abnormalities linked to markers of inflammation, microbial translocation, and hepatic function in HIV patients receiving protease inhibitors. BMC Infect. Dis. 13, 203. doi: 10.1186/1471-2334-13-203
Chen, J., Liu, X., Qin, S., Ruan, G., Lu, A., Zhang, J., et al. (2022). A novel prognostic score including the CD4/CD8 for AIDS-related lymphoma. Front. Cell Infect. Microbiol. 12, 919446. doi: 10.3389/fcimb.2022.919446
Gelpi, M., Afzal, S., Lundgren, J., Ronit, A., Roen, A., Mocroft, A., et al. (2018). Higher Risk of Abdominal Obesity, Elevated Low-Density Lipoprotein Cholesterol, and Hypertriglyceridemia, but not of Hypertension, in People Living With Human Immunodeficiency Virus (HIV): Results From the Copenhagen Comorbidity in HIV Infection Study. Clin. Infect. Dis. 67 (4), 579–586. doi: 10.1093/cid/ciy146
Godzien, J., Ciborowski, M., Armitage, E. G., Jorge, I., Camafeita, E., Burillo, E., et al. (2016). A single in-vial dual extraction strategy for the simultaneous lipidomics and proteomics analysis of HDL and LDL fractions. J. Proteome Res. 15 (6), 1762–1775. doi: 10.1021/acs.jproteome.5b00898
Gross, M. D., Bielinski, S. J., Suarez-Lopez, J. R., Reiner, A. P., Bailey, K., Thyagarajan, B., et al. (2012). Circulating soluble intercellular adhesion molecule 1 and subclinical atherosclerosis: the Coronary Artery Risk Development in Young Adults Study. Clin. Chem. 58 (2), 411–420. doi: 10.1373/clinchem.2011.168559
Han, W. M., Apornpong, T., Kerr, S. J., Hiransuthikul, A., Gatechompol, S., Do, T., et al. (2018). CD4/CD8 ratio normalization rates and low ratio as prognostic marker for non-AIDS defining events among long-term virologically suppressed people living with HIV. AIDS Res. Ther. 15 (1), 13. doi: 10.1186/s12981-018-0200-4
Herbert, C., Luies, L., Loots, D. T., Williams, A. A. (2023). The metabolic consequences of HIV/TB co-infection. BMC Infect. Dis. 23 (1), 536. doi: 10.1186/s12879-023-08505-4
Hewer, R., Vorster, J., Steffens, F. E., Meyer, D. (2006). Applying biofluid 1H NMR-based metabonomic techniques to distinguish between HIV-1 positive/AIDS patients on antiretroviral treatment and HIV-1 negative individuals. J. Pharm. BioMed. Anal. 41 (4), 1442–1446. doi: 10.1016/j.jpba.2006.03.006
Kind, T., Wohlgemuth, G., Lee, D. Y., Lu, Y., Palazoglu, M., Shahbaz, S., et al. (2009). FiehnLib: mass spectral and retention index libraries for metabolomics based on quadrupole and time-of-flight gas chromatography/mass spectrometry. Anal. Chem. 81 (4), 10038–10048. doi: 10.1021/ac9019522
Law, S. H., Chan, M. L., Marathe, G. K., Parveen, F., Chen, C. H., Ke, L. Y. (2019). An updated review of lysophosphatidylcholine metabolism in human diseases. Int. J. Mol. Sci. 20 (5), 1149. doi: 10.3390/ijms20051149
Lee, J. M., Lee, H., Kang, S., Park, W. J. (2016). Fatty acid desaturases, polyunsaturated fatty acid regulation, and biotechnological advances. Nutrients 8 (1), 23. doi: 10.3390/nu8010023
Lu, L., Yang, Y., Yang, Z., Wu, Y., Liu, X., Li, X., et al. (2023). Altered plasma metabolites and inflammatory networks in HIV-1 infected patients with different immunological responses after long-term antiretroviral therapy. Front. Immunol. 14, 1254155. doi: 10.3389/fimmu.2023.1254155
Lu, W., Mehraj, V., Vyboh, K., Cao, W., Li, T., Routy, J. P. (2015). CD4:CD8 ratio as a frontier marker for clinical outcome, immune dysfunction and viral reservoir size in virologically suppressed HIV-positive patients. J. Int. AIDS Soc. 18 (1), 20052. doi: 10.7448/IAS.18.1.2005220052
Munshi, S. U., Rewari, B. B., Bhavesh, N. S., Jameel, S. (2013). Nuclear magnetic resonance based profiling of biofluids reveals metabolic dysregulation in HIV-infected persons and those on anti-retroviral therapy. PloS One 8 (5), e64298. doi: 10.1371/journal.pone.0064298
Nystrom, S., Govender, M., Yap, S. H., Kamarulzaman, A., Rajasuriar, R., Larsson, M. (2021). HIV-infected individuals on ART with impaired immune recovery have altered plasma metabolite profiles. Open Forum Infect. Dis. 8 (7), ofab288. doi: 10.1093/ofid/ofab288
Peltenburg, N. C., Schoeman, J. C., Hou, J., Mora, F., Harms, A. C., Lowe, S. H., et al. (2018). Persistent metabolic changes in HIV-infected patients during the first year of combination antiretroviral therapy. Sci. Rep. 8 (1), 16947. doi: 10.1038/s41598-018-35271-0
Qian, S., Chen, X., Wu, T., Sun, Y., Li, X., Fu, Y., et al. (2021). The accumulation of plasma acylcarnitines are associated with poor immune recovery in HIV-infected individuals. BMC Infect. Dis. 21 (1), 808. doi: 10.1186/s12879-021-06525-6
Rodriguez-Gallego, E., Gomez, J., Pacheco, Y. M., Peraire, J., Vilades, C., Beltran-Debon, R., et al. (2018). A baseline metabolomic signature is associated with immunological CD4+ T-cell recovery after 36 months of antiretroviral therapy in HIV-infected patients. AIDS 32 (5), 565–573. doi: 10.1097/QAD.0000000000001730
Salek, R. M., Steinbeck, C., Viant, M. R., Goodacre, R., Dunn, W. B. (2013). The role of reporting standards for metabolite annotation and identification in metabolomic studies. Gigascience 2 (1), 13. doi: 10.1186/2047-217X-2-13
Salguero, S., Rojo, D., Berenguer, J., Gonzalez-Garcia, J., Fernandez-Rodriguez, A., BroChado-Kith, O., et al. (2020). Plasma metabolomic fingerprint of advanced cirrhosis stages among HIV/HCV-coinfected and HCV-monoinfected patients. Liver Int. 40 (9), 2215–2227. doi: 10.1111/liv.14580
Serrano-Villar, S., Sainz, T., Lee, S. A., Hunt, P. W., Sinclair, E., Shacklett, B. L., et al. (2014). HIV-infected individuals with low CD4/CD8 ratio despite effective antiretroviral therapy exhibit altered T cell subsets, heightened CD8+ T cell activation, and increased risk of non-AIDS morbidity and mortality. PloS Pathog. 10 (5), e1004078. doi: 10.1371/journal.ppat.1004078
Sperk, M., Zhang, W., Nowak, P., Neogi, U. (2018). Plasma soluble factor following two decades prolonged suppressive antiretroviral therapy in HIV-1-positive males: A cross-sectional study. Med. (Baltimore) 97 (5), e9759. doi: 10.1097/MD.0000000000009759
Toledo, E., Wang, D. D., Ruiz-Canela, M., Clish, C. B., Razquin, C., Zheng, Y., et al. (2017). Plasma lipidomic profiles and cardiovascular events in a randomized intervention trial with the Mediterranean diet. Am. J. Clin. Nutr. 106 (4), 973–983. doi: 10.3945/ajcn.116.151159
Williams, A., Koekemoer, G., Lindeque, Z., Reinecke, C., Meyer, D. (2012). Qualitative serum organic acid profiles of HIV-infected individuals not on antiretroviral treatment. Metabolomics 8, 804–818. doi: 10.1007/s11306-011-0376-2
Keywords: antiretroviral therapy, CD4+/CD8+ ratio, HIV, inflammation, metabolomics
Citation: Virseda-Berdices A, Martín-Escolano R, Berenguer J, González-García J, Brochado-Kith O, Rojo D, Fernández-Rodríguez A, Pérez-Latorre L, Hontañón V, Barbas C, Resino S and Jiménez-Sousa MÁ (2024) Plasma metabolomic profile is near-normal in people with HIV on long-term suppressive antiretroviral therapy. Front. Cell. Infect. Microbiol. 14:1340610. doi: 10.3389/fcimb.2024.1340610
Received: 18 November 2023; Accepted: 23 February 2024;
Published: 14 March 2024.
Edited by:
Alejandro Vallejo, Ramón y Cajal Institute for Health Research, SpainReviewed by:
Anna Rull, Pere Virgili Health Research Institute (IISPV), SpainMaria Abad Fernandez, University of North Carolina at Chapel Hill, United States
Copyright © 2024 Virseda-Berdices, Martín-Escolano, Berenguer, González-García, Brochado-Kith, Rojo, Fernández-Rodríguez, Pérez-Latorre, Hontañón, Barbas, Resino and Jiménez-Sousa. This is an open-access article distributed under the terms of the Creative Commons Attribution License (CC BY). The use, distribution or reproduction in other forums is permitted, provided the original author(s) and the copyright owner(s) are credited and that the original publication in this journal is cited, in accordance with accepted academic practice. No use, distribution or reproduction is permitted which does not comply with these terms.
*Correspondence: María Ángeles Jiménez-Sousa, amltZW5lenNvdXNhQGlzY2lpaS5lcw==; Salvador Resino, c3Jlc2lub0Bpc2NpaWkuZXM=
†These authors have contributed equally to this work