 Yanhong Li
 Xiaolan Qi
 Qinrong Wang1
 Limin Wei
- 1Key Laboratory of Endemic and Ethnic Diseases, Ministry of Education & Key Laboratory of Medical Molecular Biology of Guizhou Province, Collaborative Innovation Center for Prevention and Control of Endemic and Ethnic Regional Diseases Co-constructed by the Province and Ministry, Guizhou Medical University, Guiyang, Guizhou, China
- 2Chongqing Key Laboratory of High Active Traditional Chinese Drug Delivery System, Chongqing Medical and Pharmaceutical College, Chongqing, China
- 3College of Pharmacy, Chongqing Medical University, Chongqing, China
The Cecum is a key site for cellulose digestion in nutrient metabolism of intestine, but its mechanisms of microbial and gene interactions has not been fully elucidated during pathogenesis of obesity. Therefore, the cecum tissues of the New Zealand rabbits and their contents between the high-fat diet-induced group (Ob) and control group (Co) were collected and analyzed using multi-omics. The metagenomic analysis indicated that the relative abundances of Corallococcus_sp._CAG:1435 and Flavobacteriales bacterium species were significantly lower, while those of Akkermansia glycaniphila, Clostridium_sp._CAG:793, Mycoplasma_sp._CAG:776, Mycoplasma_sp._CAG:472, Clostridium_sp._CAG:609, Akkermansia_sp._KLE1605, Clostridium_sp._CAG:508, and Firmicutes_bacterium_CAG:460 species were significantly higher in the Ob as compared to those in Co. Transcriptomic sequencing results showed that the differentially upregulated genes were mainly enriched in pathways, including calcium signaling pathway, PI3K-Akt signaling pathway, and Wnt signaling pathway, while the differentially downregulated genes were mainly enriched in pathways of NF-kappaB signaling pathway and T cell receptor signaling pathway. The comparative analysis of metabolites showed that the glycine, serine, and threonine metabolism and cysteine and methionine metabolism were the important metabolic pathways between the two groups. The combined analysis showed that CAMK1, IGFBP6, and IGFBP4 genes were highly correlated with Clostridium_sp._CAG:793, and Akkermansia_glycaniphila species. Thus, the preliminary study elucidated the microbial and gene interactions in cecum of obese rabbit and provided a basis for further studies in intestinal intervention for human obesity.
1 Introduction
Obesity is a global epidemic disease, which is considered a potential threat to the health of middle-aged and elderly people in the future. Gut microbiota is associated with the development of obesity and obesity-related metabolic syndromes, such as NAFLD, insulin resistance, T2DM, hypertension, cardiovascular disease, and coronary heart disease. Numerous factors, such as nutrition diet, genetic expression pattern, age, and biological factors in the body, can affect gut microbiota (Milani et al., 2017; Cuevas-Sierra et al., 2019). However, the changes in dietary fiber can alter the composition of gut microbiota, thereby causing the occurrence of metabolic diseases in the host. Especially, the changes in the gut microbiota in the large intestine are highly related to the fermentation of dietary fibers for the body’s nutrient metabolism and absorption. This fermentation of dietary fibers produces numerous beneficial metabolites, such as SCFAs and succinate, which can be used to intervene in obesity in human (Canfora et al., 2019). Biologically, the production of gut microbial metabolites is closely related to host system evolution and dietary behavior (Yao et al., 2021; Cuomo et al., 2022). Previous studies have confirmed that the plant fibrotic diet is highly associated with the gut microbiota, such as Roseburia, Eubacterium rectale, and Faecalibacterium prausnitzii, which increase the total concentration of SCFAs (David et al., 2014; Wu et al., 2017). Previous study indicated that the HDACDEL gene could maintain intestinal homeostasis in mice while interacting with gut microbiota (Wu et al., 2020). The cecum tissues also play numerous functional roles in intestinal nutrient absorption; however, the interactions between gut microbiota and host genes are not fully understood yet.
In obese populations, excessive lipid deposition in the body of the patients is a major factor inducing metabolic diseases. The long-term supplementation of high-fat and high-sugar diets increases the metabolic burden on various organs in the body, especially leading to the ectopic deposition of visceral fat, which causes the occurrence of metabolic diseases (Neeland et al., 2019). Clinical diagnosis also shows that excessive fat deposition in the intestine can affect intestinal peristalsis, disrupt intestinal homeostasis, and damage the intestinal mucosal barrier (Festi et al., 2020; Chen et al., 2021). Studies have shown that a large amount of lipids accumulate in the intestine of obese patients, and these adipose tissues can secrete pro-inflammatory factors, such as TNF-α and IL-6, and anti-inflammatory factor (Adiponectin). These pro- and anti-inflammatory factors can affect the intestinal environment and produce different types of secondary metabolites to rebalance the nutritional metabolism of gut microbiota (Bisanz et al., 2019; Liu et al., 2022; Bodilly et al., 2023). Simultaneously, the different gut microbial metabolites are a major factor regulating the homeostasis of the intestinal environment. Previous studies indicated that the specific knockout of HIF-2α in mice could disturb the intestinal lactic acid level, thereby decreasing the abundance of Bacteroides and increasing that of rumen cocci, which resulted in promoting the levels of taurocholic acid and deoxycholic acid (Wu et al., 2021). These acids could activate the adipose G-protein-coupled bile acid receptor and upregulate the expression of UCP1 and CKMT2, increasing heat production in white adipose tissue (Haddish and Yun, 2023). Clostridium butyricum CCFM1299 could reduce obesity by increasing energy expenditure and regulating host bile acid metabolism (Liao et al., 2023). Simultaneously, studies confirmed that bile acids, butyric acid, succinate, cinnabarinic acid, urolithin A, and asparagine produced by gut microbiota were involved in regulating metabolic pathways in adipose tissue cells, such as PKA, PPAR-alpha, PGC-1α, and mTORC1 signaling pathways (Thibaut and Bindels, 2022; Tang et al., 2023). However, the circulatory metabolic system and cooperative mechanism among gut microbiota, gut metabolites, and host genes in the pathogenesis of diet-induced obesity have not been fully understood yet.
As an important part of the large intestine, the cecum tissues play an important role in the digestion and reabsorption of food nutrition. Studies have shown that the cecum of rabbits is well-developed and can be used as a good intestinal model to study the pathogenesis of animal digestive diseases (Dabbou et al., 2019; Abdel-Kafy et al., 2023). Therefore, this study aimed to find the interaction mechanisms among host genes and gut microbiota in the cecum tissues of rabbits fed with a high-fat diet in order to provide a basis for improving and intervening in animal and human intestinal metabolic diseases.
2 Materials and methods
2.1 Construction of the rabbit model
Experiment design. A total of 22 male New Zealand rabbits aged 270 days were randomly selected and divided into two groups: a control group (Co, n = 11) and a high-fat group (Ob, n = 11). All the rabbits were fed in the animal experiment center of Guizhou Medical University, reared in the same breeding management conditions (The optimal indoor feeding conditions: temperature at 15 ~ 25°C, humidity at 60% ~ 70% and 12 hours a day alternating light), and vaccinated regularly. The experiment was divided into pre-feeding (14 days) and experimental (28 days) periods.
Feeding protocol. The experiment was divided into a 14-day pre-feeding period and a 28-day experimental period. The rabbits were separately housed in single cages and fed (200 g per rabbit) twice a day. During the pre-feeding period, all the rabbits were fed 200 g of commercial diet twice a day per rabbit, and the specific feed composition is provided in Table 1. During the experimental period, the Ob rabbits were fed with a high-fat diet (Commercial feed + 10% lard), while the Co rabbits were fed with the commercial feed only. The feeding amount was recorded until the end of the experimental period. The specific experiment design was shown in the Figure 1.

Table 1 Commercial feed nutrient composition ratio.
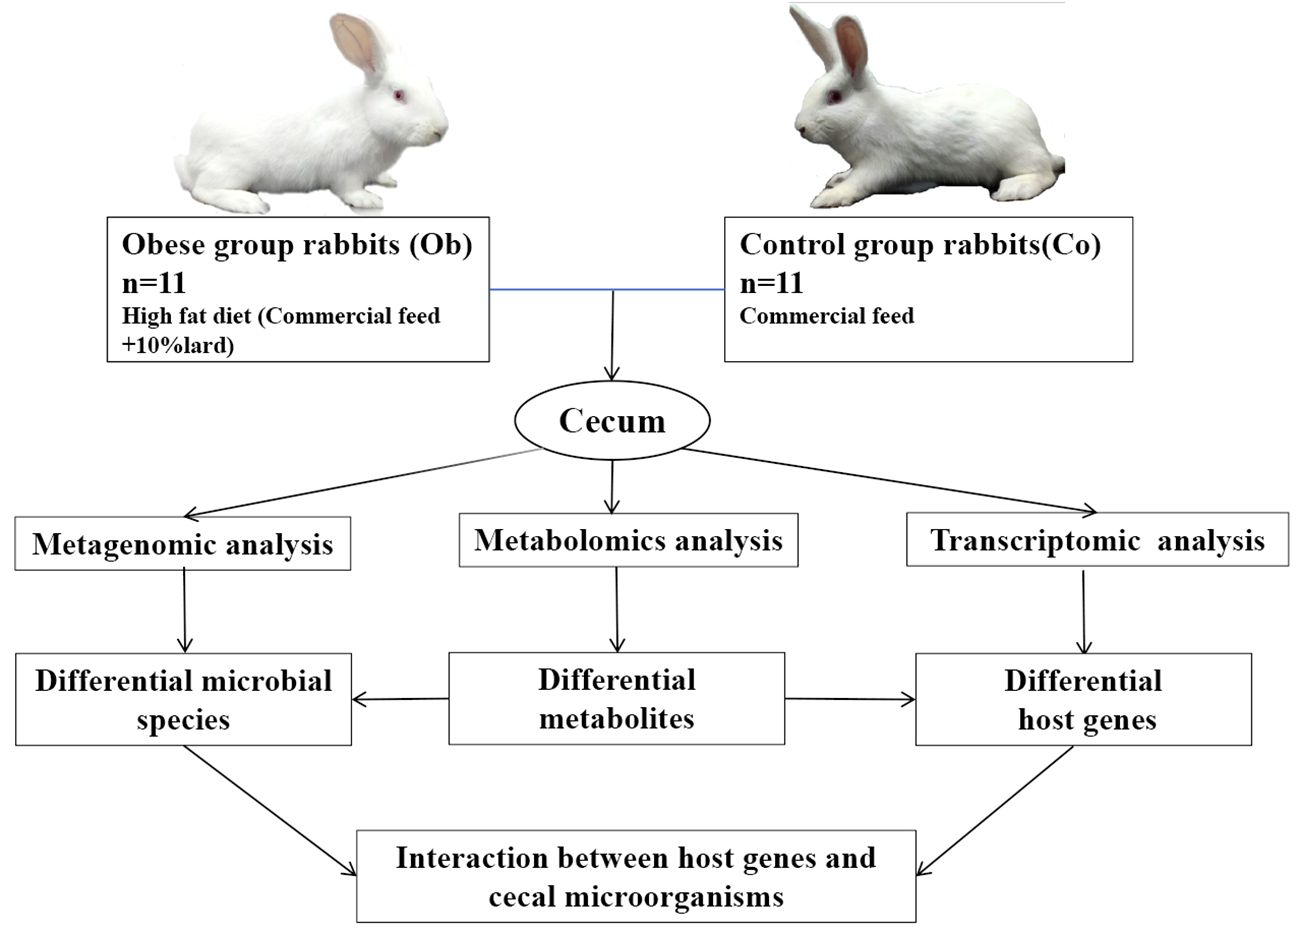
Figure 1 Design route of fattening experiment with induced by a high fat diet in adult New Zealand rabbits.
2.2 Total RNA extraction and RNA-sequencing
Total RNA was extracted from 6 cecum samples obtained from Co and Ob groups using the TRIZOL reagent (Invitrogen, CA, USA) following the manufacturer’s instructions. The quantification and assessment of RNA purity were performed using the NanoDrop 2000 spectrophotometer (Thermo Scientific, USA). Then, the libraries were constructed using VAHTS Universal V6 RNA-seq Library Prep Kit following the manufacturer’s instructions. The RNA sequencing was performed by OE Biotech Co., Ltd. (Shanghai, China). The libraries were sequenced on an Illumina NovaSeq 6000 platform, generating 150-bp paired-end reads. The raw sequence reads in FastQ format were first processed using fastp, and the low-quality reads were filtered out to acquire a clean read for each sample. The clean reads were mapped to the reference genome (Oryctolagus cuniculus UM_NZW_1.0) using HISAT2 software. FPKM of each gene was calculated, and the read counts of each gene were obtained using HTSeq-count.
2.3 DNA extraction and metagenomic sequencing
Total DNA was extracted from 12 cecal content samples obtained from Co and Ob groups using a QIAamp® Fast DNA Stool Mini Kit (Qiagen, Hilden, Germany) following the manufacturer’s instructions. The DNA concentration and integrity were assessed using the NanoDrop2000 spectrophotometer (Thermo Fisher Scientific, Waltham, MA, USA) and agarose gel electrophoresis, respectively. DNA was fragmented using an S220 Focused-ultrasonicator (Covaris, USA) and cleaned up using Agencourt AMPure XP beads (Beckman Coulter Co., USA). The libraries were prepared using TruSeq Nano DNA LT Sample Preparation Kit (Illumina, San Diego, CA, USA) following the manufacturer’s instructions and sequenced on an Illumina NovaSeq 6000 platform. The metagenome sequencing was performed by OE Biotech Co., Ltd. (Shanghai, China).
2.4 Metabolite extraction and liquid chromatography mass spectrometry analysis
A total of 60 mg of sample was weighed from each of the 12 samples obtained from the Co and Ob groups and placed into a 1.5-mL EP tube. The precooled 600 μL and 300 μL methanol-water (v/v, 4:1, containing 4 μg/mL L-2-chlorophenylphenylalanine) were used for cold treatment, centrifugation, and filtration, respectively, and the samples were then prepared for LC-MS. Quality control (QC) samples were prepared by mixing the extracts of all samples in equal volumes. The metabolites were detected using an LC-MS system composed of ACQUITY UPLC I-Class plus ultra-high performance liquid series QE and high-resolution mass spectrometer. The ACQUITY UPLC HSS T3 column (100 mm × 2.1 mm, 1.8 µm) was used with a column temperature of 45°C chromatography. A 5-μL sample was injected at a flow rate of 0.35 mL/min, and the detection was performed at different time points through different liquid phase gradients (mobile phase A was water (containing 0.1% formic acid), and mobile phase B was acetonitrile). ESI was used as an ion source to detect the sample quality spectrum signal, and the positive and negative ion scanning modes were used.
2.5 HE staining
The six cecal tissue samples from Co and Ob group were fixed with 4% paraformaldehyde solution and rinsed with running water for tissue trimming. Then, placed them in a pathological plastic box for embedding to dehydrate (75% ethanol for 6 h, 85% ethanol for 10 h, 95% ethanol for 4 h, absolute ethanol I for 2 h, absolute ethanol II for 2 h), transparent (xylene I for 20 min, xylene II for 15 min), immerse in wax for 3 h, and make them into tissue wax blocks. The tissue wax blocks were cut into 5 µm thick slices using a Leica RM2235 microtome, fixed on a glass slide (at least 2 hours at 60°C). The unstained sections were deparaffinized with xylene, washed with running water for 20 min, stained with hematoxylin for 30 min, washed with running water for 20 min, differentiated with hydrochloric acid alcohol, stained with eosin for 5 min, finally dehydrated with gradient alcohol, transparent with xylene and sealed with resin glue. The stained sections were photographed and recorded using a fluorescence inverted microscope.
2.6 Bioinformatic analysis
2.6.1 Analysis of RNA-sequencing data
The genes in RNA-seq data were filtered using NOISeq and DESeq2 software. The filtered genes were further selected based on the threshold values (∣log2FC∣≥1 and FDR <0.05). The gene enrichment analysis was performed using DAVID (https://david.ncifcrf.gov/tools.jsp) and the KEGG database (Kyoto Encyclopedia of Genes and Genomes). The R software package was used to draw diagrams.
2.6.2 Analysis of metagenomic data
All the original sequence data obtained from the libraries were trimmed and filtered using Trimmomatic (v 0.36) (Bolger et al., 2014). The post-filtered pair-end clean reads were aligned against the reference genome (Oryctolagus cuniculus UM_NZW_1.0) using bowtie2 (v2.2.9), and the aligned reads were discarded. Metagenome assembly was constructed using MEGAHIT (v1.1.2) (Li et al., 2015), and the new Scaftigs with >500 bp length were screened after getting valid reads. The ORF prediction of assembled scaffolds was performed using prodigal (v2.6.3) (Hyatt et al., 2010). CDHIT (v 4.5.7) was used to predict genes from the non-redundant gene sets. The taxonomy of the species was obtained by searching in the NR Library, and its abundance was calculated using the corresponding abundance of the genes. Then, the abundance of microbiota was identified at the phylum, class, order, family, genus, and species levels. The PCA analysis and plotting of the taxonomy abundance spectrum or functional abundance spectrum were performed using R software (v 3.2.0). The linear discriminant analysis effect size (LEfSe) method was used to compare the taxonomy abundance spectrum or functional abundance spectrum.
2.6.3 Metabolite function analysis
The unique metabolites in the original LC-MS data were processed and identified using Progenesis QI software v2.3 (Nonlinear, Dynamics, Newcastle, UK). The main parameters included 5 ppm precursor tolerance, 10 ppm product tolerance, and 5% product ion threshold. The compounds were identified based on the precise mass-to-charge ratio (M/z), secondary fragments, and isotopic distribution using The Human Metabolome Database (HMDB), Lipidmaps (V2.3), Metlin, EMDB, and PMDB for qualitative analysis. The compounds with scores below 36 (out of 60) points were deemed inaccurate and removed. Orthogonal Partial Least-Squares-Discriminant Analysis (OPLS-DA) and Partial Least-Squares-Discriminant Analysis (PLS-DA) were used to identify the differential metabolites between the groups. Variable Importance of Projection (VIP) values obtained from the OPLS-DA model were used to rank the overall contribution of each variable to group discrimination. A two-tailed Student’s t-test was used to verify the significant differences in the metabolites between the groups. The differential metabolites were selected based on VIP values >1.0 and P-values <0.05.
2.7 Correlation network construction
The protein-protein interaction network obtained using STRING (https://string-db.org/cgi/input.pl) website and Cytoscape software was screened for the highly related genes using Cytohubba. In order to search the key genes in a network, Cytohubba uses 12 algorithms, including degree, edge percolated component (EPC), maximum neighborhood component (MNC), density of maximum neighborhood component (DMNC), maximal clique centrality (MCC), and centralities based on shortest paths, such as bottleneck (BN), eccentricity, closeness, radiality, betweenness, and stress.
2.8 Statistical analysis
The SPASS 22.0 software was used to analyze the significance of differences between the groups using student’s t-test. All statistics were based on mean ± standard error (Mean ± SE). P < 0.05 and P < 0.01 were considered as significant difference “*” and extremely significant “**”, respectively. The results were mapped using GraphPad Prism8 software.
3 Results
3.1 Comparative analysis of body weight, visceral fat deposition and cecal pathological diagnosis among the conditions of rabbits
In order to better understand the effects of a high-fat diet on rabbit growth, the body weight, anatomical differences, and cecal pathological diagnosis were used, as shown in Figure 2. After four weeks of treatment, the weights of Ob rabbits were higher than the Co rabbits (Figure 2A). At the same time, anatomic observation (Figure 2B) showed that as compared to the Co group, the perirenal fat of the Ob group rabbits significantly increased. The H&E staining results (Figure 2C) showed that the boundaries of the mucosal layer, submucosal layer, muscular layer, and outer membrane of the cecal tissues in the rabbits were clear in both groups. Similarly, the mucosal epithelial cells were arranged neatly and could be seen with a clear striate margin in the free surface. However, as compared to the Co group, there were abundant plasma cells and acidic granulocytes in the subepithelial lamina propria of the cecal mucosa in the Ob rabbits. The results indicated that the high-fat diet not only caused weight gain and visceral fat deposition but also increased the inflammation level of the cecum.
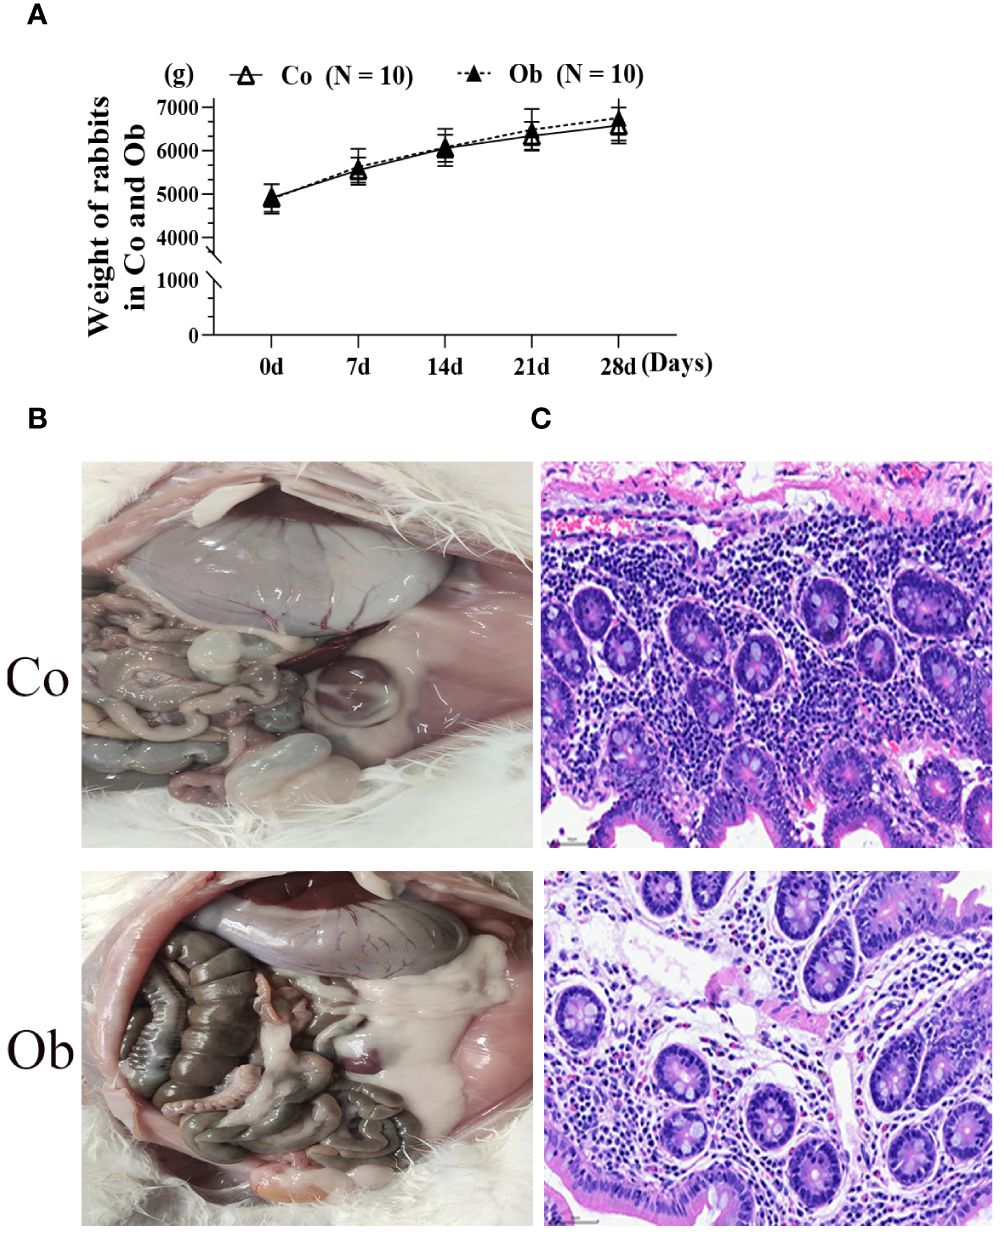
Figure 2 Phenotypic observation and pathological diagnosis of cecum in rabbits under two feeding conditions. (A, B) Weight differences and anatomical differences between the two groups of rabbits. (C) HE staining at 400×, Bar = 50 μm.
3.2 Analysis of the differences in microbial community composition and function between Ob and Co
Based on the clean read data and genome assembly, ORF prediction was performed on the trimmed contigs sequence (>500bp), and the predicted results are shown in Figure 3A. A total of 1,598,336 genes were predicted in the average 592,330,829 bp sequences (The length of contigs was from 201 to 17,907 bp), as shown in Supplementary Table S1. The number of genes between the two groups was analyzed, and the results showed that the specific genes in the Ob group were more than those in the Co group (Figure 3B). Similarly, the distribution of the gene clusters in a PCA plot revealed different patterns for the Co and Ob rabbits (Figure 3C). Furthermore, after comparing to and analyzing with NR database, the differences in the distribution of the top 15 phylum and genus level of samples in each group are shown in Figures 3D, E. The results of microbial composition analysis showed that Firmicutes, Bacteroidetes, Verrucomicrobia, Proteobacteria, Tenericutes, Candidatus_Melainabacteria, Actinobacteria, Spirochaetes, Euryarchaeota, and Fusobacteria were the most abundance bacterial phyla in the two groups. At the genus level, Clostridium, Bacteroides, Ruminococcus, Akkermansia, and Alistipes were the most abundant bacterial genera in the two groups. The alpha diversity index, which was determined by calculating the number of reads at the species level in the cecum of the two groups, is shown in Table 2. The good coverage index indicated that the coverage rate of the two groups was more than 99%, covering almost the whole gut microbiota in the cecum samples. Chao1, ACE, and Obs indices showed no significant differences between the two groups, while the Shannon and Simpson indices in the Ob group were significantly higher than those in the Co group, indicating relatively higher diversity of gut microbiota in the Ob group than the Co group. The P-values calculated using the Kruskal-Wallis method showed that 10 microbes showed significant differences at the species level in the two groups (Figure 3F). These microbes included Corallococcus_sp._CAG:1435 and Flavobacteriales bacterium, which were significantly lower in the Ob group, and Akkermansia glycaniphila, Clostridium_sp._CAG:793, Mycoplasma_sp._CAG:776, Mycoplasma_sp._CAG:472, Clostridium_sp._CAG:609, Akkermansia_sp._KLE1605, Clostridium_sp._CAG:508, Firmicutes_bacterium_CAG:460, which were significantly higher in the Ob group than the Co group. These diversity analyses indicated that a high-fat diet could increase the diversity of gut microbiota in rabbit cecal tissues.
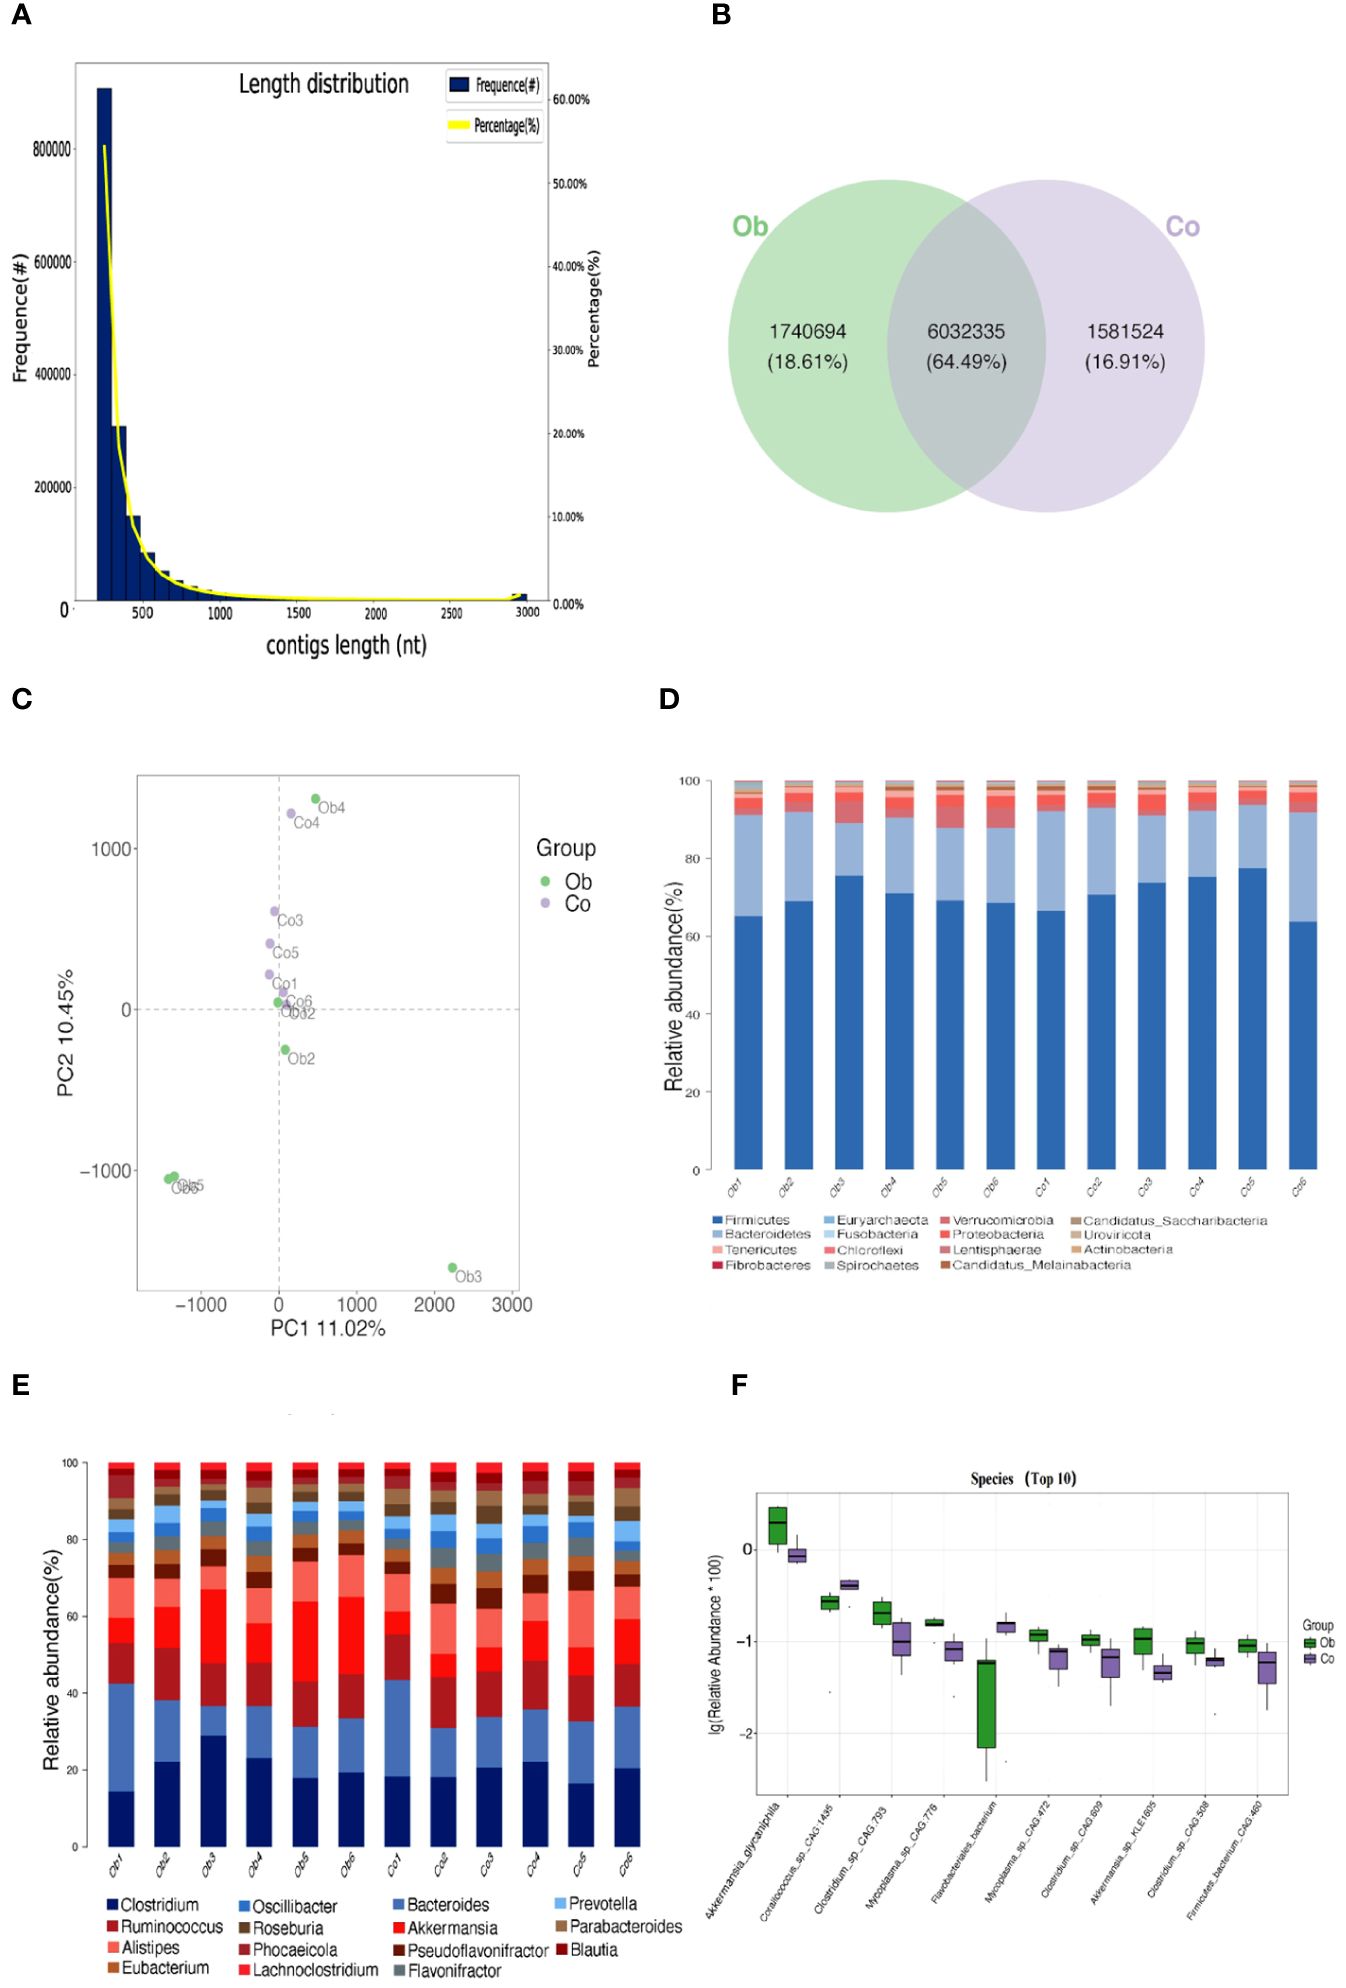
Figure 3 Gene number prediction and microbial differences analysis between the two groups. (A) Statistical plot of unigene length distribution. The first vertical axis Frequence (#) represents the number of genes in the gene catalog; the second vertical axis Percentage (%) represents the percentage of genes in the gene catalog; and the horizontal axis represents the length of the genes in the gene catalog. (B) Venn diagram (Petal plot) analysis of the differences in the number of genes. (C) PCA analysis of the relationship between gene clusters. The horizontal and vertical axes represent the two eigenvalues that maximally reflect the variance. Each point in the figure represents a sample, the same color represents the same group, and similar samples are clustered together. (D, E) Significant differences at the phylum and genus levels, respectively. Columns represent samples, and different colors represent different annotation information. A cluster plot of sample similarity. Branch points represent different samples, different colors represent different groups, and the closer the branches, the more similar the samples. (F) Box plots showing significantly different species. The horizontal axis is sample grouping. The relative abundance of the corresponding species is shown longitudinally.
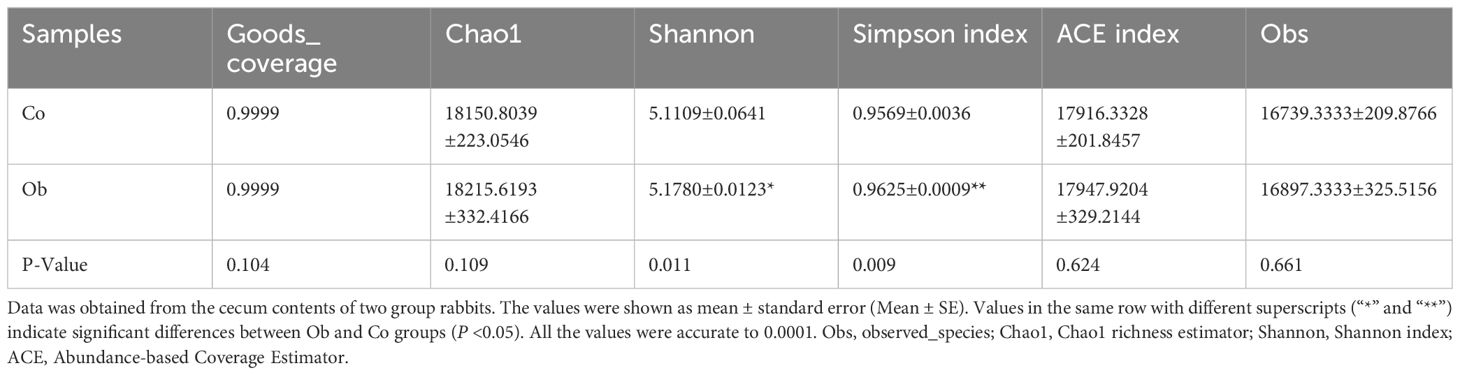
Table 2 Comparative analysis of microbial diversity between the two groups.
3.3 Differences in gut metabolites and their function in the cecum of Ob and Co group rabbits
The results of OPLS-DA showed that the values of model evaluation parameters were more than O.5 (R2 = 0.704 and Q2 = 0.62), indicating differences in the metabolites between the two groups, which were subsequently analyzed in accordance with the model conditions, as shown in the Figure 4A. Based on the threshold values |log2 (FC)| >1 and P <0.05 of the metabolites, the top 10 upregulated and downregulated differentially expressed metabolites were obtained (Figure 4B; Table 3). Then, the functional enrichment analysis of differential metabolites between the two groups showed that the upregulated differential metabolites were mainly enriched in glycine, serine, and threonine metabolism and cysteine and methionine metabolism, while the downregulated differential metabolites were mainly enriched in pancreatic cancer, GnRH signaling pathway, Fc gamma R-mediated phagocytosis, phospholipase D signaling pathway, choline metabolism in cancer, fat digestion and absorption, and cancer pathways (Figure 4C). Therefore, these results indicated that the glycine, serine, and threonine metabolism and cysteine and methionine metabolism were important metabolic enrichment pathways in response to hyperlipid metabolism.
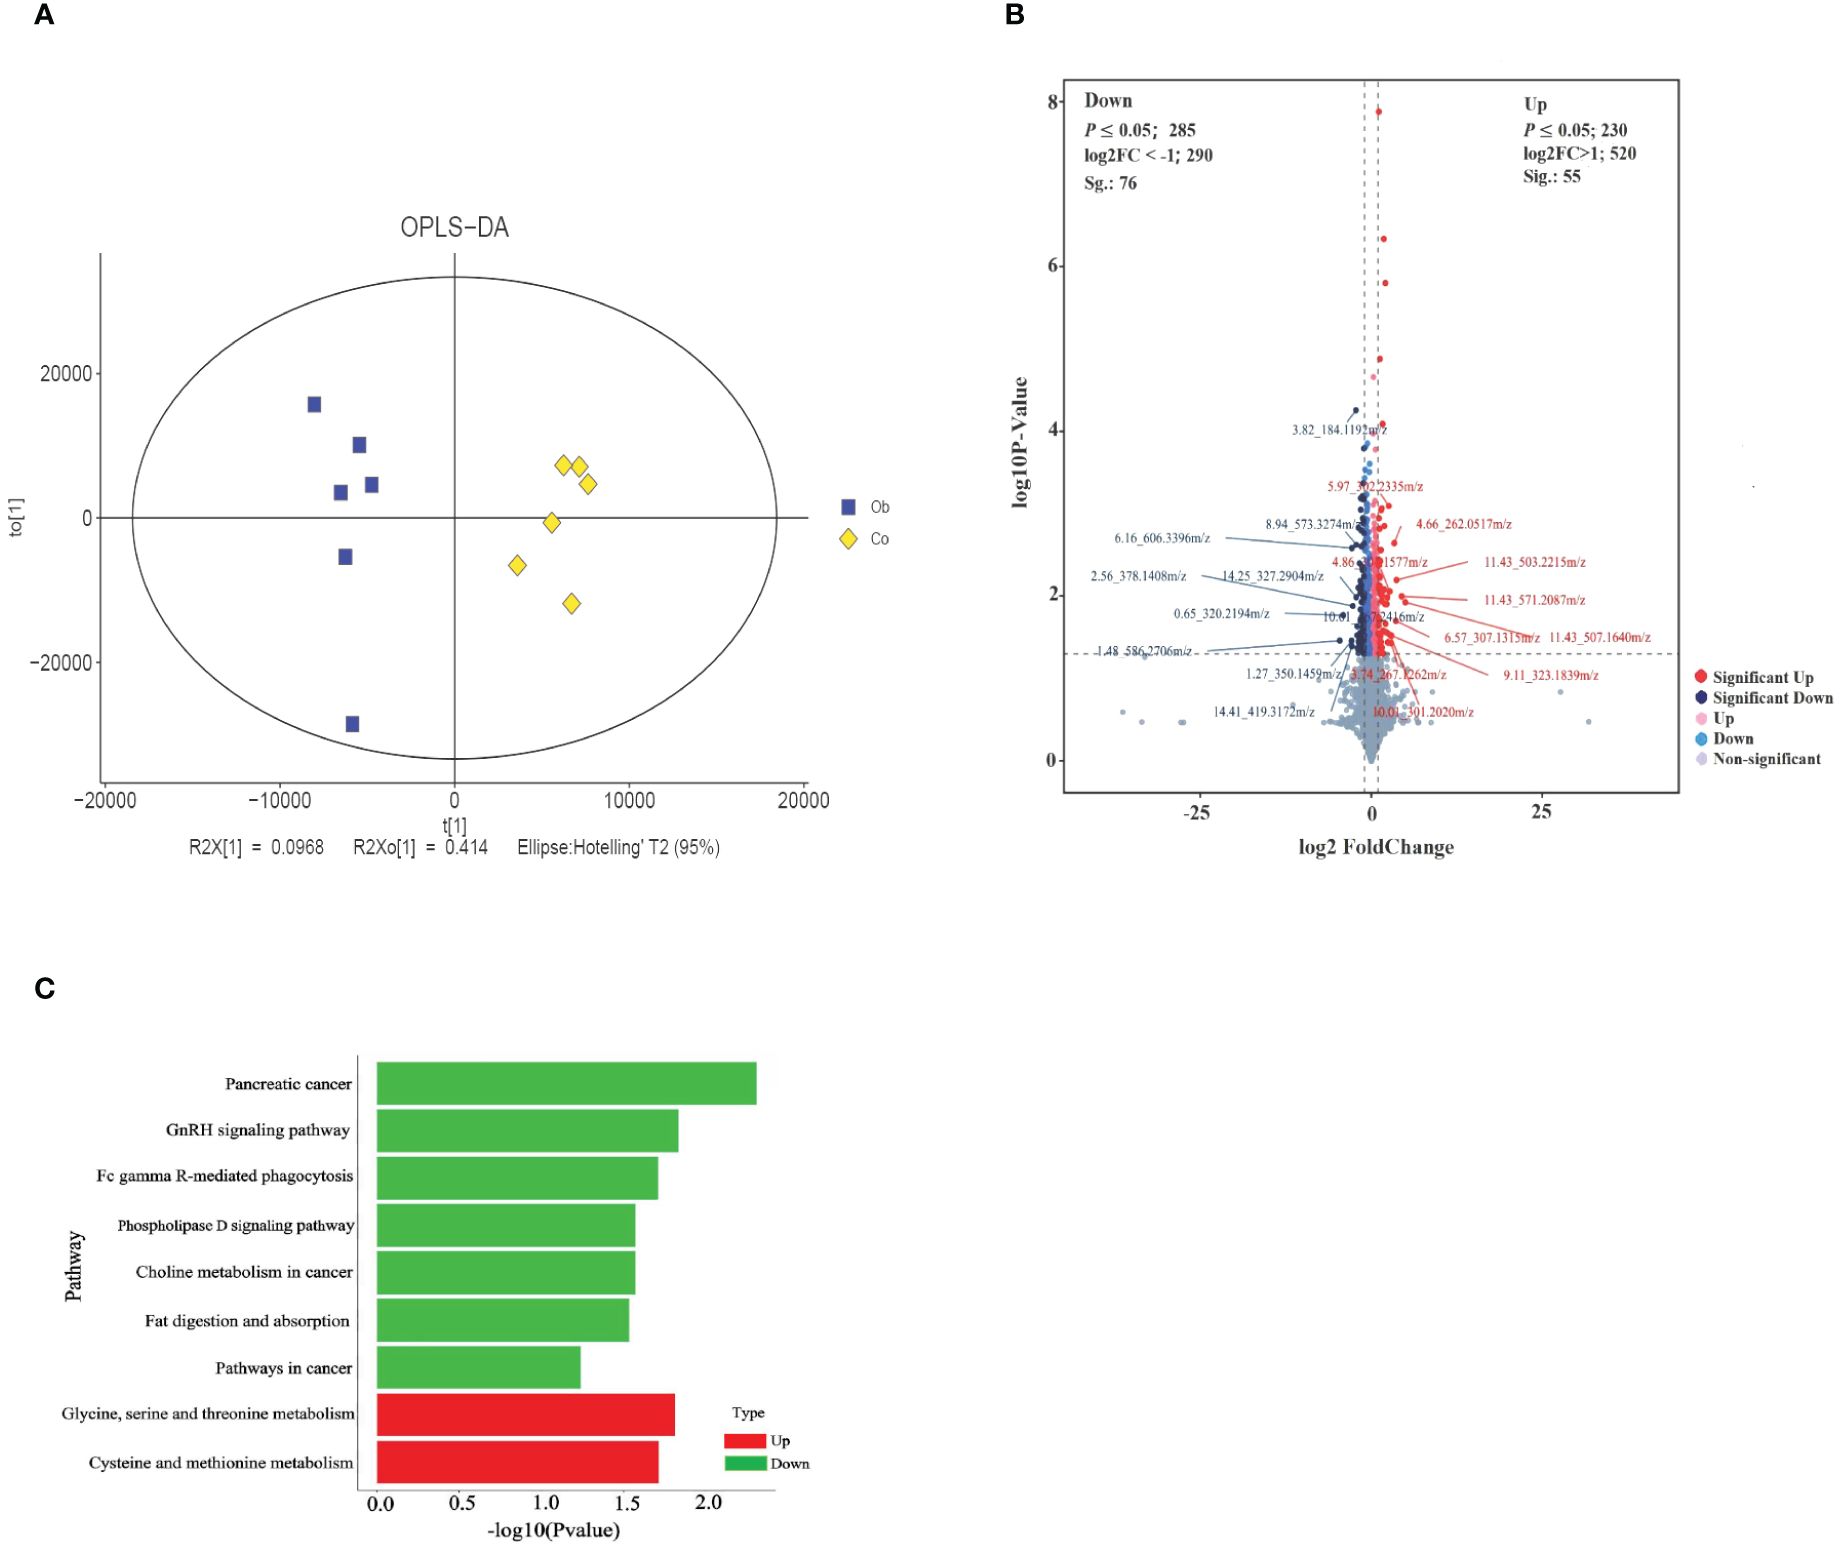
Figure 4 Identification and functional KEGG enrichment analysis of differential metabolites between two groups. (A) OPLS-DA for metabolites between groups. (B) Volcano plot analysis of differential metabolites. Each point in the figure represents a metabolite, the abscissa is the log2 (FC) value of the comparison between the two groups, the ordinate is the -log10 (P-value) value, and the red point is the significantly upregulated differential metabolites (P <0.05, VIP >1, and log2Foldchange>1). Blue dots are significantly downregulated differential metabolites (P <0.05, VIP >1, and log2Foldchange<-1). (C) Function enrichment analysis of differential metabolites.
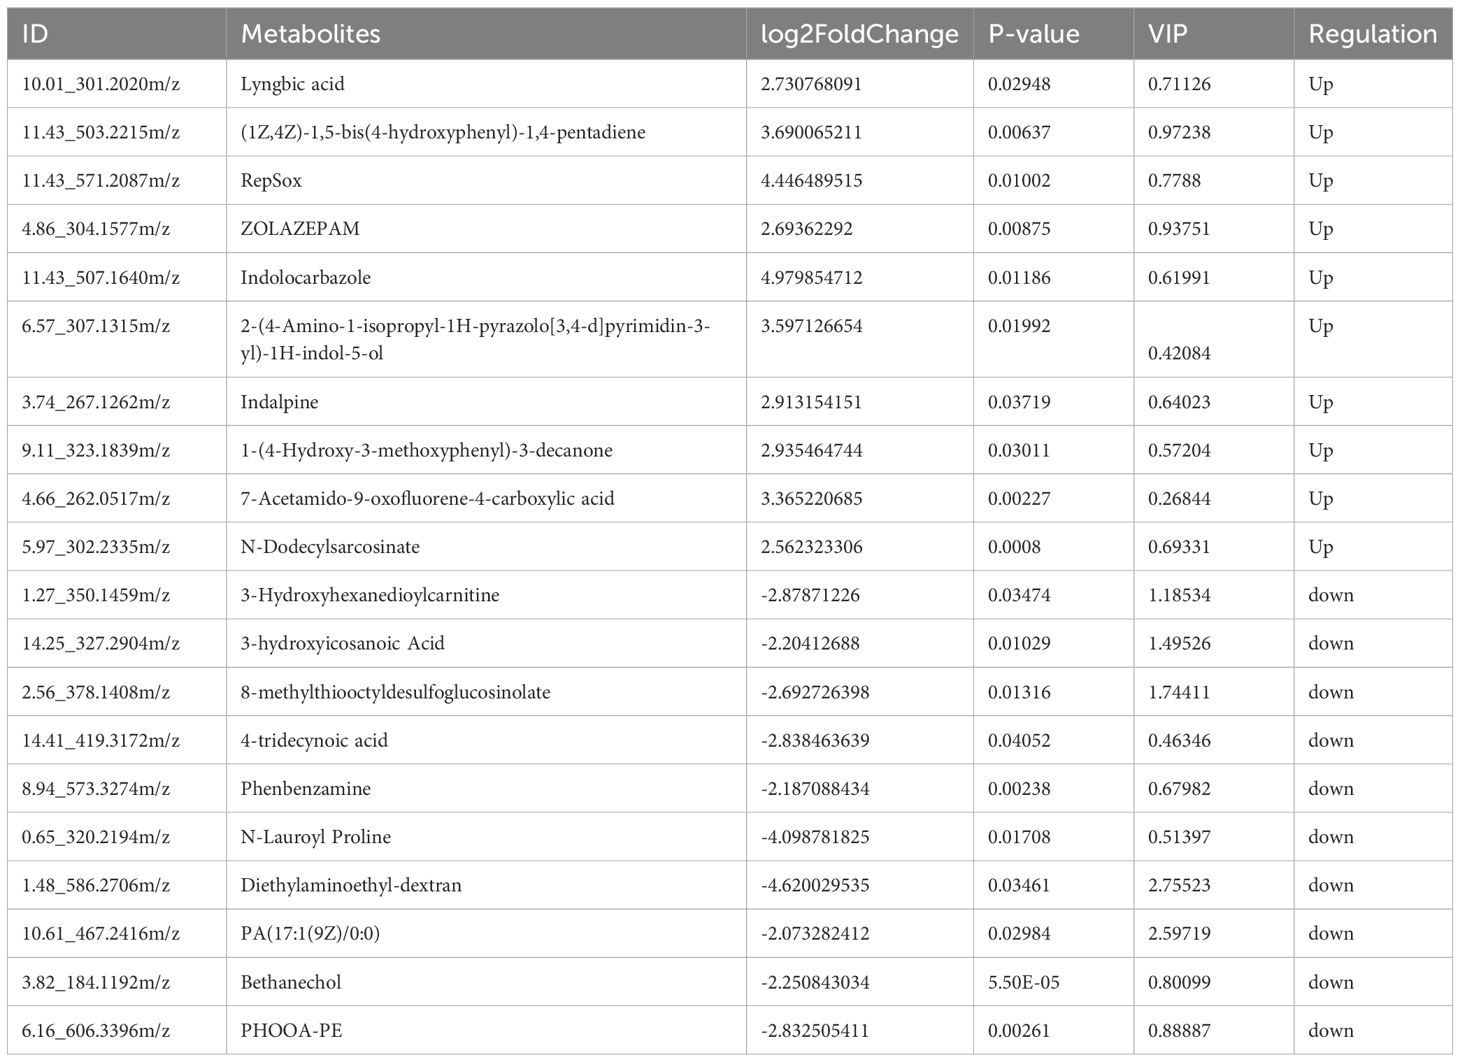
Table 3 Differential metabolites between the two groups.
3.4 Differential host gene analysis of cecal tissues between the two groups
The transcriptomic sequencing of the two groups of cecal samples showed that the effective data amount of each sample was distributed in 6.86-7.38 G, which contained the Q30 base (distributed in 93.99-94.38%) and average GC content (53.22%). Each sample was aligned to the reference genome (GCF_009806435.1) with an alignment rate of 82.29-88.83%. It was found that the number of coding genes in each sample ranged from 15,554 to 16,056. The main transcriptional sequencing information statistics were shown in the Supplementary Table S2. By comparing the expression levels of genes between the two groups, a total of 15,963 differentially expressed genes (DEGs) were found, including 190 significant DEGs (66 upregulated and 124 downregulated), as shown in Figure 5A. Then, twenty highly significant differential genes were selected for heat map analysis, as shown in Figure 5B. GO enrichment analysis showed the enrichment of these DEGs in the following GO terms: biological processes, including immune response, B cell activation, positive regulation of T cell proliferation, cellular response to interleukin-4, and T cell co-stimulation; cellular components, including external side of plasma membrane, phagocytic cup, extracellular space, brush border membrane, lysosome, extracellular region, and transcription elongation factor complex; molecular functions, including tumor necrosis factor receptor binding, cytokine activity, enhancer binding, CCR chemokine receptor binding, proton-exporting ATPase activity, phosphorylative mechanism, chemokine activity, and RNA polymerase II proximal promoter sequence-specific DNA binding, as shown in Figure 5C. KEGG pathway enrichment analysis showed that the upregulated DEGs (P <0.05) were mainly involved in the pathways, including focal adhesion, ECM-receptor interaction, calcium signaling pathway, PI3K-Akt signaling pathway, and Wnt signaling pathway, while the downregulated DEGs (P <0.05) were mainly enriched in the pathways, including DNA replication, cell cycle, NF-kappa B signaling pathway, and T cell receptor signaling pathway, as shown in Figure 5D. Therefore, the results indicated the high-fat diet could cause an increase in metabolic response and a decrease in immune ability in the cecum of rabbits.
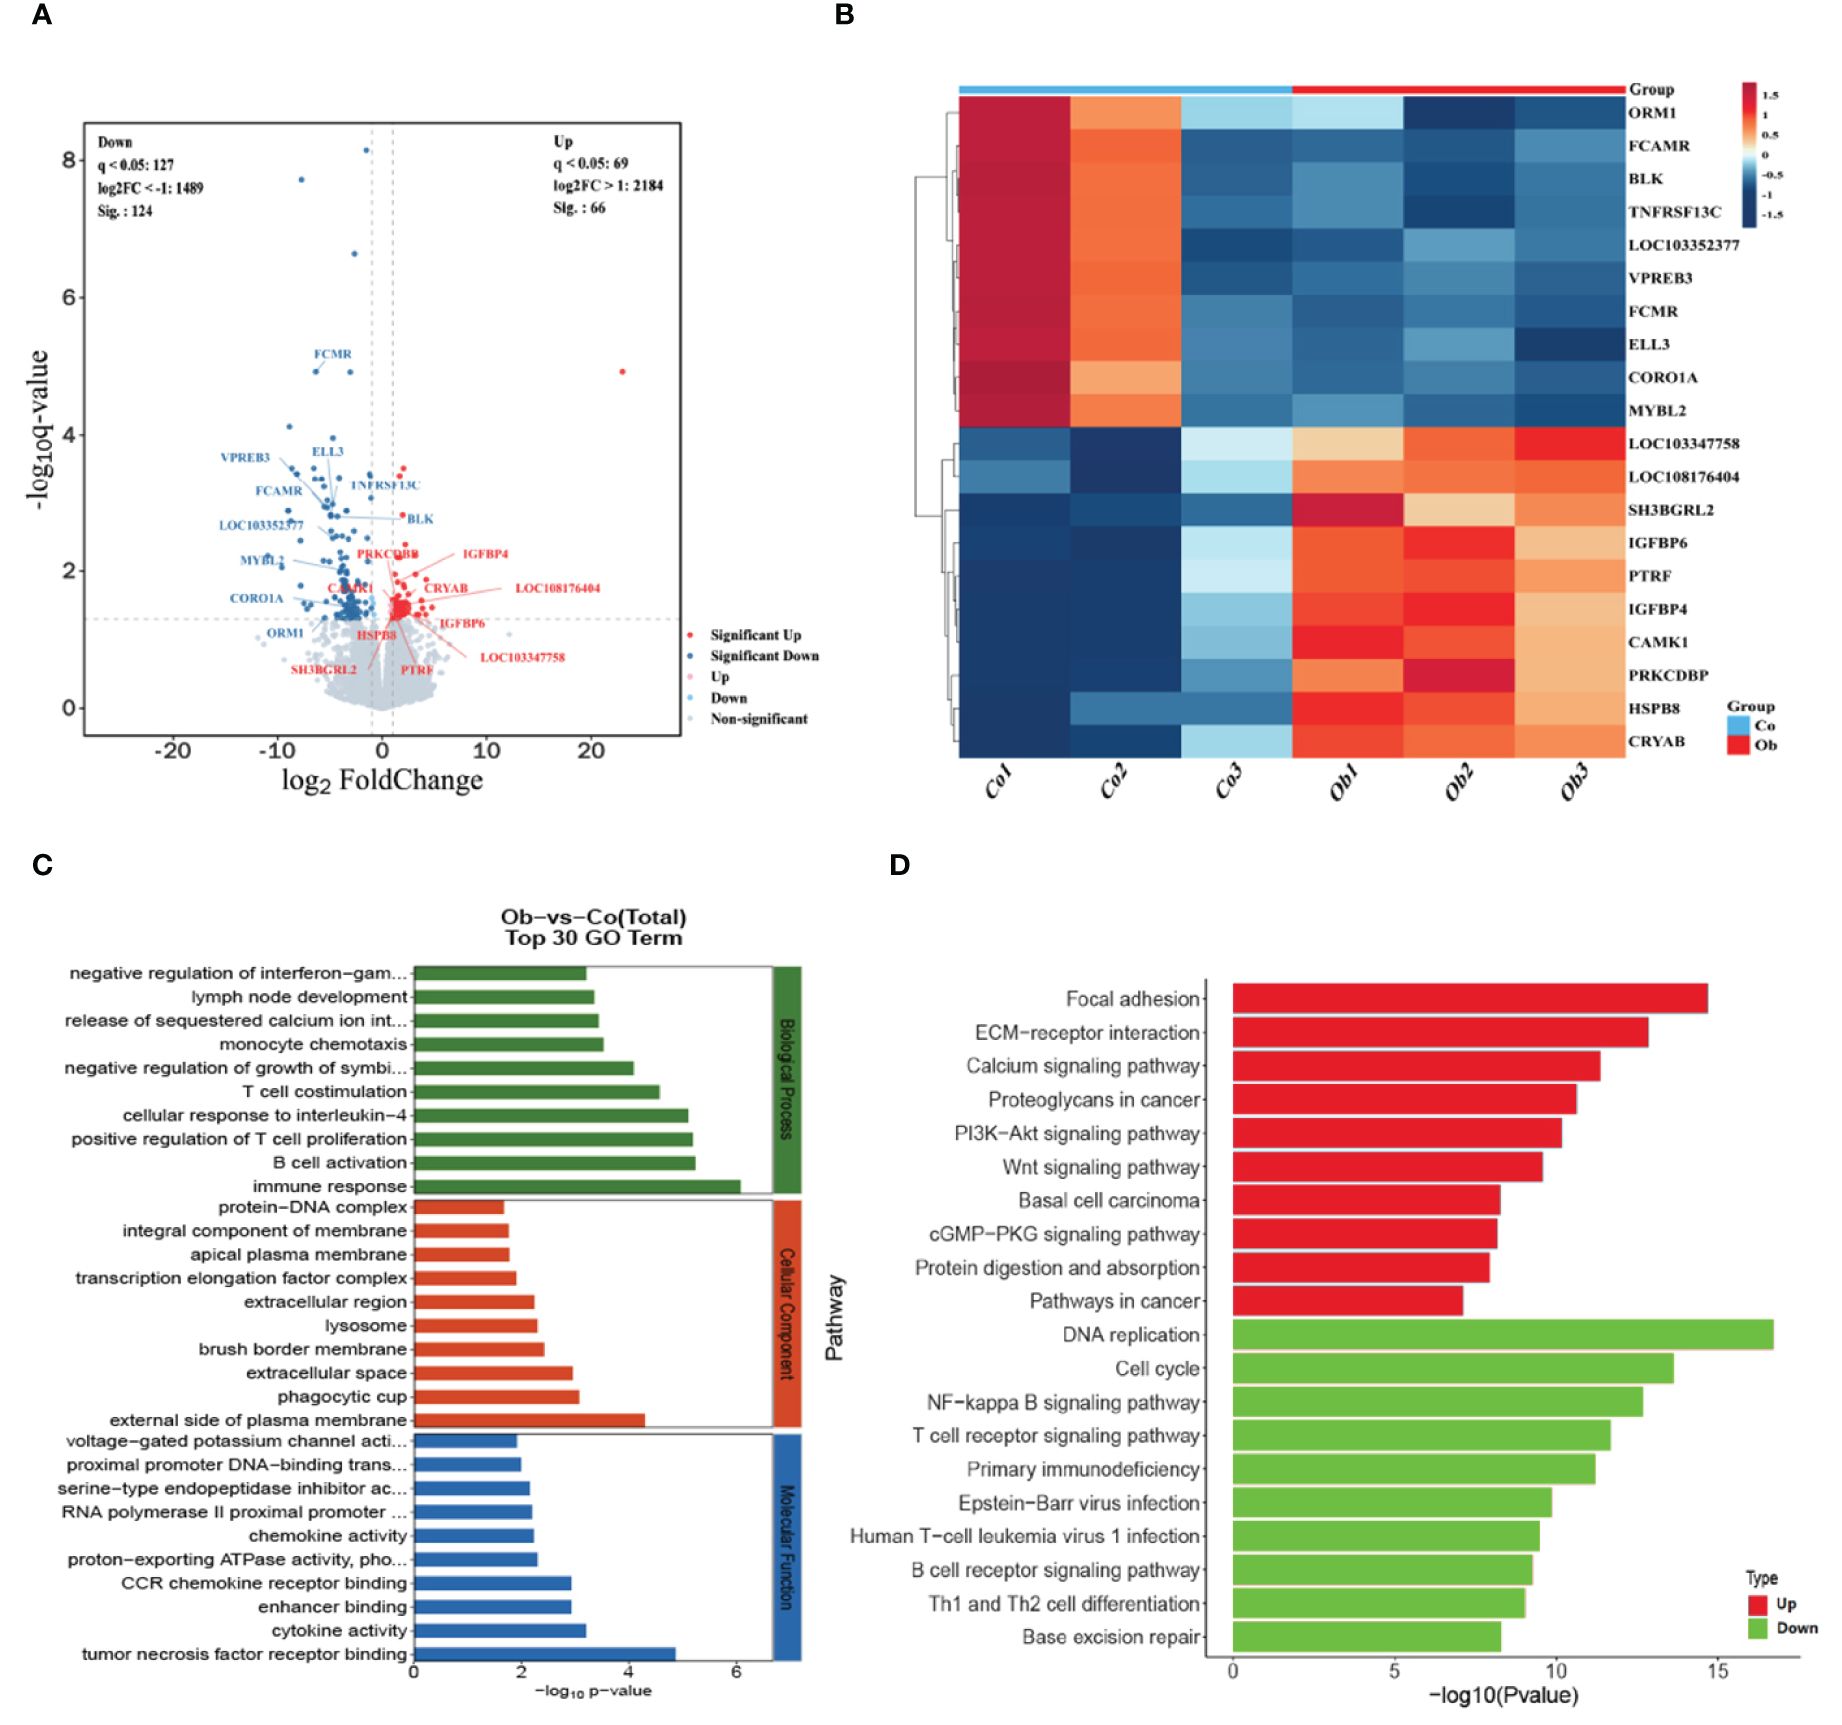
Figure 5 Screening and functional enrichment analysis of differential genes between the two groups. (A) Volcano plot analysis of DEGs between the two groups. The gray color represents the non-significant DEGs, and the red and blue colors represent the significant DEGs. The horizontal axis shows the log2Foldchange, and the vertical axis shows the -log10q-value. (B) Heat map of differential gene expression in different groups. Blue to orange-red represent the transition from weak to strong gene expression. (C, D) The differential genes involved in the top-ranked GO functional enrichment pathway and KEGG pathway.
3.5 Effects of host gene and gut microbiota interaction on gut metabolites in rabbit cecal tissues
Pearson correlation analysis was performed to construct the correlation expression matrix using the top 20 differential genes, metabolites, and microbiota between the two groups (Supplementary Figures S1A, B). The correlation analysis between genes and metabolites showed that the genes, including SH3BGRL2, LOC108176404, LOC103347758, IGFBP4, IGFBP6, HSPB8, PRKCDBP, CRYAB, PTRF, and CAMK1, were positively correlated with the metabolites, including triethylamine, (11S,12S,13S)-epoxy-hydrox yoctadeca-cis-9-cis-15-dien-1-oic acid, 12 (13)Ep-9-KODE, tsibulin 2, 5-heptyltetrahydro-2-oxo-3-furancarboxylic acid, theaspirane, tanacetol A (11S) -11-methyl-15,17-bis(oxidanyl)-12-oxabicyclo[12.4.0]octadeca-1 (18),2,14,16-tetraene-7,13-dione, and alpha-D-Xylopyranos yl-(1->6)-beta-D-glucopyranosyl-(1->4)-D-glucose) and negatively correlated with the other selected metabolites. Similarly, ELL3, FCAMR, MYBL2, TNFRSF13C, VPREB3, BLK, ORM1, LOC103352377, CORO1A, and FCMR genes were positively correlated with glycerophosphoglycerol, shikimic acid, pyridoxine, lucerastat, 3,5-dihydroxycinnamic acid, and cndac and negatively correlated with the other metabolites. Importantly, (R)-methylpiperidine-2-carboxylic acid, 3’-ketolactose, O-succinyl-L-homoserine, stearoylethanolamide, and N-acetyl-L-aspartic acid were negatively correlated with the selected DEGs. The correlation analysis between microorganisms and metabolites showed that Monoglobus_pectinilyticus, Corallococcus_sp._CAG:1435, Coprobacter_secundus, and Flavobacteriales_bacterium were negatively correlated with tanacetol A, (11S)-11-methyl-15,17-bis(oxidanyl)-12-oxabicyclo[12.4.0]octadeca-1 (18),2,14,16-Tetraene-7,13-dione, 5-Heptyltetrahydro-2-oxo-3-furancarboxylic acid, triethylamine, (11S,12S,13S)-hydroxyoctadeca-cis-9-cis-15-dien-1-oic acid, 12 (13) Ep-9-KODE, theaspirane, and Tsibulin 2 and positively correlated with the other metabolites. On the contrary, the other differential gut microbiota, including Eubacterium_sp._CAG:180, Akkermansia_SP._BIOM-A60, Akkermansia_sp._KLE1605, Akkermansia_glycaniphila, etc., were positively correlated with the differential metabolites, including tanacetol A, (11S)-11-methyl-15,17-bis(oxidanyl)-12-oxabicyclo[12.4.0]octadeca-1 (18),2,14, 16-Tetraene-7,13-dione, 5-Heptyltetrahydro-2-oxo-3-furancarboxylic acid, triethylamine, (11S,12S,13S)-hydroxyoctadeca-cis-9-cis-15-dien-1-oic acid, 12 (13)Ep-9-KODE, theaspirane and tsibulin 2 and negatively correlated with stearoylethanolamide, shikimic acid, cndac, lucerastat, and glycerophosphoglycerol. Furthermore, the correlation network analysis (Figure 6) among the DEGs, differential metabolites, and microbiota showed that HSPB8, LOC103347758, CRYAB, LOC108176404, PTRF, IGFBP6, CAMK1, PRKCDBP, SH3BGRL2, and IGFBP4 genes were highly correlated with the gut microbiota, including Corallococcus_sp._CAG:1435, Mycoplasma_sp._CAG:472, Flavobacteriales_bacterium, Clostridium_sp._CAG:793, and Akkermansia_glycaniphila, through the metabolites, including (11S,12S,13S)-Epoxy-hydroxyoctadeca-cis-9-cis-15-dien-1-oic acid, lucerastat, 5-Heptyltetrahydro-2-oxo-3-furancarboxylic acid, Cndac, and Tsibulin 2. The details of this network diagram are shown in Table 4. Therefore, these results indicated that the interactions between gut microbiota and host genes played an important role in regulating lipid degradation in the cecum of rabbits.
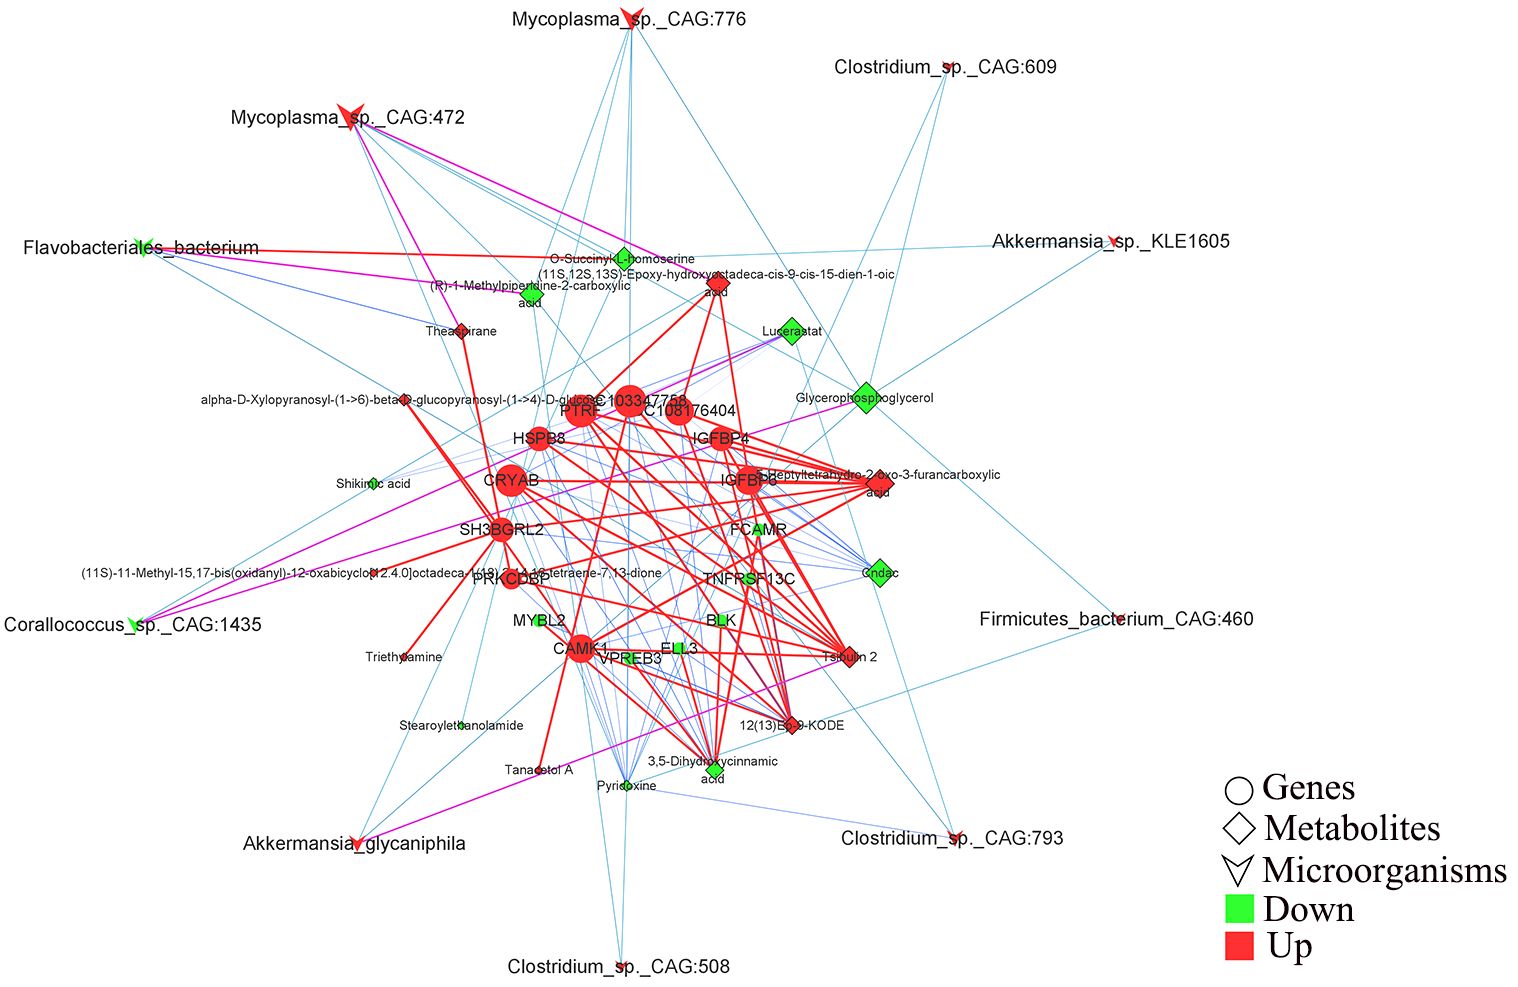
Figure 6 Correlation analysis of the host differential genes, differential metabolites and differential microorganisms for constructing the combine network. The circles, prisms, and swords represent the selected genes, metabolites, and microorganisms, respectively. Red and green represent that the mean expression level of this parameter between Co and Ob is increased and decreased, respectively. The changes of the line from blue to red respectively represents the weak to strong correlation tendency between the two parameter.
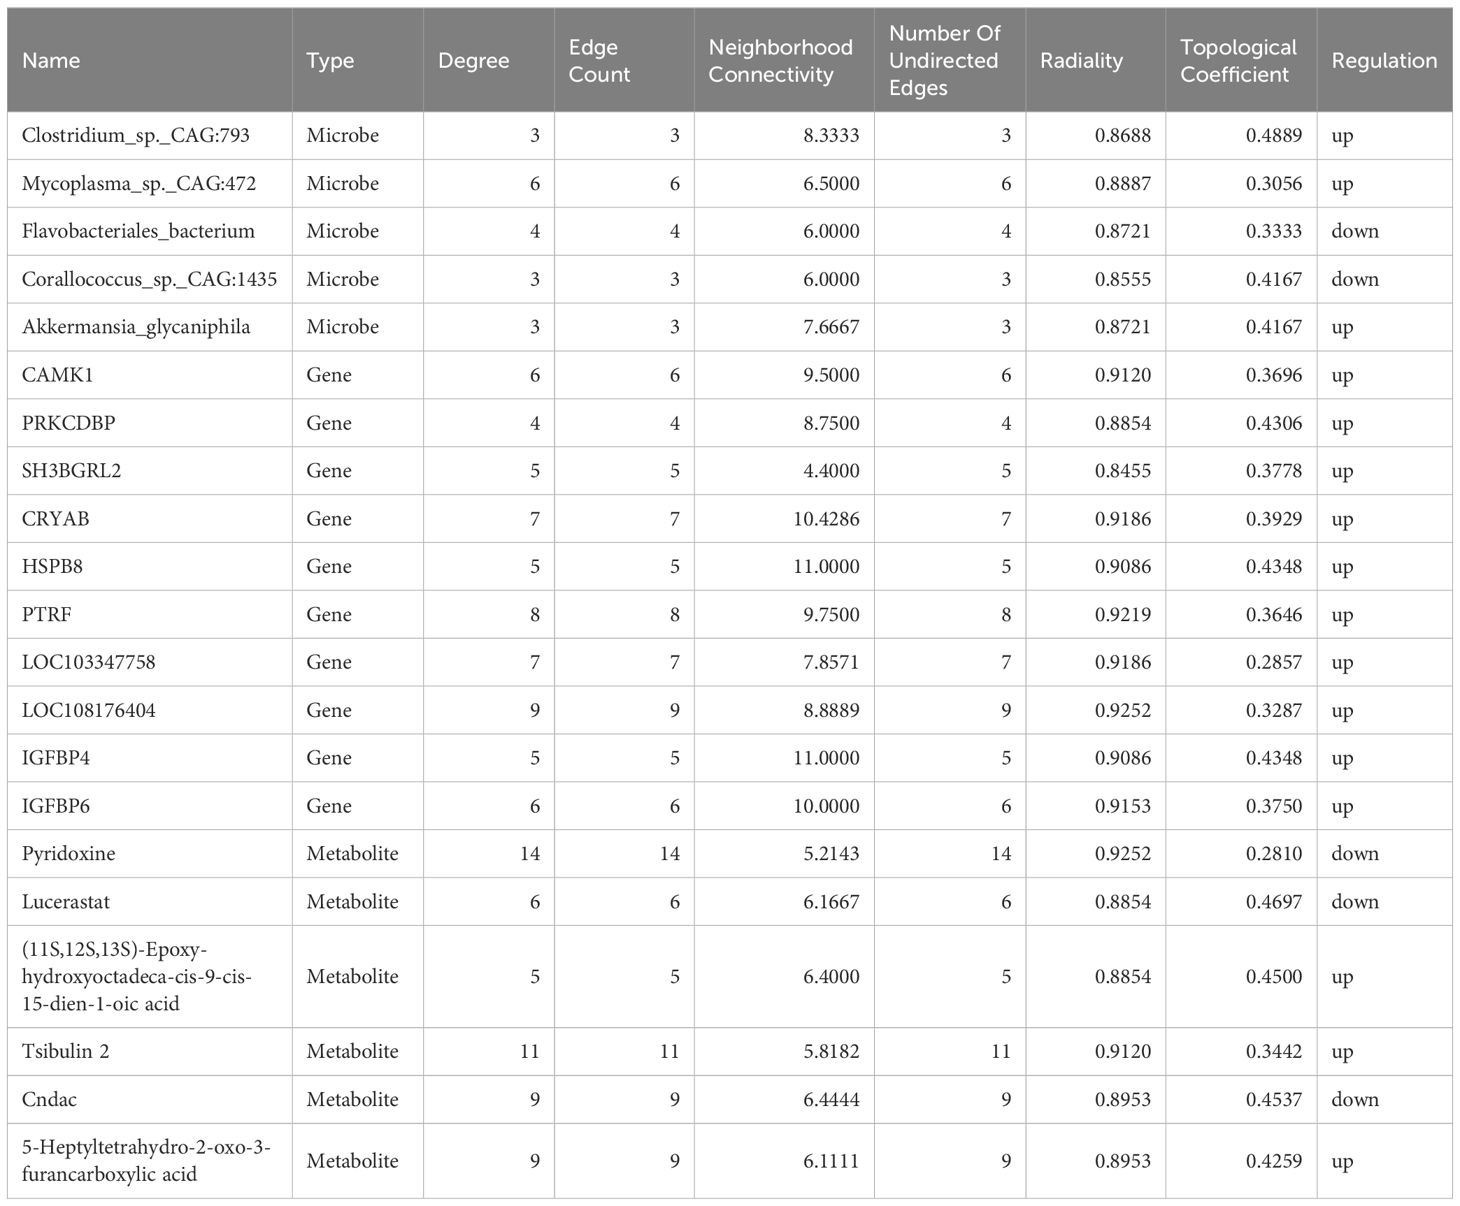
Table 4 Information on the expression parameters of key genes, microorganisms and metabolites in the correlation network graph.
4 Discussion
The high-calorie eating habit is an important factor in obesity (Castro-Barquero et al., 2020; Hemmer et al., 2021). A previous study found that a high-fat diet could decrease the villi length of the small intestine and colon in 12-month-old female mice, resulting in impaired epithelial barrier function (Xie et al., 2020). Similarly, the high-fat diet can also increase the pro-inflammatory gut microbiota, directly affecting the pH value in the intestinal environment, promoting intestinal permeability, and enhancing the lipopolysaccharide levels in the process of circulating metabolism (Beam et al., 2021). The high-fat diet can cause an imbalance of intestinal immune regulation, which results in the infiltration of toxic microbial metabolites, causing systemic inflammation (Malesza et al., 2021). Clinical studies have also shown that plasma cells and acidic granulocytes, as inherent immune cells of the human body, participate in the inflammatory process of body tissues and actively respond to regulating the immune metabolism caused by lipid metabolism (D'Souza and Bhattacharya, 2019; Li et al., 2021). Eosinophils can secrete a large number of anti-inflammatory factors, balance the immune homeostasis of the intestinal mucosal layer, and promote the formation of intestinal mucosal villi (Li et al., 2023). The current study also showed that the short-term high-fat diet increased body weight, kidney fat, and intestinal fat in rabbits. The pathological diagnosis showed that there were abundant plasma cells and acidic granulocytes in the mucous membrane of the cecum intestinal epithelium, suggesting changes in the homeostasis and immune environment in rabbit cecum. Previous studies indicated that the diversity of gut microbiota in obese patients was lower than that the normal healthy people, which affected the production of metabolites and expression level of host intestinal genes (Amabebe et al., 2020; Zhou et al., 2020). Particularly, Bacteroidetes and Firmicutes in the gut microbiota of obese people can promote the absorption of excess energy, and their relative abundances are closely related to intestinal metabolism (Turnbaugh et al., 2006). The Firmicutes to Bacteroidetes (F/B) ratio is considered a marker of obesity (Grigor'eva, 2020). In addition, Blautia, Romboutsia, Ruminococcus2, Clostridium sensu stricto, and Dorea genera were positively correlated with the serum indices of obese people, such as low-density lipoprotein, triglyceride, and total cholesterol, while the genera Bacteroides, Roseburia, Butyricicoccus, Alistipes, Parasutterella, Parabacteroides, and Clostridium IV were negatively correlated with these serum indices (Zeng et al., 2019). Other studies have shown that Akkermansia muciniphila, which colonizes the intestinal mucosal layer in humans and rodents, plays a vital role in maintaining the integrity of the intestinal mucosal layer and intestinal and triglyceride concentration in obese individuals (Parks et al., 2013; Reunanen et al., 2015). The current study found an increase in the relative abundances of Clostridium_sp. (Clostridium_sp._CAG:793/609/508), Akkermansia_sp._KLE1605, and Firmicutes_bacterium_CAG:460 in the Ob rabbits. Therefore, it was speculated that these changes in gut microbiota induced by a high-fat diet might indirectly participate in lipid metabolism. Studies have found that a high-fat diet could disrupt the interaction between the local intestinal mucosal immune system and the gut microbiota, resulting in the imbalance of the composition of gut microbiota, especially increasing the number of Gram-negative bacteria. Gram-negative bacteria can produce lipopolysaccharides that interact with the CD14/TLR4 complex of intestinal epithelial cells, activating the innate immune system (Li et al., 2022). Furthermore, this activation causes persistent low-level inflammation in the body, leading to the destruction of the mucosal layer and increasing the intestinal epithelial cells permeability. This promotes the entry of intestinal microbial metabolites into the bloodstream, resulting in a vicious cycle of inflammation and microbial imbalance (Ornelas et al., 2022). In the current study, the differential analysis of gut microbiota indicated that the relative abundance of Mycoplasma_sp. (Mycoplasma_sp._CAG:776/472) increased in the cecum of obese rabbits. Therefore, based on the cecum histopathological diagnosis, it was speculated that these bacteria might cause the inherent immune activation of rabbit cecum epithelial cells. A previous study found that the Corallococcus sp. strain was correlated with glucose metabolism in dietary starch and played an important regulatory role in the degradation of crude fiber in the body (Ye et al., 2022). The cecum of rabbits is an important place for crude fiber digestion. The increase in lipids in a high-fat diet increases the relative abundance of lipid metabolism-related microbiota. Therefore, it was suggested that the decline in the relative abundance of Corallococcus_sp._CAG:1435 and Flavobacteriales_bacterium was correlated with the degradation and digestion of crude fiber in the cecum.
The fermentation of nutrients and secondary metabolites by gut microbiota directly affects immunity, metabolic homeostasis, and lipid accumulation in intestinal epithelial cells. Previous studies have shown that the high-fat diet-induced obese mice exhibit altered gut microbiota and metabolic pathways, especially the changes in the relative abundance of Firmicutes, which can influence the production of metabolites, such as serum inositol, tyrosine, and glycine, and upregulate the metabolic pathways, including glycine, serine and threonine metabolism and cysteine and methionine metabolism (Jo et al., 2021). Similarly, it was also found that a high-content DHA diet could alleviate metabolic disorders in obese mice through key metabolic pathways of gut microbiota, including glycerolipid metabolism and glyoxylate and dicarboxylate metabolism (Zhang et al., 2022). In addition, the abnormal amino acid metabolism might be an important factor causing inflammation in the body. The serum levels of histidine and arginine were negatively correlated with inflammation and oxidative stress in obese women as compared to non-obese women (Niu et al., 2012). The plasma level of glycine was lower in obese patients and positively correlated with insulin sensitivity (Adeva-Andany et al., 2018). In this study, glycine, serine, and threonine metabolism and cysteine and methionine metabolism pathways were found to be the main pathways enriched by metabolites in the cecum of obese rabbits. This suggested that the metabolism relationship between the bacteria and the host was more inclined to strengthen the process of lipid metabolism so as to maintain the normal metabolic function in the cecum.
Adipose tissue is an endocrine organ that can secrete anti-inflammatory factors (Adiponectin) and pro-inflammatory factors in different parts, which can cause inflammatory bowel disease (Johnson and Loftus, 2021). The difference in gut microbiota and host genes induced by high lipids is probably inclined to the pathological process of chronic inflammatory response and metabolic disorders. A study showed that PI3K)/Akt/NF-κB signaling pathways were an important pathway in regulating cell proliferation and apoptosis (Huang et al., 2018). In obesity, fatty acid overload in adipose tissue can cause ectopic lipid deposition. The PI3K/AKT pathway can be activated to mediate SREBP regulation of fatty acid synthesis and FOXO1 signal pathway for fatty triglyceride lipase (ATGL) regulation of lipolysis, increasing glucose utilization and body fat deposition and reducing insulin resistance caused by obesity (Zhang et al., 2018; Savova et al., 2023). Moreover, the NF-κB signaling pathway can be activated by pro-inflammatory factors, apoptotic mediators, metabolic stress, and chemical agents. The activation NF-κB signaling pathway is associated with the PI3K/AKT signal pathway in insulin resistance and pancreatic beta cell dysfunction in metabolic syndrome (Malle et al., 2015; Sabir et al., 2019; Capece et al., 2022). Similarly, the mechanism of insulin resistance stems from the interaction between gut microbiota and host genes. Previous studies reported that the lipid diet-induced gut microbiota, including Parabacteroides distasonis, Bacteroides spp., and Lactobacillus spp., could reduce the NF-κB gene expression level as well as the levels of pro-inflammatory Th17 cells in the gut tissues (Ang et al., 2020; Brīvība et al., 2023). The current study found that the cecal host genes involved in the calcium signaling pathway and PI3K-Akt signaling pathway were upregulated, while those involved in the NF-κB signaling pathway and T cell receptor signaling pathway were downregulated. This suggested that the microbial metabolites might play a regulatory role in the inflammatory signaling pathway.
Insulin-like growth factors (IGFs) and IGF-binding proteins (IGFBPs) play an important role in the development of obesity. It was found that IGFBP4, as a member of the IGFBP family that regulates the biological activity of IGFs, could induce adipose tissue expansion and enhance lipid deposition in adipose tissue around the groin and gonads in mice (Maridas et al., 2017). In a study of obese children, the serum expression level of IGFBP4 was higher than that of IGFBP6, which was positively correlated with the indices of apelin, cholecystockinin, glucagon-like peptide-1, and leptin receptors (Czogała et al., 2021). A study of gut microbiota showed that Akkermansia glycaniphila exhibited a glyco-based hydrolase gene, which could cleave specific glycan bonds in the obese human gastrointestinal tract (Glover et al., 2022). The current study found that the expression levels of IGFBP4 and IGFBP6 were upregulated in the cecum tissues of obese rabbits. This suggested that Clostridium_sp._CAG:793 and Akkermansia glycaniphila might be involved in the metabolic pathway of IGFBP6 during the regulation of cecum metabolism in obese rabbits. A previous study found that CaMK1, a class of protein kinases, could regulate protein phosphorylation by binding to Ca (2+)/calmodulin, and the polymorphism in the calmodulin-dependent kinase isomer D (CaMK1D) gene was associated with the development of diabetes as well as improved insulin sensitivity and glycemic control in obese mouse model (Fromont et al., 2020). The polymorphisms in the PRKCDBP gene can be used as a transcriptional target for TNF-α to cause intestinal inflammatory diseases (Kim et al., 2015). In the current study, the interaction between the upregulation of CaMK1 and PRKCDBP genes and these microbes (Mycoplasma_sp._CAG:472, Clostridium_sp._CAG:793, and Akkermansia glycaniphila) in the cecum were also highly correlated in the correlation network, suggesting a key regulatory function of lipid metabolism and the immune response in the mucosal layer of the cecum. Different dietary habits can affect the changes of intestinal flora. Previous study have shown that high-fat diet can increase the proportion of intestinal microbes (Firmicutes, Prevotella, and Methanobrevibacter to enhance fat metabolism and reduce the proportion of beneficial microorganisms, such as Bacteroides. Lactobacillus, and Akkermansia (Amabebe et al., 2020). However, gastrointestinal microbes of different intestinal segments in cattle, sheep, and panda have existed the differences for digesting crude fiber diet, such as Bacteroidetes, Firmicutes and Proteobacteria, Streptococcus, Clostridium, Escherichia (Paradiso et al., 2021; Deng et al., 2023; Long et al., 2024). In this study, three key microbial species in cecum (Mycoplasma_sp._CAG:472, Clostridium_sp._CAG:793, and Akkermansia glycaniphila) were inconsistent with the above research results. Its reasons may be related to differences in gut microbes among species, the selection of intestinal samples, and food-borne microbial characteristics. Besides, this study also found that two rabbit-specific genes (LOC103347758 and LOC108176404) had high weight coefficients in the correlation network, which might play an important role in regulating the metabolism of rabbit gut microbiota. However, there were still several limitations in this study, which failed to conduct in-depth analysis of intestinal flora differences, cecal metabolite formation mechanism, and functional verification using gene knockout technology for comprehensively analyze the regulatory effects of rabbit intestinal flora and gene interaction on lipid metabolism, so as to provide experimental basis for the treatment of human obesity in the future.
Data availability statement
The data presented in the study are deposited in the NCBI repository, accession number PRJNA1119243 and PRJNA1119171.
Ethics statement
The animal study was approved by the ethical standards of the Animal experimental ethical inspection form of Guizhou Medical University. The study was conducted in accordance with the local legislation and institutional requirements. This study was approved by and conducted in strict accordance with the ethical standards of the Animal experimental ethical inspection form of Guizhou Medical University, Guizhou, China (No: 2201379).
Author contributions
YL: Writing – review & editing, Writing – original draft, Project administration, Methodology, Conceptualization. XQ: Writing – review & editing, Methodology, Funding acquisition, Conceptualization. QW: Writing – review & editing, Methodology, Funding acquisition, Conceptualization. YH: Writing – review & editing, Methodology, Funding acquisition, Conceptualization. ZL: Writing – review & editing, Software. XC: Writing – review & editing, Software. LW: Writing – review & editing, Project administration, Methodology, Conceptualization.
Funding
The author(s) declare financial support was received for the research, authorship, and/or publication of this article. This research was funded by research initiating fund of Guizhou Medical University, grant number RN2022−GK017 the research project (TJ23059) and Natural Science Foundation of China (32360154).
Acknowledgments
We thank Junhua Chen from the School of Pharmacy and the Laboratory Animal Center of Guizhou Medical University for their scientific research support.
Conflict of interest
The authors declare that the research was conducted in the absence of any commercial or financial relationships that could be construed as a potential conflict of interest.
Publisher’s note
All claims expressed in this article are solely those of the authors and do not necessarily represent those of their affiliated organizations, or those of the publisher, the editors and the reviewers. Any product that may be evaluated in this article, or claim that may be made by its manufacturer, is not guaranteed or endorsed by the publisher.
Supplementary material
The Supplementary Material for this article can be found online at: https://www.frontiersin.org/articles/10.3389/fcimb.2024.1407051/full#supplementary-material
Supplementary Figure 1 | Correlation analysis of host differential genes, differential metabolites and differential microorganisms. (A, B) Red and blue dots represents the strong and weak relationships between the two corresponding parameters on the axis, respectively.
References
Abdel-Kafy, E. M., Kamel, K. I., Severgnini, M. (2023). Diversity and co-occurrence pattern analysis of cecal and jejunal microbiota in two rabbit breeds. Animals 13, 2294. doi: 10.3390/ani13142294
Adeva-Andany, M., Souto-Adeva, G., Ameneiros-Rodríguez, E., Fernández-Fernández, C., Donapetry-García, C., Domínguez-Montero, A. (2018). Insulin resistance and glycine metabolism in humans. Amino Acids 50, 11–27. doi: 10.1007/s00726-017-2508-0
Amabebe, E., Robert, F. O., Agbalalah, T., Orubu, E. S. F. (2020). Microbial dysbiosis-induced obesity: role of gut microbiota in homoeostasis of energy metabolism. Br. J. Nutr. 123, 1127–1137. doi: 10.1017/S0007114520000380
Ang, Q. Y., Alexander, M., Newman, J. C., Tian, Y., Cai, J., Upadhyay, V., et al. (2020). Ketogenic diets alter the gut microbiome resulting in decreased intestinal th17 cells. Cell 181, 1263–1275.e16. doi: 10.1016/j.cell.2020.04.027
Beam, A., Clinger, E., Hao, L. (2021). Effect of diet and dietary components on the composition of the gut microbiota. Nutrients 13, 2795. doi: 10.3390/nu13082795
Bisanz, J. E., Upadhyay, V., Turnbaugh, J. A., Ly, K., Turnbaugh, P. J. (2019). Meta-analysis reveals reproducible gut microbiome alterations in response to a high-fat diet. Cell Host Microbe 26, 265–272.e4. doi: 10.1016/j.chom.2019.06.013
Bodilly, L., Williamson, L., Lahni, P., Alder, M. N. (2023). Obesity Alters cytokine signaling and gut microbiome in septic mice. Innate Immun. 29, 161–170. doi: 10.1177/17534259231205959
Bolger, A. M., Lohse, M., Usadel, B. (2014). Trimmomatic: a flexible trimmer for Illumina sequence data. Bioinformatics 30, 2114–2120. doi: 10.1093/bioinformatics/btu170
Brīvība, M., Silamiķele, L., Kalniņa, I., Silamiķelis, I., Birzniece, L., Ansone, L., et al. (2023). Metformin targets intestinal immune system signaling pathways in a high-fat diet-induced mouse model of obesity and insulin resistance. Front. Endocrinol. (Lausanne) 14. doi: 10.3389/fendo.2023.1232143
Canfora, E. E., Meex, R. C. R., Venema, K., Blaak, E. E. (2019). Gut microbial metabolites in obesity, NAFLD and T2DM. Nature reviews. Nat. Rev. Endocrinol. 15, 261–273. doi: 10.1038/s41574-019-0156-z
Capece, D., Verzella, D., Flati, I., Arboretto, P., Cornice, J., Franzoso, G. (2022). NF-κB: blending metabolism, immunity, and inflammation. Trends Immunol. 43, 757–775. doi: 10.1016/j.it.2022.07.004
Castro-Barquero, S., Ruiz-León, A. M., Sierra-Pérez, M., Estruch, R., Casas, R. (2020). Dietary strategies for metabolic syndrome: A comprehensive review. Nutrients 12, 2983. doi: 10.3390/nu12102983
Chen, K., Lin, Y., Luo, P., Yang, N., Yang, G. (2021). Effect of laparoscopic sleeve gastrectomy on drug pharmacokinetics. Expert Rev. Clin. Pharmacol. 14, 1481–1495. doi: 10.1080/17512433.2021.1997585
Cuevas-Sierra, A., Ramos-Lopez, O., Riezu-Boj, J. I., Milagro, F. I., Martinez, J. A. (2019). Diet, gut microbiota, and obesity: links with host genetics and epigenetics and potential applications. Adv. Nutr. 10, S17–S30. doi: 10.1093/advances/nmy078
Cuomo, P., Capparelli, R., Alifano, M. (2022). Gut microbiota host-gene interaction. Int. J. Mol. Sci. 23, 13717. doi: 10.3390/ijms232213717
Czogała, W., Strojny, W., Tomasik, P., Multanowski, M. B., Wójcik, M., Miklusiak, K., et al. (2021). The insight into insulin-like growth factors and insulin-like growth-factor-binding proteins and metabolic profile in pediatric obesity. Nutrients 13, 2432. doi: 10.3390/nu13072432
D'Souza, L., Bhattacharya, D. (2019). Plasma cells: You are what you eat. Immunol. Rev. 288, 161–177. doi: 10.1111/imr.12732
Dabbou, S., Ferrocino, I., Kovitvadhi, A., Bergagna, S., Dezzuto, D., Schiavone, A., et al. (2019). Bilberry pomace in rabbit nutrition: effects on growth performance, apparent digestibility, caecal traits, bacterial community and antioxidant status. Animal 13, 53–63. doi: 10.1017/S175173111800099X
David, L. A., Maurice, C. F., Carmody, R. N., Gootenberg, D. B., Button, J. E., Wolfe, B. E., et al. (2014). Diet rapidly and reproducibly alters the human gut microbiome. Nature 505, 559–563. doi: 10.1038/nature12820
Deng, F., Wang, C., Li, D., Peng, Y., Deng, L., Zhao, Y., et al. (2023). The unique gut microbiome of giant pandas involved in protein metabolism contributes to the host's dietary adaption to bamboo. Microbiome 11, 180. doi: 10.1186/s40168-023-01603-0
Festi, D., Schiumerini, R., Eusebi, L. H., Marasco, G., Taddia, M., Colecchia, A. (2020). Gut microbiota and metabolic syndrome. Chin. Med. J. 133, 808–816. doi: 10.1097/CM9.0000000000000696
Fromont, C., Atzori, A., Kaur, D., Hashmi, L., Greco, G., Cabanillas, A., et al. (2020). Discovery of highly selective inhibitors of calmodulin-dependent kinases that restore insulin sensitivity in the diet-induced obesity in vivo mouse model. J. Med. Chem. 63, 6784–6801. doi: 10.1021/acs.jmedchem.9b01803
Glover, J. S., Ticer, T. D., Engevik, M. A. (2022). Characterizing the mucin-degrading capacity of the human gut microbiota. Sci. Rep. 12, 8456. doi: 10.1038/s41598-022-11819-z
Grigor'eva, I. N. (2020). Gallstone disease, obesity and the firmicutes/bacteroidetes ratio as a possible biomarker of gut dysbiosis. J. Pers. Med. 11, 13. doi: 10.3390/jpm11010013
Haddish, K., Yun, J. W. (2023). EChinacoside induces UCP1-and ATP-dependent thermogenesis in beige adipocytes via the activation of dopaminergic receptors. J. Microbiol. Biotechnol. 33, 1268–1280. doi: 10.4014/jmb.2306.06041
Hemmer, A., Mareschal, J., Dibner, C., Pralong, J. A., Dorribo, V., Perrig, S., et al. (2021). The effects of shift work on cardio-metabolic diseases and eating patterns. Nutrients 13, 4178. doi: 10.3390/nu13114178
Huang, X., Liu, G., Guo, J., Su, Z. (2018). The PI3K/AKT pathway in obesity and type 2 diabetes. Int. J. Biol. Sci. 14, 1483–1496. doi: 10.7150/ijbs.27173
Hyatt, D., Chen, G. L., Locascio, P. F., Land, M. L., Larimer, F. W., Hauser, L. J. (2010). Prodigal: prokaryotic gene recognition and translation initiation site identification. BMC Bioinf. 11, 119. doi: 10.1186/1471-2105-11-119
Jo, J. K., Seo, S. H., Park, S. E., Kim, H. W., Kim, E. J., Kim, J. S., et al. (2021). Gut microbiome and metabolome profiles associated with high-fat diet in mice. Metabolites 11, 482. doi: 10.3390/metabo11080482
Johnson, A. M., Loftus, E. V. (2021). Obesity in inflammatory bowel disease: A review of its role in the pathogenesis, natural history, and treatment of IBD. Saudi J. Gastroenterol. 27, 183–190. doi: 10.4103/sjg.sjg_30_21
Kim, J. W., Lee, C. K., Kim, H. J., Shim, J. J., Jang, J. Y., Dong, S. H., et al. (2015). Polymorphisms in PRKCDBP, a transcriptional target of TNF-α, are associated with inflammatory bowel disease in Korean. Intestinal Res. 13, 242–249. doi: 10.5217/ir.2015.13.3.242
Li, D., Liu, C. M., Luo, R., Sadakane, K., Lam, T. W. (2015). MEGAHIT: an ultra-fast single-node solution for large and complex metagenomics assembly via succinct de Bruijn graph. Bioinformatics 31, 1674–1676. doi: 10.1093/bioinformatics/btv033
Li, K. P., Yuan, M., Wu, Y. L., Pineda, M., Zhang, C. M., Chen, Y. F., et al. (2022). A high-fat high-fructose diet dysregulates the homeostatic crosstalk between gut microbiome, metabolome, and immunity in an experimental model of obesity. Mol. Nutr. Food Res. 66, e2100950. doi: 10.1002/mnfr.202100950
Li, W. J., Zhao, Y., Gao, Y., Dong, L. L., Wu, Y. F., Chen, Z. H., et al. (2021). Lipid metabolism in asthma: Immune regulation and potential therapeutic target. Cell Immunol. 364, 104341. doi: 10.1016/j.cellimm.2021.104341
Li, Y., Liu, S., Zhou, K., Wang, Y., Chen, Y., Hu, W., et al. (2023). Neuromedin U programs eosinophils to promote mucosal immunity of the small intestine. Science 381, 1189–1196. doi: 10.1126/science.ade4177
Liao, J., Liu, Y., Yao, Y., Zhang, J., Wang, H., Zhao, J., et al. (2023). Clostridium butyricum Strain CCFM1299 Reduces Obesity via Increasing Energy Expenditure and Modulating Host Bile Acid Metabolism. Nutrients 15, 4339. doi: 10.3390/nu15204339
Liu, Y., Zeng, Y., Liu, Y., Wang, X., Chen, Y., Lepp, D., et al. (2022). Regulatory effect of isomaltodextrin on a high-fat diet mouse model with LPS-induced low-grade chronic inflammation. J. Agric. Food Chem. 70, 11258–11273. doi: 10.1021/acs.jafc.2c03391
Long, Y., Xiao, W., Zhao, Y., Yuan, C., Wang, D., Yang, Y., et al. (2024). Effects of Flammulina velutipes mushroom residues on growth performance, apparent digestibility, serum biochemical indicators, rumen fermentation and microbial of Guizhou black goat. Front. Microbiol. 15. doi: 10.3389/fmicb.2024.1347853
Malesza, I. J., Malesza, M., Walkowiak, J., Mussin, N., Walkowiak, D., Aringazina, R., et al. (2021). High-fat, western-style diet, systemic inflammation, and gut microbiota: A narrative review. Cells 10, 3164. doi: 10.3390/cells10113164
Malle, E. K., Zammit, N. W., Walters, S. N., Koay, Y. C., Wu, J., Tan, B. M., et al. (2015). Nuclear factor κB-inducing kinase activation as a mechanism of pancreatic β cell failure in obesity. J. Exp. Med. 212, 1239–1254. doi: 10.1084/jem.20150218
Maridas, D. E., DeMambro, V. E., Le, P. T., Mohan, S., Rosen, C. J. (2017). IGFBP4 is required for adipogenesis and influences the distribution of adipose depots. Endocrinology 158, 3488–3500. doi: 10.1210/en.2017-00248
Milani, C., Duranti, S., Bottacini, F., Casey, E., Turroni, F., Mahony, J., et al. (2017). The first microbial colonizers of the human gut: composition, activities, and health implications of the infant gut microbiota. Microbiol. Mol. Biol. Rev. 81, e00036–e00017. doi: 10.1128/MMBR.00036-17
Neeland, I. J., Ross, R., Després, J. P., Matsuzawa, Y., Yamashita, S., Shai, I., et al. (2019). Visceral and ectopic fat, atherosclerosis, and cardiometabolic disease: a position statement. Lancet Diabetes Endocrinol. 7, 715–725. doi: 10.1016/S2213-8587(19)30084-1
Niu, Y. C., Feng, R. N., Hou, Y., Li, K., Kang, Z., Wang, J., et al. (2012). Histidine and arginine are associated with inflammation and oxidative stress in obese women. Br. J. Nutr. 108, 57–61. doi: 10.1017/S0007114511005289
Ornelas, A., Dowdell, A. S., Lee, J. S., Colgan, S. P. (2022). Microbial metabolite regulation of epithelial cell-cell interactions and barrier function. Cells 11, 944. doi: 10.3390/cells11060944
Paradiso, R., Borriello, G., Bolletti Censi, S., Salzano, A., Cimmino, R., Galiero, G., et al. (2021). Different non-structural carbohydrates/crude proteins (NCS/CP) ratios in diet shape the gastrointestinal microbiota of water buffalo. Vet. Sci. 8, 96. doi: 10.3390/vetsci8060096
Parks, B. W., Nam, E., Org, E., Kostem, E., Norheim, F., Hui, S. T., et al. (2013). Genetic control of obesity and gut microbiota composition in response to high-fat, high-sucrose diet in mice. Cell Metab. 17, 141–152. doi: 10.1016/j.cmet.2012.12.007
Reunanen, J., Kainulainen, V., Huuskonen, L., Ottman, N., Belzer, C., Huhtinen, H., et al. (2015). Akkermansia muciniphila adheres to enterocytes and strengthens the integrity of the epithelial cell layer. Appl. Environ. Microbiol. 81, 3655–3662. doi: 10.1128/AEM.04050-14
Sabir, J. S. M., El Omri, A., Shaik, N. A., Banaganapalli, B., Al-Shaeri, M. A., Alkenani, N. A., et al. (2019). Identification of key regulatory genes connected to NF-κB family of proteins in visceral adipose tissues using gene expression and weighted protein interaction network. PloS One 14, e0214337. doi: 10.1371/journal.pone.0214337
Savova, M. S., Mihaylova, L. V., Tews, D., Wabitsch, M., Georgiev, M. I. (2023). Targeting PI3K/AKT signaling pathway in obesity. BioMed. Pharmacother. 159, 114244. doi: 10.1016/j.biopha.2023.114244
Tang, Y., Wang, Y. D., Wang, Y. Y., Liao, Z. Z., Xiao, X. H. (2023). Skeletal muscles and gut microbiota-derived metabolites: novel modulators of adipocyte thermogenesis. Front. Endocrinol. 14. doi: 10.3389/fendo.2023.1265175
Thibaut, M. M., Bindels, L. B. (2022). Crosstalk between bile acid-activated receptors and microbiome in entero-hepatic inflammation. Trends Mol. Med. 28, 223–236. doi: 10.1016/j.molmed.2021.12.006
Turnbaugh, P. J., Ley, R. E., Mahowald, M. A., Magrini, V., Mardis, E. R., Gordon, J. I. (2006). An obesity-associated gut microbiome with increased capacity for energy harvest. Nature 444, 1027–1031. doi: 10.1038/nature05414
Wu, F., Guo, X., Zhang, J., Zhang, M., Ou, Z., Peng, Y. (2017). Phascolarctobacterium faecium abundant colonization in human gastrointestinal tract. Exp. Ther. Med. 14, 3122–3126. doi: 10.3892/etm.2017.4878
Wu, S. E., Hashimoto-Hill, S., Woo, V. (2020). Microbiota-derived metabolite promotes HDAC3 activity in the gut. Nature 586, 108–112. doi: 10.1038/s41586-020-2604-2
Wu, Q., Liang, X., Wang, K., Lin, J., Wang, X., Wang, P., et al. (2021). Intestinal hypoxia-inducible factor 2α regulates lactate levels to shape the gut microbiome and alter thermogenesis. Cell Metab. 33, 1988–2003.e7. doi: 10.1016/j.cmet.2021.07.007
Xie, Y., Ding, F., Di, W., Lv, Y., Xia, F., Sheng, Y., et al. (2020). Impact of a high-fat diet on intestinal stem cells and epithelial barrier function in middle−aged female mice. Mol. Med. Rep. 21, 1133–1144. doi: 10.3892/mmr.2020.10932
Yao, R., Dai, Q., Wu, T., Yang, Z., Chen, H., Liu, G., et al. (2021). Fly-over phylogeny across invertebrate to vertebrate: The giant panda and insects share a highly similar gut microbiota. Comput. Struct. Biotechnol. J. 19, 4676–4683. doi: 10.1016/j.csbj.2021.08.025
Ye, X., Liu, W., Liao, Y., Liu, T., Zhao, Y., Wang, Y., et al. (2022). Glycogen branching enzyme with a novel chain transfer mode derived from corallococcus sp. Strain EGB and its potential applications. J. Agric. Food Chem. 70, 4735–4748. doi: 10.1021/acs.jafc.2c01621
Zeng, Q., Li, D., He, Y., Li, Y., Yang, Z., Zhao, X., et al. (2019). Discrepant gut microbiota markers for the classification of obesity-related metabolic abnormalities. Sci. Rep. 9(1):13424. doi: 10.1038/s41598-019-49462-w
Zhang, F., Ye, J., Meng, Y., Ai, W., Su, H., Zheng, J., et al. (2018). Calcium supplementation enhanced adipogenesis and improved glucose homeostasis through activation of camkii and PI3K/akt signaling pathway in porcine bone marrow mesenchymal stem cells (pBMSCs) and mice fed high fat diet (HFD). Cell Physiol. Biochem. 51, 154–172. doi: 10.1159/000495171
Zhang, J., Yi, C., Han, J., Ming, T., Zhou, J., Lu, C., et al. (2022). Dose effect of high-docosahexaenoic acid tuna oil on dysbiosis in high-fat diet mice. J. Sci. Food Agric. 102, 5531–5543. doi: 10.1002/jsfa.11908
Keywords: lipid metabolism, cecum microorganism, fattening model of rabbit, obesity, metagenome
Citation: Li Y, Qi X, Wang Q, He Y, Li Z, Cen X and Wei L (2024) Comprehensive analysis of key host gene-microbe networks in the cecum tissues of the obese rabbits induced by a high-fat diet. Front. Cell. Infect. Microbiol. 14:1407051. doi: 10.3389/fcimb.2024.1407051
Received: 26 March 2024; Accepted: 24 May 2024;
Published: 14 June 2024.
Edited by:
Jihan Wang, Northwestern Polytechnical University, ChinaReviewed by:
Jinge Xin, Southern Medical University, ChinaXiaoyuan Wei, The Pennsylvania State University (PSU), United States
Copyright © 2024 Li, Qi, Wang, He, Li, Cen and Wei. This is an open-access article distributed under the terms of the Creative Commons Attribution License (CC BY). The use, distribution or reproduction in other forums is permitted, provided the original author(s) and the copyright owner(s) are credited and that the original publication in this journal is cited, in accordance with accepted academic practice. No use, distribution or reproduction is permitted which does not comply with these terms.
*Correspondence: Limin Wei, cGVhcmxfMDMyOUAxNjMuY29t