 Lijun Zheng1†
 Yonghui Jia
 Yi Xu
Yi Xu- 1Department of Ultrasound Medicine, The Second Affiliated Hospital of Soochow University, Suzhou, China
- 2Department of Pharmacy, The 960th Hospital of PLA, Jinan, China
- 3Department of Pharmacy, Zibo Zhoucun People’s Hospital, Zibo, China
- 4Jinzhou Medical University Graduate Training Base, The 960th Hospital of PLA, Jinan, China
- 5Department of Obstetrics and Gynecology, The Second Affiliated Hospital of Soochow University, Suzhou, China
Introduction: Antifungal resistance and tolerance are distinct responses exhibited by fungi when exposed to drugs. While considerable research has focused on azole tolerance in the human pathogen Candida albicans, studies in other fungal species remain limited.
Objective: This study aims to conduct a comparative investigation of the adaptation of the model organism Saccharomyces cerevisiae and C. albicans to fluconazole in vitro.
Methods: We performed experiments using laboratory strains of S. cerevisiae and C. albicans to evaluate their fluconazole tolerance and resistance under varying temperature conditions. High concentrations of fluconazole were administered, and subsequent changes in fungal phenotypes were analyzed through techniques such as transcriptome analysis and monitoring of petite formation.
Results: Our results revealed that fluconazole tolerance is present in wild-type strains of S. cerevisiae and is influenced by temperature, albeit in a manner opposite to that observed in C. albicans. Importantly, when subjected to high concentrations of fluconazole, S. cerevisiae strains developed resistance without displaying tolerance; all resistant adaptors identified were petites. Chemical induction of petite formation led to an increase in resistance accompanied by a decrease in tolerance.
Conclusion: Transcriptome analysis indicated that petites up-regulated efflux mechanisms while down-regulating most ERG genes. This suggests that, unlike petite-negative C. albicans, petite-positive S. cerevisiae swiftly transitions to a petite phenotype upon exposure to fluconazole, resulting in enhanced resistance but diminished tolerance. This evolutionary divergence emphasizes the need for additional studies on fluconazole tolerance in other pathogenic fungi.
Introduction
Fungal infections represent a significant global health burden, affecting over one billion individuals worldwide (Bongomin et al., 2017). Immunocompromised and critically ill patients are particularly vulnerable, with fungi ranking among the leading causes of morbidity and mortality in these populations (Pfaller and Diekema, 2007). The World Health Organization (WHO) recently underscored the urgency of this issue by listing 19 fungal pathogens as “priority pathogens,” including Candida albicans, Cryptococcus neoformans, Aspergillus fumigatus, and Candida auris, which are classified as “critical priority” due to their high public health risk (WHO, 2022). While C. albicans remains the most common cause of candidiasis, the prevalence of non-albicans Candida (NAC) species in hospital-acquired infections has risen significantly in recent decades, with some species even surpassing C. albicans in isolation frequency (Cleveland et al., 2015; Wu et al., 2017). This shift is partly attributed to the widespread use of azole antifungals, which has exerted selective pressure on fungal populations (Mean et al., 2008).
The current antifungal arsenal is limited to four main classes: azoles, polyenes, echinocandins, and pyrimidine analogues (Robbins et al., 2016). Among these, azoles—particularly fluconazole (FLC)—are the most widely used due to their efficacy and relatively low toxicity to host cells (Pfaller et al., 2010). Azoles inhibit lanosterol 14α-demethylase, a key enzyme in the ergosterol biosynthesis pathway, leading to the accumulation of toxic sterols and depletion of ergosterol in fungal cell membranes (Joseph-Horne and Hollomon, 1997; Kanafani and Perfect, 2008). However, because azoles are fungistatic rather than fungicidal, they do not eradicate fungal cells, creating conditions conducive to the emergence of resistance. Since their introduction in the 1980s, the incidence of azole-resistant fungal pathogens has risen alarmingly worldwide (Fisher et al., 2018). For instance, resistance rates to FLC in C. neoformans clinical isolates have increased from 7.3% (1997-2000) to 11.7% (2005-2007) (Pfaller et al., 2009). Similarly, the annual resistance rate of Candida tropicalis to FLC continues to rise, posing a significant challenge to antifungal therapy (Wang et al., 2021).
In addition to resistance, fungi exhibit a phenomenon known as tolerance, which further complicates treatment outcomes. While resistance is defined as the ability to grow at drug concentrations that inhibit susceptible strains, tolerance refers to the ability of susceptible strains to survive prolonged drug exposure without significant growth inhibition (Balaban et al., 2019; Berman and Krysan, 2020). In bacteria, tolerance is quantified by the minimum duration of killing (MDK), but no standardized methods exist for measuring antifungal tolerance in fungi. This lack of consensus has led to inconsistent terminology and methodologies in the literature, hindering progress in understanding fungal responses to treatment (Yang and Berman, 2024).
Recent work by the Berman lab has redefined antifungal tolerance as the ability of drug-susceptible fungal strains to grow slowly at drug concentrations above the minimal inhibitory concentration (MIC) (Rosenberg et al., 2018). Using disk diffusion and broth microdilution assays, they developed metrics such as the radius of inhibition (RAD) and the fraction of growth (FoG) to quantify tolerance (Gerstein et al., 2016; Rosenberg et al., 2018). These studies have revealed that wild-type C. albicans isolates exhibit intrinsic azole tolerance, which varies depending on strain characteristics and environmental factors such as temperature, medium composition, and pH (Rosenberg et al., 2018; Delarze et al., 2020; Xu et al., 2021; Yang et al., 2023). Notably, C. albicans adapts to high azole concentrations by developing tolerance rather than resistance, whereas low concentrations of FLC promote resistance, sometimes accompanied by tolerance (Sun et al., 2023; Todd et al., 2023; Yang et al., 2023; Zheng et al., 2024b). Furthermore, genes such as KSR1, ERG251, and ZRG2 have been implicated in FLC tolerance in C. albicans (Vande Zande et al., 2024; Zhou et al., 2024), highlighting the genetic basis of this adaptive response.
Antifungal tolerance has also been observed in other fungal species, including C. auris and C. glabrata (Rasouli Koohi et al., 2023; Zheng et al., 2024a). However, it remains unclear whether tolerance is a widespread adaptive strategy among fungi or limited to specific species. This knowledge gap highlights the need for further research to elucidate the mechanisms underlying fungal tolerance and its implications for antifungal therapy.
Saccharomyces cerevisiae, a well-established model organism in microbiology and genetics, has been instrumental in advancing our understanding of eukaryotic biology and antifungal resistance mechanisms (Demuyser and Van Dijck, 2019). Its genetic tractability and well-characterized pathways make it an ideal system for studying the molecular basis of antifungal responses. However, despite its utility, the adaptive strategies of S. cerevisiae in response to azole exposure, particularly the interplay between resistance and tolerance, remain poorly understood.
This study aims to address this gap by investigating the adaptive responses of S. cerevisiae to FLC and comparing them to those of C. albicans. By elucidating the mechanisms underlying FLC tolerance and resistance in S. cerevisiae, we seek to contribute to a broader understanding of fungal adaptation strategies and inform the development of more effective antifungal therapies.
In this study, we compared FLC adaptation in S. cerevisiae (S288C) and C. albicans (SC5314). While SC5314 exhibited FLC tolerance at 37°C but not 30°C, S288C showed the opposite pattern, being tolerant at 30°C but not 37°C. S. cerevisiae adapted to high FLC concentrations primarily through resistance, with all resistant adaptors being petites. Ethidium bromide-induced petites also lost tolerance and gained resistance, accompanied by up-regulation of efflux genes and down-regulation of ERG genes. These findings suggest mitochondrial integrity is crucial for FLC tolerance in S. cerevisiae.
Materials and methods
Strains and growth conditions
The reference strain S. cerevisiae S288C, the clinical isolate MK288, and the C. albicans reference strain SC5314 were utilized as progenitors in this study. Stock cultures were preserved in 25% glycerol and maintained at -80˚C. Cells were routinely cultured in Yeast Extract-Peptone-Dextrose (YPD) medium, which consists of 1% (w/v) yeast extract, 2% (w/v) peptone, and 2% (w/v) D-glucose, at designated temperatures using a shaking incubator set to 150-200 rpm. For YPG medium, the composition included 1% (w/v) yeast extract, 0.2% (w/v) peptone, and 3% (w/v) glycerol, with 2% (w/v) agar added for solid media. Drug solutions were prepared in dimethyl sulfoxide (DMSO) and stored at -20˚C.
Disk diffusion assay
Disk diffusion assays were conducted following the protocols outlined by Yang et al (Yang et al., 2023), adhering to the CLSI M44-A2 guidelines for antifungal disk diffusion susceptibility testing with minor modifications. In brief, strains were streaked from glycerol stocks onto YPD agar and incubated at designated temperatures for 48 hours. Colonies were then suspended in distilled water and adjusted to a concentration of 1 × 10⁶ cells/mL. A volume of 100 μL of this cell suspension was spread evenly onto -m20L YPD plates. An empty paper disk (6 mm diameter and 0.7 mm thickness) was saturated with 5 μL of 40 mg/mL FLC and placed at the center of each plate. The plates were subsequently incubated at the specified temperatures and photographed after 48 hours. Analysis of the disk diffusion assay was performed using the diskImageR pipeline (Gerstein et al., 2016). The parameters measured included the fraction of growth within the zone of inhibition (FoG) and the radius of inhibition (RAD), specifically at 20% drug inhibition, denoted as FoG20 and RAD20, respectively.
Isolating colonies from zone of inhibition
Cells were suspended in distilled water and adjusted to a concentration of 1 × 10⁵ cells/mL. A volume of 100 µL of the cell suspension was spread onto a YPD plate. An empty paper disk saturated with 5 μL of 40 mg/mL FLC was placed at the center of the plate. After incubating 48 hours at 30˚C for S288C and 37˚C for SC5314, 16 colonies were randomly selected from within the inhibition zone and streaked onto new YPD plates. Following an additional 48-hour incubation, one single colony from each adaptor was chosen for further analysis.
Obtaining adaptors using high concentrations of fluconazole
Cells were suspended in distilled water and adjusted to a concentration of 1 × 10⁷ cells/mL. A volume of 100 µL of the cell suspension was spread onto YPD plates supplemented with FLC. The plates were then incubated at 30˚C for 5 days. Adaptors were randomly selected from the drug-treated plates.
Spot assay
Cells were suspended in distilled water and adjusted to a concentration of 1 × 10⁷ cells/mL. A volume of 3 µL of the cell suspension was spotted onto YPD or YPG plates. The plates were incubated at 30˚C and photographed after 48 hours.
Induction of petite formation in yeast using ethidium bromide
The methodology for inducing petite formation with Ethidium bromide (EtBr) was adapted from the protocol described by Fox et al (Fox et al., 1991), with slight modifications. The test strains were thawed from a -80°C freezer and streaked onto a YPD plate, followed by incubation at 30°C for 48 hours to promote colony growth. A single colony was then inoculated into YPD broth supplemented with 25 µg/mL EtBr (filter-sterilized). Once the culture reached saturation, it was transferred to a second culture prepared with the same medium and allowed to grow to saturation again. For strain S288C, one single passage was performed, while for SC5314, a total of 20 passages were conducted. Finally, the saturated cultures were streaked onto YPD plates to isolate individual colonies, which were subsequently streaked onto both YPD and YPG plates to verify respiratory deficiency.
RNA-seq
RNA sequencing (RNA-seq) was performed as previously described with minor modifications (Yang et al., 2021). Briefly, strains were streaked on YPD plates from the -80˚C freezer and incubated for 48 hours at 30˚C. Several colonies of similar size were randomly selected and suspended in a solution to achieve an optical density at 600 nm (OD600) of 0.1. The cultures were then incubated in a shaking incubator at 30˚C until the OD600 reached 1.0. Cells were collected by centrifugation and flash frozen in liquid nitrogen.
Total RNA extraction and purification, library construction, and sequencing were conducted as described previously (Ke et al., 2024). Three biological replicates were obtained for each strain. Differential gene expression profiling was performed using DESeq2 (Love et al., 2014) with standard parameters. Genes with a False Discovery Rate (FDR)-adjusted p-value < 0.05 and expression fold changes greater than 1.5 or less than -1.5 were considered differentially expressed.
Measurement of total ergosterol content
Ergosterol was extracted and detected as described in by Madsen et al (Madsen et al., 2011). Briefly, strains were cultured in YPD broth until reaching the log phase (OD600 = 1.0). The cells were then collected, centrifuged at 4000 rpm for 3 minutes, and the resulting pellets were immediately stored at −20°C. The frozen pellets were thawed and resuspended in 2 ml of a 20% w/v sodium hydroxide solution in 50% ethanol. The mixture was transferred to a glass tube and heated in boiling water for 5 minutes with occasional shaking. After cooling, 1 ml of the same sodium hydroxide solution and 2 ml of hexane were added, followed by vortex-mixing for 30–60 seconds. The tubes were centrifuged at 1000 rpm for 5 minutes, and the hexane phase was collected for further analysis. The samples were dried, derivatized by adding 50 µl of BSTFA and 50 µl of pyridine, dried again, and finally dissolved in 75 µl of toluene.
Ergosterol content was quantified using Gas Chromatography-Mass Spectrometry (GC-MS). A 1 µl sample was injected into an Rtx-5 ms column (30 meters, 0.25 mm ID) with helium as the carrier gas. The column temperature was initially held at 240°C for 2 minutes, then increased at a rate of 10°C per minute to 330°C, and maintained at 330°C for 6.5 minutes.
Measurement of rhodamine 6G efflux
Rohodamine 6G efflux experiment was performed following the protocol described by Kolaczkowski et al (Kolaczkowski et al., 1996). Briefly, approximately 1 × 10⁶ yeast cells from overnight cultures were transferred to YPD medium and allowed to grow for 4 hours. The cells were then pelleted, washed twice with PBS (pH 7.0, without glucose), and resuspended in glucose-free PBS to a density of 108 cells/ml. The cell suspensions were incubated at 30°C with shaking at 200 rpm for 120 minutes under glucose starvation conditions to de-energize the cells. After de-energization, the cells were pelleted, washed, and resuspended in glucose-free PBS to 108 cells/ml. Rhodamine 6G was added to the suspensions at a final concentration of 10 µM, and the cells were incubated for 30 minutes at 30°C. Following incubation, the cells were washed twice and resuspended in glucose-free PBS to 108 cells/ml. To measure rhodamine 6G efflux, 1-mL samples were collected at 10-minute intervals, centrifuged, and the absorption of the supernatant at 527 nm was measured in triplicate using 100-µl aliquots. Energy-dependent efflux was assessed by adding 2% glucose (final concentration) to the cell suspensions, while glucose-free controls were included in all experiments. The efflux of rhodamine 6G was quantified using a rhodamine 6G concentration curve for accurate determination.
Statistical analysis
All disk diffusion assays represent the average of three technical replicates, with error bars indicating the standard deviation. Statistical analyses were conducted using a two-tailed Student’s t-test in Microsoft Excel. Significance analysis of total ergosterol content was performed using a two-tailed Student’s t-test to evaluate differences between strains. Curves representing rhodamine 6G concentrations were analyzed using the Tukey HSD test to assess statistical significance. A p-value of less than 0.05 was considered statistically significant. ** indicates p < 0.01, *** indicates p < 0.001.
Results
Opposing effects of temperature on fluconazole tolerance in reference strains of S. cerevisiae and C. albicans
To compare S. cerevisiae and C. albicans regarding the potential impact of temperature on FLC tolerance, two assays were conducted using reference strains.
In the disk diffusion assay (Figure 1A), S288C had RAD20 values of 13.33 ± 0.58 at 30°C and 12.33 ± 0.58 at 37°C. SC5314 exhibited the same RAD20 value at both 30°C and 37°C. Thus, temperature did not produce significant changes in RAD20 values for either strain. For S288C, a clear ZOI was observed at 37°C with a FoG20 value of 0.25 ± 0.03. In contrast, at 30°C, S288C displayed lawn growth inside the ZOI, yielding a FoG20 value of 0.49 ± 0.02, which was significantly higher than the value at 37°C (p<0.001, two-tailed Student’s t-test). SC5314 displayed a clear ZOI at 30°C, with a FoG20 value of 0.21 ± 0.02. At 37°C, however, it showed growth within the ZOI, resulting in a higher FoG20 value of 0.68 ± 0.01, which was significantly greater than the value at 30°C (p<0.001, two-tailed Student’s t-test).
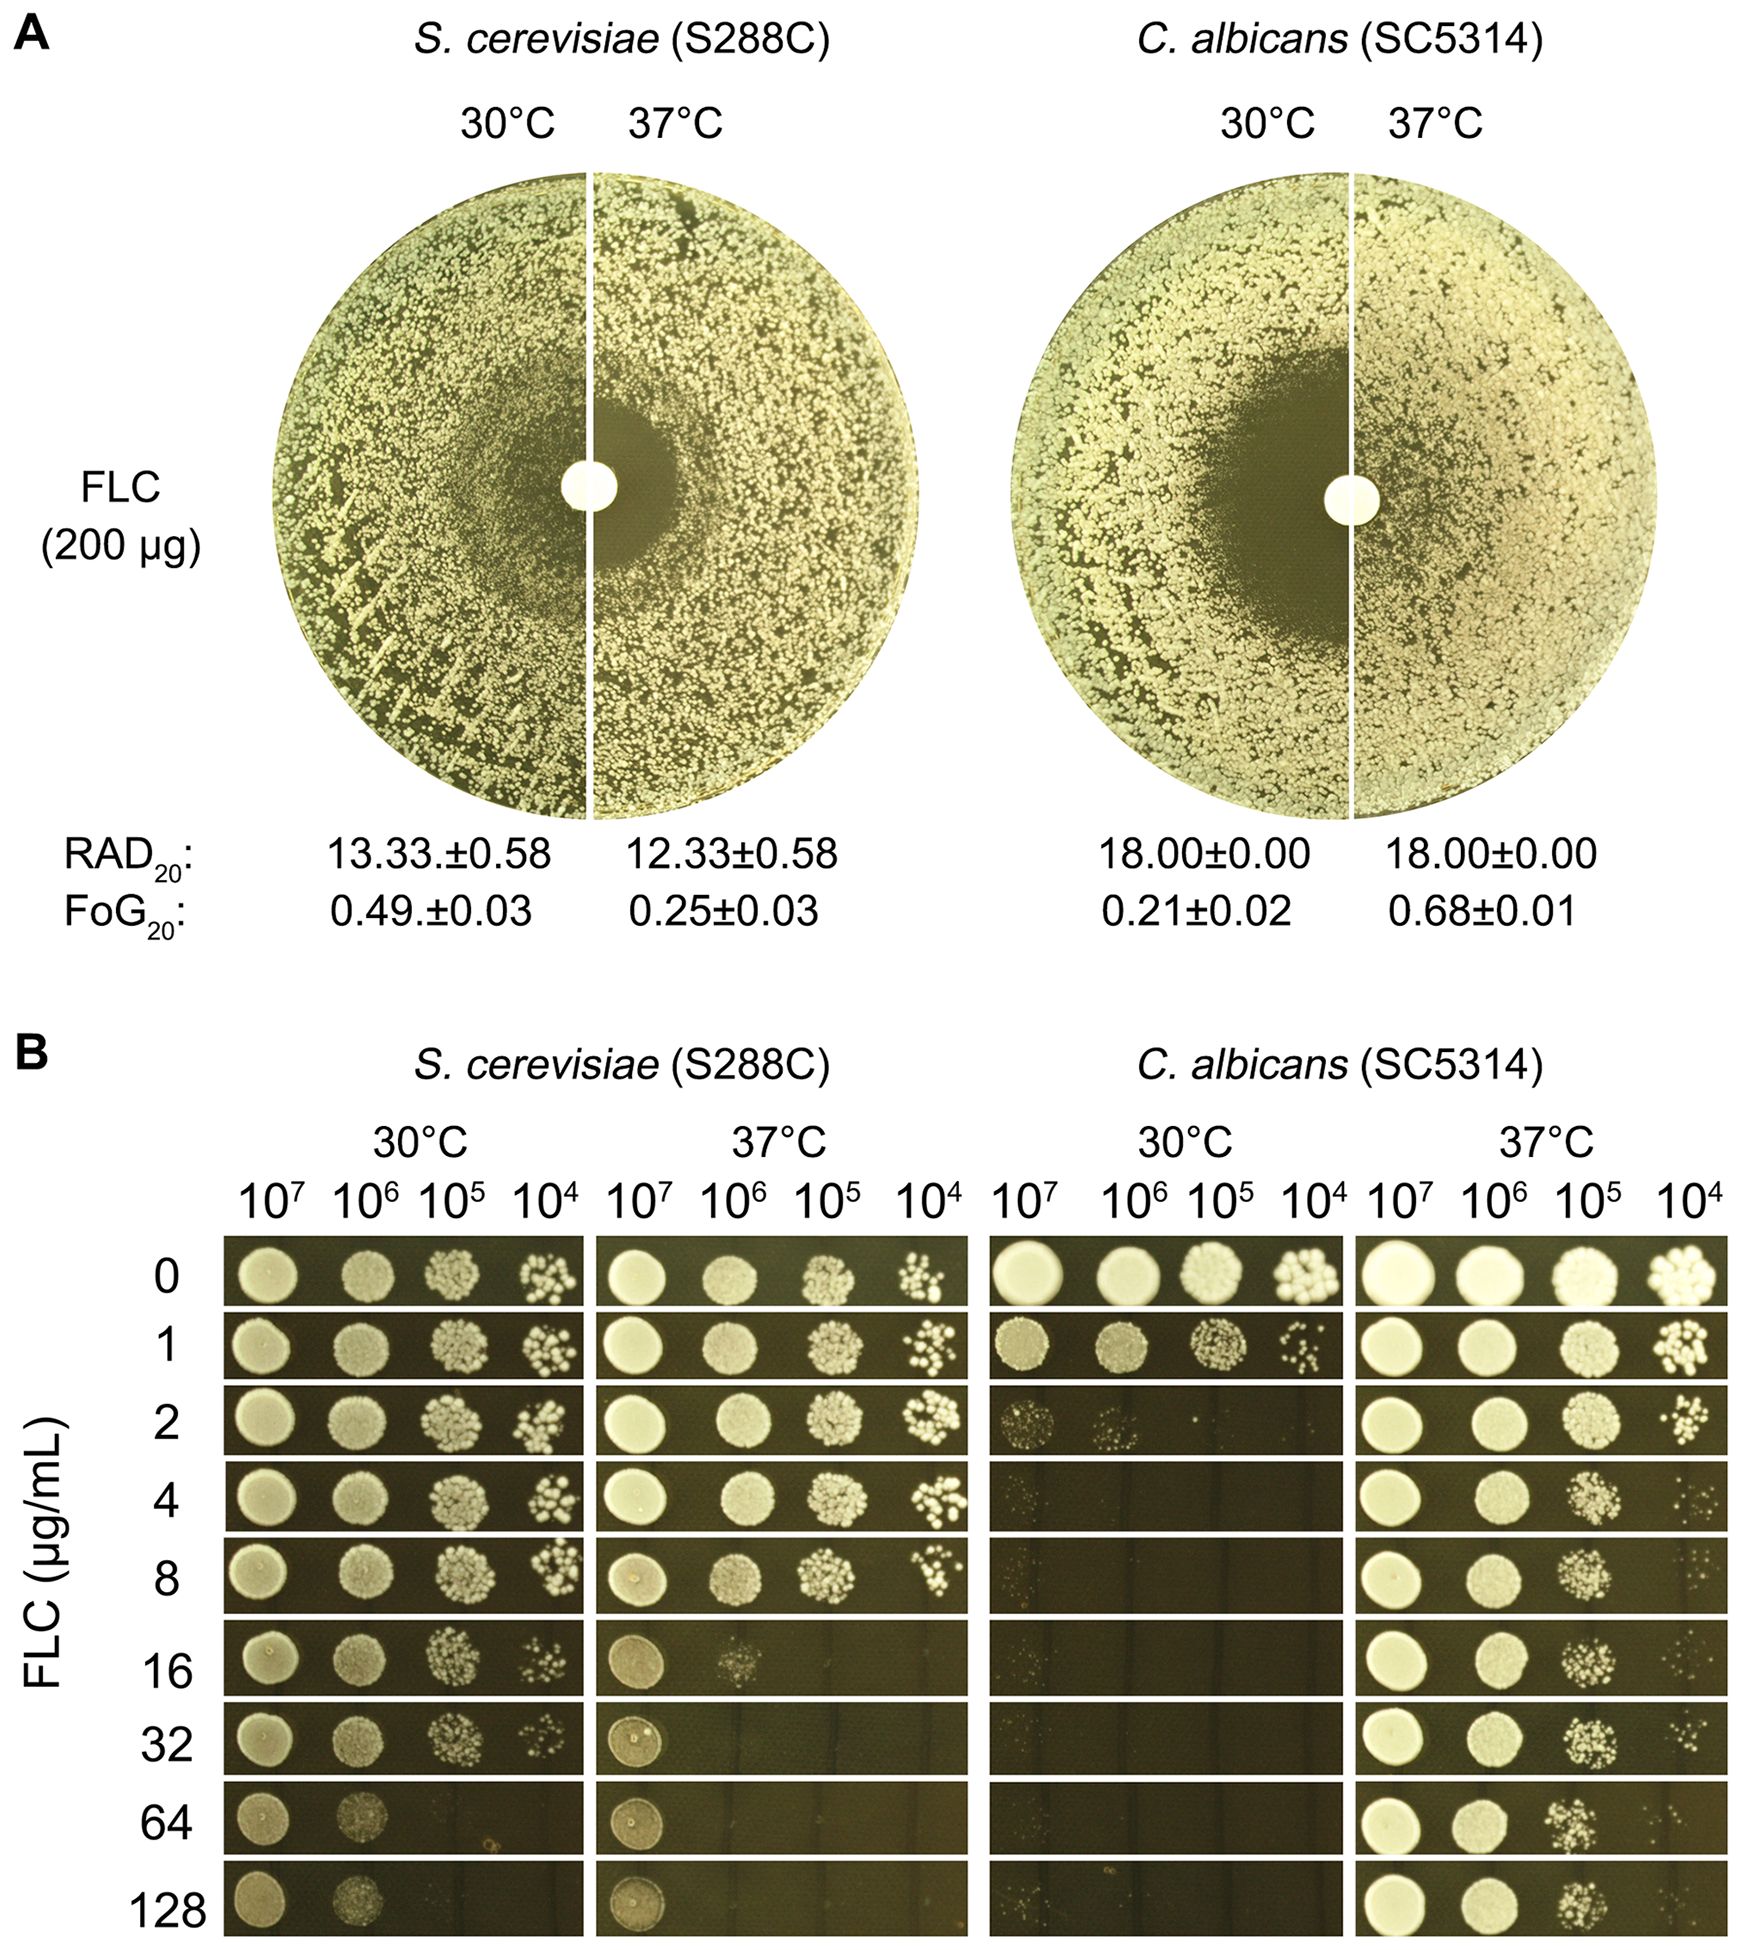
Figure 1. Evaluation of fluconazole tolerance in S. cerevisiae and C. albicans. To investigate the effect of temperature on FLC tolerance in C. albicans and S. cerevisiae, two assays were performed. In the disk diffusion assay (A), paper disks containing 200 μg of FLC were placed on YPD-agar plates inoculated with approximately 1 × 10⁵ cells of SC5314 and S288C. The plates were incubated at 30°C and 37°C, as indicated in the figure, for 48 hours. RAD20 and FoG20 were quantified using the diskImageR script. In the spot assay (B), 3 μL of 10-fold serial dilutions were spotted onto YPD-agar plates containing varying concentrations of FLC. These plates were also incubated at 30°C and 37°C for 48 hours before being photographed.
In the spot assay (Figure 1B), serial dilutions of both strains were applied to YPD-agar plates containing varying concentrations of FLC. S288C exhibited better growth at 30°C compared to 37°C in the presence of 16–128 μg/mL FLC. Growth of SC5314 was noticeably inhibited at 2 μg/mL FLC at 30°C, while at 37°C, growth was not substantially affected even at concentrations up to 128 μg/mL FLC.
Overall, these results indicate a significant modulation of FLC tolerance in both C. albicans and S. cerevisiae, influenced by temperature. This highlights the differential responses of these yeast species to antifungal treatment under varying thermal conditions.
Impact of calcineurin and hsp90 inhibition on fluconazole tolerance in S. cerevisiae and C. albicans
Previous studies indicate that calcineurin and heat shock protein 90 (Hsp90) are required for maintaining tolerance to azoles in C. albicans (Rosenberg et al., 2018; Xu et al., 2021; Guo et al., 2024; Zheng et al., 2024b) and C. glabrata (Zheng et al., 2024a). Calcineurin is a calcium/calmodulin-dependent serine/threonine phosphatase crucial for various cellular processes across different organisms, including bacteria, fungi, and higher eukaryotes. In microorganisms, particularly fungi, calcineurin is essential for regulating responses to environmental stresses such as high salinity, oxidative stress, and antifungal treatments (reviewed in (Yadav and Heitman, 2023)). Hsp90 is a conserved molecular chaperone vital for protein homeostasis, facilitating the folding, stability, and maturation of various client proteins, including kinases and transcription factors. It plays a key role in cellular stress responses under conditions like heat shock and oxidative stress. In fungal pathogens, Hsp90 is critical for antifungal resistance, regulating key proteins involved in drug resistance mechanisms, such as efflux pumps. Inhibiting Hsp90 not only disrupts the function of these proteins but also sensitizes resistant strains to conventional antifungal therapies [reviewed in (Iyer et al., 2022)].
In this study, we investigated whether calcineurin and Hsp90 are required for maintaining FLC tolerance in S. cerevisiae. For comparison, we also tested C. albicans. In disk diffusion assays, both S288C and SC5314 exhibited lawn growth on YPD media and clear halos on YPD supplemented with the calcineurin inhibitor cyclosporin A or the Hsp90 inhibitor NVP-HSP990 (Figure 2A). Quantitative measures indicated that the addition of both inhibitors resulted in a significant decrease in FoG20 values (p<0.001, two-tailed Student’s t-test), but no obvious change in RAD20 values p>0.05, two-tailed Student’s t-test (Figure 2B). Thus, like C. albicans, FLC tolerance in S. cerevisiae is also dependent on calcineurin and Hsp90.
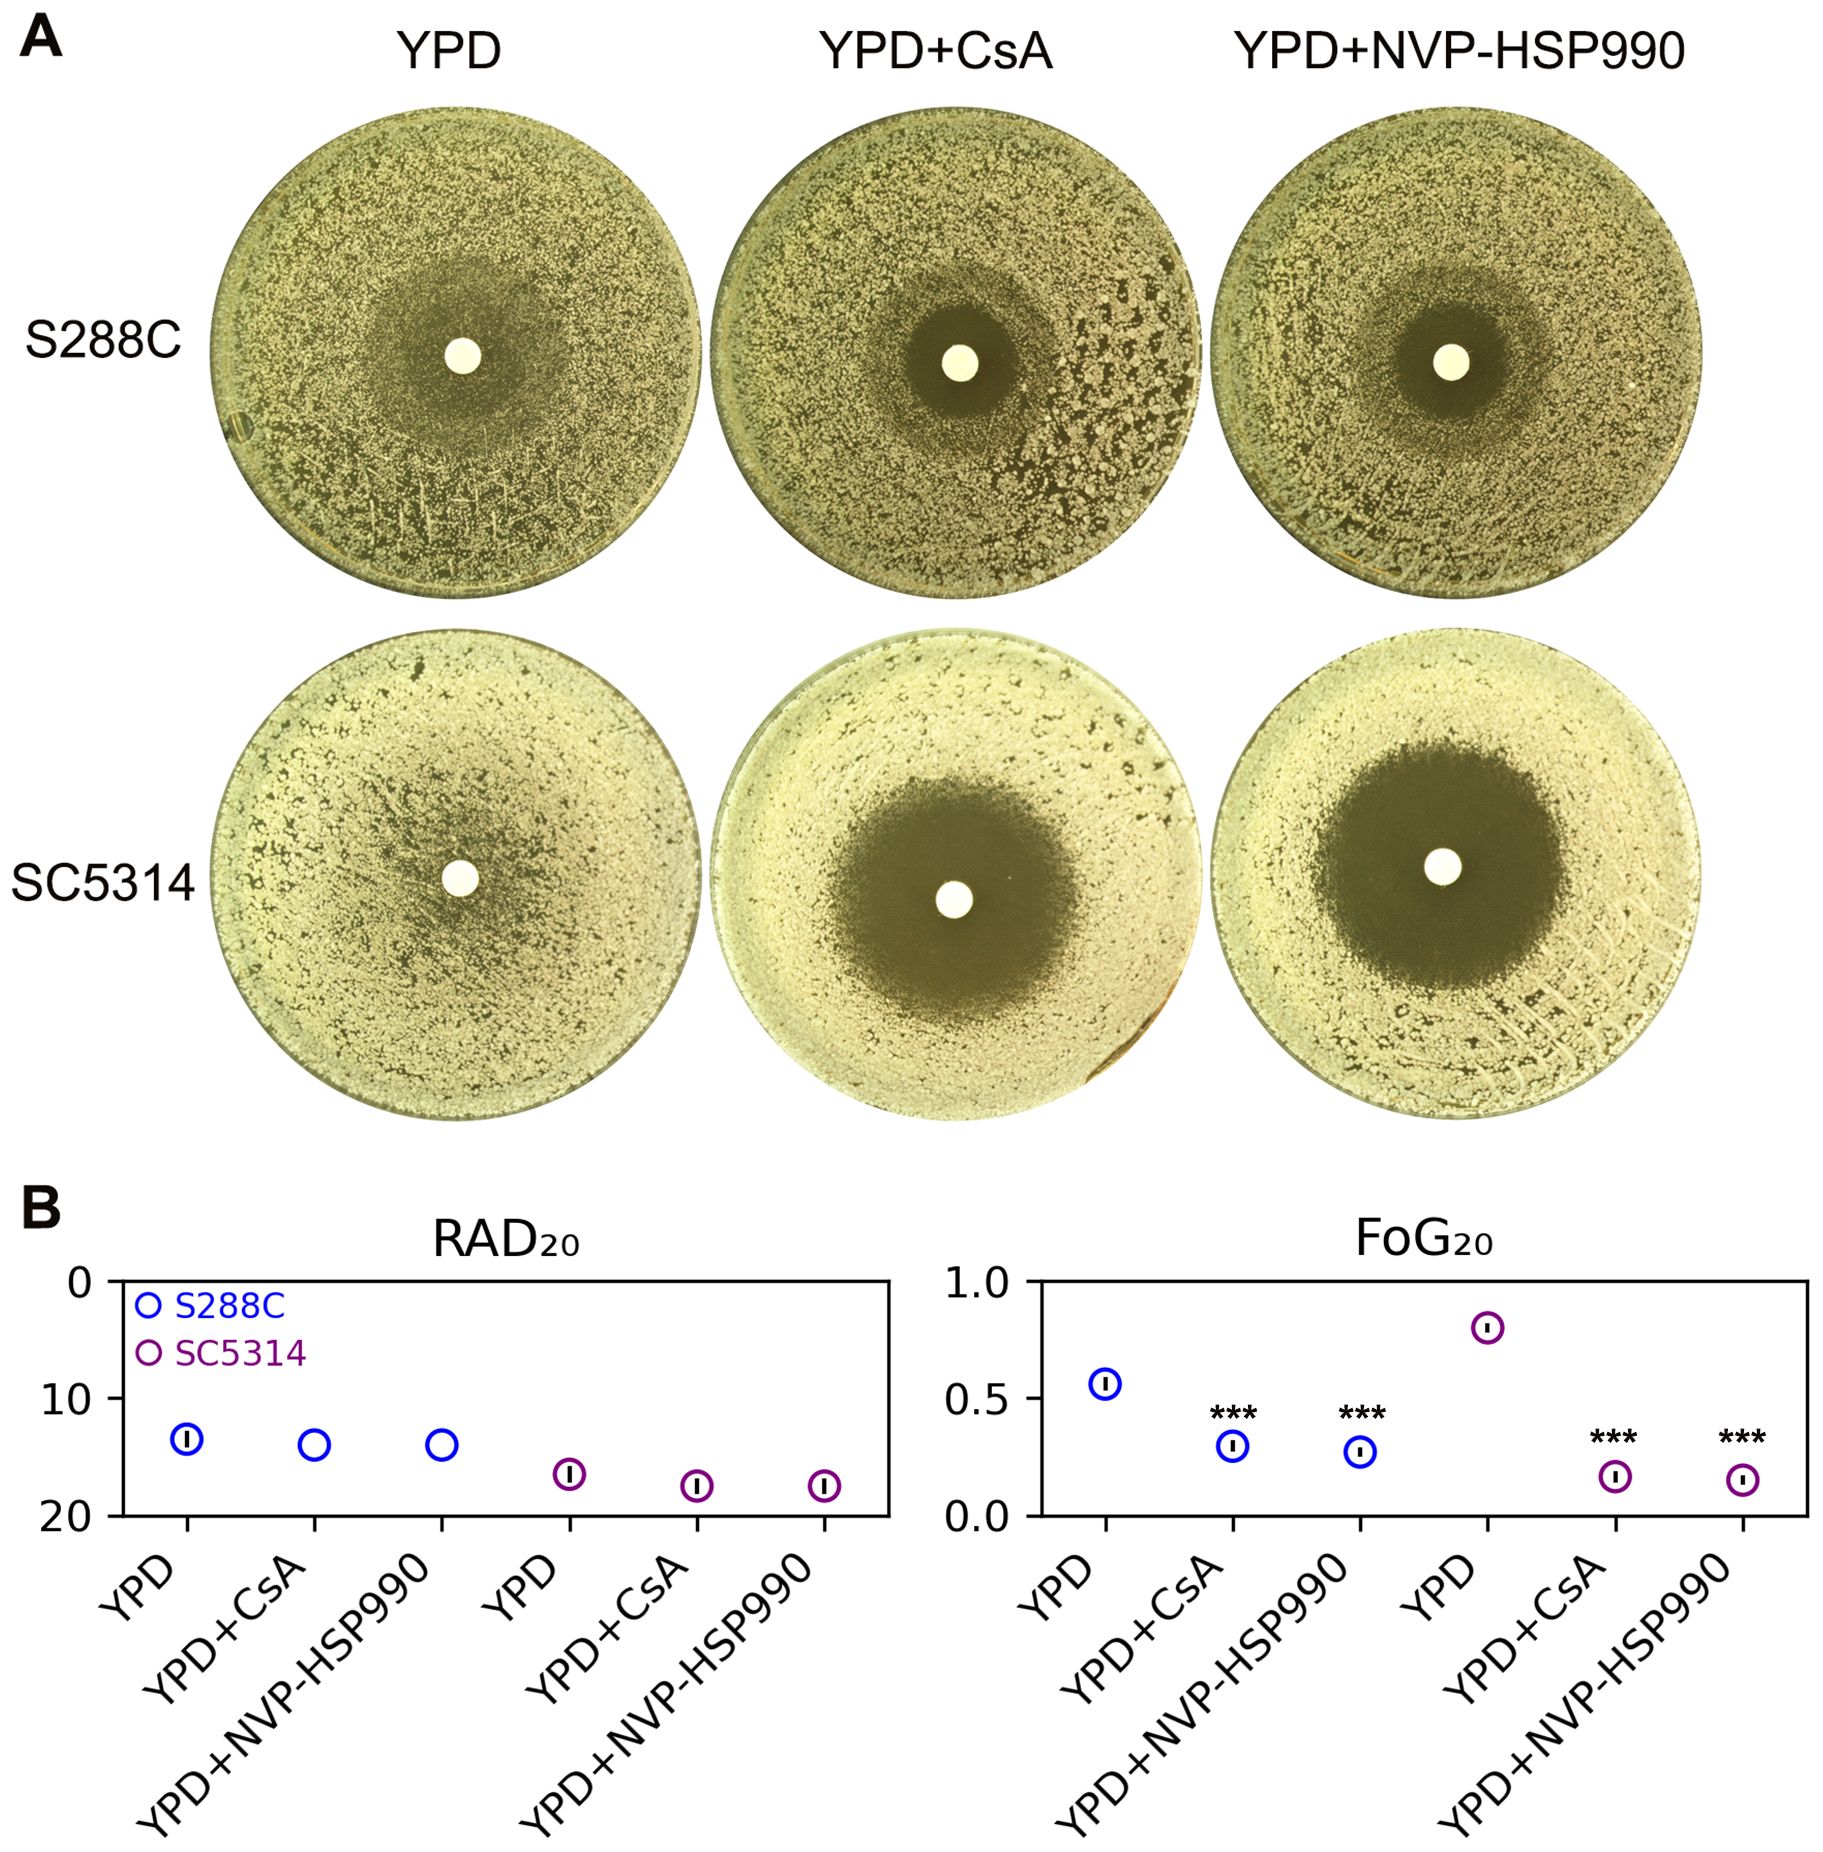
Figure 2. Influence of calcineurin and Hsp90 on fluconazole tolerance. (A) Disk diffusion assays were performed on YPD-agar and YPD-agar supplemented with the calcineurin inhibitor cyclosporine A (CsA, 0.5 μg/mL) or the Hsp90 inhibitor NVP-HSP990 (8 μg/mL). Each disk contained 200 μg of FLC. The plates were incubated at 30°C for strain S288C and at 37°C for strain SC5314 for 48 hours before being photographed. (B) RAD20 and FoG20 values were calculated using the diskImageR package. These values represent the average of three biological replicates, with error bars indicating standard deviation. Two-tailed Student’s t-test was conducted. *** indicates p < 0.001 in comparison to the values obtained on YPD.
Investigating the characteristics of IZO colonies and their resistance/tolerance to fluconazole
The tolerance to FLC is demonstrated by the slow growth of yeast in environments with high concentrations of FLC, resulting in smaller colony sizes compared to those outside the ZOI. Certain yeasts, such as S. cerevisiae and Candida glabrata, can lose their mitochondria or oxidative respiratory functions under specific conditions. The resulting cells, known as petite mutants, are viable and form small, slow-growing colonies (Fekete et al., 2007). The petite yeasts are unable to grow on nonfermentable carbon sources (such as glycerol) (Day, 2013). Petite C. glabrata cells exhibit resistance to azole drugs through the overexpression of ABC transporter genes CDR1, CDR2, and SNQ2, along with their transcriptional regulator PDR1 (Brun et al., 2004; Tsai et al., 2006). C. albicans can also form petite mutants, which show increased resistance to FLC due to the overexpression of the major facilitated superfamily multidrug efflux pump gene MDR1 (Cheng et al., 2007a).
Therefore, we investigated whether the colonies found within the ZOI (hereafter referred to as IZO colonies) are indeed petites.
To isolate IZO colonies, a disk diffusion assay was performed using a cell density that was tenfold lower than that typically used in standard assays (Figure 3A). After 48 hours, 30 colonies were randomly selected from the zone of inhibition (ZOI). Among the 30 IZO colonies derived from S288C, six were unable to grow on YPG-agar plates, which utilize glycerol as the sole carbon source. In contrast, all 30 IZO colonies derived from SC5314 were able to grow on YPG-agar plates (Figure 3B).
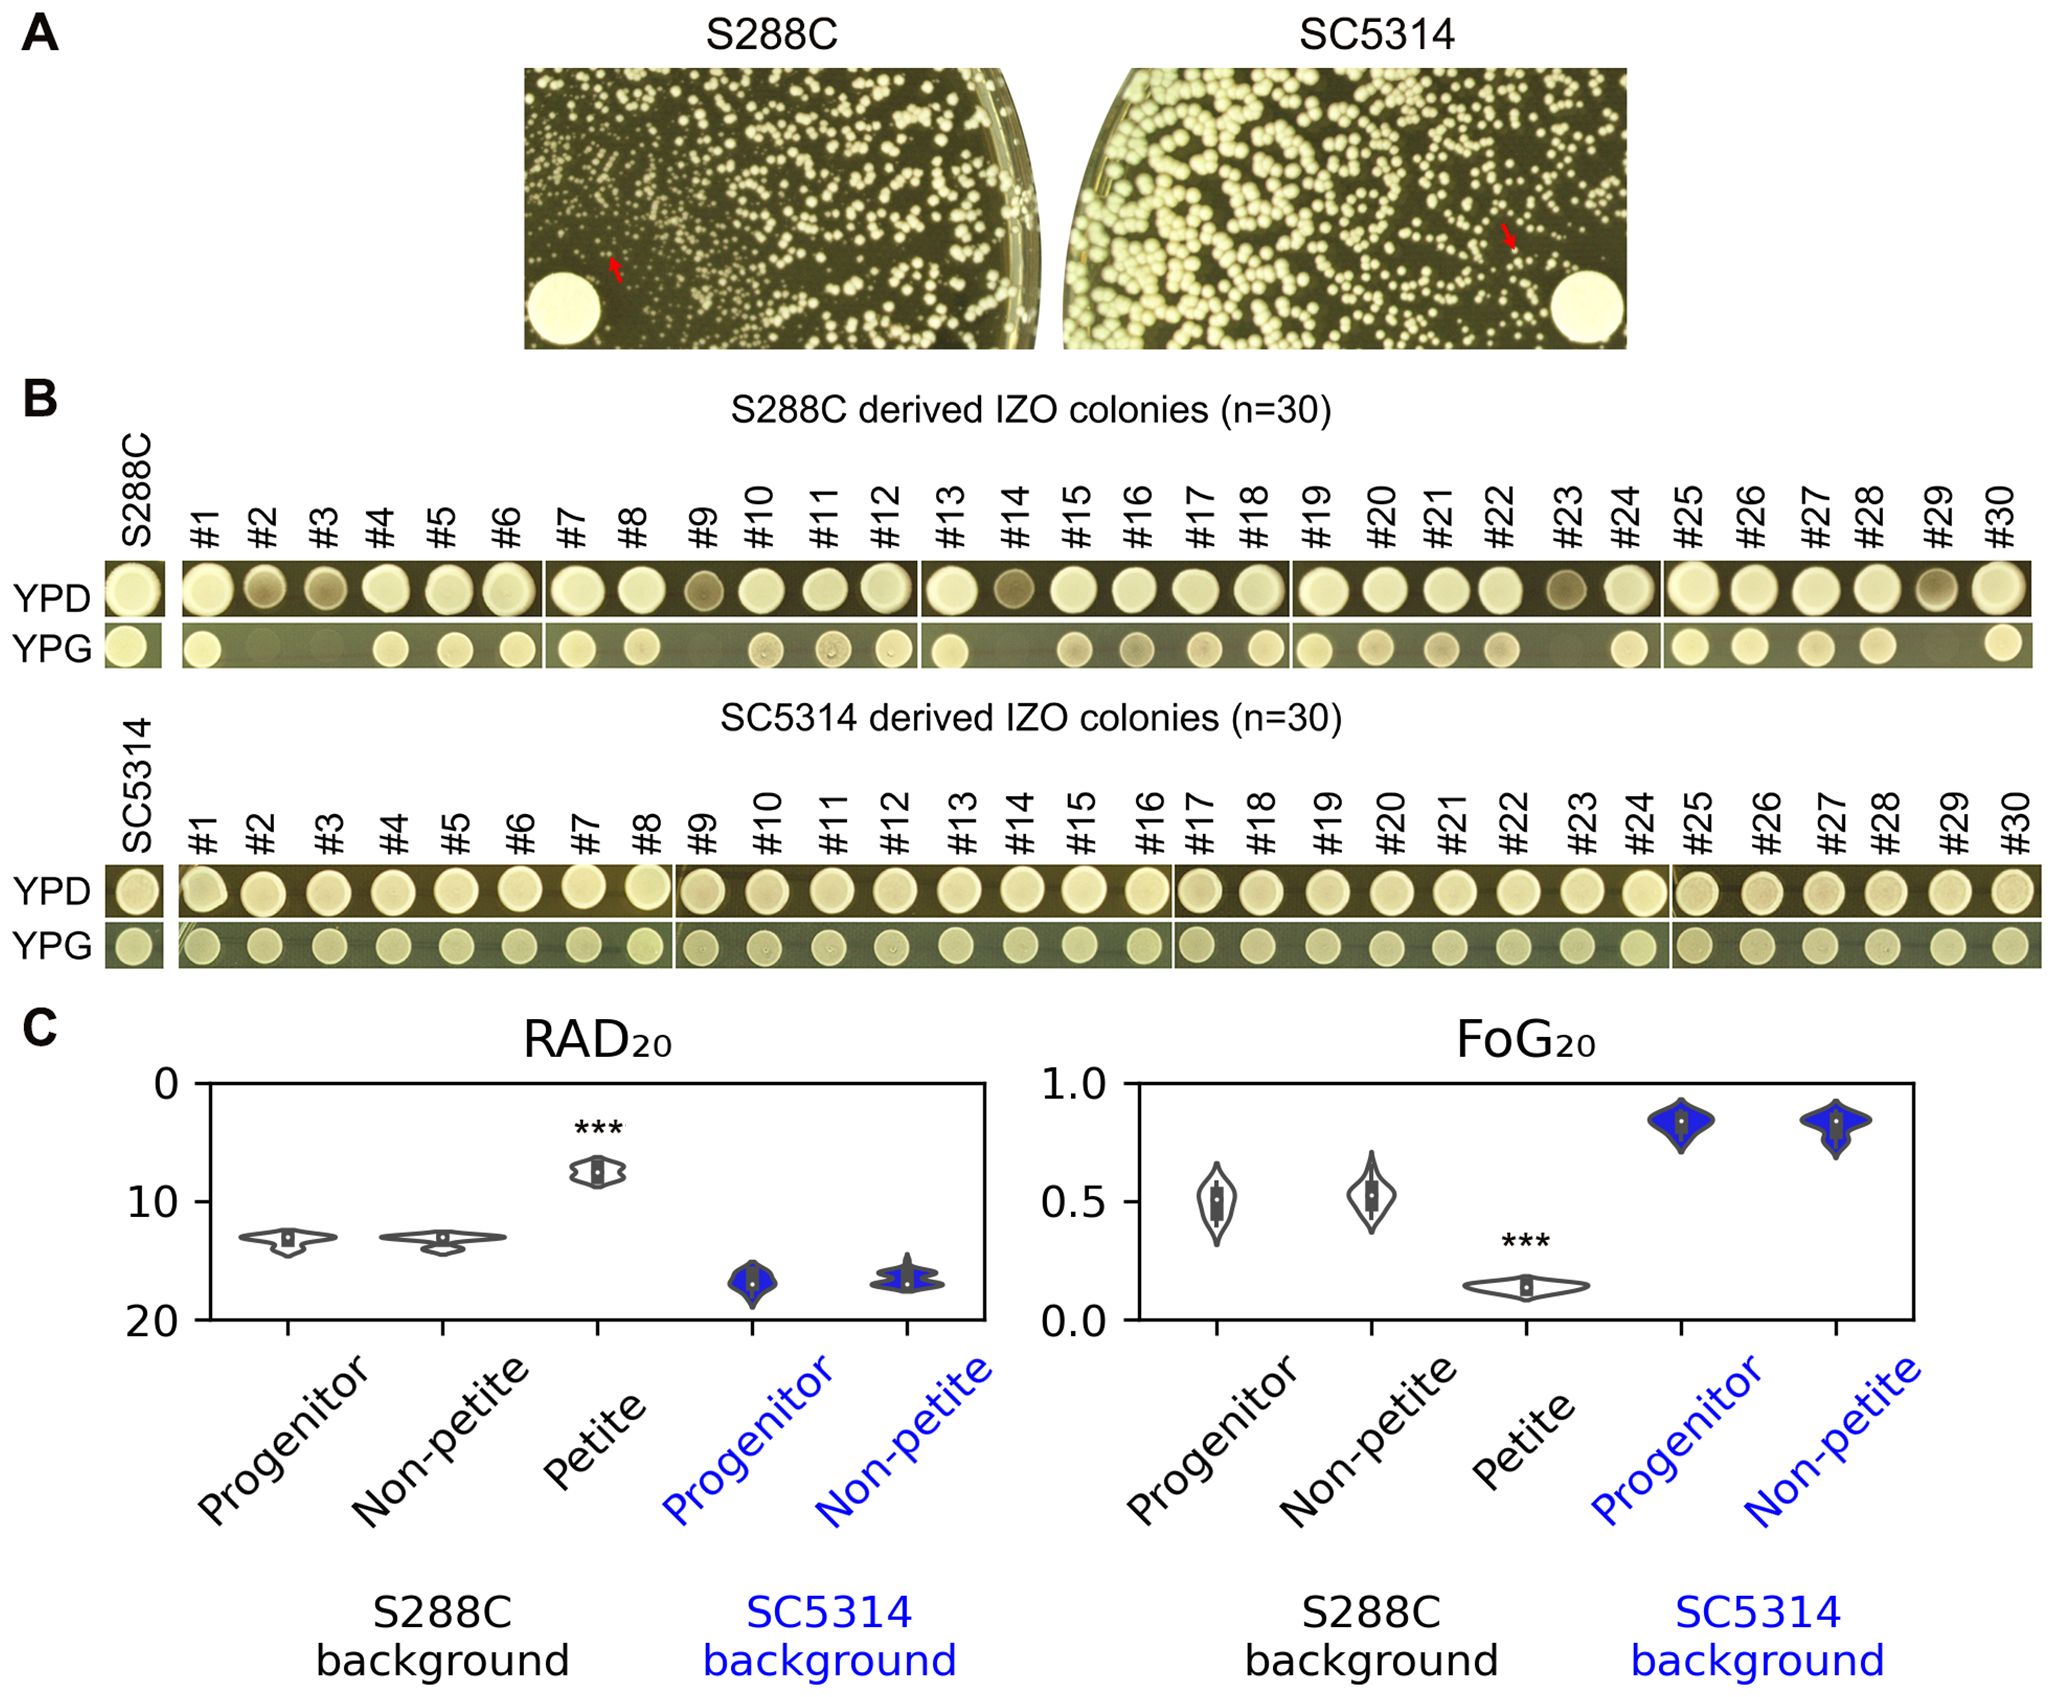
Figure 3. Examination of IZO Colonies. (A) Approximately ten thousand cells of S288C and SC5314 were spread on YPD-agar plates. The disks used contained 200 μg of FLC. The plates were incubated at 30°C for S288C and at 37°C for SC5314 for 48 hours to yield IZO colonies. (B) Thirty random IZO colonies derived from each progenitor were selected. Both the progenitors and IZO colonies were spotted onto YPD and YPG-agar plates, which contain glucose and glycerol as carbon sources, respectively. (C) A disk diffusion assay was performed to evaluate the resistance and tolerance of IZO colonies to FLC. The RAD20 and FoG20 values presented were generated using the diskImageR package. For the progenitors, eight individual colonies were tested, representing eight biological replicates. For the IZO colonies, the data represents the mean of three biological replicates for each colony. *** indicates p < 0.001 compared to the progenitor.
The disk diffusion assays indicated that the petites exhibited significantly reduced RAD20 and FoG20 values compared to S288C (p<0.001, two-tailed Student’s t-test), suggesting that while the petites were more resistant than S288C, they had lost tolerance. The non-petite IZO colonies, derived from either S288C or SC5314, did not show significant changes in RAD20 or FoG20 values, indicating that they maintained similar levels of resistance and tolerance to FLC when compared to their parental strains (Figure 3C).
Adaptation of S. cerevisiae to high concentration of fluconazole
Previous studies have shown that C. albicans adapts to high concentrations of azole drugs, including FLC, posaconazole, ketoconazole, and miconazole, primarily through the development of tolerance, as evidenced by increased FoG20 values (Kukurudz et al., 2022; Yang et al., 2023; Guo et al., 2024). Recently, we discovered that C. glabrata exhibits a parallel evolution of FLC resistance and tolerance, demonstrated by reduced RAD20 values and increased FoG20 values, respectively (Zheng et al., 2024a). In this study, we investigated how S. cerevisiae adapts to high concentrations of FLC. We included the C. albicans strain SC5314 as a control in our experiments.
S288C and SC5314 were spread on YPD-agar plates containing a wide range of FLC concentrations (8-128 μg/mL for S288C and 1-128 μg/mL for SC5314). At a concentration of 128 μg/mL, FLC exhibited significant inhibitory effects against S288C. FLC concentrations ranging from 2 to 128 μg/mL also demonstrated a strong inhibitory effect against SC5314, resulting in only a few hundred colonies appearing on the plates (Figure 4A).
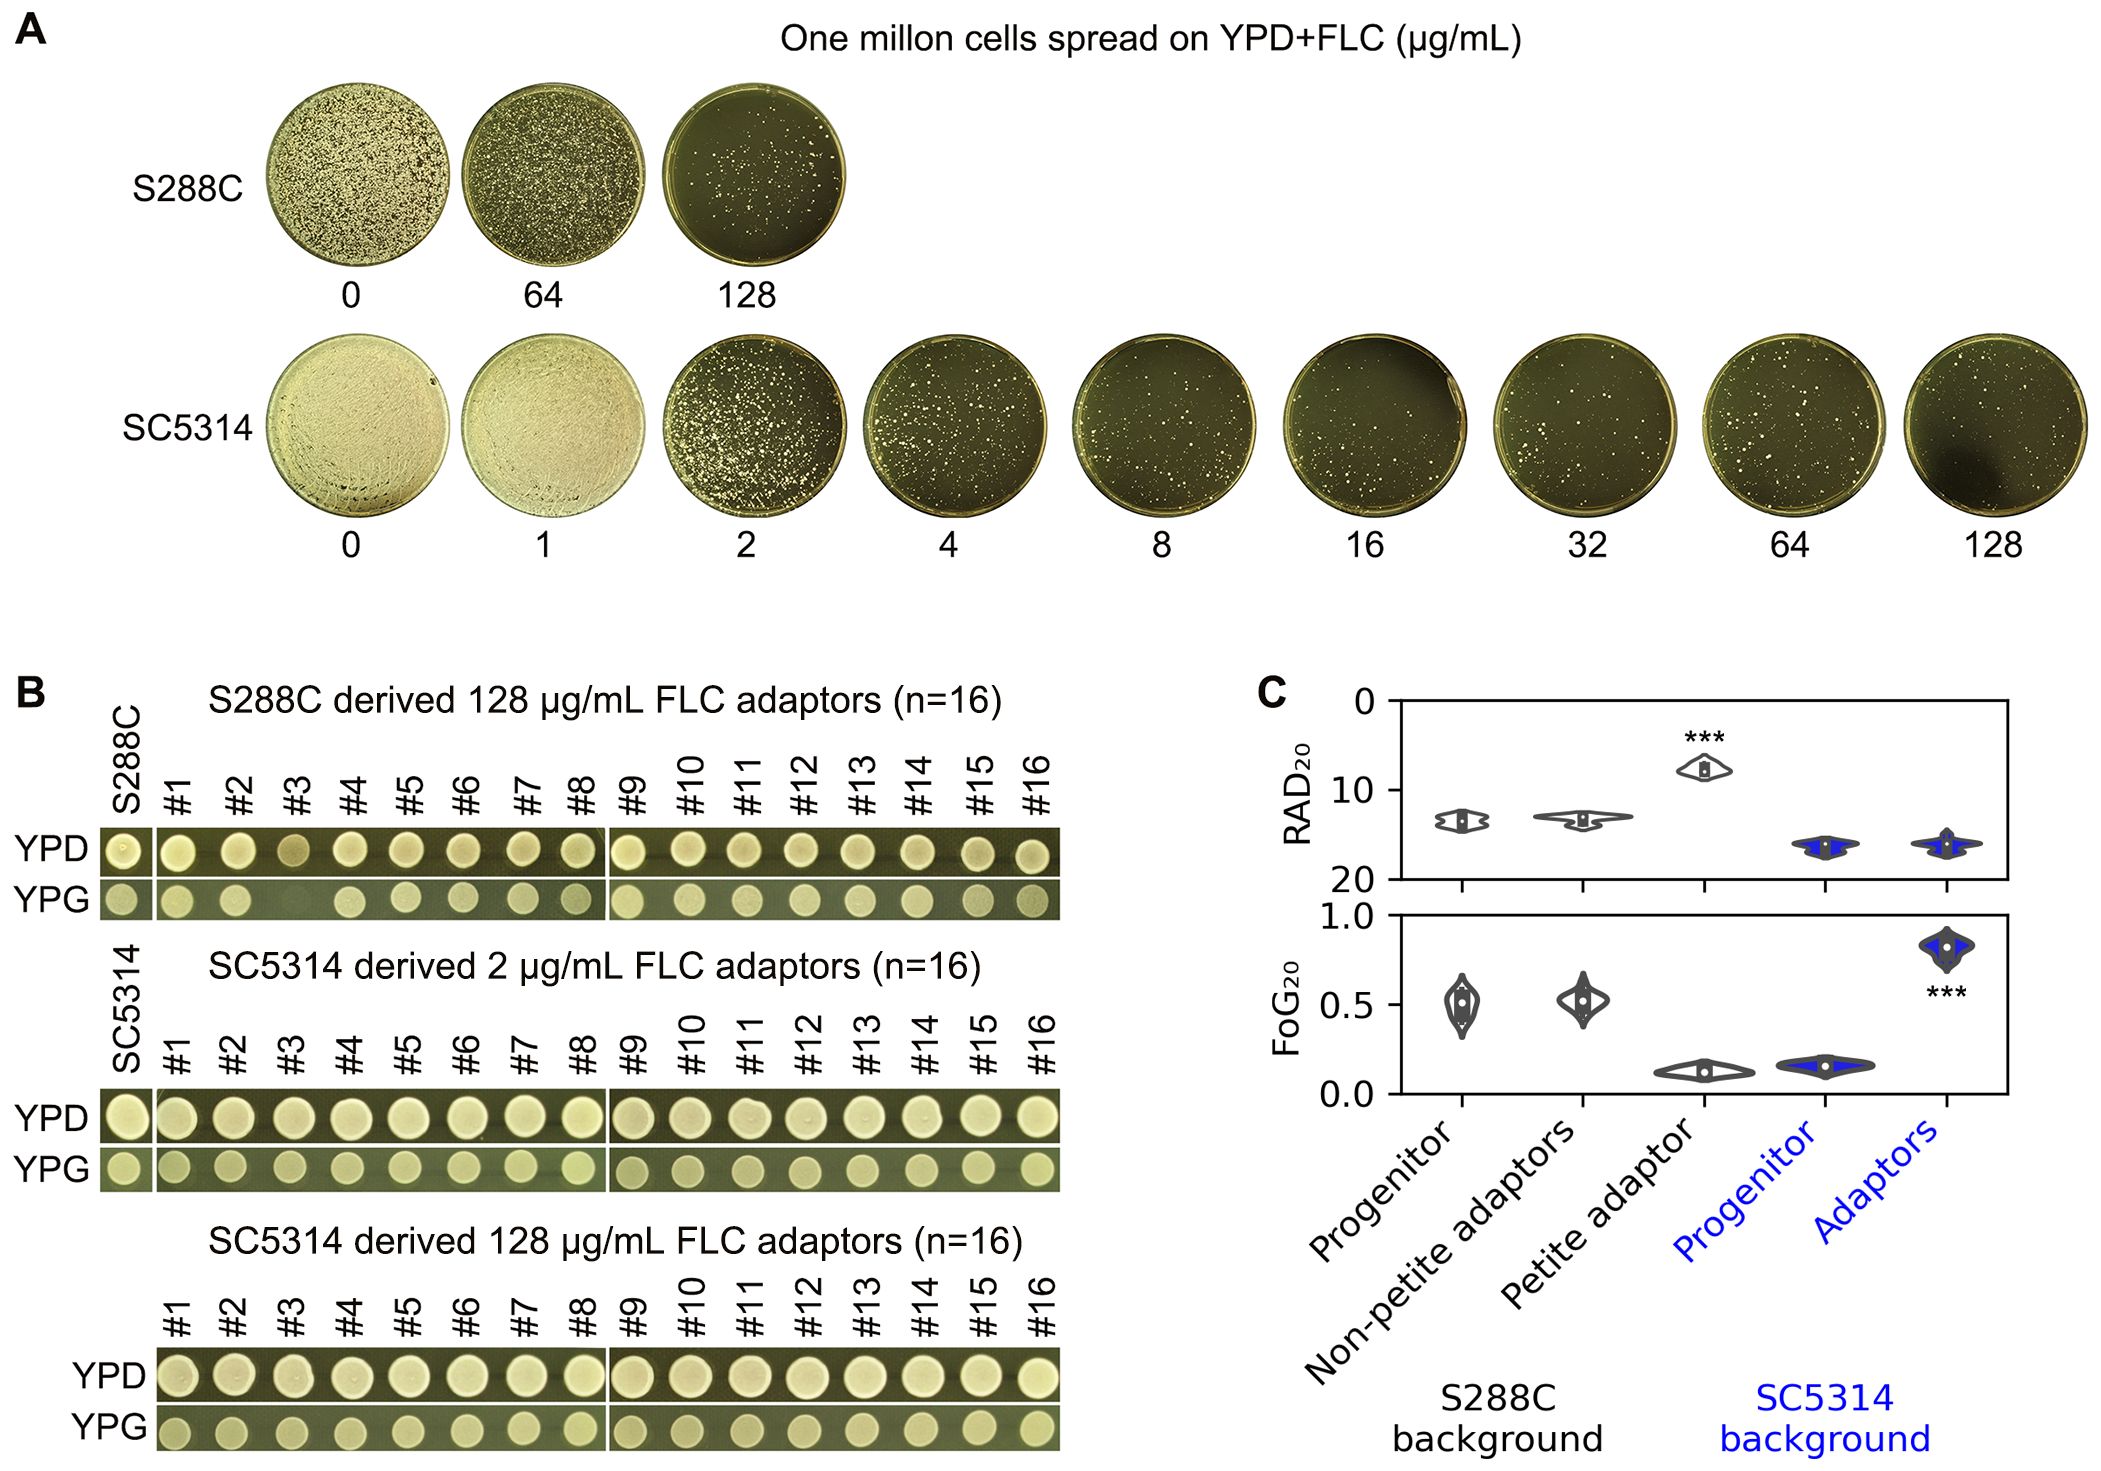
Figure 4. Adaptation of S. cerevisiae and C. albicans reference strains to fluconazole. (A) Approximately one million cells of S288C and SC5314 were spread on YPD-agar plates containing FLC. The drug concentrations are indicated in the figure. The plates were incubated at 37°C for S288C and at 30°C for SC5314 for 5 days. (B) Sixteen colonies of S. cerevisiae were randomly selected from the 128 μg/mL FLC plate, and 16 colonies of C. albicans were chosen from both the 2 and 128 μg/mL FLC plates, respectively. The adaptors were then spotted on YPD and YPG plates, which were photographed after 48 hours of growth. (C) A disk diffusion assay was conducted using 200 μg of FLC. For both progenitors and the petite adaptor, eight individual colonies were tested. The mean RAD20 and FoG20 values from eight biological replicates are presented for the progenitors and petite adaptor, along with the means of three biological replicates for the other adaptors. *** indicates p < 0.001 compared to the progenitor.
For S288C, we randomly selected 16 colonies (hereafter designated as FLC adaptors) from the plate treated with 128 μg/mL FLC. For SC5314, we randomly picked 16 adaptors from both the 2 μg/mL and 128 μg/mL FLC plates. When tested for growth ability on YPG, one adaptor derived from S288C failed to grow, while all other adaptors did (Figure 4B).
The disk diffusion assay indicated that the petite adaptor derived from S288C had significantly reduced RAD20 values and decreased FoG20 values compared to S288C (p<0.001, two-tailed Student’s t-test), whereas the other adaptors derived from S288C did not exhibit significant changes in RAD20 or FoG20 values. In contrast, all adaptors derived from SC5314 showed significantly increased FoG20 values (p<0.001, two-tailed Student’s t-test) (Figure 4C).
In addition to S288C, we evaluated how a clinical isolate of S. cerevisiae adapted to FLC. Unlike S288C, whose tolerance to FLC was influenced by temperature, the clinical isolate MK288 exhibited no tolerance at either 30°C or 37°C (Figure 5A). Approximately one million cells of MK288 were spread on YPD-agar plates containing FLC. From the plates with 8-32 μg/mL FLC, 16 colonies were randomly selected from each concentration (Figure 5B). While the progenitor could grow on YPG, none of the adaptors were able to do so, indicating that all adaptors were petite (Figure 5C). The disk diffusion assay revealed that all adaptors had significantly reduced RAD20 values compared to the progenitor (p<0.001, two-tailed Student’s t-test), while FoG20 values showed no significant changes (Figure 5D). Thus, MK288 adapted to FLC primarily through petite formation and the development of resistance
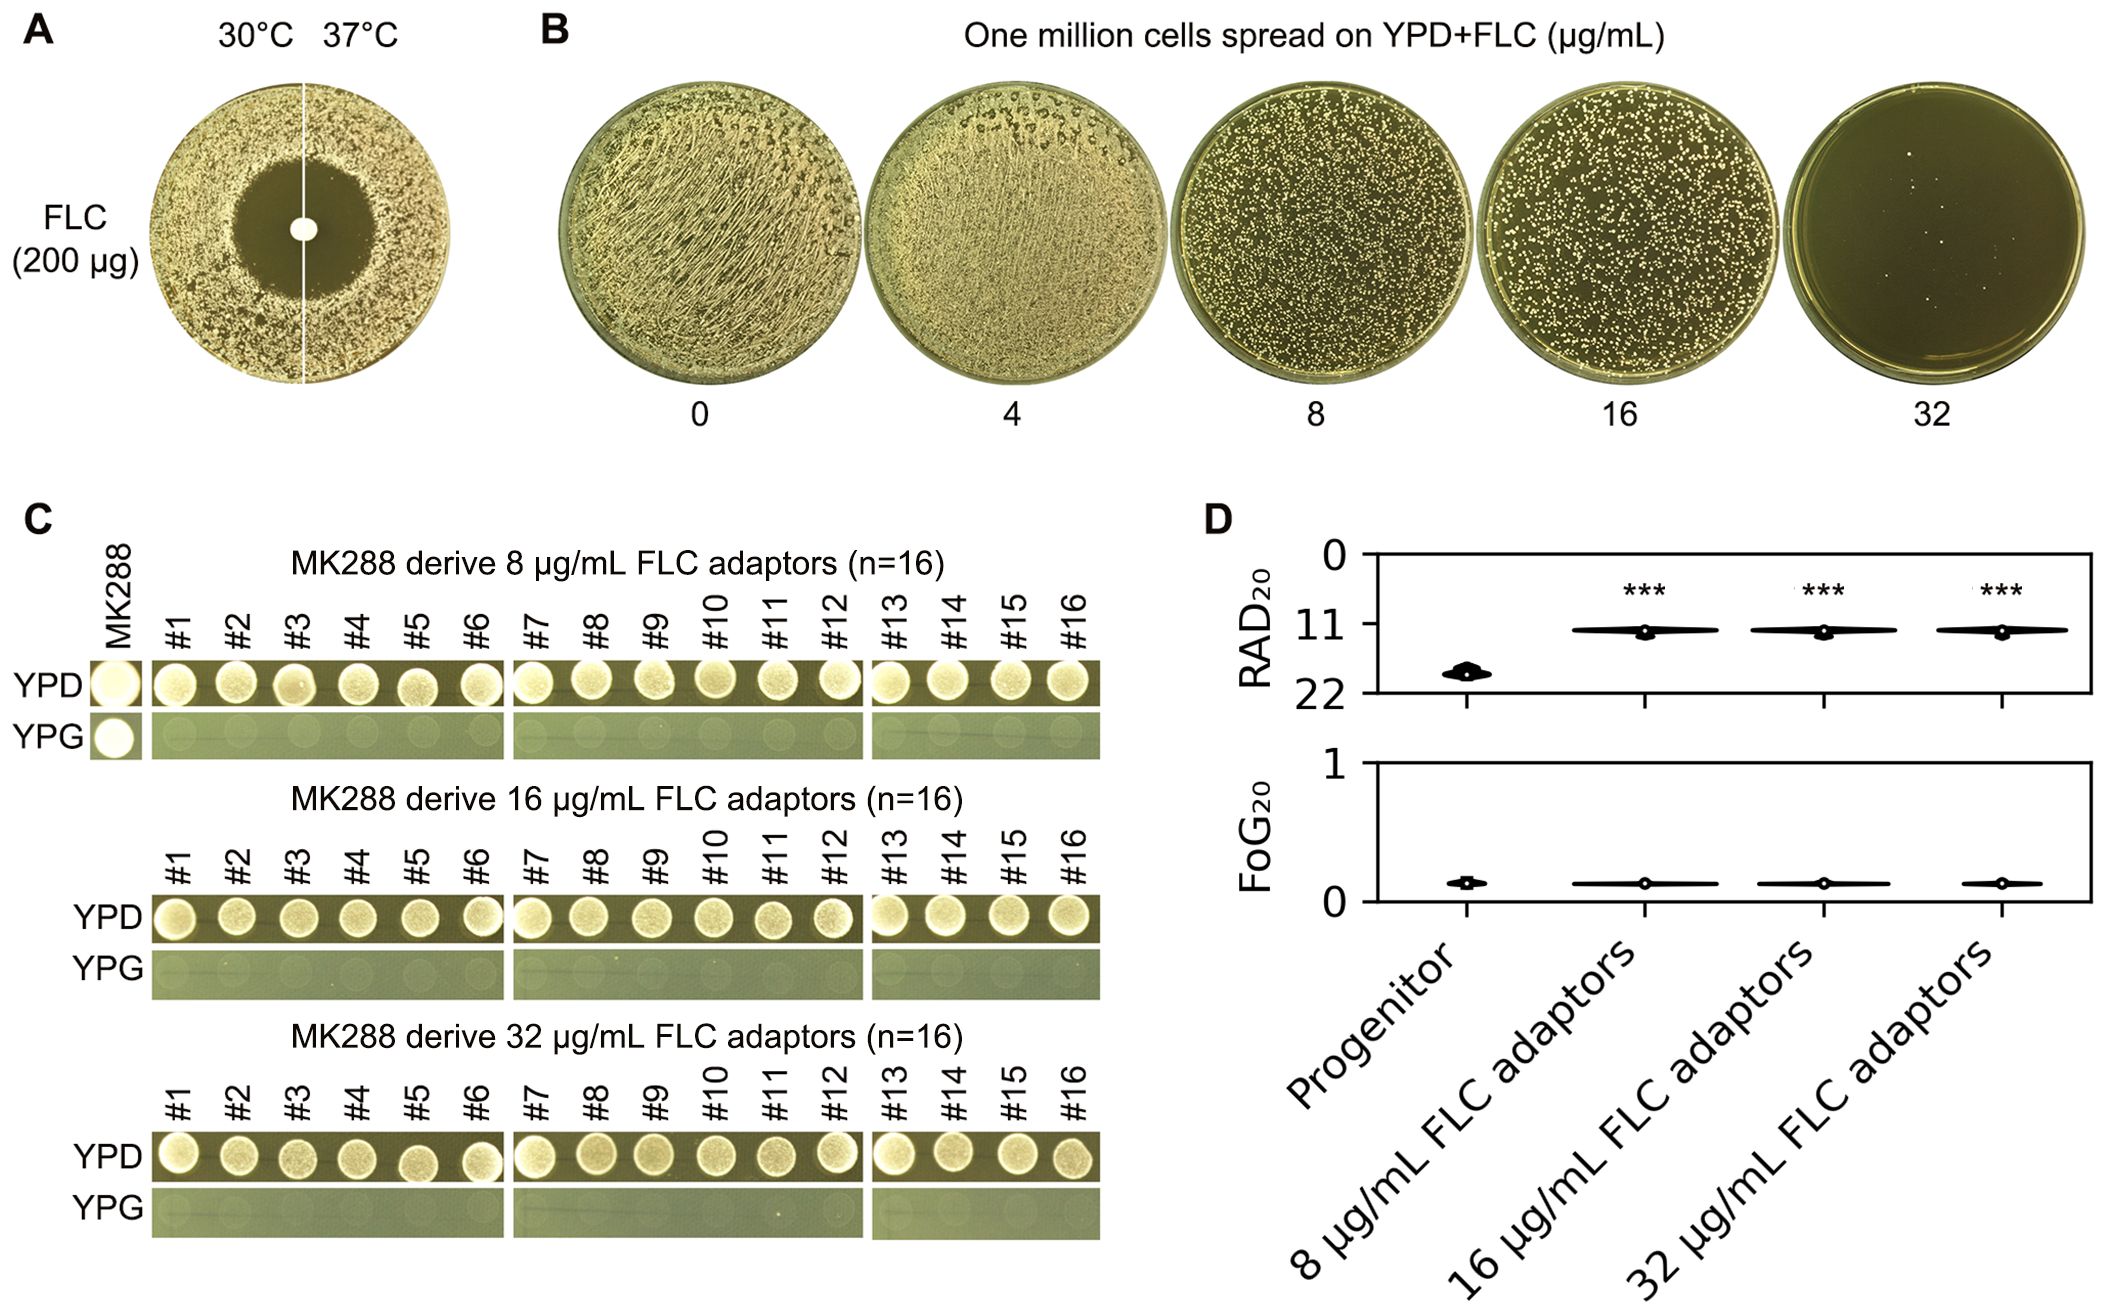
Figure 5. Adaptation of a clinical S. cerevisiae isolate to fluconazole. (A) The clinical isolate MK288 was evaluated using a disk diffusion assay with disks containing 200 μg of FLC. Two incubation temperatures were tested: 30°C and 37°C. The plates were incubated at the designated temperatures for 48 hours before being photographed. (B) Approximately one million cells of MK288 were spread on YPD-agar plates containing 4-32 μg/mL FLC, and the plates were incubated at 30°C for 5 days. Sixteen colonies (adaptors) were randomly selected from each plate containing 8-32 μg/mL FLC. (C) The progenitor MK288 and the FLC adaptors were spotted on YPD and YPG-agar plates. Strains were adjusted to 1 × 10⁷ cells/mL, and 3 μL was spotted onto the plates. The plates were incubated at 30°C for 48 hours before being photographed. (D) The progenitor and FLC adaptors were also assessed using a disk diffusion assay with disks containing 200 μg of FLC. RAD20 and FoG20 values were calculated using the diskImageR package. For the progenitor, eight individual colonies were tested as biological replicates, while three colonies representing three biological replicates were tested for each adaptor. Mean values are shown. *** indicates p < 0.001 compared to the progenitor.
In summary, FLC primarily induces resistance in S. cerevisiae and tolerance in C. albicans. The resistant S. cerevisiae adaptors are petite, whereas the tolerant C. albicans adaptors are not.
Loss of fluconazole tolerance in S288C due to ethidium bromide-induced petite formation: a contrast with SC5314
From the above experiments, we observed that S288C, which was initially tolerant to FLC, lost its tolerance after becoming petites upon exposure to FLC. To further investigate the requirement for intact mitochondrial respiratory function in relation to FLC tolerance, we employed an alternative method to induce petite formation. Ethidium bromide (EtBr) is known to inhibit mitochondrial DNA synthesis and induce the degradation of pre-existing mitochondrial DNA, thereby converting respiratory-sufficient yeast into respiratory-deficient petites (Goldring et al., 1970). S288C was cultured in YPD medium containing EtBr, and after a single passage, 16 random colonies were selected for analysis. None of these colonies were able to grow on YPG (Figure 6A), which is consistent with previous reports indicating that even short-term exposure to EtBr is sufficient to induce petite formation in Saccharomyces cerevisiae (Fox et al., 1991). In contrast, SC5314 was grown in YPD medium supplemented with EtBr for 20 passages, and all 16 randomly chosen colonies retained the ability to grow on YPG. This finding supports the notion that C. albicans exhibits a low propensity for petite formation (Chen and Clark-Walker, 2000). Disk diffusion assays demonstrated that all EtBr-evolved petite progeny derived from S288C exhibited clear and reduced ZOI, whereas the EtBr-evolved progeny of SC5314 showed lawn growth within the ZOI (Figure 6B). Quantitative measurements indicated that the S288C-derived progeny had significantly decreased levels of FoG20 and RAD20 compared to S288C (p<0.001, two-tailed Student’s t-test), while the SC5314-derived progeny did not show significant changes in FoG20 or RAD20 when compared to SC5314 (p>0.05, two-tailed Student’s t-test) (Figure 6C). Therefore, exposure to EtBr alone does not alter FLC susceptibility; rather, the resulting mitochondrial respiratory deficiency leads to a loss of FLC tolerance and an acquisition of FLC resistance.
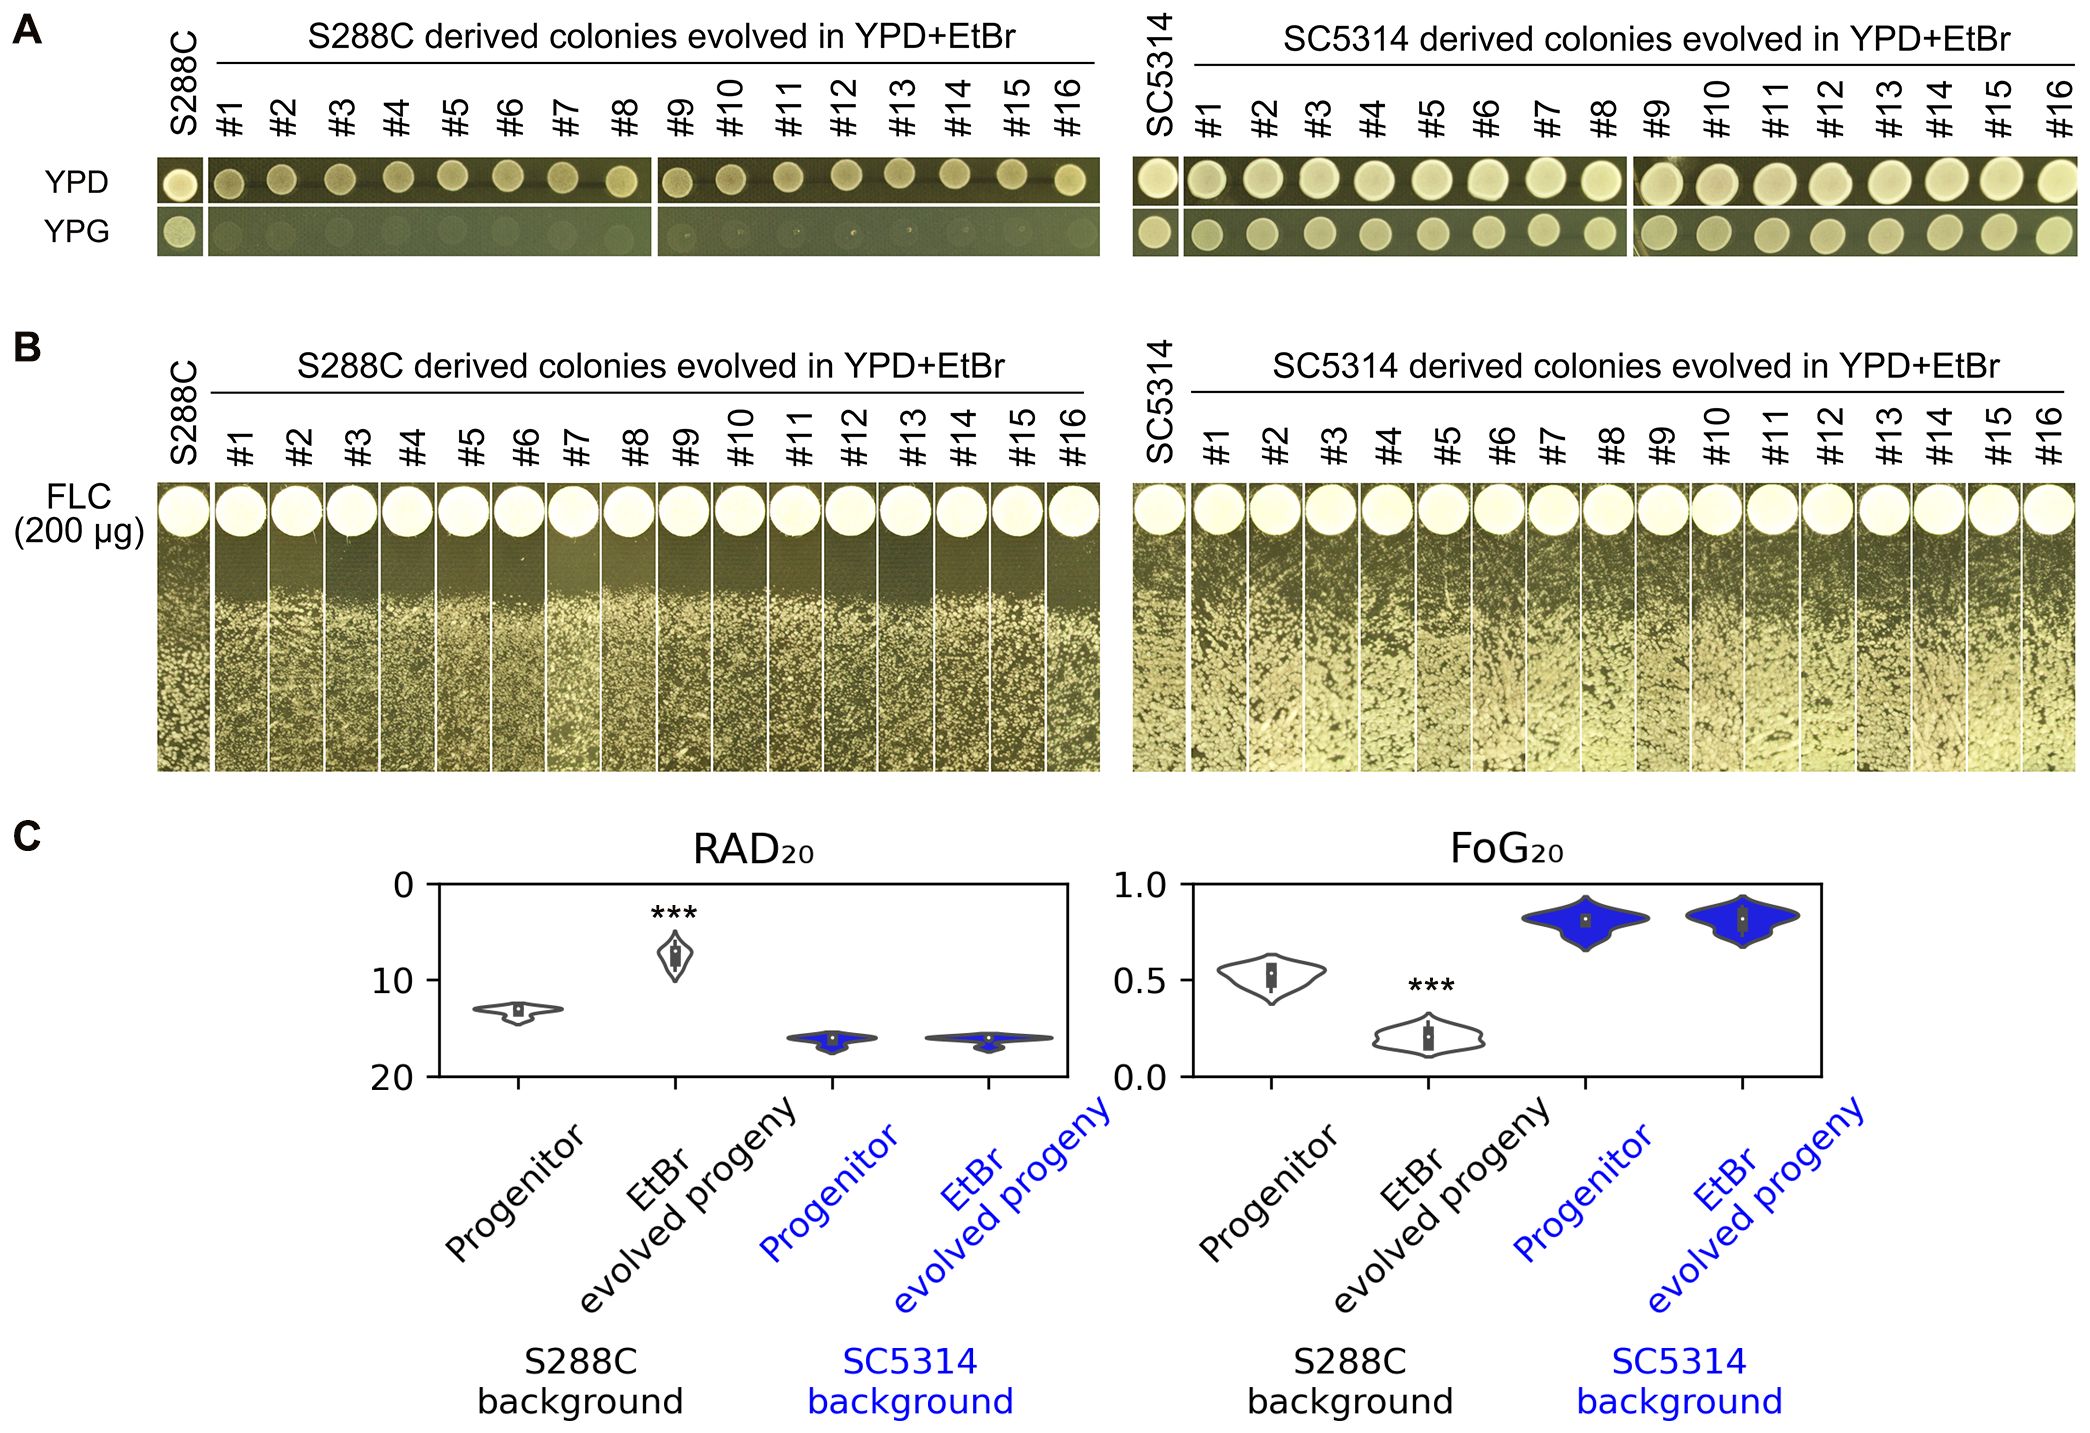
Figure 6. Impact of Ethidium Bromide on Fluconazole Tolerance and Resistance. (A) S288C and SC5314 strains were passaged in YPD media supplemented with EtBr. The resulting progeny was then spotted onto YPD and YPG plates to assess respiratory deficiency. (B) The progeny evolved from EtBr exposure were subjected to a disk diffusion assay using disks containing 200 μg of FLC to evaluate their sensitivity to the drug. (C) Quantification of the disk diffusion assay results was performed using the diskImageR package. For parental strains, eight individual colonies were analyzed as biological replicates, while three individual colonies were assessed for each progeny. Statistical significance is indicated by *** (p < 0.001) when compared to the progenitor strains.
Regulation of fluconazole resistance and tolerance by petites via efflux and ergosterol biosynthesis genes
We conducted investigation into the mechanisms behind the association of petite formation with a loss of FLC tolerance, characterized by a decrease in FoG20 levels, as well as an increase in FLC resistance, indicated by diminished RAD20. To delve deeper into this phenomenon, we performed a comparative analysis of the transcriptomes from one type of petite that was induced by FLC and another that was induced by EtBr, juxtaposing these profiles with those of the parental strain, S288C.
Our findings revealed a significant up-regulation of numerous efflux genes within both categories of petites throughout the genome. Notable examples of these up-regulated genes include PDR1, PDR5, PRR8, PDR10, PDR15, and PDR18, all of which are known to play critical roles in drug efflux and cellular detoxification. In stark contrast, we observed that only a small subset of efflux transporters, namely PDR12 and PDR16, exhibited down-regulation. Meanwhile, PDR3, PDR11, and PDR17 did not show any differential expression compared to the parental strain (Figure 7, top panel).
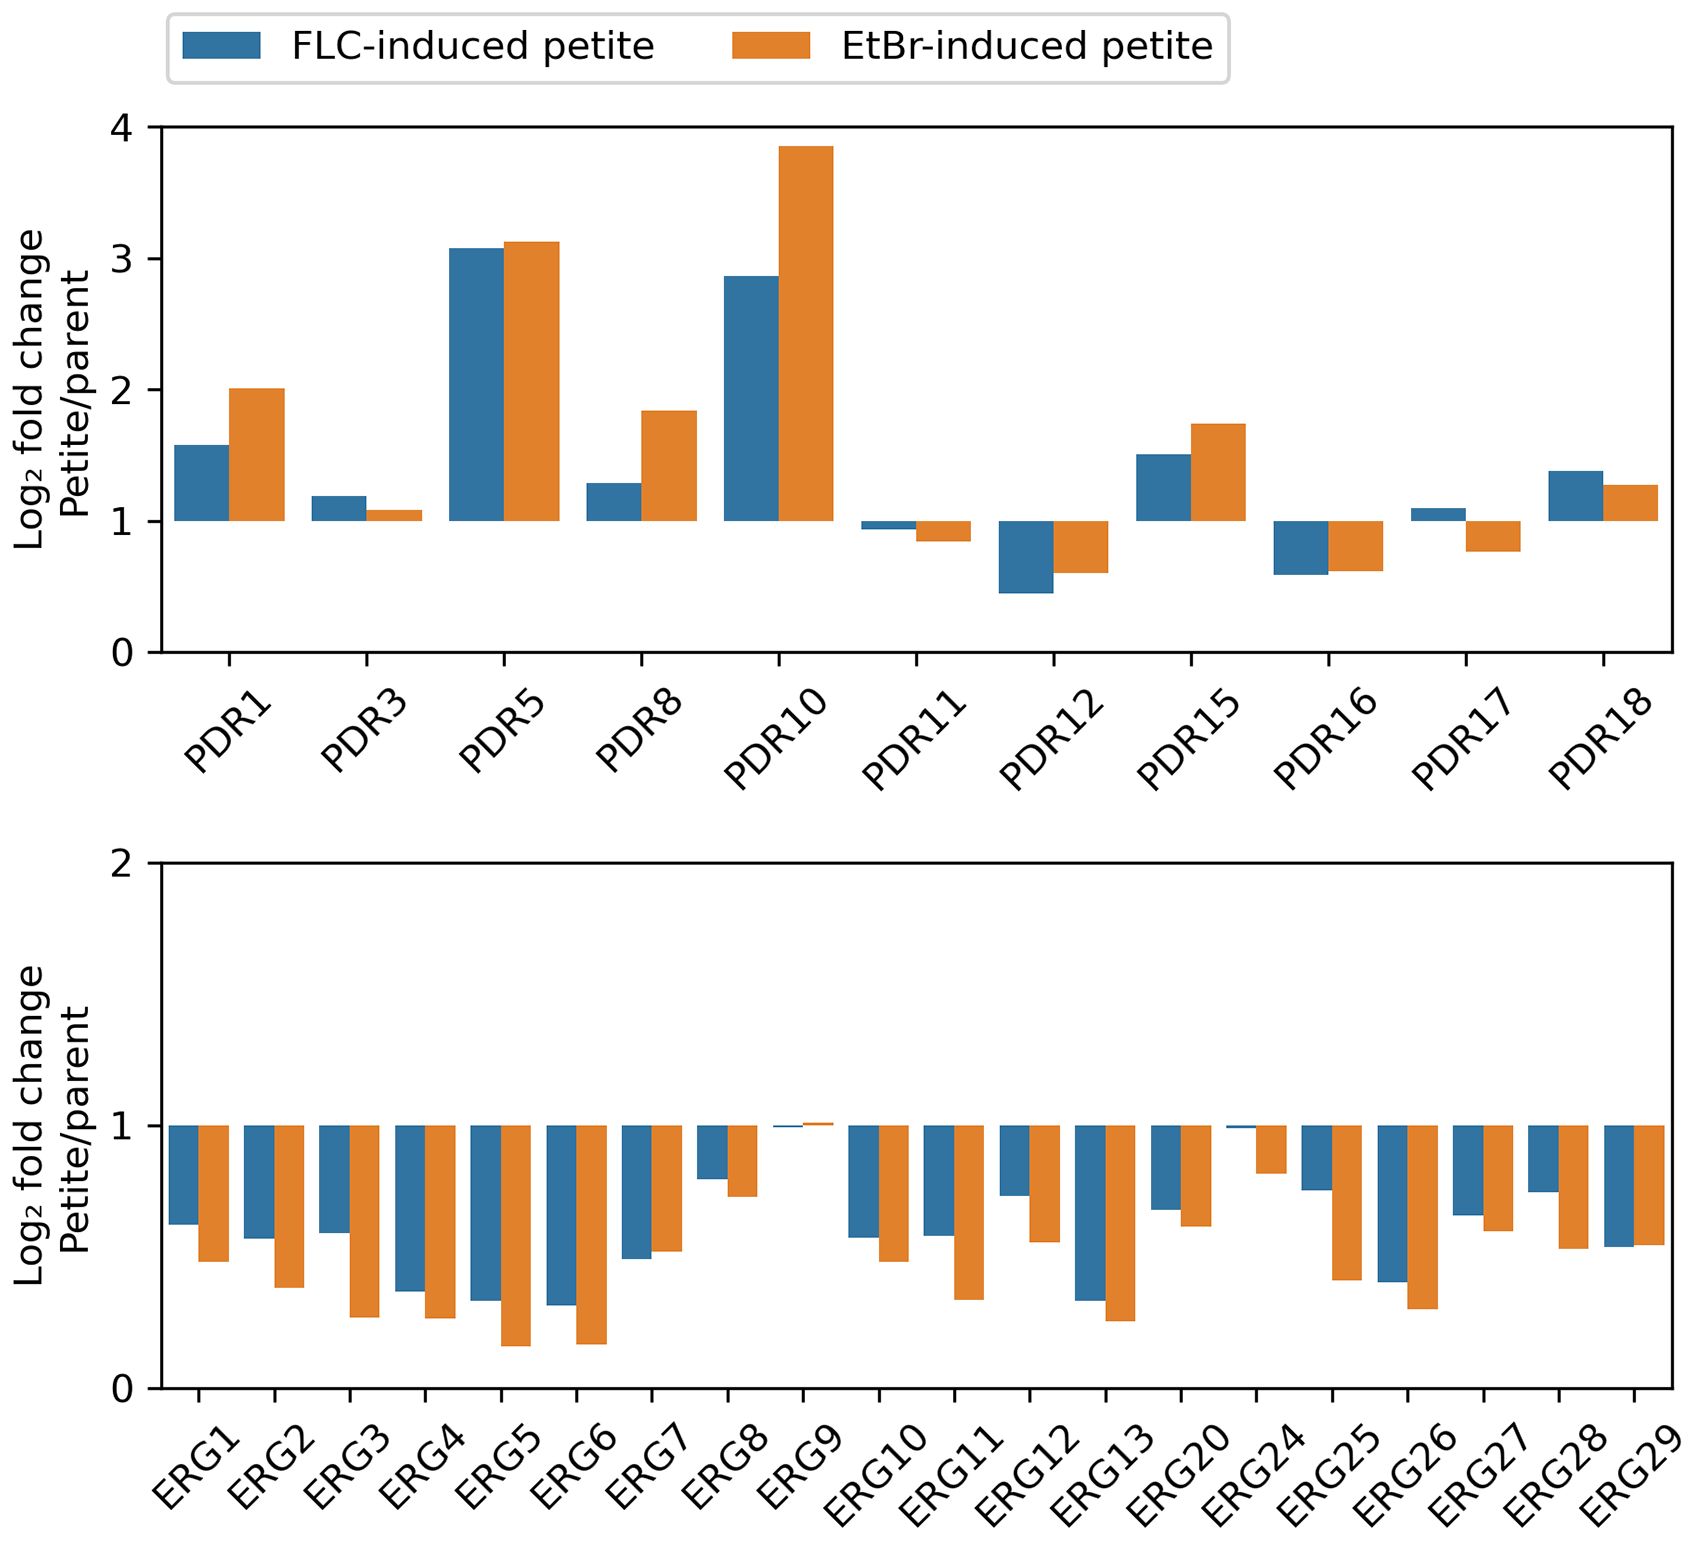
Figure 7. Relative Expression of Selected Genes in Petite and Wild-Type Strains The transcriptomes of two petites, derived from S288C through exposure to FLC and EtBr, respectively, were compared to that of parental strain. The figure displays the relative expressions of efflux genes (top panel) and ERG genes (bottom panel).
On the other hand, the majority of genes involved in the ergosterol biosynthetic pathway—referred to as ERG genes—demonstrated a pronounced down-regulation across both types of petites. This included key genes such as ERG1, ERG2, ERG3, ERG4, ERG5, ERG6, ERG7, ERG8, ERG10, ERG11, ERG12, ERG13, ERG20, ERG25, ERG26, ERG27, ERG28, and ERG29, all of which are integral to the synthesis of ergosterol. Only two ERG genes, ERG9 and ERG24, did not exhibit any significant changes in expression levels. Importantly, none of the ERG genes were found to be up-regulated in either petite type, further highlighting the distinct gene expression patterns associated with petite formation (Figure 7, bottom panel).
To further validate these observations, we measured rhodamine 6G efflux, a key indicator of efflux pump activity. Both FLC-induced and EtBr-induced petites exhibited significantly higher rhodamine 6G efflux compared to the parental strain S288C (p < 0.001, Tukey HSD test) (Figure 8A). This result aligns with the up-regulation of efflux genes in petites and supports the hypothesis that enhanced efflux activity contributes to drug resistance in these strains.
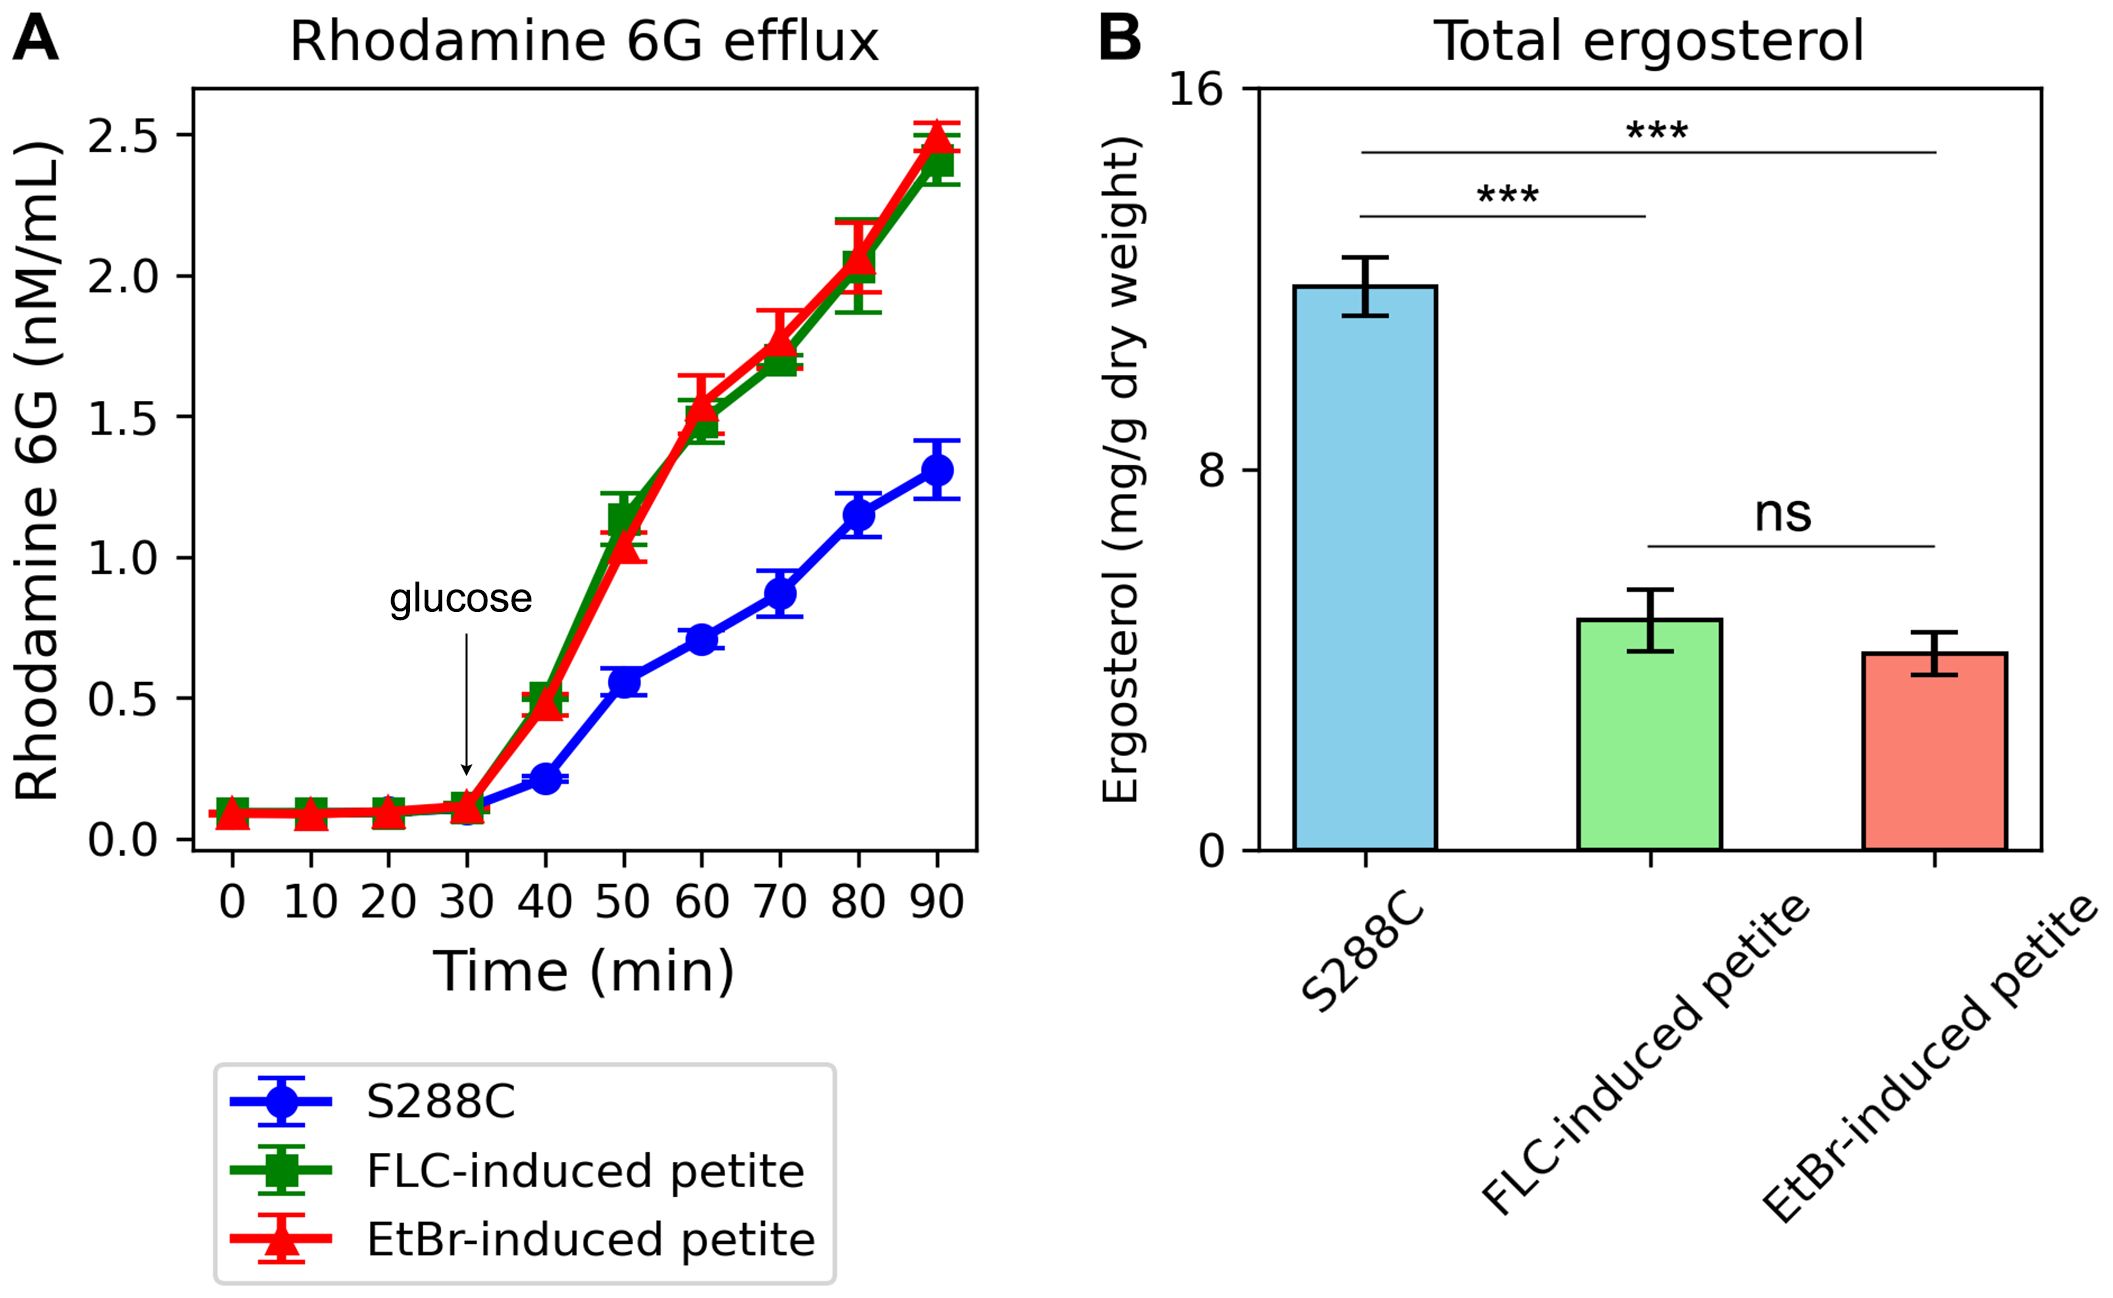
Figure 8. Rhodamine 6G Efflux and Total Ergosterol Content in Petite Strains Compared to the Parental Strain S288C. (A) The graph shows the efflux of rhodamine 6G over time in FLC-induced petites, EtBr-induced petites, and the parental strain S288C. The x-axis represents time (in minutes), and the y-axis represents the concentration of rhodamine 6G (in nM/mL) in the supernatant. Both petite strains exhibit higher rhodamine 6G efflux compared to S288C, as indicated by the increased fluorescence in the supernatant over time. Error bars represent the standard deviation of triplicate measurements. (B) The bar graph compares the total ergosterol content in FLC-induced petites, EtBr-induced petites, and S288C. The y-axis represents the total ergosterol content (in arbitrary units), and the x-axis labels the three strains. Both petite strains show lower ergosterol levels compared to S288C. Error bars represent the standard deviation of triplicate measurements. ***indicates p<0.001 in comparison to progenitor. ns, not significant.
Additionally, we quantified total ergosterol content in the petites and the parental strain. Consistent with the down-regulation of ERG genes, both FLC-induced and EtBr-induced petites displayed significantly lower total ergosterol levels compared to S288C (p < 0.001, two-tailed Student’s t-test) (Figure 8B). This reduction in ergosterol content further underscores the disruption of membrane biosynthesis in petites and its potential role in altering cellular responses to antifungal agents.
Overall, our study sheds light on the genetic underpinnings that contribute to the altered sensitivities to FLC observed in petite strains, emphasizing the crucial role of up-regulation of efflux genes and the down-regulation of ergosterol biosynthesis in this context.
Discussion
This study presents a comparative analysis of how S. cerevisiae (S288C) and C. albicans (SC5314) adapt to FLC. Our findings indicate that FLC tolerance in both yeasts is temperature-dependent but inversely; C. albicans shows tolerance at 37°C and not at 30°C, while S. cerevisiae is tolerant at 30°C but loses this tolerance at 37°C. Unlike C. albicans, S. cerevisiae primarily develops resistance rather than tolerance to elevated FLC concentrations, with all resistant variants identified as petites. EtBr-induced petites also lost FLC tolerance and gained resistance, exhibiting up-regulation of efflux genes responsible for antifungal export and down-regulation of ergosterol biosynthesis genes. These results suggest that maintaining intact mitochondria is crucial for preserving FLC tolerance in S. cerevisiae.
A comparative study between C. albicans and S. cerevisiae is essential for several reasons. First, while both are yeast species, they belong to different genera and exhibit distinct biological and pathogenic characteristics; C. albicans is a significant human pathogen, whereas S. cerevisiae is commonly used as a model organism in research and baking. Studying these two species allows researchers to identify the specific mechanisms of antifungal adaptation that C. albicans employs in response to treatments like fluconazole, which may differ from the more limited mechanisms observed in S. cerevisiae. Additionally, insights gained from this comparison can shed light on the evolutionary pressures shaping pathogenic versus non-pathogenic yeasts, enhancing our understanding of fungal biology and informing the development of targeted antifungal therapies. Finally, findings from such studies can contribute to broader knowledge regarding microbial adaptation strategies, benefiting clinical practices and public health responses.
It is intriguing that temperature modulates intrinsic FLC tolerance in opposing ways for S. cerevisiae and C. albicans, given their different ecological niches and typical incubation conditions. S. cerevisiae is generally cultured at 30°C, where it demonstrates tolerance to FLC, while C. albicans, a human pathogen that inhabits the human body, typically encounters temperatures around 37°C, showing tolerance only at this higher temperature. This contrast highlights the adaptive strategies of these yeasts in response to their respective environments and underscores the importance of temperature as a factor influencing antifungal susceptibility and resistance mechanisms. Understanding these dynamics can provide valuable insights into how pathogenic yeasts adapt to host conditions and develop tolerance to antifungal treatments.
Despite the contrasting effects of temperature on FLC tolerance in S. cerevisiae and C. albicans, our study reveals that both species require calcineurin and Hsp90 for maintaining intrinsic FLC tolerance. This indicates a fundamental similarity in the molecular mechanisms underlying antifungal tolerance, despite the differences in their ecological niches and growth conditions. Calcineurin, a calcium/calmodulin-dependent phosphatase, plays a critical role in cellular signaling pathways that respond to stress, particularly in adaptation to high-temperature environments and certain antifungal agents. Its function is essential for modulating gene expression related to stress responses and maintaining cellular homeostasis under adverse conditions (Sanglard et al., 2003; Cowen, 2013). Similarly, Hsp90, a well-known chaperone protein, assists in the proper folding and stabilization of many client proteins involved in signal transduction and stress response pathways. In both yeasts, Hsp90 helps ensure that key proteins remain functional under stress, contributing to the overall resilience against antifungal treatments (Cowen and Lindquist, 2005; Cowen et al., 2006). The shared reliance on these two proteins suggests that regardless of the specific environmental pressures faced by S. cerevisiae and C. albicans, there are conserved biological pathways that facilitate intrinsic tolerance to FLC. This finding enhances our understanding of the evolutionary strategies employed by these fungi to survive antifungal challenges and highlights potential targets for therapeutic interventions. By focusing on these common pathways, we may develop more effective antifungal strategies that can mitigate tolerance in both pathogenic and non-pathogenic yeasts. Ultimately, this comparative perspective underscores the importance of studying diverse fungal species to gain insights into broader mechanisms of antifungal tolerance and adaptability.
In contrast to S. cerevisiae, where the formation of petites occurs relatively frequently, this phenomenon is notably rare in C. albicans. Although petite formation can be induced under specific conditions in C. albicans, it generally requires more stringent circumstances than in S. cerevisiae, making its occurrence uncommon (Chen and Clark-Walker, 2000; Geraghty and Kavanagh, 2003; Cheng et al., 2007a, Cheng et al., 2007b). Our study further elucidates this distinction by demonstrating that none of the FLC-tolerant adaptors derived from C. albicans are petites. In stark contrast, all of the FLC-resistant adaptors obtained from S. cerevisiae are petites. This significant finding underscores the differences between these two species not only in their capacity to form petites but also in their propensity to develop such adaptations in response to various stresses, including exposure to FLC.
The rarity of petite formation in C. albicans suggests a more robust mitochondrial integrity and function compared to S. cerevisiae, which may contribute to its survival strategies within the human host environment. This difference could indicate that C. albicans has evolved alternative mechanisms to cope with antifungal stress, relying on pathways other than those involving petite formation. Meanwhile, the frequent occurrence of petites in S. cerevisiae highlights its ability to generate metabolic diversity through mitochondrial dysfunction, enabling adaptation under stressful conditions, including drug exposure.
When petites do arise in yeast, they often confer resistance to FLC through the up-regulation of efflux genes (Henry et al., 2000; Florio et al., 2011; Gnat et al., 2021). Consistent with this, our findings revealed that both FLC- and EtBr-induced petites exhibited increased expression of multiple efflux genes, including PDR1, PDR5, PRR8, PDR10, PDR15, and PDR18. However, we also observed the downregulation of a small subset of efflux-related genes, most notably PDR12 and PDR16. The downregulation of PDR16 is particularly noteworthy, as its deletion has been previously demonstrated to increase azole susceptibility in S. cerevisiae. PDR16 is involved in lipid homeostasis and membrane composition, which are critical for the proper localization and function of efflux pumps such as PDR5 (Holic et al., 2014). In the context of petites, the downregulation of PDR16 may reflect a broader disruption of lipid metabolism and membrane dynamics associated with mitochondrial dysfunction. While PDR16 downregulation would typically be expected to increase azole susceptibility, the concurrent upregulation of other efflux transporters (e.g., PDR5, PDR10, and PDR15) in petites may compensate for this effect, leading to the observed increase in FLC resistance. This suggests a complex interplay between lipid metabolism, efflux pump activity, and drug resistance in petites.
Typically, exposure to FLC promotes the expression of ergosterol biosynthesis genes (ERG genes) in fungi (Henry et al., 2000; Florio et al., 2011; Gnat et al., 2021). However, our study indicates that petites display reduced expression of most ERG genes, including ERG11, which encodes the target protein of FLC. We propose that sufficient levels of ergosterol are essential for maintaining FLC tolerance, suggesting a critical link between ergosterol biosynthesis and antifungal susceptibility in S. cerevisiae. This highlights the unique mechanisms of adaptation in these yeasts and the potential implications for antifungal treatment strategies.
Conclusion
In conclusion, our results underscore the opposite impact of temperature on FLC tolerance in S. cerevisiae and C. albicans; while elevated temperatures adversely affected S. cerevisiae, they appeared to enhance FLC tolerance in C. albicans. This study highlights the distinct evolutionary responses to FLC in S. cerevisiae compared to previous findings in C. albicans. We observed that rapid petite formation in S. cerevisiae resulted in the up-regulation of efflux genes and the down-regulation of ERG genes, which likely contributed to a gain in FLC resistance while simultaneously leading to a loss of FLC tolerance. Given the shifting epidemiology of candidemia to include an increasing number of NAC species, it is crucial to further characterize FLC tolerance within these NAC species. Understanding these dynamics will be vital for developing effective treatment strategies and addressing the challenges posed by antifungal resistance in diverse fungal pathogens.
Data availability statement
The data presented in the study are deposited in the ArrayExpress repository, accession number E-MTAB-14553.
Author contributions
LZ: Data curation, Formal analysis, Investigation, Methodology, Validation, Writing – review & editing. YD: Formal analysis, Investigation, Methodology, Validation, Visualization, Writing – review & editing. JW: Investigation, Visualization, Writing – review & editing. YJ: Investigation, Validation, Visualization, Writing – review & editing. WW: Investigation, Validation, Writing – review & editing. YX: Investigation, Validation, Writing – review & editing. LG: Conceptualization, Funding acquisition, Project administration, Resources, Supervision, Writing – original draft, Writing – review & editing.
Funding
The author(s) declare that financial support was received for the research and/or publication of this article. This study was supported by the Science and Technology Development Plan of Suzhou (SLJ2022018), and Scientific Research Project of Suzhou Commission of Health (GSWS2020028) to LG, the National Natural Science Foundation of China (81402978), Natural Science Foundation of Shandong Province (ZR2023MH227), Medical and Health Science and Technology Project of Shandong Province (202402041035) to YX, Medical and Health Science and Technology Project of Shandong Province (202302041726) to YD.
Conflict of interest
The authors declare that the research was conducted in the absence of any commercial or financial relationships that could be construed as a potential conflict of interest.
Generative AI statement
The author(s) declare that no Generative AI was used in the creation of this manuscript.
Publisher’s note
All claims expressed in this article are solely those of the authors and do not necessarily represent those of their affiliated organizations, or those of the publisher, the editors and the reviewers. Any product that may be evaluated in this article, or claim that may be made by its manufacturer, is not guaranteed or endorsed by the publisher.
References
Balaban, N. Q., Helaine, S., Lewis, K., Ackermann, M., Aldridge, B., Andersson, D. I., et al. (2019). Definitions and guidelines for research on antibiotic persistence. Nat. Rev. Microbiol 17, 441–448. doi: 10.1038/s41579-019-0196-3
Berman, J., Krysan, D. J. (2020). Drug resistance and tolerance in fungi. Nat. Rev. Microbiol 18, 319–331. doi: 10.1038/s41579-019-0322-2
Bongomin, F., Gago, S., Oladele, R. O., Denning, D. W. (2017). Global and multi-national prevalence of fungal diseases-estimate precision. J. Fungi (Basel) 3. doi: 10.3390/jof3040057
Brun, S., Berges, T., Poupard, P., Vauzelle-Moreau, C., Renier, G., Chabasse, D., et al. (2004). Mechanisms of azole resistance in petite mutants of Candida glabrata. Antimicrob Agents Chemother. 48, 1788–1796. doi: 10.1128/AAC.48.5.1788-1796.2004
Chen, X. J., Clark-Walker, G. D. (2000). The petite mutation in yeasts: 50 years on. Int. Rev. Cytol 194, 197–238. doi: 10.1016/s0074-7696(08)62397-9
Cheng, S., Clancy, C. J., Nguyen, K. T., Clapp, W., Nguyen, M. H. (2007a). A Candida albicans petite mutant strain with uncoupled oxidative phosphorylation overexpresses MDR1 and has diminished susceptibility to fluconazole and voriconazole. Antimicrob Agents Chemother. 51, 1855–1858. doi: 10.1128/AAC.00182-07
Cheng, S., Clancy, C. J., Zhang, Z., Hao, B., Wang, W., Iczkowski, K. A., et al. (2007b). Uncoupling of oxidative phosphorylation enables Candida albicans to resist killing by phagocytes and persist in tissue. Cell Microbiol 9, 492–501. doi: 10.1111/j.1462-5822.2006.00805.x
Cleveland, A. A., Harrison, L. H., Farley, M. M., Hollick, R., Stein, B., Chiller, T. M., et al. (2015). Declining incidence of candidemia and the shifting epidemiology of Candida resistance in two US metropolitan areas 2008-2013: results from population-based surveillance. PloS One 10, e0120452. doi: 10.1371/journal.pone.0120452
Cowen, L. E. (2013). The fungal Achilles’ heel: targeting Hsp90 to cripple fungal pathogens. Curr. Opin. Microbiol 16, 377–384. doi: 10.1016/j.mib.2013.03.005
Cowen, L. E., Carpenter, A. E., Matangkasombut, O., Fink, G. R., Lindquist, S. (2006). Genetic architecture of Hsp90-dependent drug resistance. Eukaryot Cell 5, 2184–2188. doi: 10.1128/EC.00274-06
Cowen, L. E., Lindquist, S. (2005). Hsp90 potentiates the rapid evolution of new traits: drug resistance in diverse fungi. Science 309, 2185–2189. doi: 10.1126/science.1118370
Day, M. (2013). Yeast petites and small colony variants: for everything there is a season. Adv. Appl. Microbiol 85, 1–41. doi: 10.1016/B978-0-12-407672-3.00001-0
Delarze, E., Brandt, L., Trachsel, E., Patxot, M., Pralong, C., Maranzano, F., et al. (2020). Identification and characterization of mediators of fluconazole tolerance in candida albicans. Front. Microbiol 11. doi: 10.3389/fmicb.2020.591140
Demuyser, L., Van Dijck, P. (2019). Can Saccharomyces cerevisiae keep up as a model system in fungal azole susceptibility research? Drug Resist. Update 42, 22–34. doi: 10.1016/j.drup.2019.02.002
Fekete, V., Cierna, M., Polakova, S., Piskur, J., Sulo, P. (2007). Transition of the ability to generate petites in the Saccharomyces/Kluyveromyces complex. FEMS Yeast Res. 7, 1237–1247. doi: 10.1111/j.1567-1364.2007.00287.x
Fisher, M. C., Hawkins, N. J., Sanglard, D., Gurr, S. J. (2018). Worldwide emergence of resistance to antifungal drugs challenges human health and food security. Science 360, 739–742. doi: 10.1126/science.aap7999
Florio, A. R., Ferrari, S., De Carolis, E., Torelli, R., Fadda, G., Sanguinetti, M., et al. (2011). Genome-wide expression profiling of the response to short-term exposure to fluconazole in Cryptococcus neoformans serotype A. BMC Microbiol 11, 97. doi: 10.1186/1471-2180-11-97
Fox, T. D., Folley, L. S., Mulero, J. J., McMullin, T. W., Thorsness, P. E., Hedin, L. O., et al. (1991). Analysis and manipulation of yeast mitochondrial genes. Methods Enzymol. 194, 149–165. doi: 10.1016/0076-6879(91)94013-3
Geraghty, P., Kavanagh, K. (2003). Disruption of mitochondrial function in Candida albicans leads to reduced cellular ergosterol levels and elevated growth in the presence of amphotericin B. Arch. Microbiol 179, 295–300. doi: 10.1007/s00203-003-0530-y
Gerstein, A. C., Rosenberg, A., Hecht, I., Berman, J. (2016). diskImageR: quantification of resistance and tolerance to antimicrobial drugs using disk diffusion assays. Microbiol. (Reading) 162, 1059–1068. doi: 10.1099/mic.0.000295
Gnat, S., Lagowski, D., Dylag, M., Ptaszynska, A., Nowakiewicz, A. (2021). Modulation of ERG gene expression in fluconazole-resistant human and animal isolates of Trichophyton verrucosum. Braz. J. Microbiol 52, 2439–2446. doi: 10.1007/s42770-021-00585-1
Goldring, E. S., Grossman, L. I., Krupnick, D., Cryer, D. R., Marmur, J. (1970). The petite mutation in yeast. Loss of mitochondrial deoxyribonucleic acid during induction of petites with ethidium bromide. J. Mol. Biol. 52, 323–335. doi: 10.1016/0022-2836(70)90033-1
Guo, L., Zheng, L., Dong, Y., Wang, C., Deng, H., Wang, Z., et al. (2024). Miconazole induces aneuploidy-mediated tolerance in Candida albicans that is dependent on Hsp90 and calcineurin. Front. Cell Infect. Microbiol 14. doi: 10.3389/fcimb.2024.1392564
Henry, K. W., Nickels, J. T., Edlind, T. D. (2000). Upregulation of ERG genes in Candida species by azoles and other sterol biosynthesis inhibitors. Antimicrob Agents Chemother. 44, 2693–2700. doi: 10.1128/AAC.44.10.2693-2700.2000
Holic, R., Simova, Z., Ashlin, T., Pevala, V., Poloncova, K., Tahotna, D., et al. (2014). Phosphatidylinositol binding of Saccharomyces cerevisiae Pdr16p represents an essential feature of this lipid transfer protein to provide protection against azole antifungals. Biochim. Biophys. Acta 1842, 1483–1490. doi: 10.1016/j.bbalip.2014.07.014
Iyer, K. R., Robbins, N., Cowen, L. E. (2022). The role of Candida albicans stress response pathways in antifungal tolerance and resistance. iScience 25, 103953. doi: 10.1016/j.isci.2022.103953
Joseph-Horne, T., Hollomon, D. W. (1997). Molecular mechanisms of azole resistance in fungi. FEMS Microbiol Lett. 149, 141–149. doi: 10.1111/j.1574-6968.1997.tb10321.x
Kanafani, Z. A., Perfect, J. R. (2008). Antimicrobial resistance: resistance to antifungal agents: mechanisms and clinical impact. Clin. Infect. Dis. 46, 120–128. doi: 10.1086/524071
Ke, W., Xie, Y., Chen, Y., Ding, H., Ye, L., Qiu, H., et al. (2024). Fungicide-tolerant persister formation during cryptococcal pulmonary infection. Cell Host Microbe 32(276-289), e277. doi: 10.1016/j.chom.2023.12.012
Kolaczkowski, M., van der Rest, M., Cybularz-Kolaczkowska, A., Soumillion, J. P., Konings, W. N., Goffeau, A. (1996). Anticancer drugs, ionophoric peptides, and steroids as substrates of the yeast multidrug transporter Pdr5p. J. Biol. Chem. 271, 31543–31548. doi: 10.1074/jbc.271.49.31543
Kukurudz, R. J., Chapel, M., Wonitowy, Q., Adamu Bukari, A. R., Sidney, B., Sierhuis, R., et al. (2022). Acquisition of cross-azole tolerance and aneuploidy in Candida albicans strains evolved to posaconazole. G3 (Bethesda) 12. doi: 10.1093/g3journal/jkac156
Love, M. I., Huber, W., Anders, S. (2014). Moderated estimation of fold change and dispersion for RNA-seq data with DESeq2. Genome Biol. 15, 550. doi: 10.1186/s13059-014-0550-8
Madsen, K. M., Udatha, G. D., Semba, S., Otero, J. M., Koetter, P., Nielsen, J., et al. (2011). Linking genotype and phenotype of Saccharomyces cerevisiae strains reveals metabolic engineering targets and leads to triterpene hyper-producers. PloS One 6, e14763. doi: 10.1371/journal.pone.0014763
Mean, M., Marchetti, O., Calandra, T. (2008). Bench-to-bedside review: Candida infections in the intensive care unit. Crit. Care 12, 204. doi: 10.1186/cc6212
Pfaller, M. A., Diekema, D. J. (2007). Epidemiology of invasive candidiasis: a persistent public health problem. Clin. Microbiol Rev. 20, 133–163. doi: 10.1128/CMR.00029-06
Pfaller, M. A., Diekema, D. J., Gibbs, D. L., Newell, V. A., Bijie, H., Dzierzanowska, D., et al. (2009). Results from the ARTEMIS DISK Global Antifungal Surveillance Study 1997 to 2007: 10.5-year analysis of susceptibilities of noncandidal yeast species to fluconazole and voriconazole determined by CLSI standardized disk diffusion testing. J. Clin. Microbiol 47, 117–123. doi: 10.1128/JCM.01747-08
Pfaller, M. A., Diekema, D. J., Gibbs, D. L., Newell, V. A., Ellis, D., Tullio, V., et al. (2010). Results from the ARTEMIS DISK Global Antifungal Surveillance Study 1997 to 2007: a 10.5-year analysis of susceptibilities of Candida Species to fluconazole and voriconazole as determined by CLSI standardized disk diffusion. J. Clin. Microbiol 48, 1366–1377. doi: 10.1128/JCM.02117-09
Rasouli Koohi, S., Shankarnarayan, S. A., Galon, C. M., Charlebois, D. A. (2023). Identification and elimination of antifungal tolerance in candida auris. Biomedicines 11. doi: 10.3390/biomedicines11030898
Robbins, N., Wright, G. D., Cowen, L. E. (2016). Antifungal drugs: the current armamentarium and development of new agents. Microbiol Spectr. 4. doi: 10.1128/microbiolspec.FUNK-0002-2016
Rosenberg, A., Ene, I. V., Bibi, M., Zakin, S., Segal, E. S., Ziv, N., et al. (2018). Antifungal tolerance is a subpopulation effect distinct from resistance and is associated with persistent candidemia. Nat. Commun. 9, 2470. doi: 10.1038/s41467-018-04926-x
Sanglard, D., Ischer, F., Marchetti, O., Entenza, J., Bille, J. (2003). Calcineurin A of Candida albicans: involvement in antifungal tolerance, cell morphogenesis and virulence. Mol. Microbiol 48, 959–976. doi: 10.1046/j.1365-2958.2003.03495.x
Sun, L. L., Li, H., Yan, T. H., Fang, T., Wu, H., Cao, Y. B., et al. (2023). Aneuploidy mediates rapid adaptation to a subinhibitory amount of fluconazole in candida albicans. Microbiol Spectr. 11, e0301622. doi: 10.1128/spectrum.03016-22
Todd, R. T., Soisangwan, N., Peters, S., Kemp, B., Crooks, T., Gerstein, A., et al. (2023). Antifungal drug concentration impacts the spectrum of adaptive mutations in candida albicans. Mol. Biol. Evol. 40. doi: 10.1093/molbev/msad009
Tsai, H. F., Krol, A. A., Sarti, K. E., Bennett, J. E. (2006). Candida glabrata PDR1, a transcriptional regulator of a pleiotropic drug resistance network, mediates azole resistance in clinical isolates and petite mutants. Antimicrob Agents Chemother. 50, 1384–1392. doi: 10.1128/AAC.50.4.1384-1392.2006
Vande Zande, P., Gautier, C., Kawar, N., Maufrais, C., Metzner, K., Wash, E., et al. (2024). Step-wise evolution of azole resistance through copy number variation followed by KSR1 loss of heterozygosity in Candida albicans. PloS Pathog 20, e1012497. doi: 10.1371/journal.ppat.1012497
Wang, D., An, N., Yang, Y., Yang, X., Fan, Y., Feng, J. (2021). Candida tropicalis distribution and drug resistance is correlated with ERG11 and UPC2 expression. Antimicrob Resist. Infect. Control 10, 54. doi: 10.1186/s13756-021-00890-2
WHO. (2022). WHO fungal priority pathogens list to guide research, development and public health action. (Geneva, Switzerland: World Health Organization).
Wu, P. F., Liu, W. L., Hsieh, M. H., Hii, I. M., Lee, Y. L., Lin, Y. T., et al. (2017). Epidemiology and antifungal susceptibility of candidemia isolates of non-albicans Candida species from cancer patients. Emerg Microbes Infect. 6, e87. doi: 10.1038/emi.2017.74
Xu, Y., Lu, H., Zhu, S., Li, W. Q., Jiang, Y. Y., Berman, J., et al. (2021). Multifactorial mechanisms of tolerance to ketoconazole in candida albicans. Microbiol Spectr. 9,0032121. doi: 10.1128/Spectrum.00321-21
Yadav, V., Heitman, J. (2023). Calcineurin: The Achilles’ heel of fungal pathogens. PloS Pathog 19, e1011445. doi: 10.1371/journal.ppat.1011445
Yang, F., Berman, J. (2024). Beyond resistance: antifungal heteroresistance and antifungal tolerance in fungal pathogens. Curr. Opin. Microbiol 78, 102439. doi: 10.1016/j.mib.2024.102439
Yang, F., Gritsenko, V., Slor Futterman, Y., Gao, L., Zhen, C., Lu, H., et al. (2021). Tunicamycin Potentiates Antifungal Drug Tolerance via Aneuploidy in Candida albicans. mBio 12, e0227221. doi: 10.1128/mBio.02272-21
Yang, F., Scopel, E. F. C., Li, H., Sun, L. L., Kawar, N., Cao, Y. B., et al. (2023). Antifungal Tolerance and Resistance Emerge at Distinct Drug Concentrations and Rely upon Different Aneuploid Chromosomes. mBio. 14, e0022723. doi: 10.1128/mbio.00227-23
Zheng, L., Xu, Y., Wang, C., Dong, Y., Guo, L. (2024a). Parallel evolution of fluconazole resistance and tolerance in Candida glabrata. Front. Cell. Infection Microbiol. 14. doi: 10.3389/fcimb.2024.1456907
Zheng, L., Xu, Y., Wang, C., Guo, L. (2024b). Ketoconazole induces reversible antifungal drug tolerance mediated by trisomy of chromosome R in Candida albicans. Front. Microbiol 15. doi: 10.3389/fmicb.2024.1450557
Keywords: fluconazole tolerance, petite, efflux, ergosterol, Saccharomyces cerevisiae
Citation: Zheng L, Dong Y, Wang J, Jia Y, Wang W, Xu Y and Guo L (2025) Understanding adaptation to fluconazole: comparative insights into tolerance and resistance in Saccharomyces cerevisiae and Candida albicans. Front. Cell. Infect. Microbiol. 15:1519323. doi: 10.3389/fcimb.2025.1519323
Received: 29 October 2024; Accepted: 01 April 2025;
Published: 05 May 2025.
Edited by:
Abhishek Subramanian, Indian Institute of Technology Hyderabad, IndiaReviewed by:
Atanu Banerjee, Amity University Gurgaon, IndiaIrena Maliszewska, Wrocław University of Science and Technology, Poland
Copyright © 2025 Zheng, Dong, Wang, Jia, Wang, Xu and Guo. This is an open-access article distributed under the terms of the Creative Commons Attribution License (CC BY). The use, distribution or reproduction in other forums is permitted, provided the original author(s) and the copyright owner(s) are credited and that the original publication in this journal is cited, in accordance with accepted academic practice. No use, distribution or reproduction is permitted which does not comply with these terms.
*Correspondence: Liangsheng Guo, Z2xzMjEzNUBzaW5hLmNvbQ==
†These authors have contributed equally to this work