 Youao Zhang
 Yuran Zhang2†
 Jieyan Wang
 Hui Liang
- 1Department of Urology, People’s Hospital of Longhua, Shenzhen, Guangdong, China
- 2Nanfang Hospital, The First Clinical Medical College of Southern Medical University, Guangzhou, Guangdong, China
- 3School of Chinese Medicine, Southern Medical University, Guangzhou, China
Background: Enteric infections represent a prevalent global health issue and contribute significantly to the global disease burden. This study aims to investigate the patterns and trends of enteric infections from 1990 to 2021, providing valuable insights for health policy formulation, medical resource allocation, and the optimization of patient management plans.
Methods: We analyzed the Global Burden of Disease (GBD) 2021 for 21 regions and 204 countries to understand better the health burden using prevalence, incidence, mortality, and disability-adjusted life years (DALYs), subtype, risk factors, and etiology. We tested correlations with the Socio-demographic Index (SDI), and using decomposition analysis to dissect the reasons behind changes in epidemiological indicators of the disease.
Results: In 2021, the age-standardized rates of prevalence, incidence, deaths, and DALYs per 100,000 population for enteric infections were 879.58, 577.21, 17.83, and 1020.15, respectively. Compared to 1990, these rates exhibited -0.18, -0.12, -0.73, and -0.72 changes. Gender and age analyses revealed a higher burden among females, those under 15 years old, and the elderly. Regions with low SDI had higher epidemiological indicators. The burden of Typhoid fever declines in high-development regions. Unsafe water sources were identified as the primary risk factor globally in both 1990 and 2021. Rotavirus was the leading cause of deaths and DALYs.
Conclusion: This study highlights the complex epidemiological landscape of enteric infections, revealing variations in burden, risk factors, and etiological characteristics across age, gender, and geographical regions. It underscores the urgent need for healthcare professionals and policymakers to develop innovative prevention and healthcare strategies based on the current and evolving burden of enteric infections, to alleviate the global disease burden.
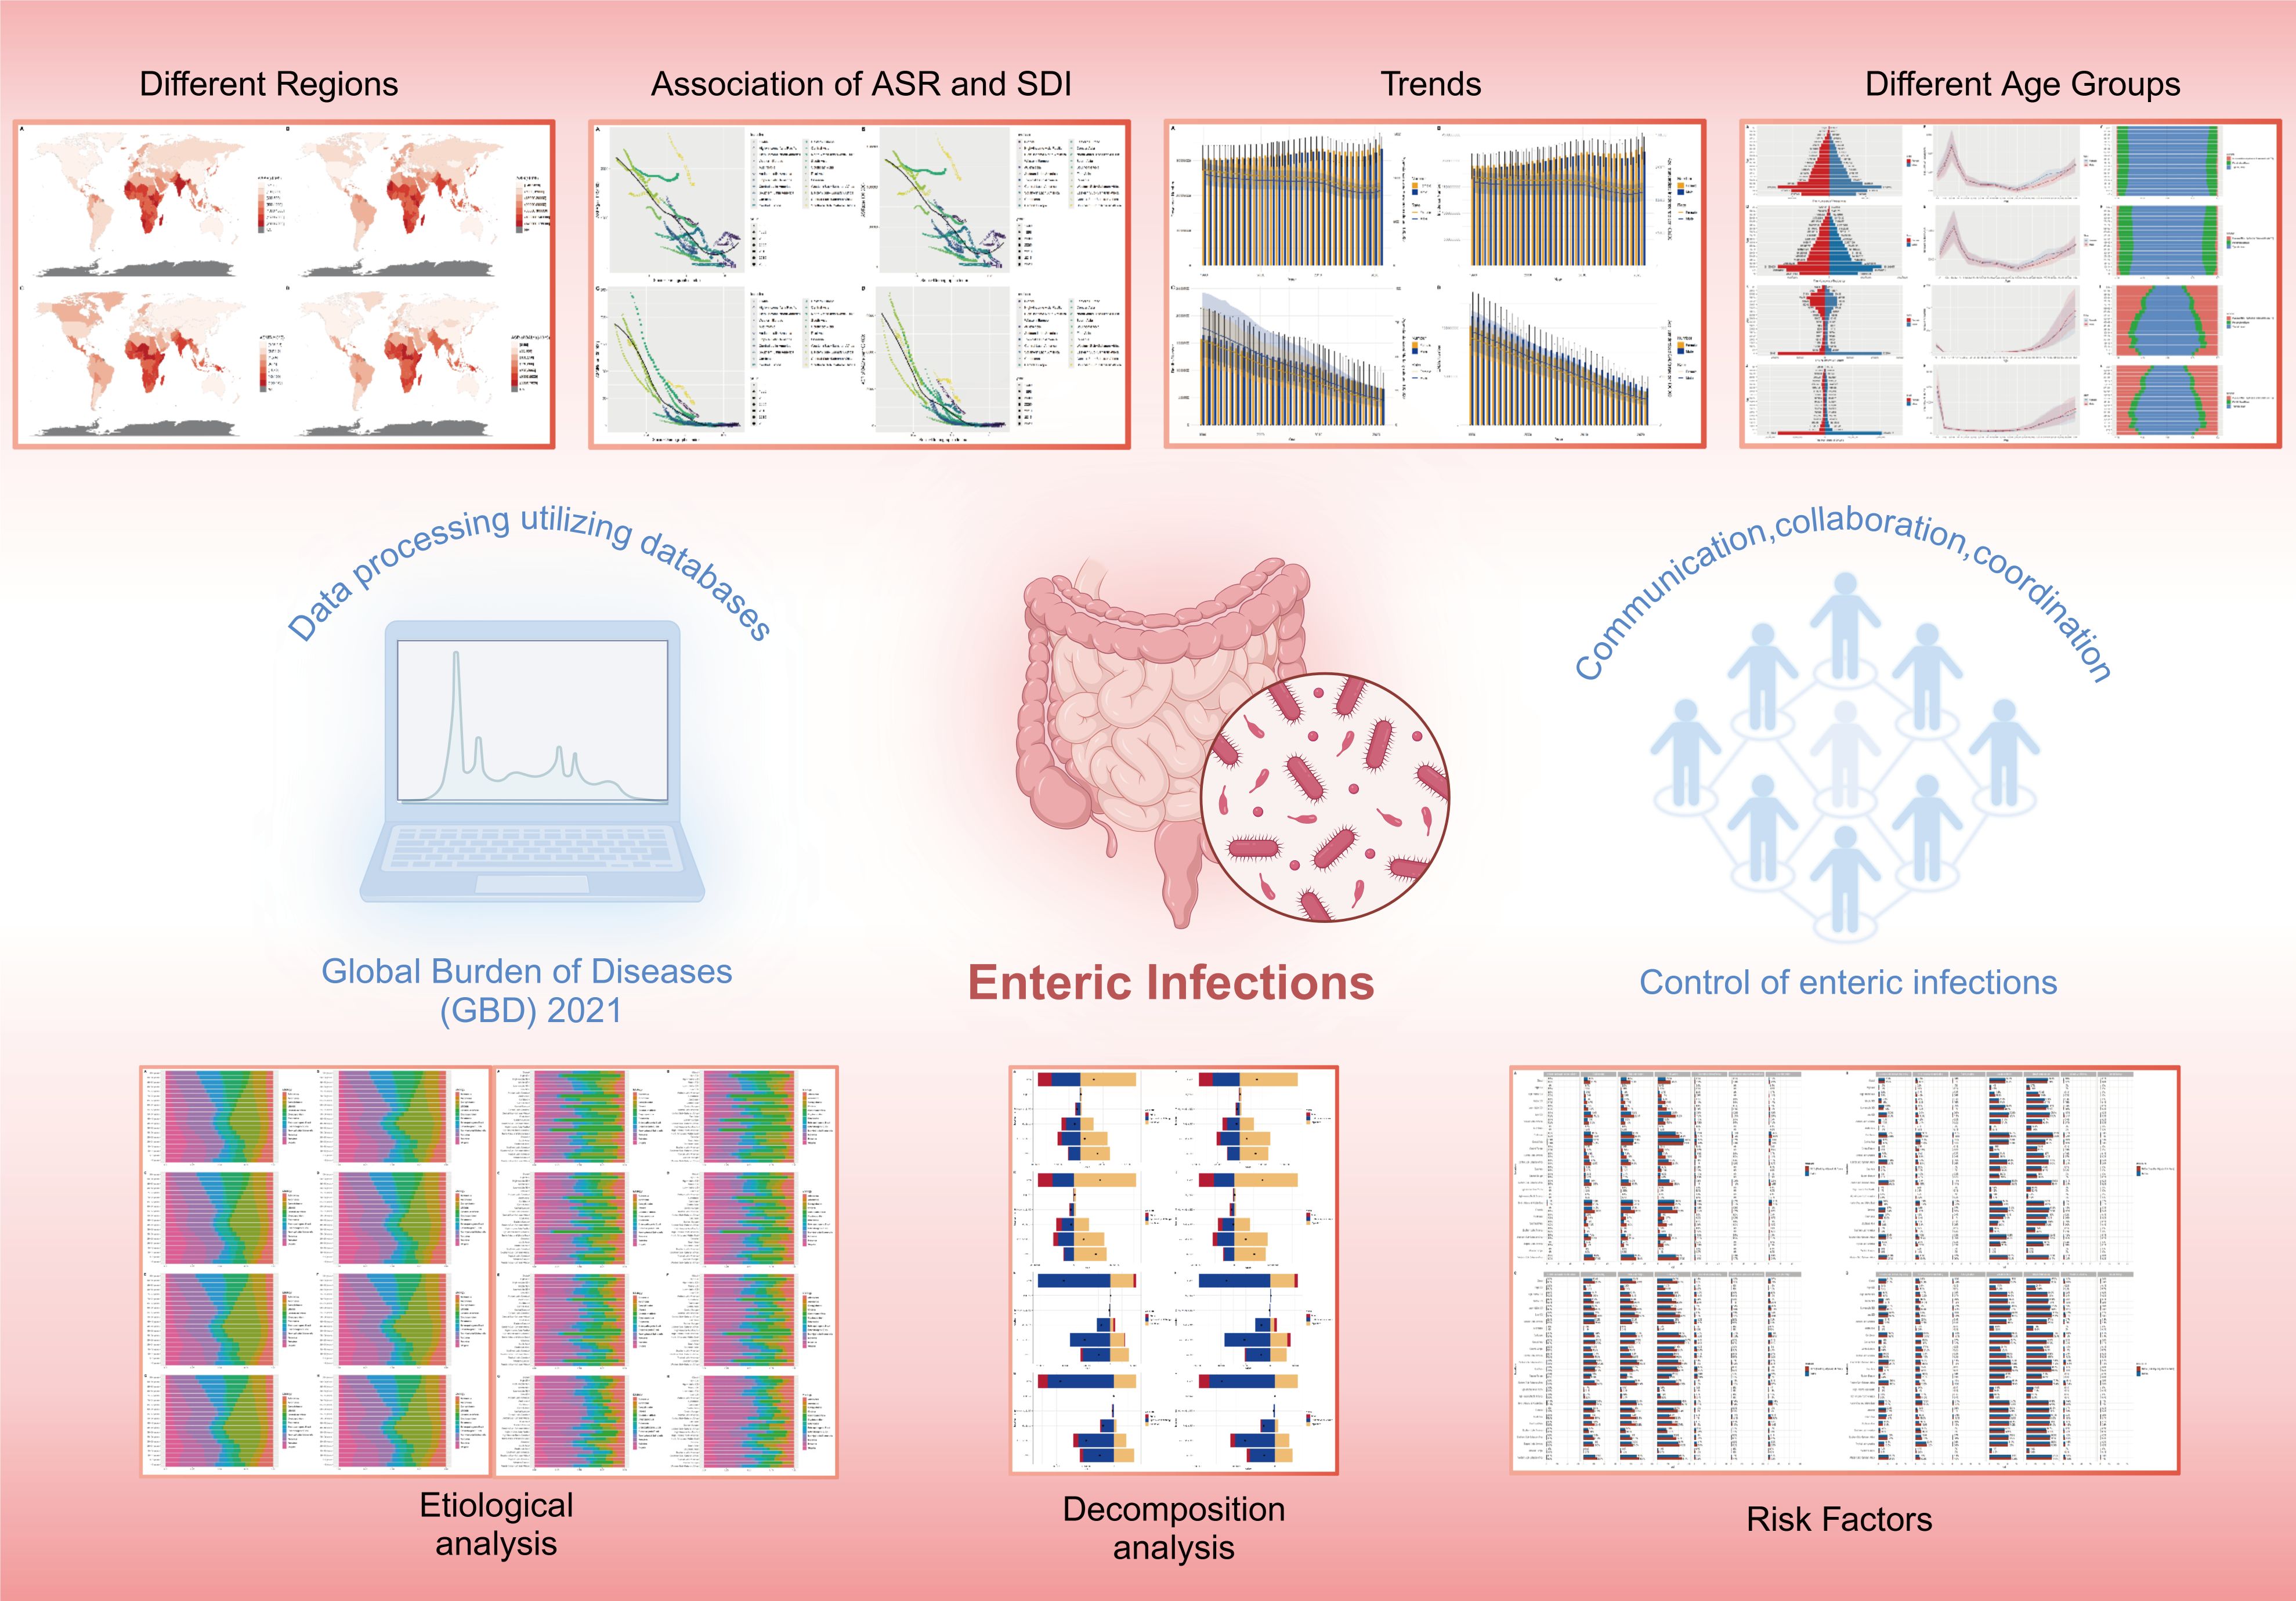
Graphical Abstract.
Introduction
Enteric infections, as a category of diseases significantly affecting global public health, encompass gastrointestinal inflammation caused by various pathogens (Torgerson et al., 2015). These infections not only lead to a decrease in patients’ quality of life and increasing the risk of death (Hoivik et al., 2012), but also impose a significant economic burden at the social and family levels (Boccuzzi, 2003). Diarrheal diseases, a common symptom of gastrointestinal infections caused by diverse pathogens, pose a significant risk of dehydration and are the seventh leading cause of death in low-income countries according to the 2021 WHO statistics (World Health Organization, 2021). Typhoid fever, transmitted via contaminated food or water, can lead to severe fever, fatigue, and mortality. In low-income and middle-income countries, the average total cost of inpatient treatment per person ranges from $201 to $976 (Debellut et al., 2024). Paratyphoid A and B have clinical presentations similar to typhoid but are milder and shorter in duration. Invasive non-typhoidal Salmonella (iNTS) is a major health problem in low-income and underdeveloped countries in Africa and Asia that lack proper sanitation facilities (Hajra et al., 2023).
Therefore, the purpose of this analysis is to characterize the global burden of enteric infections and subtype in 21 regions and 204 countries and territories worldwide. The 2021 GBD conducted an in-depth assessment of the health hazards, with the support of more than 11,500 collaborators from 164 countries (GBD 2021 Causes of Death Collaborators, 2024; GBD 2021 Diseases and Injuries Collaborators, 2024; Sun et al., 2024; Tuo et al., 2024; Yang et al., 2024). Therefore, the GBD study is a reliable tool for understanding and assessing the current burden of enteric infections.
Methods
Data source
The present study extracted global incidence, prevalence, mortality, and DALYs (one DALY represents the loss of one year of full health due to premature death or disability), along with their 95% uncertainty intervals (UI), spanning from 1990 to 2021 from the GBD database (https://vizhub.healthdata.org/gbd-results/). Data on sex, age groups, population, and SDI were also included for comprehensive analysis.
SDI analysis
The SDI was employed as a metric to assess the socio-economic status of countries, with a higher score indicating more robust socio-economic development. Regions were stratified into five quintiles based on the GBD studies: High SDI (>0.81), High-middle SDI (0.70–0.81), Middle SDI (0.61–0.69), Low-middle SDI (0.46–0.60), and Low SDI (<0.46) (GBD 2021 Causes of Death Collaborators, 2024; GBD 2021 Diseases and Injuries Collaborators, 2024). To examine the correlation between SDI and the burden of enteric infections, locally estimated scatterplot smoothing (loess) models were applied, utilizing the geom_smooth function within the ggplot2 package.
Decomposition analysis
To quantify the driving factors behind the changes in the number of enteric infections, we estimated the relative contributions of aging, population growth, and epidemiological shifts. For this decomposition analysis, we employed the classic method developed by Das Gupta (1978), which utilizes algebraic decomposition techniques to break down the overall changes into the standardized impacts of each factor, thereby identifying the contribution of each component.
Statistics analysis
Age-standardized prevalence rates (ASPR), age-standardized incidence rates (ASIR), age-standardized mortality rates (ASMR), and ASR of DALYs were expressed as predicted values per 100,000 population, including their 95% UI. All analytical procedures and graphical representations were executed using the statistical software R (version 4.4.1).
Results
Global level
Enteric infections
In 2021, the global prevalence was 67,826,600, with an ASPR of 879.58. Between 1990 and 2021, the ASPR decreased by 0.18, and the ASIR decreased by 0.12. The number of incident cases was 4,448,407,870 with an ASIR of 57,721.08. From 1990 to 2021, the number of deaths was 1,336,220 with an ASMR of 17.83; the ASMR decreased by 0.73 over this period. The global DALYs totaled 71,929,008 with an ASR of 1,020.15, and the ASR of DALYs decreased by 0.72 from 1990 to 2021 (Table 1).

Table 1. Prevalent cases, age-standardized prevalence rates, incident cases, age-standardized incidence rates, death cases, age-standardized mortality rates, DALYs, and age-standardized rates of DALYs for enteric infections in 1990 and 2021 for both sexes and rate change of age-standardized rates by GBD.
Diarrheal diseases
In 2021, the global prevalence was 67,276,401 with an ASPR of 872.02; from 1990 to 2021, the ASPR decreased by 0.16. The number of incident cases was 4,438,577,275 with an ASIR of 57,586.1; the ASIR decreased by 0.12 from 1990 to 2021. The number of deaths was 1,165,398 with an ASMR of 15.42; the ASMR decreased by 0.75 during the same period. The global DALYs totaled 58,983,817 with an ASR of 834.18, and the ASR of DALYs decreased by 0.75 from 1990 to 2021 (Supplementary Table S1).
Typhoid fever
In 2021, the global prevalence was 452,343 with an ASPR of 6.23. From 1990 to 2021, the ASPR decreased by 0.7. The number of incident cases was 715,455 with an ASIR of 98.56, and the ASIR decreased by 0.7 over this period. The number of deaths was 93,333 with an ASMR of 1.31, which decreased by 0.59 from 1990 to 2021. The global DALYs were 7,087,733 with an ASR of DALYs of 101.09, and the ASR of DALYs decreased by 0.59 during this period (Supplementary Table S2).
Paratyphoid fever
In 2021, the global prevalence was 94,953 with an ASPR of 1.28. Between 1990 and 2021, the ASPR decreased by 0.79. The number of incident cases was 2,166,063 with an ASIR of 29.21; the ASPR decreased by 0.79 from 1990 to 2021. The number of deaths was 14,127 with an ASMR of 0.19, and the ASMR decreased by 0.72 over the same period. The global DALYs totaled 1,011,842 with an ASR of DALYs of 14.16, which decreased by 0.73 from 1990 to 2021 (Supplementary Table S3).
iNTS
In 2021, the global prevalence was 11,847, with an ASPR of 0.17. From 1990 to 2021, the ASPR increased by 0.21. The number of incident cases was 509,976 with an ASIR of 7.21; the ASIR increased by 0.2 over the same period. The number of deaths was 62,018 with an ASMR of 0.88, and the ASMR increased by 0.02 from 1990 to 2021. The global DALYs were 4,740,235, with an ASR of DALYs of 69.14, and the ASR of DALYs increased by 0.12 during this period (Supplementary Table S4).
Regional level
Enteric infections
In 2021, the ASPR was highest in Low SDI regions, reaching 1774.15. Geographically, the South Asia region exhibited the highest ASPR at 1878.93 (Table 1; Figure 1A). From 1990 to 2021, the slowest decline was observed in Low SDI regions, with a decrease of 0.14. Geographically, the High-income Asia Pacific region showed the most significant upward trend, at 0.28 (Table 1). The ASIR was highest in Low SDI regions, at 115140.51, with South Asia again exhibiting the highest ASIR at 121872.67 (Table 1; Figure 1B). Between 1990 and 2021, the slowest decline was observed in Low SDI regions, with a downward trend of 0.09. Geographically, the High-income Asia Pacific region showed the most significant upward trend, at 0.35 (Table 1). The ASMR was highest in Low SDI regions, at 75.25. Geographically, the Western Sub-Saharan Africa region had the highest ASMR at 65.53 (Table 1; Figure 1C). Between 1990 and 2021, the fastest increase was observed in High SDI regions, with an upward trend of 0.25. Geographically, the High-income North America region showed the most significant upward trend, at 3.85 (Table 1). The ASR of DALYs was highest in Low SDI regions, at 2999.43. Geographically, the Western Sub-Saharan Africa region had the highest ASR of DALYs at 3383.88 (Table 1; Figure 1D). Between 1990 and 2021, the slowest decline was observed in High SDI regions, with a downward trend of 0.3. Geographically, Western Europe showed the most significant upward trend, at 0.05 (Table 1).
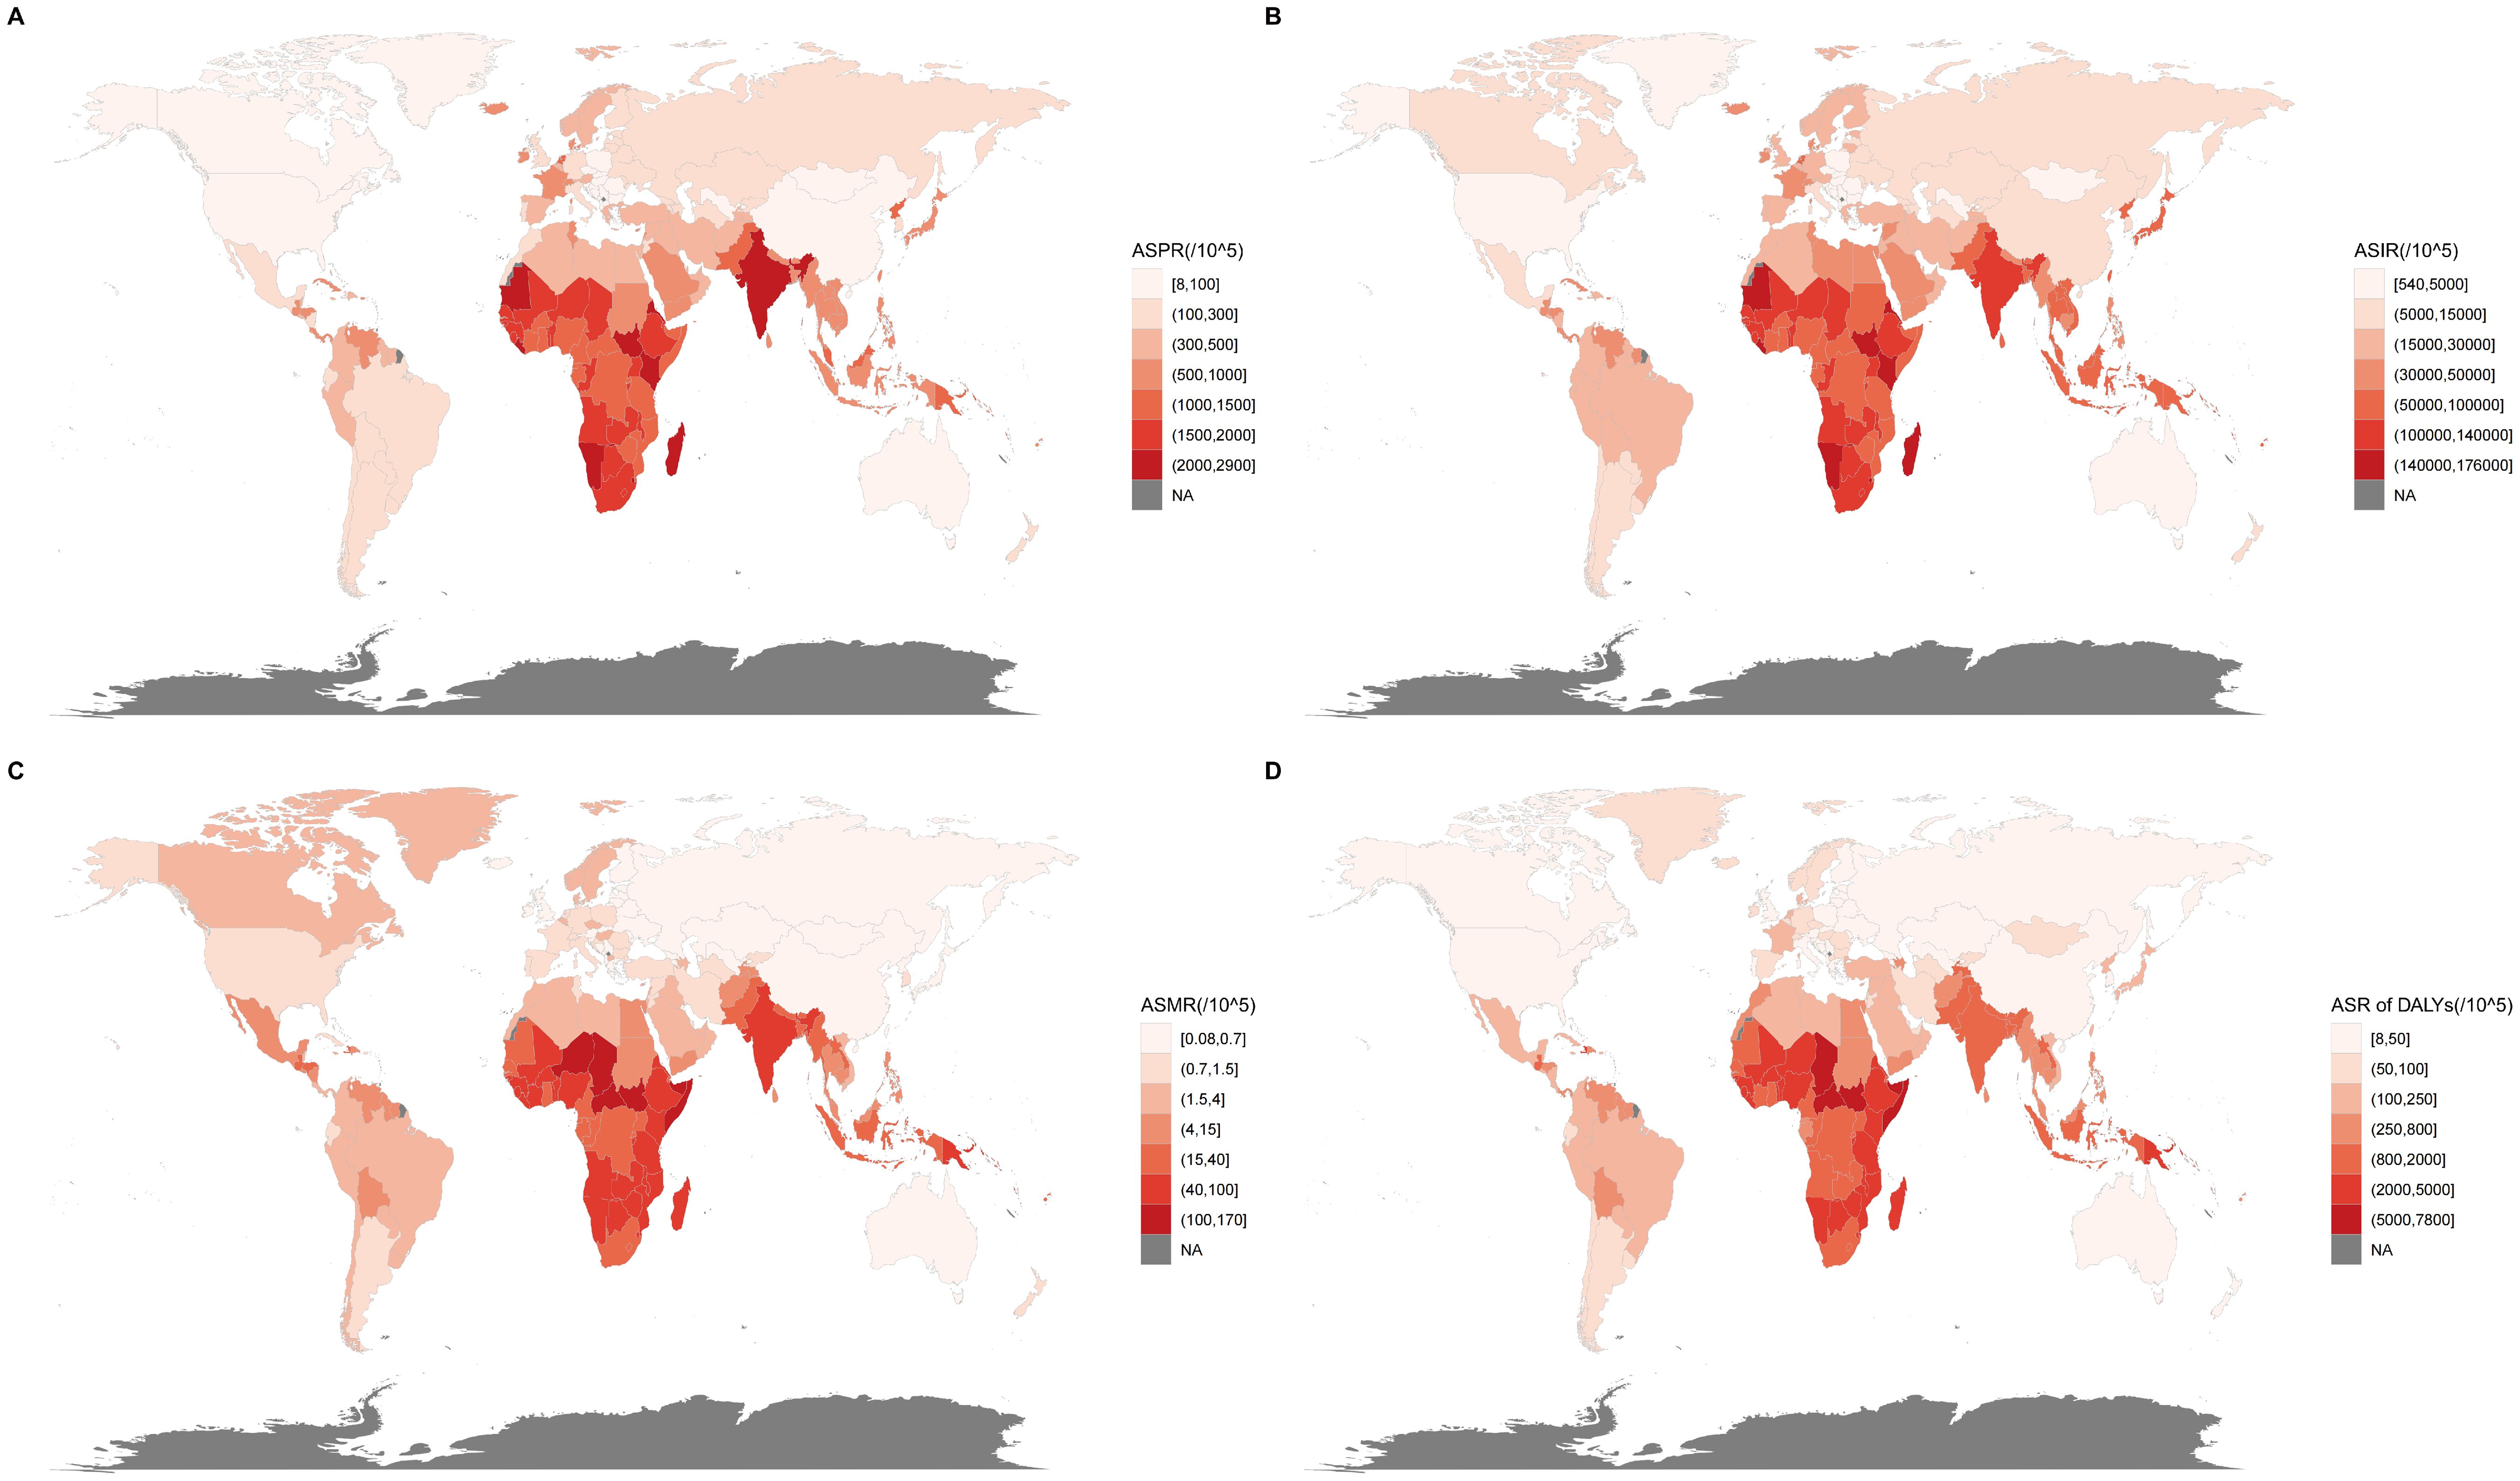
Figure 1. Global distribution of enteric infections disease burden in 2021. (A) ASPR of enteric infections; (B) ASIR of enteric infections; (C) ASMR of enteric infections; (D) ASR of DALYs of enteric infections. ASPR, Age-standardized prevalence rates; ASIR, Age-standardized incidence rates; ASMR, Age-standardized mortality rates; ASR, Age-standardized rate; DALYs, Disability-adjusted life years.
Diarrheal diseases
In 2021, the ASPR was highest in Low SDI regions, at 1763.73. Geographically, the South Asia region had the highest ASPR at 1857.37. Between 1990 and 2021, the slowest decline was observed in Low SDI regions, with a downward trend of 0.13. Geographically, the High-income Asia Pacific region showed the most significant upward trend, at 0.28 (Supplementary Table S1). The ASIR was highest in Low SDI regions, at 114948.62. Geographically, the South Asia region had the highest ASIR at 121489.61. Between 1990 and 2021, the slowest decline was observed in Low SDI regions, with a downward trend of 0.08. Geographically, the High-income Asia Pacific region showed the most significant upward trend, at 0.35 (Supplementary Table S1). The ASMR was highest in Low SDI regions, at 69.75. Geographically, the Eastern Sub-Saharan Africa region had the highest ASMR at 59.99. Between 1990 and 2021, the fastest increase was observed in High SDI regions, with an upward trend of 0.35. Geographically, the High-income North America region showed the most significant upward trend, at 4.36 (Supplementary Table S1). The ASR of DALYs was highest in Low SDI regions, at 2605.84. Geographically, the Western Sub-Saharan Africa region had the highest ASR of DALYs at 2769.81. Between 1990 and 2021, the slowest decline was observed in High SDI regions, with a downward trend of 0.27. Geographically, Western Europe showed the most significant upward trend, at 0.08 (Supplementary Table S1).
Typhoid fever
The ASPR was highest in Low-middle SDI regions, at 12.09. Geographically, the South Asia region had the highest ASPR at 17.01. Between 1990 and 2021, the slowest decline was observed in High-middle SDI regions, with a downward trend of 0.54. Geographically, Australasia showed the least decline, at 0.01 (Supplementary Table S2). The ASIR was highest in Low-middle SDI regions, at 191.27. Geographically, the South Asia region had the highest ASIR at 269.08. Between 1990 and 2021, the slowest decline was observed in High-middle SDI regions, with a downward trend of 0.54. Geographically, Australasia showed the least decline, at 0.01 (Supplementary Table S2). The ASMR was highest in Low-middle SDI regions, at 2.52. Geographically, the Oceania region had the highest ASMR at 3.48. Between 1990 and 2021, the slowest decline was observed in High-middle SDI regions, with a downward trend of 0.57. Geographically, Australasia showed the most significant upward trend, at 0.71 (Supplementary Table S2). The ASR of DALYs was highest in Low-middle SDI regions, at 188.51. Geographically, the South Asia region had the highest ASR of DALYs at 260.27. Between 1990 and 2021, the slowest decline was observed in High-middle SDI regions, with a downward trend of 0.58. Geographically, Southern Sub-Saharan Africa showed the most significant upward trend, at 0.03 (Supplementary Table S2).
Paratyphoid fever
In 2021, the ASPR was highest in Low-middle SDI regions, at 2.93. Geographically, the South Asia region had the highest ASPR at 4.85. Between 1990 and 2021, the slowest decline was observed in High SDI regions, with a downward trend of 0.33. Geographically, Australasia showed the most significant upward trend, at 0.62 (Supplementary Table S3). The ASIR was highest in Low-middle SDI regions, at 66.83. Geographically, the South Asia region had the highest ASIR at 110.56. Between 1990 and 2021, the slowest decline was observed in High SDI regions, with a downward trend of 0.34. Geographically, Australasia showed the most significant upward trend, at 0.61 (Supplementary Table S3). The ASMR was highest in Low-middle SDI regions, at 0.44. Geographically, the South Asia region had the highest ASMR at 0.73. Between 1990 and 2021, the slowest decline was observed in High-middle SDI regions, with a downward trend of 0.67. Geographically, High-income North America showed the most significant upward trend, at 0.73 (Supplementary Table S3). The ASR of DALYs was highest in Low-middle SDI regions, at 30.99. Geographically, the South Asia region had the highest ASR of DALYs at 51.64. Between 1990 and 2021, the slowest decline was observed in High-middle SDI regions, with a downward trend of 0.69. Geographically, High-income North America showed the most significant upward trend, at 0.54 (Supplementary Table S3).
iNTS
In 2021, the ASPR was highest in Low SDI regions, at 0.48. Geographically, the Western Sub-Saharan Africa region had the highest ASPR at 1.1. Between 1990 and 2021, the fastest increase was observed in High SDI regions, with an upward trend of 0.18. Geographically, Western Europe showed the most significant upward trend, at 0.68 (Supplementary Table S4). The ASIR was highest in Low SDI regions, at 20.91. Geographically, the Western Sub-Saharan Africa region had the highest ASIR at 47.54. Between 1990 and 2021, the fastest increase was observed in High SDI regions, with an upward trend of 0.17. Geographically, Western Europe showed the most significant upward trend, at 0.66 (Supplementary Table S4). The ASMR was highest in Low SDI regions, at 3.3. Geographically, the Western Sub-Saharan Africa region had the highest ASMR at 6.88. Between 1990 and 2021, the slowest decline was observed in Low SDI regions, with a downward trend of 0.31. Geographically, the Caribbean showed the most significant upward trend, at 0.01 (Supplementary Table S4). The ASR of DALYs was highest in Low SDI regions, at 234.06. Geographically, the Western Sub-Saharan Africa region had the highest ASR of DALYs at 486.81. Between 1990 and 2021, the slowest decline was observed in Low SDI regions, with a downward trend of 0.24. Geographically, Oceania showed the most significant upward trend, at 0.06 (Supplementary Table S4).
National and territorial level
Enteric infections
In 2021, India had the highest number of prevalence cases, totaling 29,470,511 (Supplementary Table S5). South Sudan had the highest ASPR at 2888.11 (Supplementary Table S6; Figure 1A). Between 1990 and 2021, North Korea experienced the fastest increase, with an upward trend of 2.68 (Supplementary Table S7). India had the highest number of incidence cases with 1,898,215,166 (Supplementary Table S5). South Sudan had the highest ASIR at 175498.06 (Supplementary Table S6; Figure 1B). Between 1990 and 2021, North Korea experienced the fastest increase, with an upward trend of 2.6 (Supplementary Table S7). Regarding deaths, India had the highest number with 552,102 (Supplementary Table S5). South Sudan had the highest ASMR at 168.95 (Supplementary Table S6; Figure 1C). Between 1990 and 2021, India experienced the fastest increase, with an upward trend of 15.37 (Supplementary Table S7). Furthermore, India also had the highest number of DALYs with 20,822,873 (Supplementary Table S5). Chad had the highest ASR of DALYs at 7791.23 (Supplementary Table S6; Figure 1D). Between 1990 and 2021, Sweden experienced the fastest increase, with an upward trend of 1.14 (Supplementary Table S7).
Diarrheal diseases
In 2021, India had the highest number of prevalence cases with 29,167,174 (Supplementary Table S8). South Sudan had the highest ASPR at 2881.95 (Supplementary Table S9). Between 1990 and 2021, North Korea experienced the fastest increase, with an upward trend of 2.69 (Supplementary Table S10). India had the highest number of incidence cases with 1,892,784,379 (Supplementary Table S8). South Sudan had the highest ASIR at 175395.84 (Supplementary Table S9). Between 1990 and 2021, North Korea experienced the fastest increase, with an upward trend of 2.6 (Supplementary Table S10). India also had the highest number of deaths with 496,725 (Supplementary Table S8). South Sudan had the highest ASMR at 166.68 (Supplementary Table S9). Between 1990 and 2021, Sweden experienced the fastest increase, with an upward trend of 16.15 (Supplementary Table S10). India had the highest number of DALYs with 16,762,076 (Supplementary Table S8). Chad had the highest ASR of DALYs at 7341.22 (Supplementary Table S9). Between 1990 and 2021, Sweden experienced the fastest increase, with an upward trend of 1.16 (Supplementary Table S10).
Typhoid fever
In 2021, a study conducted at the country and regional level found that India had the highest number of prevalence cases, incidence and deaths, with 234,912, 3,715,087 and 41,586 respectively (Supplementary Table S11). Burkina Faso had the highest ASPR at 20.76 (Supplementary Table S12). Between 1990 and 2021, Australia experienced the fastest increase, with an upward trend of 0.87 (Supplementary Table S1). Burkina Faso had the highest ASIR at 328.48 (Supplementary Table S12). Between 1990 and 2021, Australia experienced the fastest increase, with an upward trend of 0.86 (Supplementary Table S1). Bhutan had the highest ASMR at 5.61 (Supplementary Table S12). Denmark experienced the fastest increase, with an upward trend of 58.98 between 1990 and 2021 (Supplementary Table S13). India had the highest number of DALYs with 3,117,354 (Supplementary Table S11). Bhutan had the highest ASR of DALYs at 434.23 (Supplementary Table S12). Between 1990 and 2021, Denmark experienced the fastest increase, with an upward trend of 21.28 (Supplementary Table S13).
Paratyphoid fever
In 2021, India had the highest number of prevalence cases with 73,385 (Supplementary Table S14). India had the highest ASPR at 5.46 (Supplementary Table S15). Between 1990 and 2021, Kenya experienced the fastest increase, with an upward trend of 3.71 (Supplementary Table S16). India had the highest number of incidence cases with 1,673,611 (Supplementary Table S14). India also had the highest ASIR at 124.45 (Supplementary Table S15). Between 1990 and 2021, Kenya experienced the fastest increase, with an upward trend of 3.7 (Supplementary Table S16). India had the highest number of deaths with 9,893 (Supplementary Table S14). Pakistan had the highest ASMR at 1.05 (Supplementary Table S15). Between 1990 and 2021, Denmark experienced the fastest increase, with an upward trend of 275.01 (Supplementary Table S16). India also had the highest number of DALYs with 695,210 (Supplementary Table S14). Pakistan had the highest ASR of DALYs at 72.66 (Supplementary Table S15). Between 1990 and 2021, Denmark experienced the fastest increase, with an upward trend of 125.61 (Supplementary Table S16).
iNTS
In 2021, Nigeria had the highest number of prevalence cases with 3,844 (Supplementary Table S17). Mali had the highest ASPR at 1.74 (Supplementary Table S18). Between 1990 and 2021, the United Kingdom experienced the fastest increase, with an upward trend of 1.75 (Supplementary Table S19). Nigeria had the highest number of incidence cases with 164,230 (Supplementary Table S17). Mali had the highest ASIR at 76.24 (Supplementary Table S18). Between 1990 and 2021, the United Kingdom experienced the fastest increase, with an upward trend of 1.74 (Supplementary Table S19). Nigeria also had the highest number of deaths with 21,614 (Supplementary Table S17). Mali had the highest ASMR at 13.26 (Supplementary Table S18). Between 1990 and 2021, The Bahamas experienced the fastest increase, with an upward trend of 14.25 (Supplementary Table S19). Nigeria had the highest number of DALYs with 1,754,290 (Supplementary Table S17). Mali had the highest ASR of DALYs at 859.23 (Supplementary Table S18). Between 1990 and 2021, The Bahamas experienced the fastest increase, with an upward trend of 13.47 (Supplementary Table S19).
Age, sex, and subtype analysis
In 2021, among enteric infections, the 10-14 year age group exhibited the highest prevalence and incidence rates, while mortality rate was highest among those aged 90 and above, and DALYs rate was highest in children under 5. Females under 90 had a higher burden of prevalence and incidence compared to males; however, for those aged over 90, both mortality and DALYs rates were lower in females than in males. Due to the large number and variety of pathogens causing diarrheal diseases, only three subtypes, typhoid fever, paratyphoid fever, and iNTS, were included for comparison (Figure 2). Typhoid fever had higher rates across all epidemiological indicators, with the largest proportion of cases seen in children under 5 for prevalence and incidence, iNTS in those over 85 for deaths and DALYs, and Paratyphoid fever had the lowest proportion under 10 years old. Regional distribution of subtypes varied, with the highest proportion of Typhoid fever in prevalence in North Africa and the Middle East having, the highest incidence rates in Eastern Sub-Saharan Africa, and the highest rates of deaths and DALYs in Southeast Asia (Supplementary Figure S1).
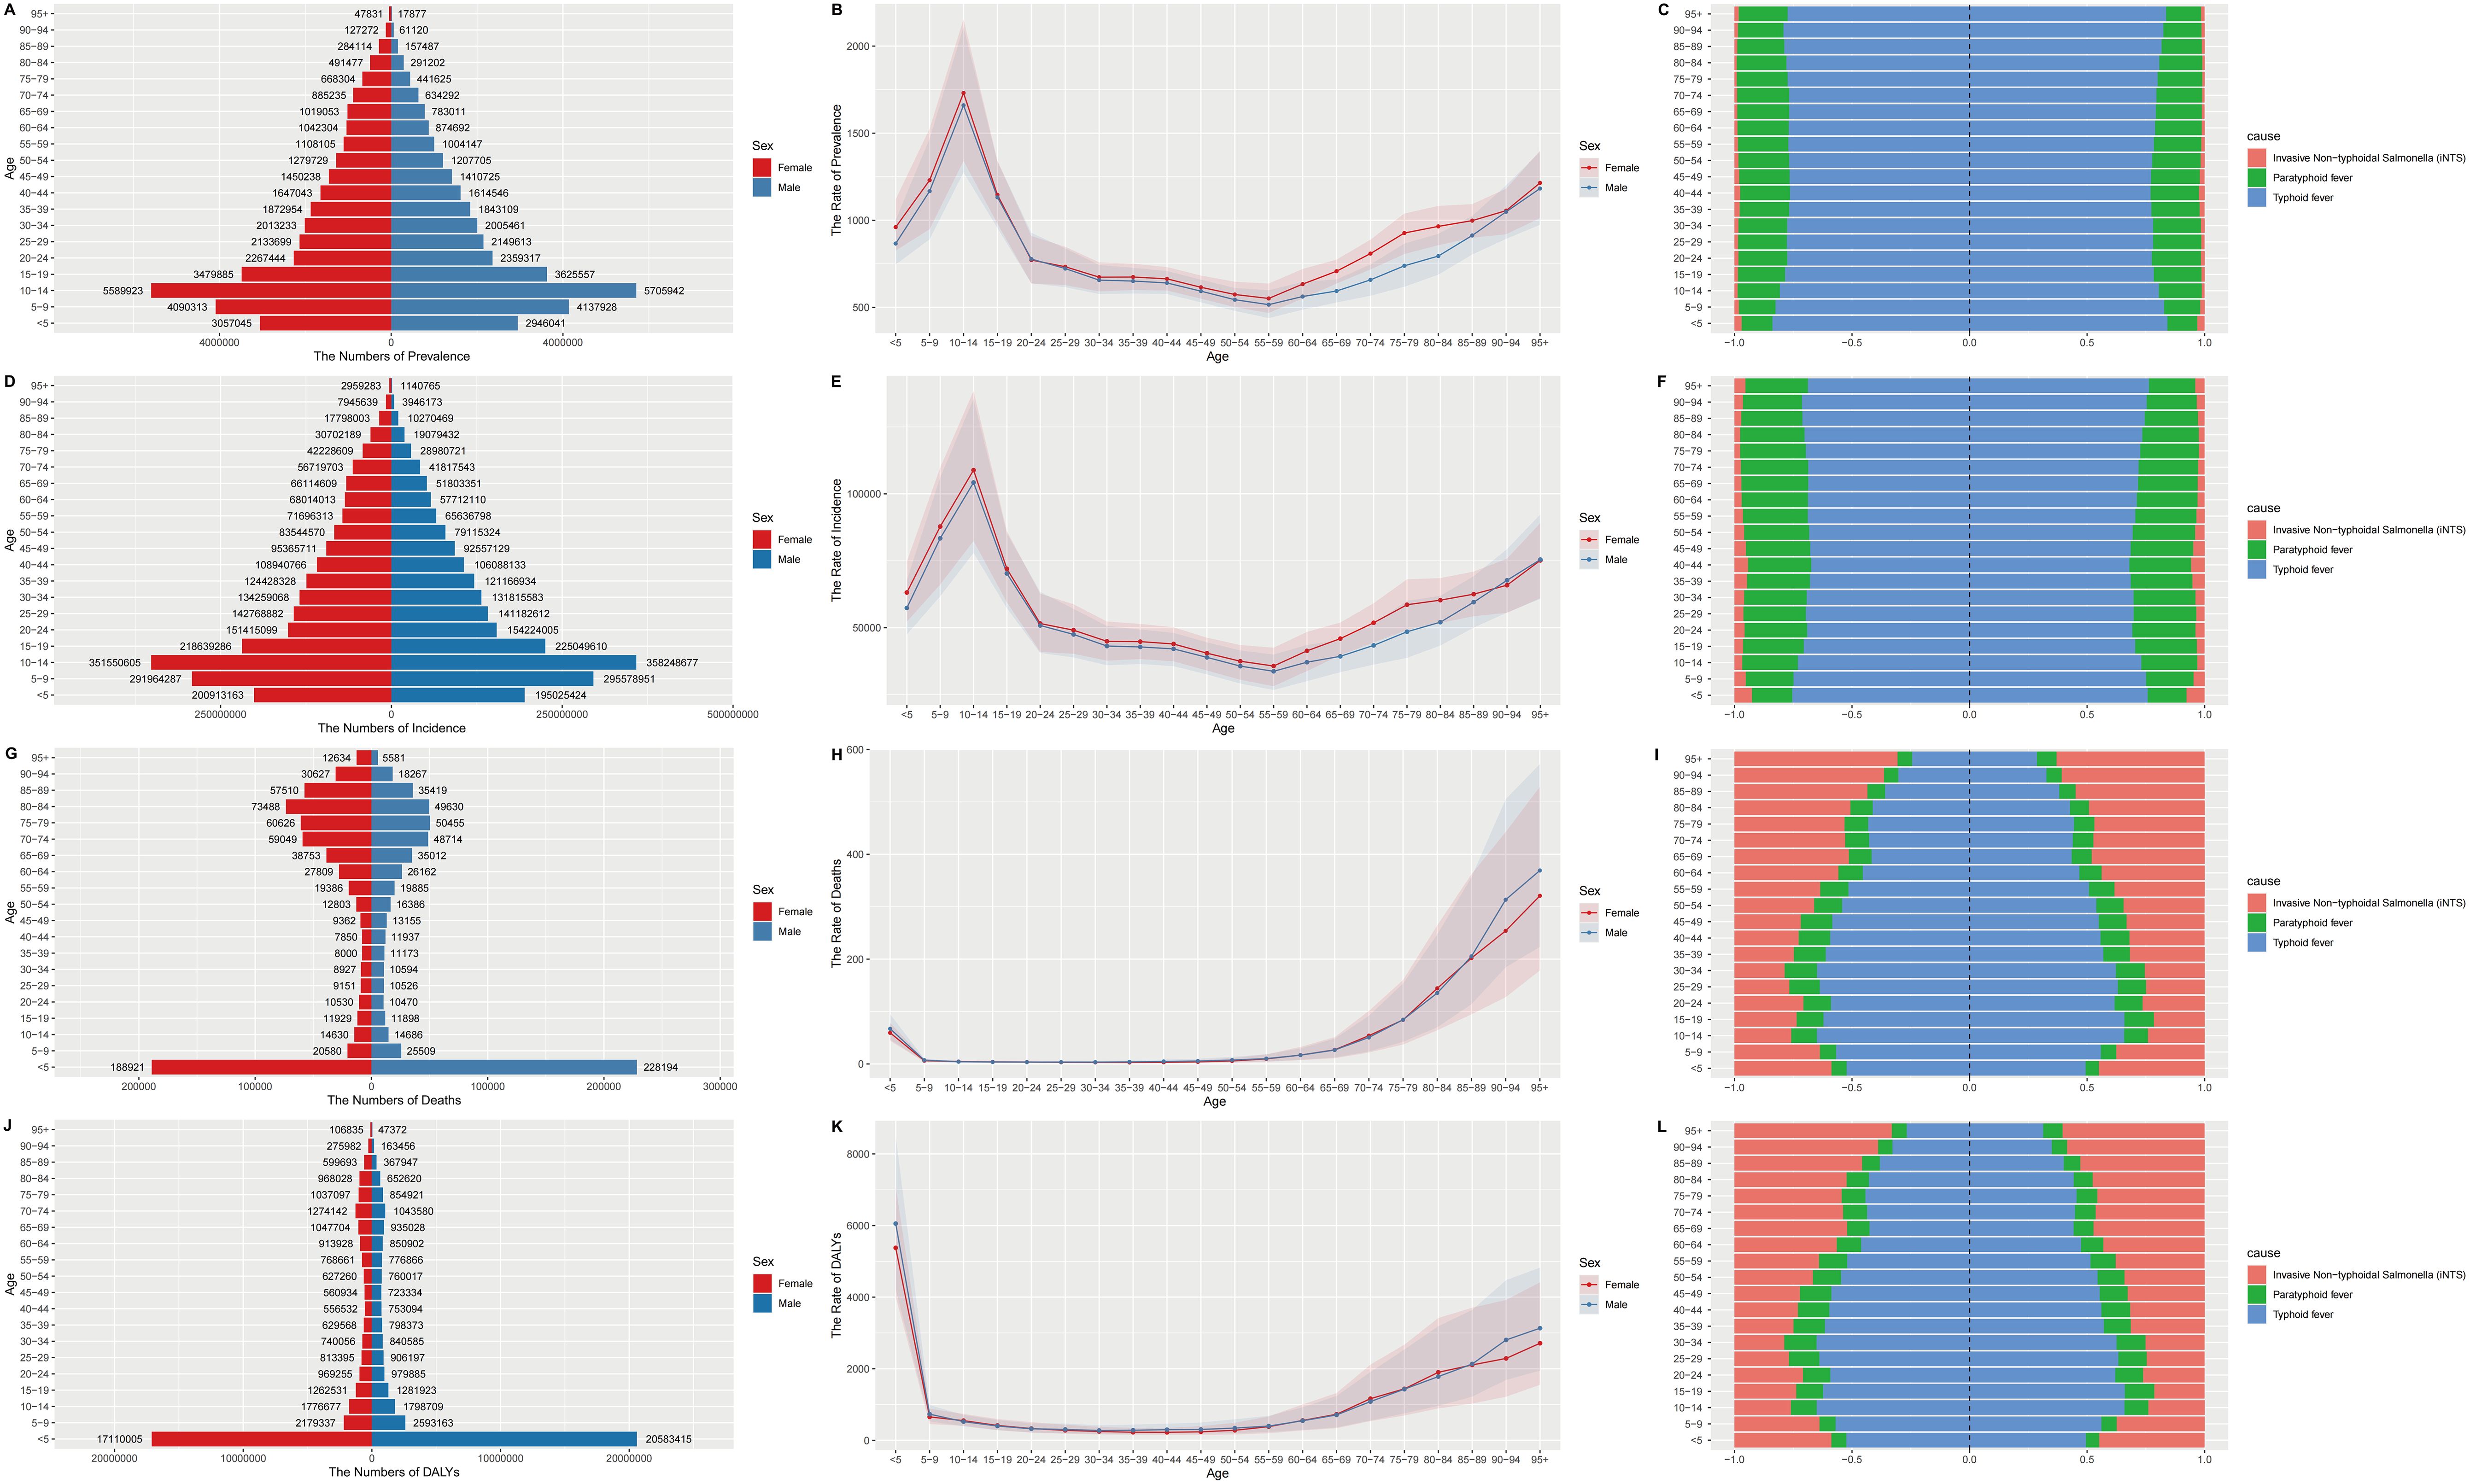
Figure 2. Sex, age-structured, and subtype analysis of enteric infections disease burden in 2021. (A) The number of prevalence; (B) The rate of prevalence; (C) The subtype of prevalence in different age groups; (D) The number of incidence; (E) The rate of incidence; (F) The subtype of incidence in different age groups; (G) The number of deaths; (H) The rate of deaths; (I) The subtype of deaths in different age groups; (J) The number of DALYs; (K) The rate of DALYs; (L) The subtype of DALYs in different age groups. DALYs, disability-adjusted life years.
Overall temporal trends
Globally, prevalence and incidence rose from 1990 to 2011, then declined until 2015. deaths and DALYs consistently declined, with a moderated decrease between 2003 and 2006(Supplementary Figure S2). In High SDI regions, prevalence and incidence rates shifted from a decline to an increase in 2019, while High-middle, Middle, and Low-middle SDI regions saw this change in 2000, 2016, and 2020, respectively. Low SDI regions had two periods of increase, from 2005 to 2009 and from 2018 to 2020. Except for High SDI peaking in 1991, all SDI regions showed a downward trend in deaths and DALYs. Among the 21 GBD regions, Southern Sub-Saharan Africa had the steepest decline in prevalence and Incidence rates, with females showing a significant increase in the rate of decline from 2004, and both genders showing an increase in 2019. Central Latin America saw a sharp decline in deaths and DALYs after an increase from 1995 to 2000 (Supplementary Figure S3).
Association between ASR and SDI
This section primarily depicts the relationship between the four epidemiological indicators and the SDI. From 1990 to 2021, in the global context and across the 21 GBD regions, ASPR and ASIR declined with increasing SDI, but then rose again in High SDI regions. ASMR and ASR of DALYs also decreased with increasing SDI and remained at very low levels from High-middle SDI regions onwards (Figure 3). Analyzing 204 countries and regions in 2021, the overall trend is similar to that of the global and 21 GBD regions (Supplementary Figure S4).
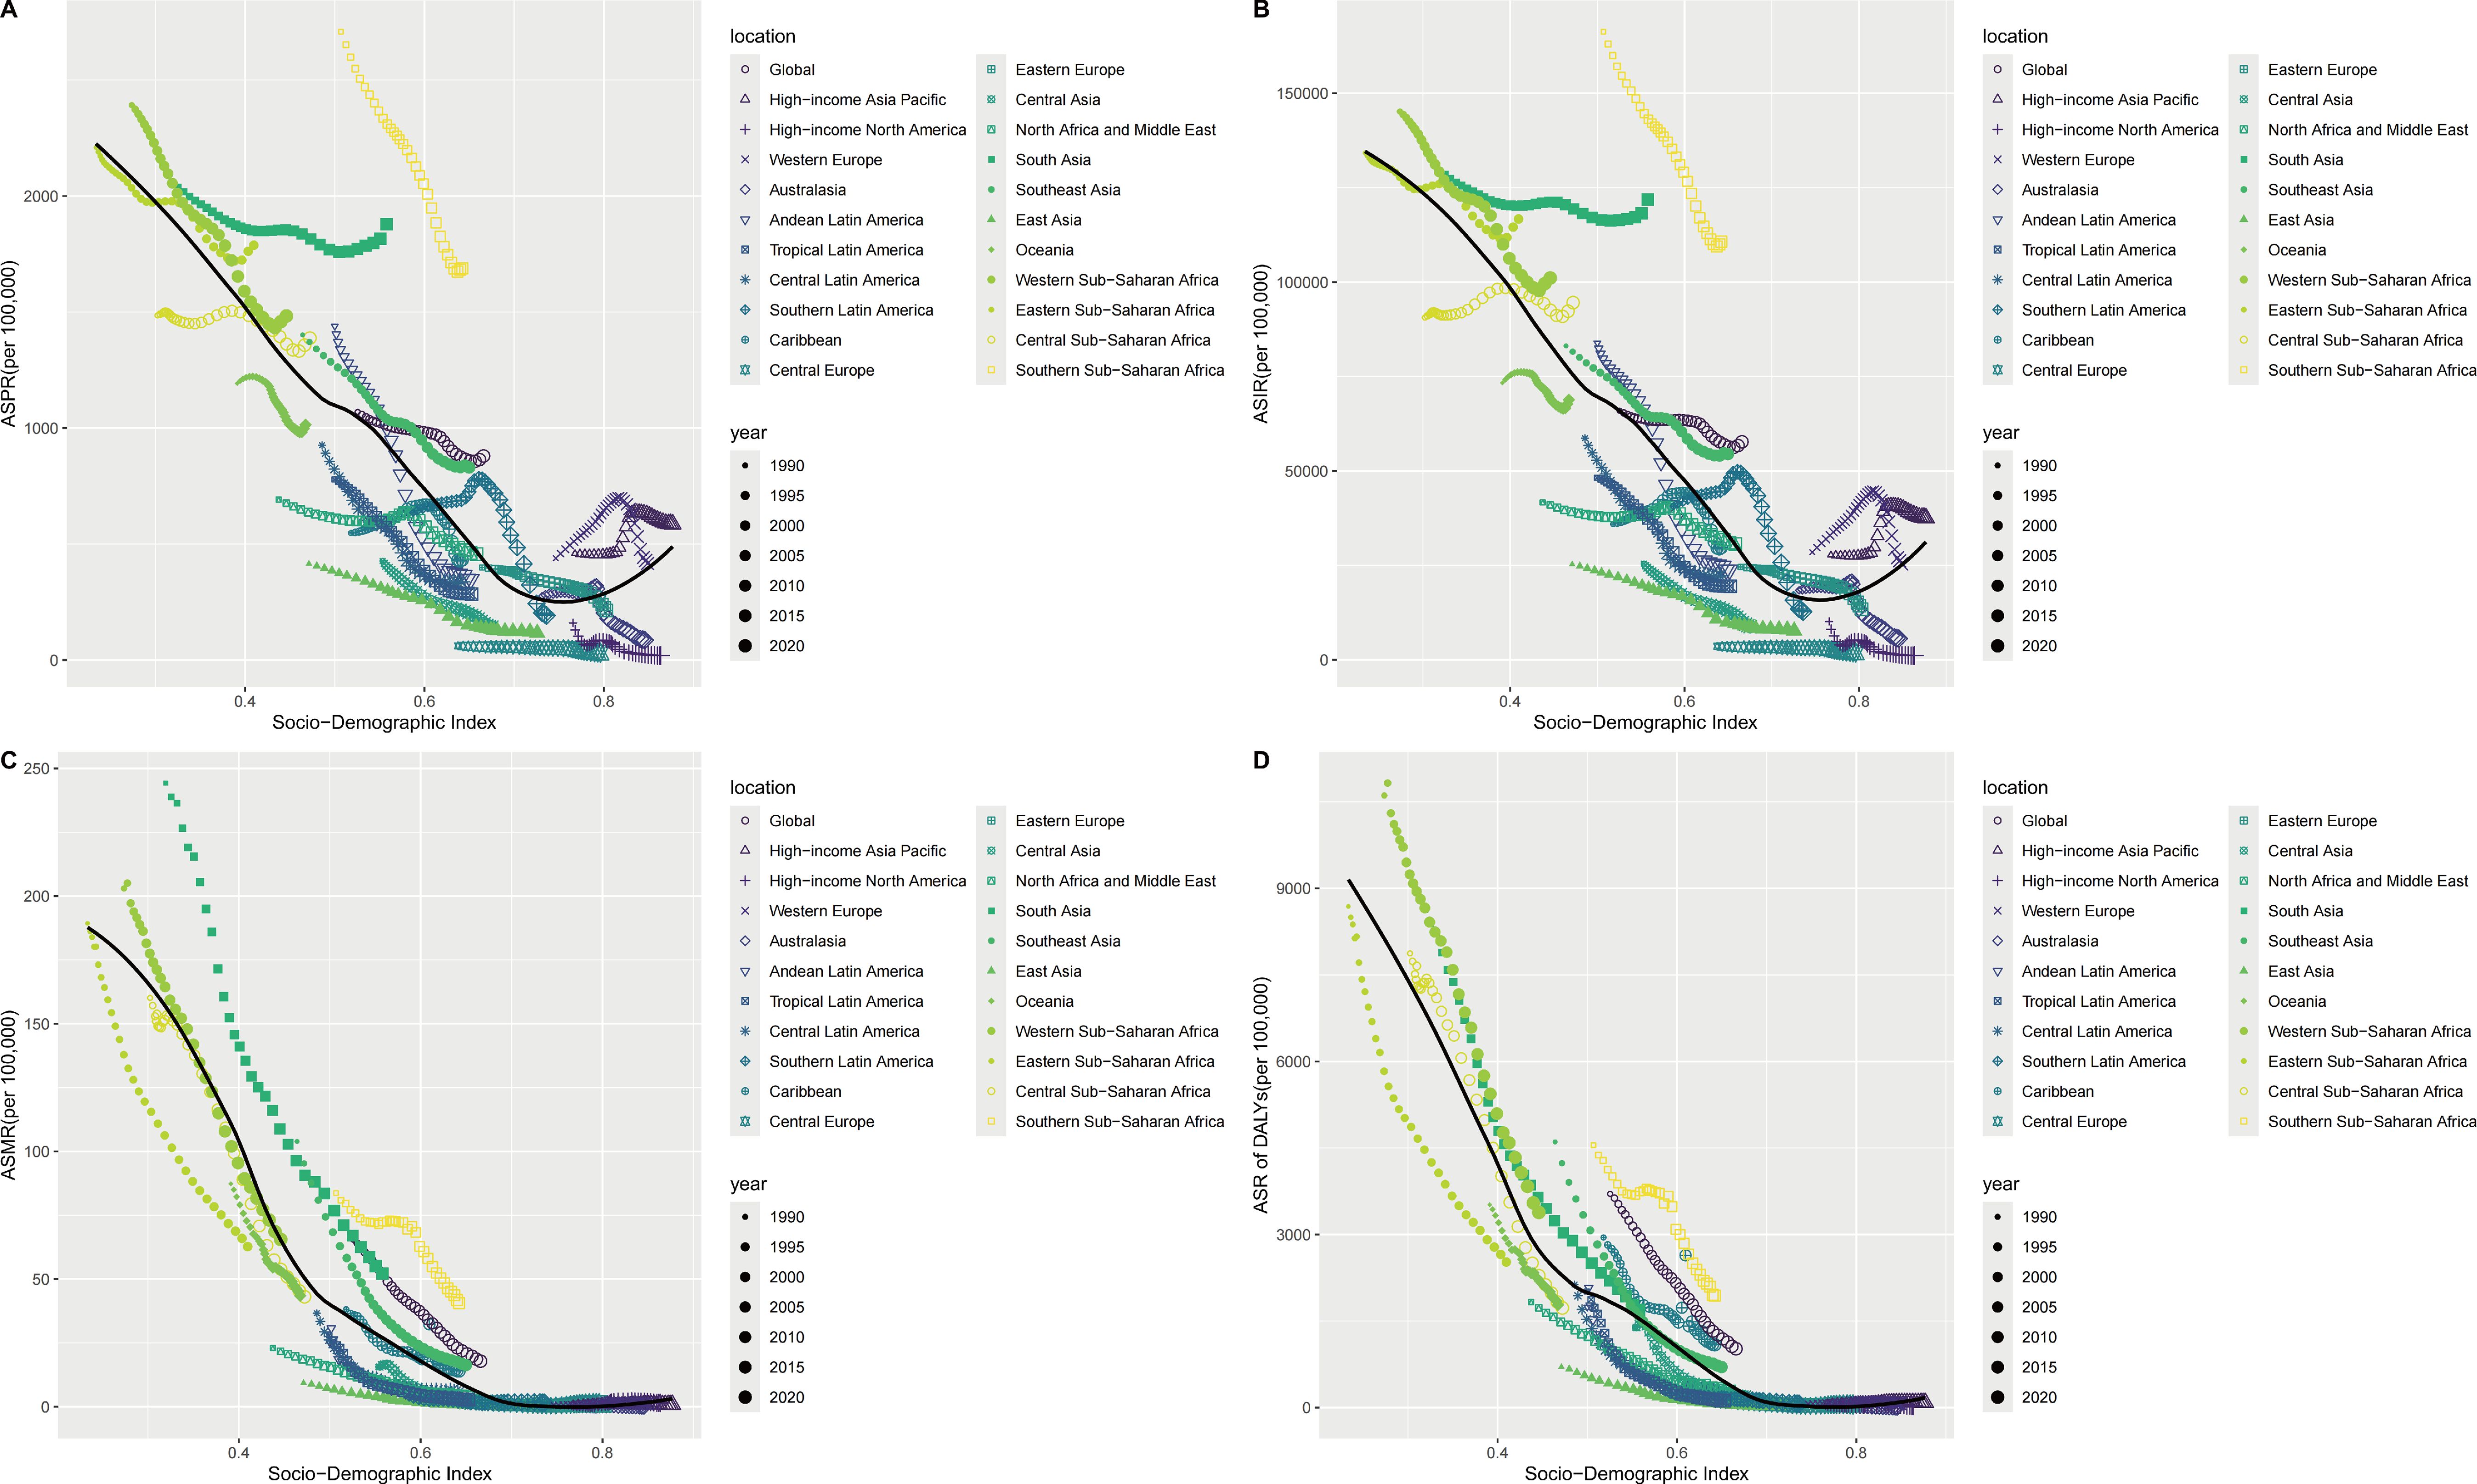
Figure 3. The association of the SDI and ASPR, ASIR ASMR, ASR of DALYs of enteric infections, globe and regions from 1990 to 2021. (A) The association of the SDI and ASPR; (B) The association of the SDI and ASIR; (C) The association of the SDI and ASMR; (D) The association of the SDI and ASR of DALYs. SDI, Socio-demographic index; ASPR, Age-standardized prevalence rates; ASIR, Age-standardized incidence rates; ASMR, Age-standardized mortality rates; ASR, Age-standardized rates; DALYs, Disability-adjusted life years.
Risk factors analysis
Globally, unsafe water source was the largest contributor to DALYs and deaths, with contribution rates of 58% and 59.9% respectively in 2021. In the 5 SDI regions, Low SDI regions had the largest proportion, with deaths and DALYs reaching 65.4% and 63.8%, while in High SDI regions, deaths and DALYs were only 7.7% and 10% respectively. Among the 21 GBD regions, the Caribbean had the largest proportion, with DALYs reaching up to 73.5%, while Western Europe had the lowest proportion, with Deaths at only 3.6% (Figures 4A, B). Other significant factors include unsafe sanitation, child wasting, child underweight, and child stunting, all of which were most prevalent in Low SDI regions (Figure 4). In 1990, the overall situation was similar to 2021, but each factor accounted for a significantly higher proportion (Figures 4C, D).
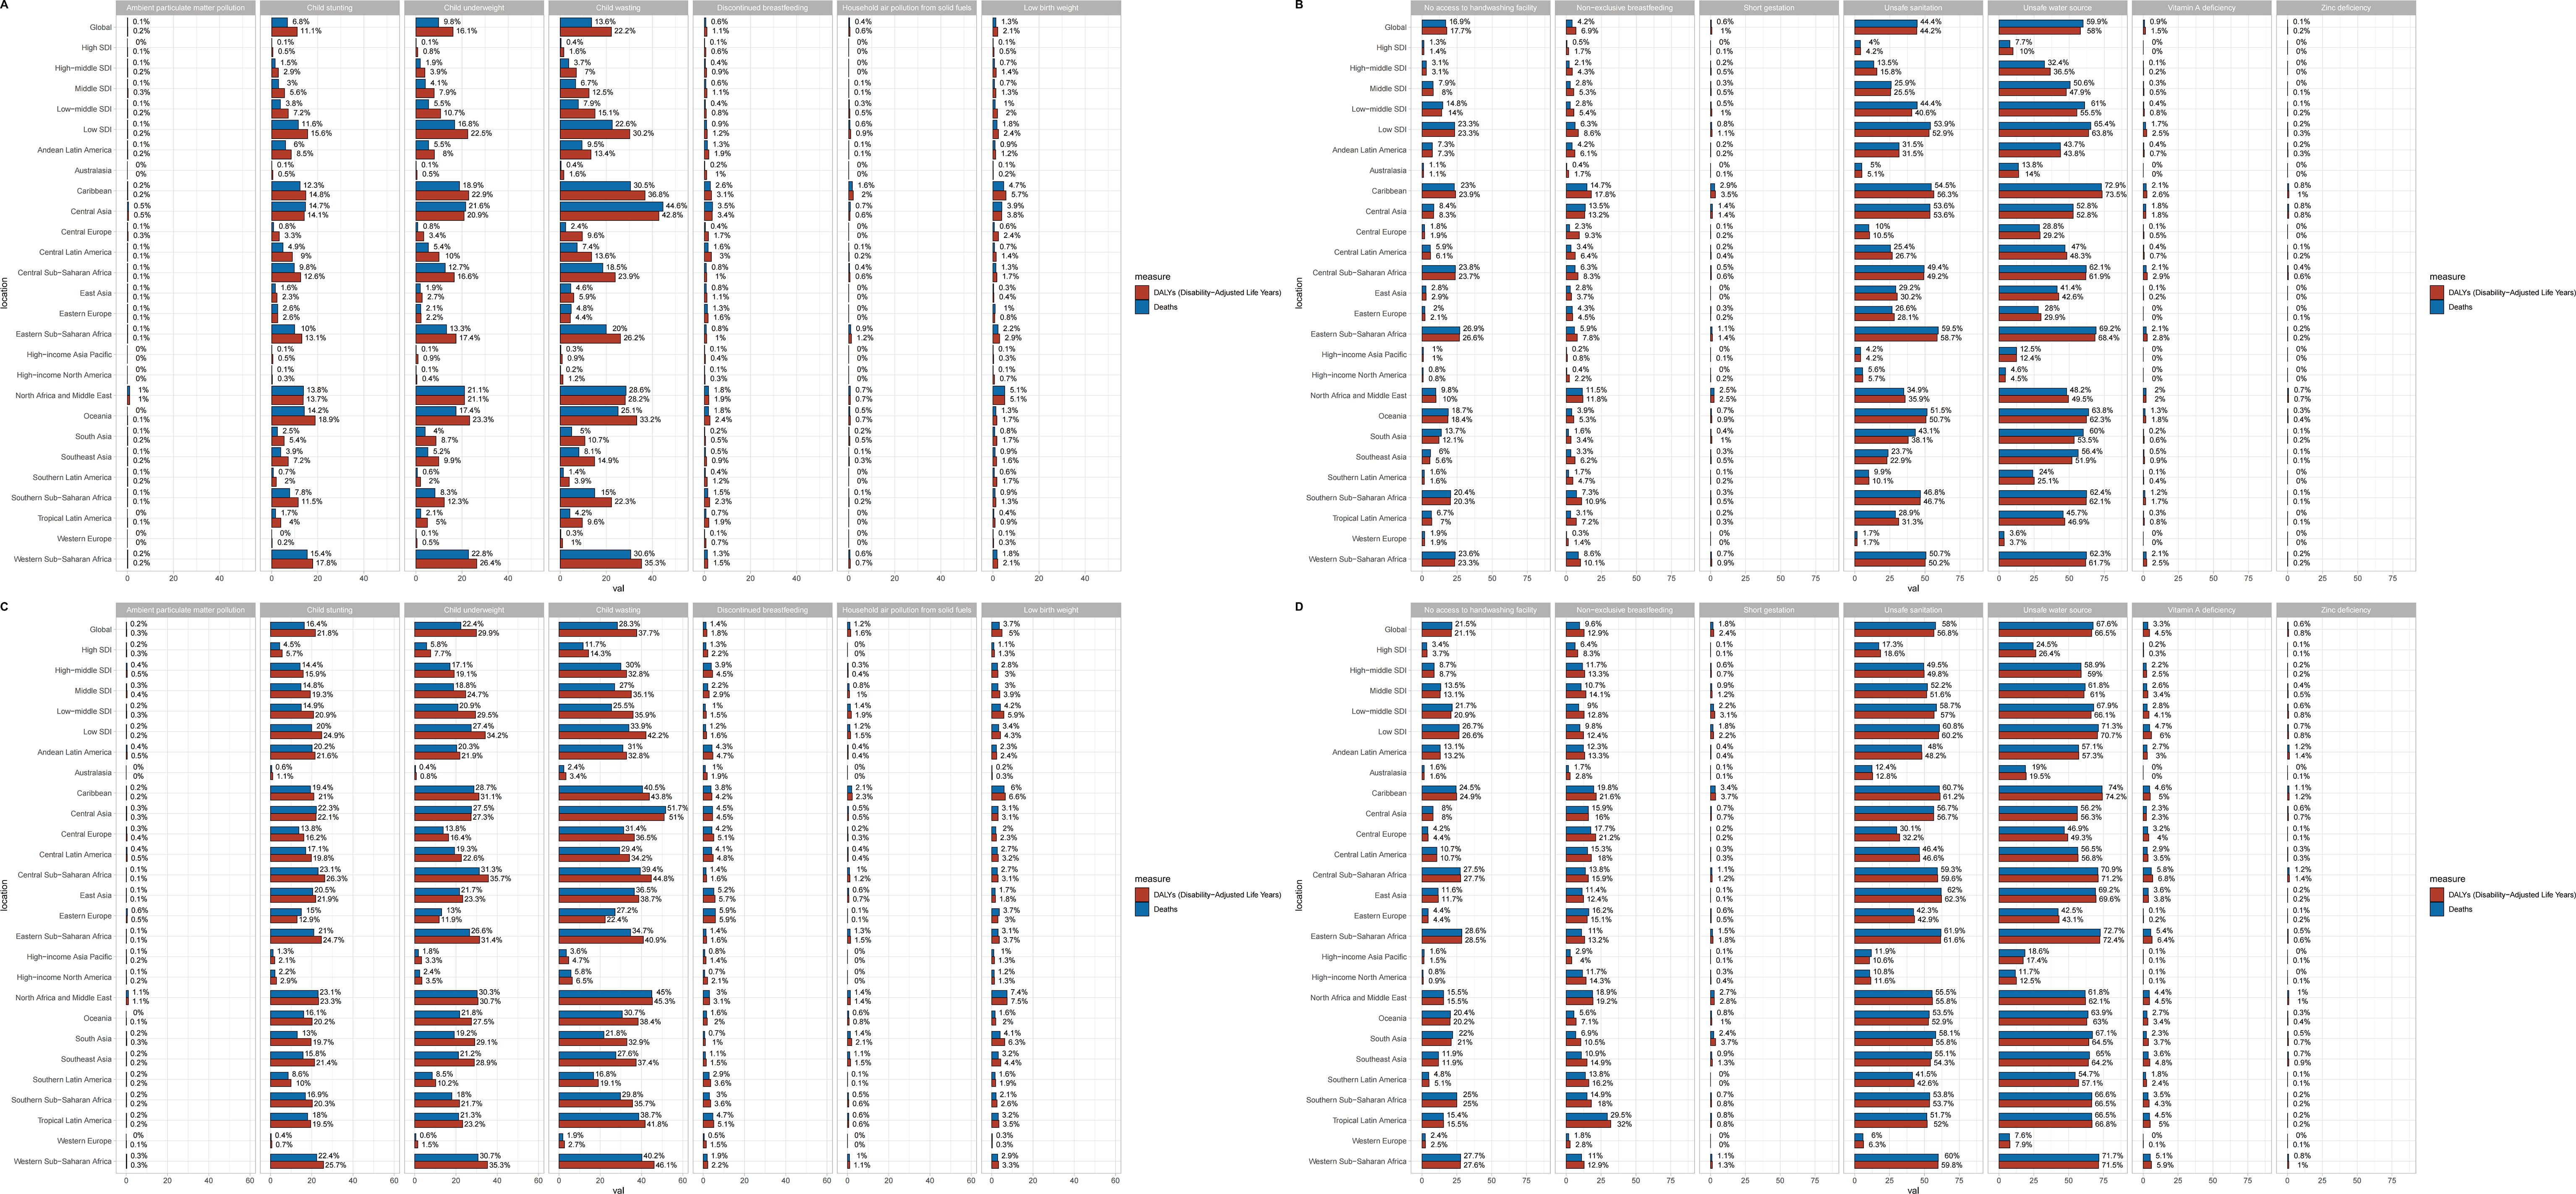
Figure 4. The enteric infections DALYs and deaths attributable to risk factors compared in 2021 and 1990, globally and by 21 GBD regions. (A, B) DALYs and deaths attributable to risk factors in 2021; (C&D) DALYs and deaths attributable to risk factors in 1990. DALYs, Disability-adjusted life years.
Etiological analysis
In 2021, Norovirus emerged as the primary cause of death from enteric infections across all age groups, peaking at 46.33 per 100,000 among individuals over 95. Rotavirus was identified as the main contributor to DALYs in children under 5, with a rate of 1741.65 per 100,000 in 2021, a significant decrease from the 1990 rate of 9398.04 per 100,000 (Figure 5; Supplementary Tables S20-S32). In 2021, Rotavirus was the leading cause of enteric infection fatalities globally, causing 92,607 deaths, with the highest number of total cases in Western Sub-Saharan Africa at 37,189 individuals. Among the five SDI regions, the Low SDI region experienced the highest number of Rotavirus-related deaths. In 1990, the Low-middle SDI region and South Asia had the highest death tolls, with 162,007 and 124,198 fatalities respectively. While Rotavirus has always been the most dangerous pathogen, Shigella was the third leading cause in 1990 with 17,500,460 cases, rising to the second-highest cause in 2021. (Supplementary Figure S5, Supplementary Tables S33-S45 for the global, 5 SDI regions and 21 GBD regions, and Supplementary Tables S46-S58 for 204 countries and territories).
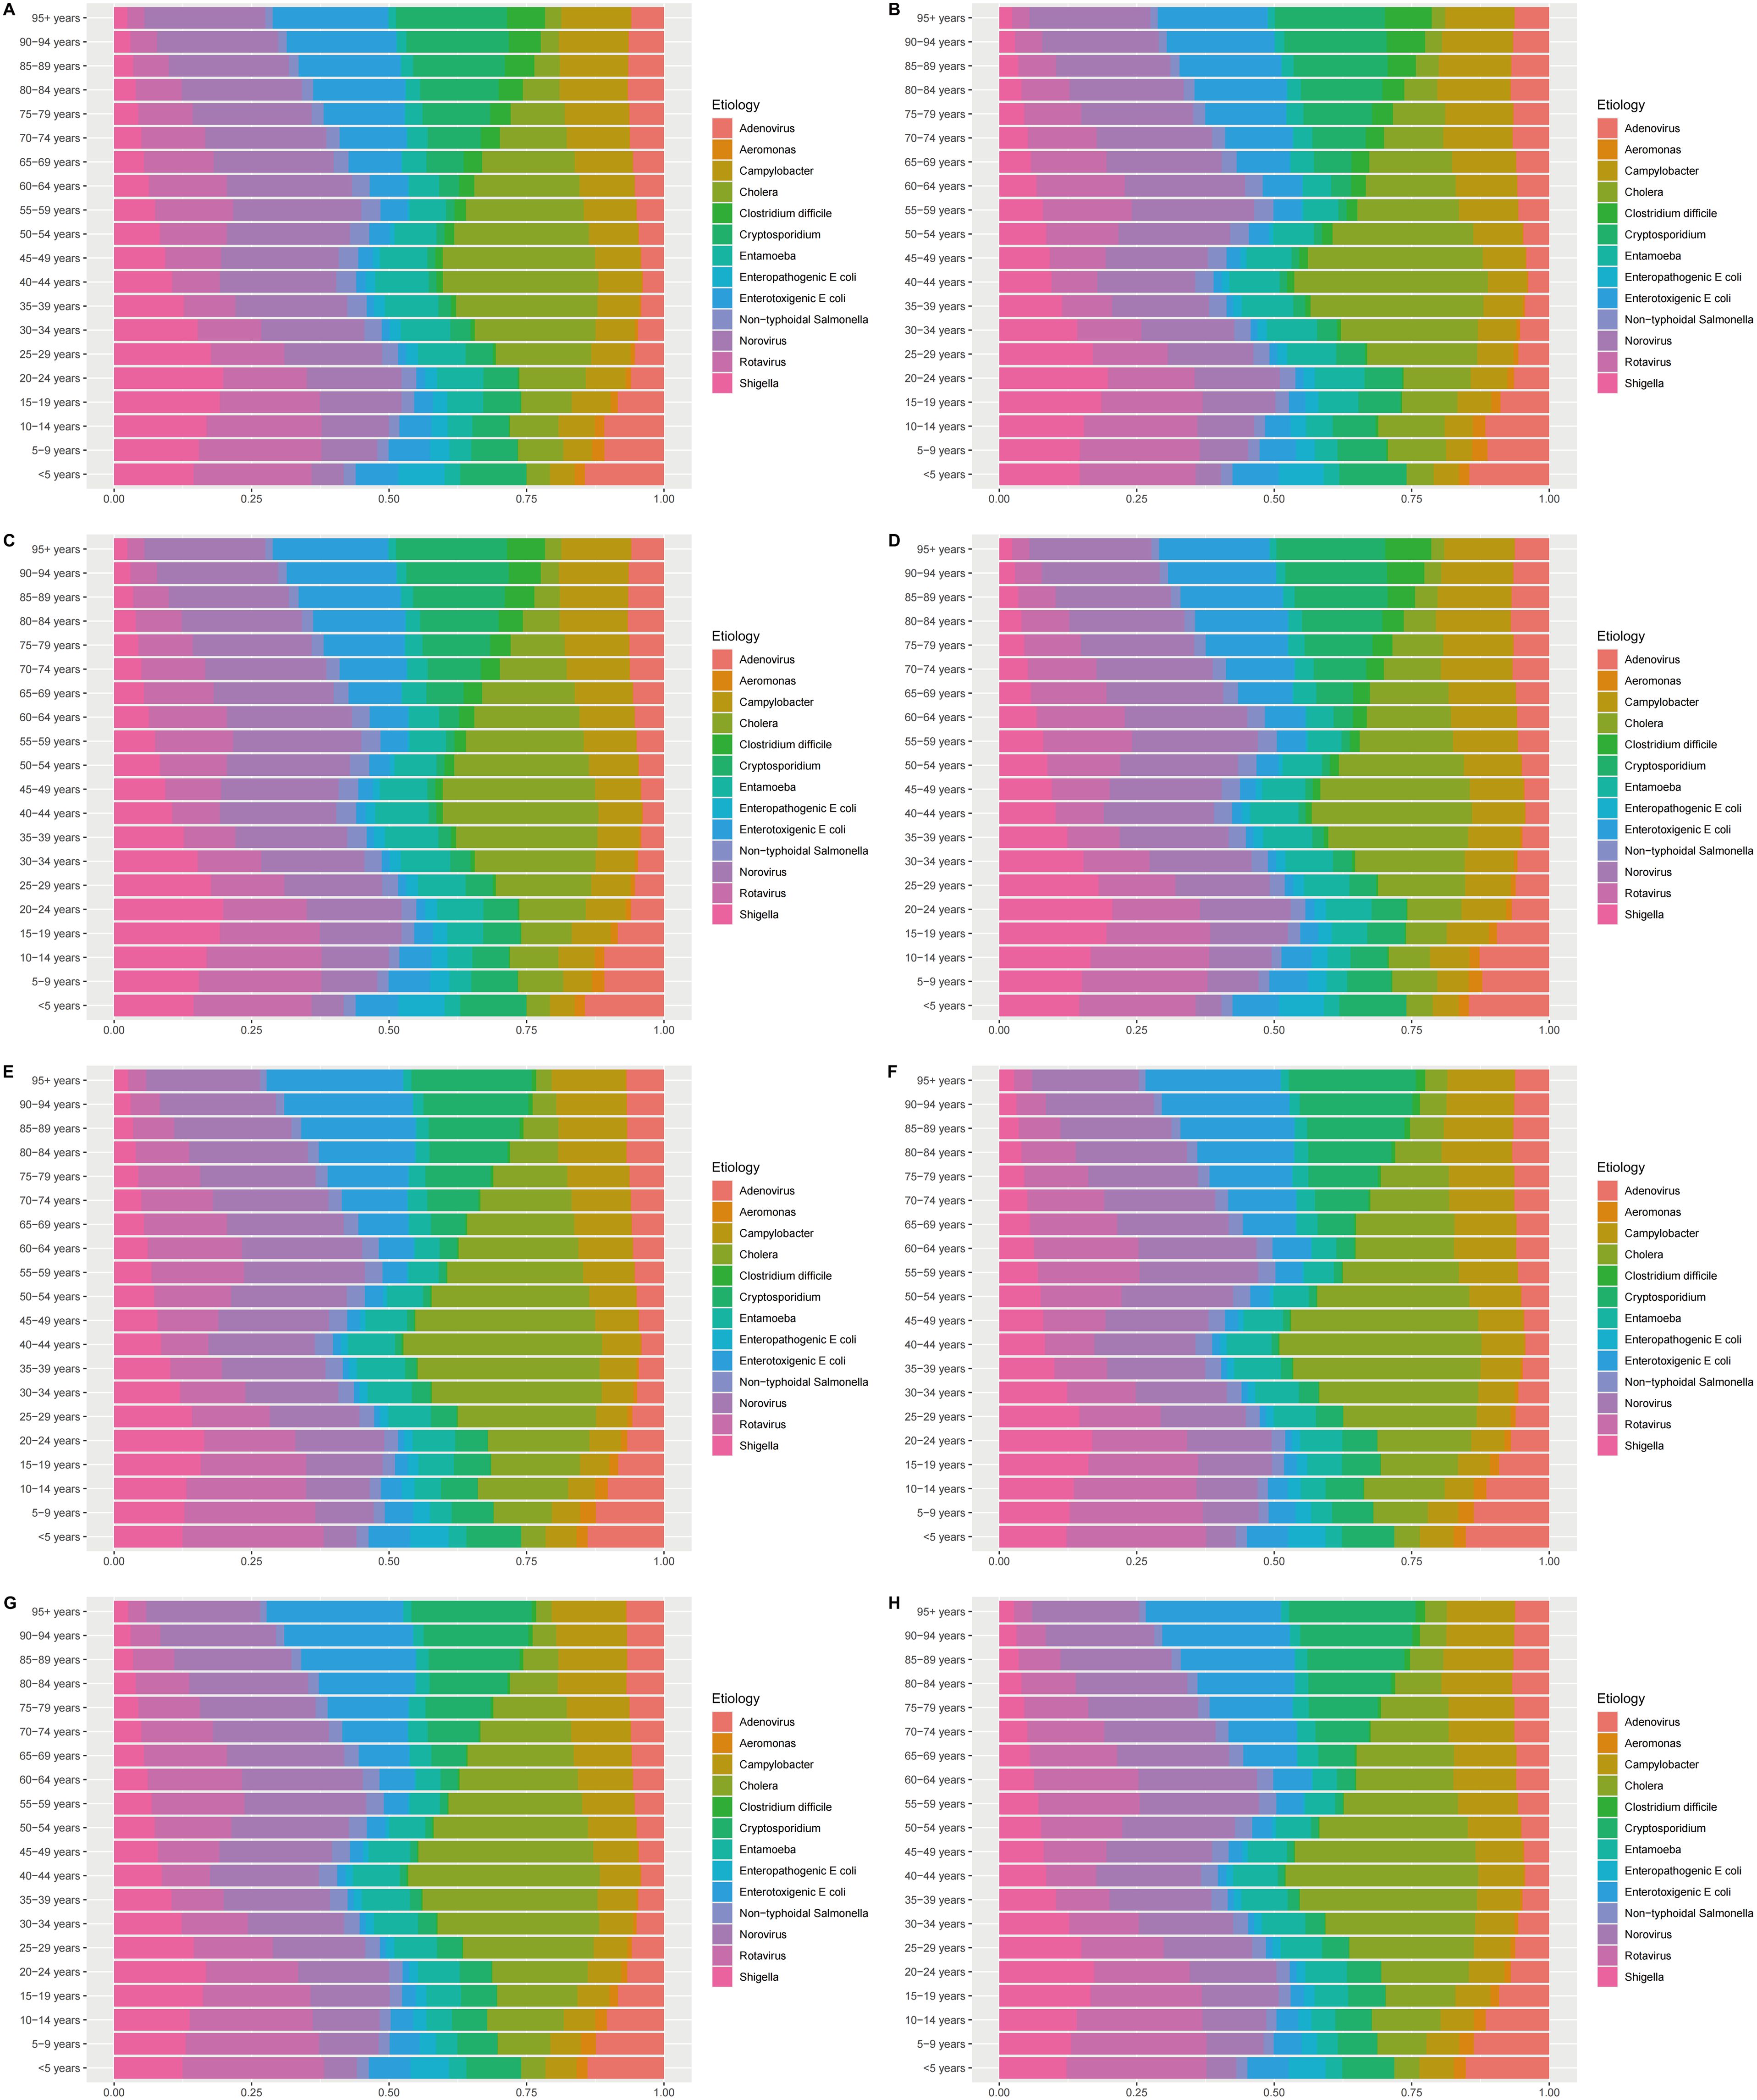
Figure 5. Etiological analysis of enteric infections for both sexes among all age groups in 1990 and 2021. (A) Etiological analysis of males in deaths (2021), (B) Etiological analysis of females in deaths (2021); (C) Etiological analysis of males in DALYs (2021); (D) Etiological analysis of females in DALYs (2021); (E) Etiological analysis of males in deaths (1990), (F) Etiological analysis of females in deaths (1990); (G) Etiological analysis of males in DALYs (1990); (H) Etiological analysis of females in DALYs (1990). DALYs, Disability-adjusted life years.
Overall, there has been a significant decrease in the number of deaths and DALYs caused by various pathogens over the past 32 years. Globally, the number of deaths attributed to Rotavirus decreased from 392, 148 in 1990 to 92, 607 in 2021, and DALYs decreased from 32, 857,936 to 7, 279, 772, indicating a significant reduction in the number of cases.
Decomposition analysis
From 1990 to 2021, the increase in prevalence and incidence globally and in High SDI, Low-middle SDI, and Low SDI regions was primarily due to population growth. In High-middle SDI and Middle SDI regions, there was a decrease, mainly due to epidemiological changes. The reduction in deaths and DALYs across all four SDI regions (except High SDI) was primarily due to epidemiological changes. In High SDI regions, the increase was attributed to aging for deaths in males (45.62%) and epidemiological changes for deaths in females (44.17%). The increase in DALYs was attributed to population growth (Figure 6; Supplementary Table S59).
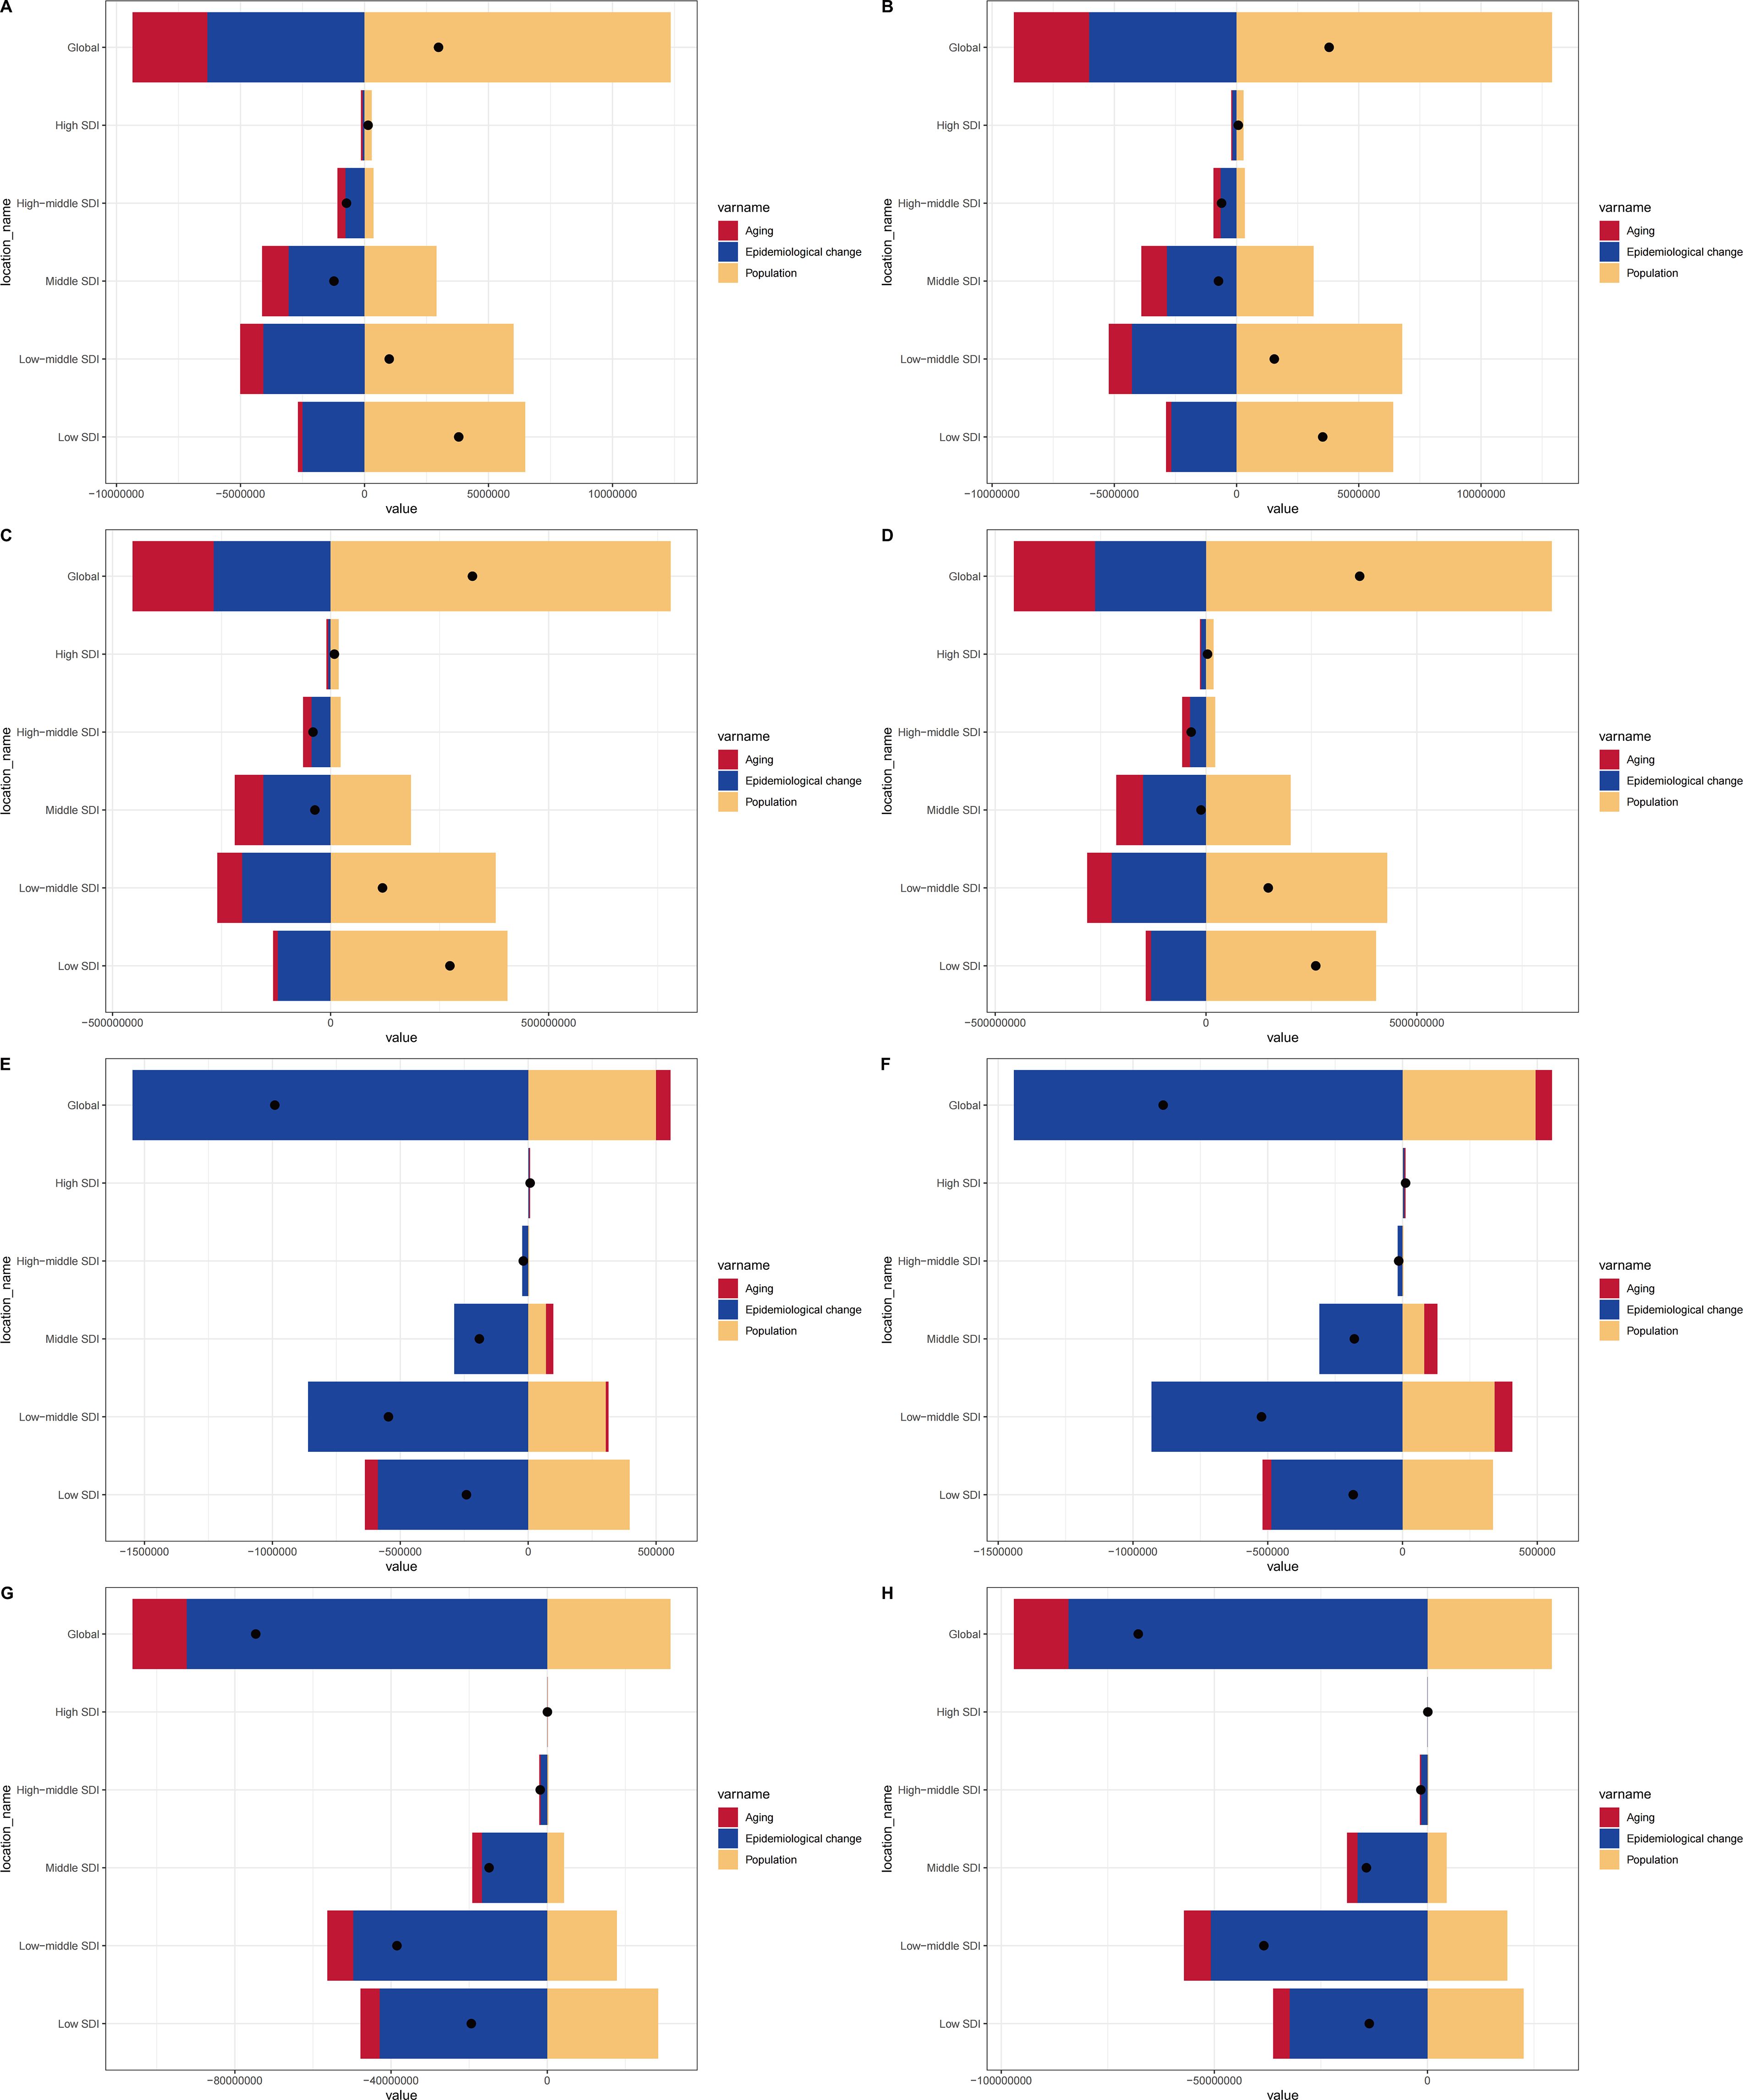
Figure 6. Changes in prevalence, incidence, deaths, and DALYs for both sexes according to population-level determinants of population growth, aging, and epidemiological change from 1990 to 2021 in the globe and SDI regions. (A) Changes in prevalence of males; (B) Changes in prevalence of females; (C) Changes in incidence of males; (D) Changes in incidence of females; (E) Changes in deaths of males; (F) Changes in deaths of females; (G) Changes in DALYs of males; (H) Changes in DALYs of females. SDI, Socio-demographic index; DALYs, Disability-adjusted life years.
Discussion
Enteric infections represent a significant public health challenge worldwide, with a substantial disease burden that has attracted considerable research and attention. This study comprehensively estimated the prevalence, incidence, deaths, and DALYs of enteric infections across 21 global regions, 204 countries and territories, and age groups, as well as risk factors, providing a detailed picture of the disease burden of enteric infections. The main findings are as follows:
Regional variability and risk factors
High-ranking regions for ASPR and ASIR are Low SDI and South Asia, while ASMR and ASR of DALYs are highest in Low SDI and Western Sub-Saharan Africa. America than in South Asia and in sub-Saharan Africa, but higher than in high-income regions. Unsafe water sources contribute significantly to high DALYs and deaths in Low SDI regions, accounting for up to 65.4% and 63.8% respectively. Limited water infrastructure and the use of contaminated drinking water are significant factors (Bain et al., 2014). Inadequate water facilities increase exposure to contaminated sources. In rural Bangladesh, the risk of neonatal death is 3.12 times higher in households without toilets than in those with toilets (Rahman et al., 1985). In many developing areas, untreated water from wells and rivers is used for drinking, bathing, and irrigation (Laffite et al., 2016), leading to severe fecal contamination, especially in rainy and dry seasons (Kayembe et al., 2018).In Latin America and the Caribbean, as well as in East Asia and the Pacific region, the reduction in temperature-attributable enteric infection deaths caused by viral pathogens has led to a net decrease in overall temperature-related enteric infection mortality (Verlicchi et al., 2010).
ASMR and ASR of DALYs decreased with increasing SDI, but the regions with the fastest growth in ASMR and the slowest decrease in ASR of DALYs were High SDI regions, specifically High-income North America and Western Europe. In these high-income areas, policies and facilities have reduced the impact of unsafe water resources on enteric infection-related diseases, but hospital wastewater may become a new source of infection (Boillot et al., 2008; Verlicchi et al., 2010), with its complex mixture of chemicals and biological substances potentially promoting the spread of bacteria and their antibiotic resistance genes (Cosgrove, 2006).
From 1990 to 2021, the global and 21 GBD regions showed a downward trend in ASPR and ASIR with increasing SDI, reflecting the positive impact of socio-economic development on health status improvement. Notably, in 2021, High-income Asia Pacific ranked high in ASPR and ASIR, which, in addition to unsafe water resources, may also reflect the high sensitivity or high-risk exposure of specific populations in the region, such as the elderly, chronic disease patients, or immigrant groups, to enteric infections. The systemic inflammation that occurs during aging can lead to dysbiosis (Li et al., 2016), and the microbiota that was dominant in youth can become pathogen-rich, such as Enterobacteriaceae (Fransen et al., 2017), increasing the risk of disease. The high-fat and high-sugar dietary habits common in High-income Asia Pacific may promote dysbiosis (Randeni et al., 2024). Also, physical activity, stress levels, sleep patterns, medication use, and even mental state can affect the gut microbiome (Mundula et al., 2022; Mundula et al., 2023). Over the past three decades, environmental issues and international travel have significantly increased transmission risk and infection prevalence of enteric diseases (Love et al., 2024). So the incidence of disease increases significantly for those who have traveled to South Asian countries such as India, Nepal, and Bhutan (Kuenzli et al., 2017).
Subtype analysis
In 2021, typhoid fever was the leading cause of high intestinal infections (prevalence and incidence) in Central Latin America and Southeast Asia (Supplementary Figure S1). A systematic review and meta-analysis of case-control studies assessing the association between typhoid and WASH as well as food exposure suggested that poor sanitation and untreated water had the strongest correlation with typhoid risk (Brockett et al., 2020). Moreover, warm and humid climates likely contribute to pathogen survival and growth, with higher temperatures enhancing their proliferation (Lal et al., 2012). Furthermore, Salmonella typhi has developed strong drug resistance (Browne et al., 2020). From a low base in 1990, the prevalence of fluoroquinolone-resistant Salmonella typhi surged, reaching an overall prevalence of 95.2% in South Asia by 2019 (Zakir et al., 2021; GRAM Typhoid Collaborators for 2024, 2024). Since 2016, Pakistan has experienced an outbreak of typhoid caused by extensively drug-resistant (XDR) S., which may be closely related to international air travel (Walker et al., 2023).
It is noteworthy that in High-income North America and High-income Asia Pacific regions, typhoid fever accounts for the smallest proportion of enteric infection deaths and DALYs; instead, iNTS has become the main cause of death, mainly related to the difficulty in treating iNTS and its multiple complications (Supplementary Figure S1). A meta-analysis indicated that a significant proportion of patients with non-typhoidal Salmonella invasive diseases have life-threatening complications such as encephalopathy and pleuropulmonary infections. Among the 84 studies it summarized, 66 (78.6%) had a high overall bias risk, 18 (21.4%) were at moderate risk, none were at low risk, and about 15% of patients with non-typhoidal Salmonella invasive diseases eventually died (Marchello et al., 2022), highlighting the deadliness of iNTS.
Age and gender analysis
Age and gender both influence the gut microbiota (Singh and Manning, 2016). According to age analysis, the burden is heavier on infants, adolescents, and the elderly (Figure 2). The richness of the microbial community increases with age in children, but it is still lower than the diversity of the adult microbiota at the age of 5 (Roswall et al., 2021). Additionally, the mode of birth, microbiota-directed food, and other factors may be related to the gut microbiota in early life (Gehrig et al., 2019). Furthermore, whether mothers wash their hands before breastfeeding and after cleaning the child, the child’s use of toilet facilities and the child’s hygiene habits such as washing hands before meals and not putting hands in the mouth can also be contributing factors.
Elderly individuals often acquire frailness-associated bacteria like low Bifidobacterium (Pang et al., 2023). Long-term medication use can lead to abnormal microbiomes and metabolomes in the elderly (Forslund et al., 2021; Li et al., 2024), contributing to higher death rates, along with physical decline and hospital-acquired infections (Taylor and Oppenheim, 1998). Malnutrition, including child wasting, stunting, underweight, and unsafe sanitation significantly increase the risk of intestinal infections in children, with 48.7% of malnourished children in southern Ethiopia affected by parasitic infections (Yoseph and Beyene, 2020).
The greater burden of prevalence and incidence in females than in males may be largely influenced by cultural customs. In rural communities in West Bengal, India, logistic regression analysis showed that boys had 4.2 times more opportunity to spend more money on medical treatment and were 4.9 times more likely to receive early medical care than girl, with the highest gender bias among mothers with higher education (Bhan et al., 2005).
Etiological analysis
In the field of enteric infections, there have been significant changes in the distribution of causes and the resulting deaths and DALYs in recent years. From 1990 to 2021, Norovirus, Enterotoxigenic E. coli, and Cryptosporidium have continued to pose threats worldwide, but Rotavirus has always dominated, especially in causing deaths from intestinal infections in children.
However, it is noteworthy that over the past 32 years, there has been a significant decrease in the number of deaths and DALYs caused by various etiologies of enteric infections. Taking Rotavirus as an example, the global deaths it caused dropped from 392,147 in 1990 to 92,607 in 2021, and DALYs decreased from 32,857,936 to 7,279,772, mainly due to the widespread vaccination against Rotavirus and the strengthening of global healthcare (Soares-Weiser et al., 2019). Since 2006, vaccines such as RotaTeq, Rotarix, and Rotavac, which have been proven to significantly prevent Rotavirus infection have gradually been approved and launched (Wiedermann and Kollaritsch, 2006). Governments and research institutions around the world are also continuously exploring the development and application of new Rotavirus vaccines to achieve better prevention outcomes (ACIP recommends new vaccine to prevent rotavirus. An update from CDC, 2006).
Overall and future trends analysis
From 1990 to 2021, global prevalence and incidence of enteric infections saw turning points in 2011 and 2015, likely due to increased vaccine R&D investments by WHO and governments, especially the broader use of vaccines like Rotavirus (Muhsen et al., 2015; Enane et al., 2016; Kobayashi et al., 2018).
In high SDI regions, the downward trend in prevalence and incidence rates for both males and females reversed to an upward trend in 2019 (Leung et al., 2003). The emergence of COVID-19 in 2019 was primarily a respiratory infection, often accompanied by gastrointestinal involvement, and up to half of patients’ gastrointestinal symptoms preceded respiratory symptoms, which complicated the treatment of intestinal infections (Jin et al., 2022). COVID-19 or antiviral treatments may also cause liver damage, adding to the challenge of managing enteric infections (Chen et al., 2020). Despite this, deaths and DALYs showed a downward trend across all SDI regions, except for high SDI. This could be attributed to advancements in medical technology and increased medical resources, significantly improving treatment outcomes for intestinal infectious diseases (Zhou et al., 2023; Cheng et al., 2024). Early detection, diagnosis, and treatment have also reduced the disease’s impact on patients, thereby reducing DALYs (Zhou et al., 2023; Cheng et al., 2024).
Limitations
However, this study also has limitations. First, the GBD database primarily compiles data from national and regional reports and publications, rather than direct national reports, which may lead to issues with data completeness, timeliness, and quality, especially in low-income areas where there may be a lack of access to raw data, potentially hindering GBD researchers in their estimations. Additionally, differences in disease management across countries and regions, including diagnosis, recording, and reporting, may affect the results.
Data availability statement
The original contributions presented in the study are included in the article/Supplementary Material. Further inquiries can be directed to the corresponding authors.
Author contributions
YZ: Conceptualization, Data curation, Formal Analysis, Funding acquisition, Investigation, Methodology, Software, Writing – original draft, Writing – review & editing. YRZ: Conceptualization, Formal Analysis, Investigation, Validation, Writing – original draft, Writing – review & editing. ZC: Formal Analysis, Investigation, Resources, Writing – original draft, Writing – review & editing. ZJ: Visualization, Writing – original draft, Writing – review & editing. YY: Data curation, Writing – original draft, Writing – review & editing. JW: Funding acquisition, Supervision, Writing – original draft, Writing – review & editing. HL: Supervision, Writing – review & editing.
Funding
The author(s) declare that financial support was received for the research and/or publication of this article. This study was supported by Special Fund Project for Science and Technology Innovation Strategy of Guangdong Province (Grant number pdjh2023b0107), Shenzhen Science and Technology Planning Project (No. JCYJ20220530165014033), Medical research project of Shenzhen Longhua Medical Association (2023LHMA10) and Shenzhen Medical Key Discipline (No. MKD202007090201), Special Fund for Science and Technology Innovation in Longhua District, Shenzhen (11501A20240704D87ABF8).
Acknowledgments
We appreciate the excellent works by the Global Burden of Diseases, Injuries, and Risk Factors Study (GBD) 2021 collaborators.
Conflict of interest
The authors declare that the research was conducted in the absence of any commercial or financial relationships that could be construed as a potential conflict of interest.
Generative AI statement
The author(s) declare that no Generative AI was used in the creation of this manuscript.
Publisher’s note
All claims expressed in this article are solely those of the authors and do not necessarily represent those of their affiliated organizations, or those of the publisher, the editors and the reviewers. Any product that may be evaluated in this article, or claim that may be made by its manufacturer, is not guaranteed or endorsed by the publisher.
Supplementary material
The Supplementary Material for this article can be found online at: https://www.frontiersin.org/articles/10.3389/fcimb.2025.1527765/full#supplementary-material
References
(2006). ACIP recommends new vaccine to prevent rotavirus. An update from CDC. (Chinese Center For Disease Control And Prevention) 105, 20.
Bain, R., Cronk, R., Hossain, R., Bonjour, S., Onda, K., Wright, J., et al. (2014). Global assessment of exposure to faecal contamination through drinking water based on a systematic review. Trop. Med. Int. Health 19, 917–927. doi: 10.1111/tmi.2014.19.issue-8
Bhan, G., Bhandari, N., Taneja, S., Mazumder, S., Bahl, R. (2005). The effect of maternal education on gender bias in care-seeking for common childhood illnesses. Soc. Sci. Med. 60, 715–724. doi: 10.1016/j.socscimed.2004.06.011
Boccuzzi, S. J. (2003). “Indirect health care costs,” in Cardiovascular Health Care Economics. Ed. Weintraub, W. S. (Humana Press, Totowa, NJ), 63–79.
Boillot, C., Bazin, C., Tissot-Guerraz, F., Droguet, J., Perraud, M., Cetre, J. C., et al. (2008). Daily physicochemical, microbiological and ecotoxicological fluctuations of a hospital effluent according to technical and care activities. Sci. Total Environ. 403, 113–129. doi: 10.1016/j.scitotenv.2008.04.037
Brockett, S., Wolfe, M. K., Hamot, A., Appiah, G. D., Mintz, E. D., Lantagne, D. (2020). Associations among water, sanitation, and hygiene, and food exposures and typhoid fever in case-control studies: A systematic review and meta-analysis. Am. J. Trop. Med. Hyg 103, 1020–1031. doi: 10.4269/ajtmh.19-0479
Browne, A. J., Hamadani, B. H. K., Kumaran, E. A. P., Rao, P., Longbottom, J., Harriss, E., et al. (2020). Drug-resistant enteric fever worldwide, 1990 to 2018: a systematic review and meta-analysis. BMC Med. 18, 22. doi: 10.1186/s12916-019-1443-1
Chen, N., Zhou, M., Dong, X., Qu, J., Gong, F., Han, Y., et al. (2020). Epidemiological and clinical characteristics of 99 cases of 2019 novel coronavirus pneumonia in Wuhan, China: a descriptive study. Lancet 395, 507–513. doi: 10.1016/S0140-6736(20)30211-7
Cheng, Z., Wang, T., Jiao, Y., Qi, J., Zhang, X., Zhou, S., et al. (2024). Burden of digestive system diseases in China and its provinces during 1990-2019: Results of the 2019 Global Disease Burden Study. Chin. Med. J. (Engl) 137, 2182–2189. doi: 10.1097/CM9.0000000000003277
Cosgrove, S. E. (2006). The relationship between antimicrobial resistance and patient outcomes: mortality, length of hospital stay, and health care costs. Clin. Infect. Dis. 42, S82–S89. doi: 10.1086/499406
Das Gupta, P. (1978). A general method of decomposing a difference between two rates into several components. Demography 15, 99–112. doi: 10.2307/2060493
Debellut, F., Friedrich, A., Baral, R., Pecenka, C., Mugisha, E., Neuzil, K. M. (2024). The cost of typhoid illness in low- and middle-income countries, a scoping review of the literature. PloS One 19, e0305692. doi: 10.1371/journal.pone.0305692
Enane, L. A., Gastañaduy, P. A., Goldfarb, D. M., Pernica, J. M., Mokomane, M., Moorad, B., et al. (2016). Impact of rotavirus vaccination on hospitalizations and deaths from childhood gastroenteritis in Botswana. Clin. Infect. Dis. 62 Suppl 2, S168–S174. doi: 10.1093/cid/civ1210
Forslund, S. K., Chakaroun, R., Zimmermann-Kogadeeva, M., Markó, L., Aron-Wisnewsky, J., Nielsen, T., et al. (2021). Combinatorial, additive and dose-dependent drug–microbiome associations. Nature 600, 500–505. doi: 10.1038/s41586-021-04177-9
Fransen, F., van Beek, A. A., Borghuis, T., Aidy, S. E., Hugenholtz, F., van-der-Gaast-de-Jongh, C., et al. (2017). Aged Gut Microbiota Contributes to Systemical Inflammaging after Transfer to Germ-Free Mice. Front. Immunol. 8, 1385. doi: 10.3389/fimmu.2017.01385
GBD 2021 Causes of Death Collaborators. (2024). Global burden of 288 causes of death and life expectancy decomposition in 204 countries and territories and 811 subnational locations, 1990-2021: a systematic analysis for the Global Burden of Disease Study 2021. Lancet 403, 2100–2132. doi: 10.1016/S0140-6736(24)00367-2
GBD 2021 Diseases and Injuries Collaborators. (2024). Global incidence, prevalence, years lived with disability (YLDs), disability-adjusted life-years (DALYs), and healthy life expectancy (HALE) for 371 diseases and injuries in 204 countries and territories and 811 subnational locations, 1990-2021: a systematic analysis for the Global Burden of Disease Study 2021. Lancet 403, 2133–2161. doi: 10.1016/S0140-6736(24)00757-8
Gehrig, J. L., Venkatesh, S., Chang, H. W., Hibberd, M. C., Kung, V. L., Cheng, J., et al. (2019). Effects of microbiota-directed foods in gnotobiotic animals and undernourished children. Science 365. doi: 10.1126/science.aau4732
GRAM Typhoid Collaborators for 2024. (2024). Estimating the subnational prevalence of antimicrobial resistant Salmonella enterica serovars Typhi and Paratyphi A infections in 75 endemic countries, 1990-2019: a modelling study. Lancet Glob Health 12, e406–e418. doi: 10.1016/S2214-109X(23)00585-5
Hajra, D., Nair, A. V., Chakravortty, D. (2023). Decoding the invasive nature of a tropical pathogen of concern: The invasive non-Typhoidal Salmonella strains causing host-restricted extraintestinal infections worldwide. Microbiol. Res. 277, 127488. doi: 10.1016/j.micres.2023.127488
Hoivik, M. L., Moum, B., Solberg, I. C., Cvancarova, M., Hoie, O., Vatn, M. H., et al. (2012). Health-related quality of life in patients with ulcerative colitis after a 10-year disease course: results from the IBSEN study. Inflammation Bowel Dis. 18, 1540–1549. doi: 10.1002/ibd.21863
Jin, S., Lu, X., Xu, C. (2022). COVID-19 induces gastrointestinal symptoms and affects patients’ prognosis. J. Int. Med. Res. 50, 3000605221129543. doi: 10.1177/03000605221129543
Kayembe, J. M., Thevenon, F., Laffite, A., Sivalingam, P., Ngelinkoto, P., Mulaji, C. K., et al. (2018). High levels of faecal contamination in drinking groundwater and recreational water due to poor sanitation, in the sub-rural neighbourhoods of Kinshasa, Democratic Republic of the Congo. Int. J. Hyg Environ. Health 221, 400–408. doi: 10.1016/j.ijheh.2018.01.003
Kobayashi, M., Adachi, N., Miyazaki, M., Tatsumi, M. (2018). Decline of rotavirus-coded hospitalizations in children under 5 years: A report from Japan where rotavirus vaccines are self-financed. Vaccine 36, 2727–2732. doi: 10.1016/j.vaccine.2017.10.033
Kuenzli, E., Juergensen, D., Kling, K., Jaeger, V. K., DeCrom, S., Steffen, R., et al. (2017). Previous exposure in a high-risk area for travellers’ diarrhoea within the past year is associated with a significant protective effect for travellers’ diarrhoea: a prospective observational cohort study in travellers to South Asia. J. Travel Med. 24. doi: 10.1093/jtm/tax056
Laffite, A., Kilunga, P. I., Kayembe, J. M., Devarajan, N., Mulaji, C. K., Giuliani, G., et al. (2016). Hospital effluents are one of several sources of metal, antibiotic resistance genes, and bacterial markers disseminated in sub-saharan urban rivers. Front. Microbiol. 7. doi: 10.3389/fmicb.2016.01128
Lal, A., Hales, S., French, N., Baker, M. G. (2012). Seasonality in human zoonotic enteric diseases: A systematic review. PloS One 7, e31883. doi: 10.1371/journal.pone.0031883
Leung, W. K., To, K. F., Chan, P. K., Chan, H. L., Wu, A. K., Lee, N., et al. (2003). Enteric involvement of severe acute respiratory syndrome-associated coronavirus infection. Gastroenterology 125, 1011–1017. doi: 10.1016/j.gastro.2003.08.001
Li, T., Ding, N., Guo, H., Hua, R., Lin, Z., Tian, H., et al. (2024). A gut microbiota-bile acid axis promotes intestinal homeostasis upon aspirin-mediated damage. Cell Host Microbe 32, 191–208.e199. doi: 10.1016/j.chom.2023.12.015
Li, H., Qi, Y., Jasper, H. (2016). Preventing age-related decline of gut compartmentalization limits microbiota dysbiosis and extends lifespan. Cell Host Microbe 19, 240–253. doi: 10.1016/j.chom.2016.01.008
Love, N. K., Jenkins, C., McCarthy, N., Baker, K. S., Manley, P., Wilson, D. (2024). International travel as a risk factor for gastrointestinal infections in residents of North East England. Epidemiol. Infect. 152, e97. doi: 10.1017/S0950268824000827
Marchello, C. S., Birkhold, M., Crump, J. A., Martin, L. B., Ansah, M. O., Breghi, G., et al. (2022). Complications and mortality of non-typhoidal salmonella invasive disease: a global systematic review and meta-analysis. Lancet Infect. Dis. 22, 692–705. doi: 10.1016/S1473-3099(21)00615-0
Muhsen, K., Rubenstein, U., Kassem, E., Goren, S., Schachter, Y., Kremer, A., et al. (2015). A significant and consistent reduction in rotavirus gastroenteritis hospitalization of children under 5 years of age, following the introduction of universal rotavirus immunization in Israel. Hum. Vaccin Immunother. 11, 2475–2482. doi: 10.1080/21645515.2015.1056951
Mundula, T., Baldi, S., Gerace, E., Amedei, A. (2023). Role of the intestinal microbiota in the genesis of major depression and the response to antidepressant drug therapy: A narrative review. Biomedicines 11. doi: 10.3390/biomedicines11020550
Mundula, T., Russo, E., Curini, L., Giudici, F., Piccioni, A., Franceschi, F., et al. (2022). Chronic systemic low-grade inflammation and modern lifestyle: the dark role of gut microbiota on related diseases with a focus on COVID-19 pandemic. Curr. Med. Chem. 29, 5370–5396. doi: 10.2174/0929867329666220430131018
Pang, S., Chen, X., Lu, Z., Meng, L., Huang, Y., Yu, X., et al. (2023). Longevity of centenarians is reflected by the gut microbiome with youth-associated signatures. Nat. Aging 3, 436–449. doi: 10.1038/s43587-023-00389-y
Rahman, M., Wojtyniak, B., Rahaman, M. M., Aziz, K. M. S. (1985). Impact of environmental sanitation and crowding on infant mortality in rural Bangladesh. Lancet 2, 28–30. doi: 10.1016/S0140-6736(85)90068-6
Randeni, N., Bordiga, M., Xu, B. (2024). A comprehensive review of the triangular relationship among diet-gut microbiota-inflammation. Int. J. Mol. Sci. 25. doi: 10.3390/ijms25179366
Roswall, J., Olsson, L. M., Kovatcheva-Datchary, P., Nilsson, S., Tremaroli, V., Simon, M. C., et al. (2021). Developmental trajectory of the healthy human gut microbiota during the first 5 years of life. Cell Host Microbe 29, 765–776.e763. doi: 10.1016/j.chom.2021.02.021
Singh, P., Manning, S. D. (2016). Impact of age and sex on the composition and abundance of the intestinal microbiota in individuals with and without enteric infections. Ann. Epidemiol. 26, 380–385. doi: 10.1016/j.annepidem.2016.03.007
Soares-Weiser, K., Bergman, H., Henschke, N., Pitan, F., Cunliffe, N. (2019). Vaccines for preventing rotavirus diarrhoea: vaccines in use. Cochrane Database Syst. Rev. 2019. doi: 10.1002/14651858.CD008521.pub5
Sun, P., Yu, C., Yin, L., Chen, Y., Sun, Z., Zhang, T., et al. (2024). Global, regional, and national burden of female cancers in women of child-bearing age, 1990-2021: analysis of data from the global burden of disease study 2021. EClinicalMedicine 74, 102713. doi: 10.1016/j.eclinm.2024.102713
Taylor, M. E., Oppenheim, B. A. (1998). Hospital-acquired infection in elderly patients. J. Hosp Infect. 38, 245–260. doi: 10.1016/S0195-6701(98)90074-3
Torgerson, P. R., Devleesschauwer, B., Praet, N., Speybroeck, N., Willingham, A. L., Kasuga, F., et al. (2015). World Health Organization Estimates of the Global and Regional Disease Burden of 11 Foodborne Parasitic Diseases, 2010: A Data Synthesis. PloS Med. 12, e1001920. doi: 10.1371/journal.pmed.1001920
Tuo, Y., Li, Y., Li, Y., Ma, J., Yang, X., Wu, S., et al. (2024). Global, regional, and national burden of thalassemia, 1990-2021: a systematic analysis for the global burden of disease study 2021. EClinicalMedicine 72, 102619. doi: 10.1016/j.eclinm.2024.102619
Verlicchi, P., Galletti, A., Petrovic, M., Barceló, D. (2010). Hospital effluents as a source of emerging pollutants: An overview of micropollutants and sustainable treatment options. J. Hydrology 389, 416–428. doi: 10.1016/j.jhydrol.2010.06.005
Walker, J., Chaguza, C., Grubaugh, N. D., Carey, M., Baker, S., Khan, K., et al. (2023). Assessing the global risk of typhoid outbreaks caused by extensively drug resistant Salmonella Typhi. Nat. Commun. 14, 6502. doi: 10.1038/s41467-023-42353-9
Wiedermann, U., Kollaritsch, H. (2006). Vaccines against traveler’s diarrhoea and rotavirus disease - a review. Wien Klin Wochenschr 118, 2–8. doi: 10.1007/s00508-006-0671-5
World Health Organization. (2021). “World health statistics 2021,” in The top 10 causes of death. (World Health Organization).
Yang, K., Yang, X., Jin, C., Ding, S., Liu, T., Ma, B., et al. (2024). Global burden of type 1 diabetes in adults aged 65 years and older, 1990-2019: population based study. Bmj 385, e078432. doi: 10.1136/bmj-2023-078432
Yoseph, A., Beyene, H. (2020). The high prevalence of intestinal parasitic infections is associated with stunting among children aged 6-59 months in Boricha Woreda, Southern Ethiopia: a cross-sectional study. BMC Public Health 20, 1270. doi: 10.1186/s12889-020-09377-y
Zakir, M., Khan, M., Umar, M. I., Murtaza, G., Ashraf, M., Shamim, S. (2021). Emerging trends of multidrug-resistant (MDR) and extensively drug-resistant (XDR) salmonella typhi in a tertiary care hospital of Lahore, Pakistan. Microorganisms 9. doi: 10.3390/microorganisms9122484
Zhou, J. L., Bao, J. C., Liao, X. Y., Chen, Y. J., Wang, L. W., Fan, Y. Y., et al. (2023). Trends and projections of inflammatory bowel disease at the global, regional and national levels, 1990-2050: a bayesian age-period-cohort modeling study. BMC Public Health 23, 2507. doi: 10.1186/s12889-023-17431-8
Keywords: enteric infections, global burden of disease, epidemiology, trend analysis, risk factors, etiological analysis
Citation: Zhang Y, Zhang Y, Chen Z, Jia Z, Yu Y, Wang J and Liang H (2025) Global burden, subtype, risk factors and etiological analysis of enteric infections from 1990-2021: population based study. Front. Cell. Infect. Microbiol. 15:1527765. doi: 10.3389/fcimb.2025.1527765
Received: 13 November 2024; Accepted: 26 February 2025;
Published: 20 March 2025.
Edited by:
José Luis Muñoz-Carrillo, University of Guadalajara, MexicoReviewed by:
Abubakar Nazir, King Edward Medical University, PakistanTirupataiah Sirupangi, Baylor College of Medicine, United States
Copyright © 2025 Zhang, Zhang, Chen, Jia, Yu, Wang and Liang. This is an open-access article distributed under the terms of the Creative Commons Attribution License (CC BY). The use, distribution or reproduction in other forums is permitted, provided the original author(s) and the copyright owner(s) are credited and that the original publication in this journal is cited, in accordance with accepted academic practice. No use, distribution or reproduction is permitted which does not comply with these terms.
*Correspondence: Hui Liang, bGlhbmdodWk4Njg5QHNtdS5lZHUuY24=; Jieyan Wang, OTkzMzY4OTc0QHFxLmNvbQ==
†Theses authors have contributed equally to this work