 Iryna V. Goraichuk
 David L. Suarez
- Southeast Poultry Research Laboratory, U.S. National Poultry Research Center, Agriculture Research Service, U.S Department of Agriculture, Athens, GA, United States
Highly pathogenic avian influenza is endemic and widespread in wild birds and is causing major outbreaks in poultry worldwide and in U.S. dairy cows, with several recent human cases, highlighting the need for reliable and rapid sequencing to track mutations that may facilitate viral replication in different hosts. SNP analysis is a useful molecular epidemiology tool to track outbreaks, but it requires accurate whole-genome sequencing (WGS) with sufficient read depth across all eight segments. In outbreak situations, where timely data is critical for controlling the spread of the virus, reducing sequencing preparation time while maintaining high-quality standards is particularly important. In this study, we optimized a custom barcoded primer strategy for influenza A whole-genome sequencing on the nanopore sequencing platform, combining the high performance of the Native Barcoding Kit with the prompt preparation time of the Rapid Barcoding Kit. Custom barcoded primers were designed to perform barcode attachment during RT-PCR amplification, eliminating the need for separate barcoding and clean-up steps, thus reducing library preparation time. We compared the performance of the custom barcoded primer method with the Native and Rapid barcoding kits in terms of read quality, read depth, and sequencing output. The results show that the custom barcoded primers provided performance comparable to the Native Barcoding Kit while reducing library preparation time by 2.3X compared to the Native kit and being only 15 minutes longer than the Rapid kit with better depth of sequencing. Additionally, the custom barcoded primer method was evaluated on a variety of clinical sample types. This approach offers a promising solution for influenza A sequencing, providing both high throughput and time efficiency, which significantly improves the time-to-result turnaround, making sequencing more accessible for real-time surveillance.
1 Introduction
Influenza A virus, a segmented RNA virus in the Orthomyxyoviridae family and Alphainfluenzavirus genus, is a highly variable and widespread pathogen responsible for seasonal flu outbreaks in humans, as well as significant diseases in animals (Suarez, 2017; Swayne et al., 2020; WHO, 2023). It can infect a wide range of hosts, including birds, mammals, and humans, and is known for its rapid genetic changes, which can lead to alterations in transmissibility, virulence, and host range. These genetic changes are primarily driven by antigenic drift, which involves the accumulation of point mutations, and antigenic shift, which occurs through reassortment of gene segments during co-infection with different influenza A viruses. Both processes enable the virus to adapt to different hosts and environmental conditions (García et al., 1997; Manrubia et al., 2005; Reperant et al., 2009; Kandeil et al., 2023; Graziosi et al., 2024). Recently, the H5N1 highly pathogenic avian influenza A virus has become a major concern. In the current 2020-2024 panzootic, H5N1 detection was reported in over 48 mammal species (Plaza et al., 2024), underscoring the growing threat of cross-species transmission. A notable example of this is the ongoing outbreaks of H5N1 avian influenza in U.S. dairy cows, which have affected over 500 dairy herds and resulted in more than 50 human cases (Caserta et al., 2024; CDC, 2024; Spackman et al., 2024; Uyeki et al., 2024; Suarez et al., 2025). This highlights the serious risk of avian influenza adapting to non-avian species, including mammals, which could lead to further public health and economic challenges (Barbachano-Guerrero et al., 2023; Kang et al., 2024; Koopmans et al., 2024). Whole-genome sequencing (WGS) of influenza A viruses is an essential tool for identifying mutations associated with viral evolution, transmission, and pathogenicity (Dinis et al., 2016; Suttie et al., 2019; Sun et al., 2020; Leyson et al., 2023; Youk et al., 2023; de Carvalho Araujo et al., 2024; Guo et al., 2024; Kim et al., 2024; Lee et al., 2024; Powell et al., 2024). However, in outbreak situations, rapid data acquisition is critical to controlling the spread of the virus, necessitating efficient sequencing methods with reduced library preparation time but without sacrificing high-quality standards. Thus, there is an urgent need for reliable and rapid sequencing methods for the surveillance of influenza A viruses, particularly in panzootic situations like H5N1, where timely interventions and control measures are crucial.
Targeted sequencing is particularly advantageous, as it focuses on amplifying specific regions of the genome, ensuring high efficiency and accuracy. Influenza A has conserved termini present at both the 3’- and 5’-ends of each genome segment, which enable the use of universal primers for influenza whole-genome amplification, commonly used for further amplicon sequencing (Wang et al., 2015; Hoffmann et al., 2001; Zhou et al., 2009; Imai et al., 2018; Mitchell et al., 2021; Chauhan and Gordon, 2022; Ip et al., 2023). In our previous work, we optimized an RT-PCR protocol for influenza whole-genome amplification, specifically addressing improvements to enhance subsequent sequencing outcomes (Goraichuk et al., 2024a). This optimization increases the specificity of the sequencing, reduces the amplification of non-target sequences, and ensures uniform coverage of all eight viral segments, which is critical for accurate genomic analysis. The optimized protocol enables influenza whole-genome amplification with high coverage, making the amplification products suitable for sequencing on various sequencing platforms.
Among different sequencing platforms, Oxford Nanopore Technologies (ONT) platforms, such as the MinION, offer significant advantages, particularly in their near real-time data generation and long-read capabilities (Pugh, 2023). Nanopore sequencing works by passing nucleic acids through a nanopore, and the resulting electrical signal is translated into sequence data. This method allows for stopping the sequencing run once sufficient data is acquired, making it especially valuable in outbreak scenarios where quick results are needed. The ability to sequence long reads is particularly useful for improving genome assembly and providing more accurate results for complex genomes (Warburton and Sebra, 2023; Hall et al., 2024). It is also advantageous for sequencing long amplicons without the need for prior fragmentation, which is particularly useful for detecting recombination events. Additionally, the MinION provides portability, enabling sequencing in different environments, from centralized labs to field settings (Faria et al., 2016; Hoenen et al., 2016; Karamendin et al., 2016; McIntyre et al., 2016; Quick et al., 2016; Castro-Wallace et al., 2017; Johnson et al., 2017; Parker et al., 2017; Pomerantz et al., 2018; Gowers et al., 2019; Carr et al., 2020; Urban et al., 2021).
Combining the ability to simultaneously amplify all influenza genome segments in one RT-PCR reaction with the advantages of nanopore sequencing provides a reliable and rapid sequencing approach that has been successfully used for the surveillance of influenza A viruses (King et al., 2022; Miah et al., 2023; Plancarte et al., 2023; Baybay et al., 2024; Lagan et al., 2024; Maqsood et al., 2024; Siegers et al., 2024; Wang et al., 2024). ONT offers the Ligation Sequencing Influenza Whole Genome V14 protocol, which utilizes the Native Barcoding Kit for sample multiplexing by adding unique barcodes to each sample (Oxford_Nanopore_Technologies, 2024a). This enables the pooling of multiple samples into a single sequencing run, increasing efficiency and reducing costs. There are two ONT barcoding kits available – the Native and Rapid Barcoding Kits – which use different chemistries for barcode and adapter attachment (Oxford_Nanopore_Technologies, 2024b). The Native Barcoding Kit employs ligation-based chemistry, optimized for accuracy and high read output. In contrast, the Rapid Barcoding Kit uses transposase-based chemistry for faster barcode attachment and fragmentation, followed by rapid-based adapter attachment for quicker library preparation. However, this results in reduced read lengths and sequencing output. While the Rapid kit’s faster preparation time makes it ideal for situations requiring quick turnaround, the Native kit provides more reliable, higher-quality data, making it particularly advantageous for comprehensive genomic analysis.
To address the need for both speed and high-quality data, this study aims to optimize influenza A whole-genome sequencing on the nanopore sequencing platform by developing a custom barcoded primer strategy. This strategy enables barcode attachment during RT-PCR amplification, eliminating the need for separate barcoding and clean-up steps. As a result, it reduces library preparation time, bringing it closer to the efficiency of the Rapid Barcoding Kit while maintaining the high output and accuracy of the Native Barcoding Kit through ligase-based adapter attachment. We compare the performance of this custom barcoded primer method with the Native and Rapid barcoding kits in terms of read quality, read depth, and overall sequencing output. This optimized method aims to provide a balanced solution for influenza A sequencing, offering both time efficiency and high-quality results, making it suitable for surveillance and outbreak management.
2 Materials and methods
2.1 Samples
Eight avian influenza isolates of varying virulence and subtypes (Table 1) from the Southeast Poultry Research Laboratory (SEPRL) repository were propagated in 9–11-day-old specific-pathogen-free (SPF) embryonated chicken eggs (Senne, 2008). The allantoic fluids harvested from these eggs were used to compare different barcoding strategies for nanopore sequencing in this study. Background information on the egg-grown isolates, including details on their host, country of origin, year of collection, pathogenicity, subtype, and GenBank accession numbers, is summarized in Table 1.
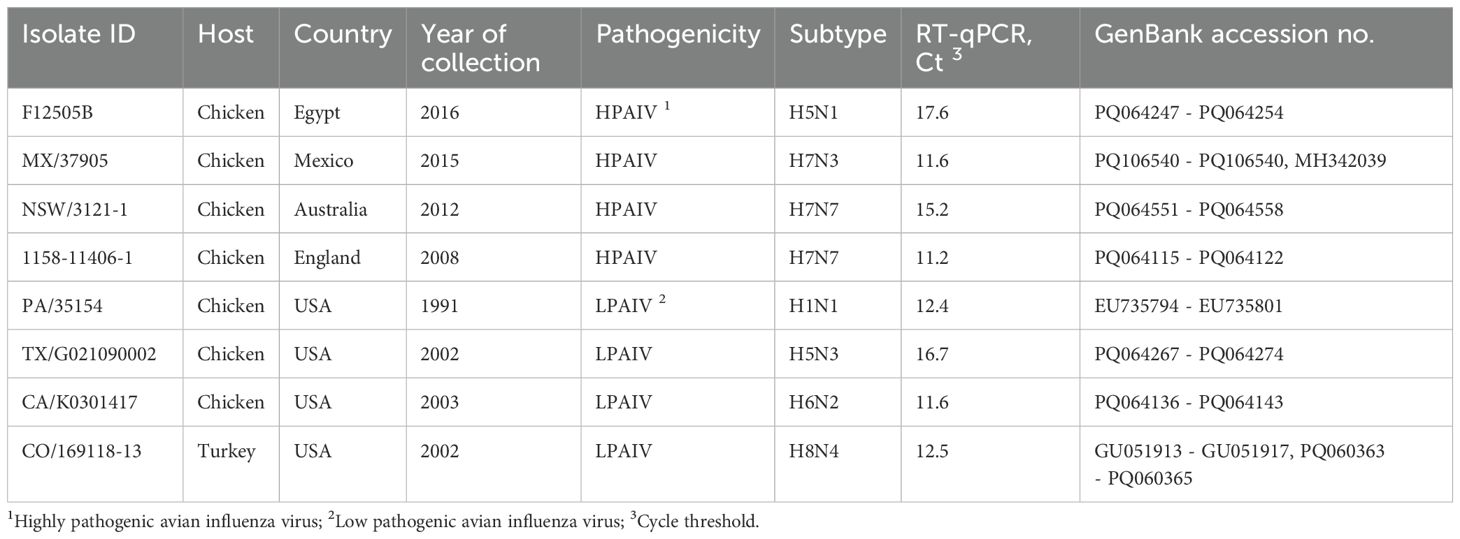
Table 1. Background information on influenza A viruses used for the comparison of barcoding methods in this study.
The developed PCR method utilizing barcoded primers was further tested on various clinical samples, which included bovine mammary gland tissues, cat brain tissues, and chicken brain, muscle, heart, spleen, oropharyngeal (OP), and cloacal (CL) samples (Table 2). The chicken samples were collected from SPF chickens infected with different avian influenza virus isolates. Background information on the clinical samples, including host, sample type, subtype, and GISAID accession numbers (Khare et al., 2021), is summarized in Table 2.
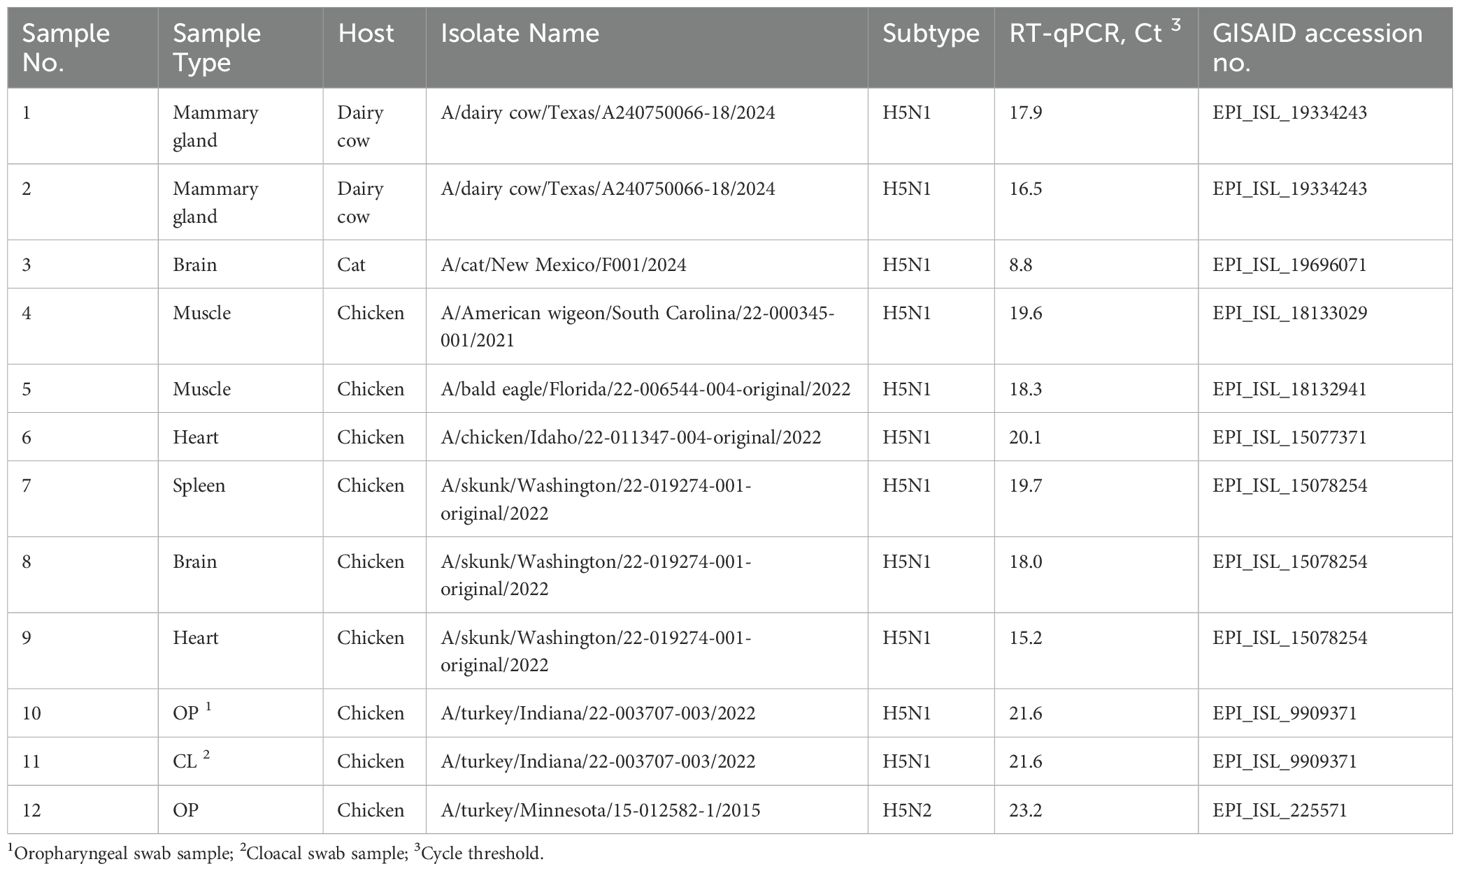
Table 2. Background information on clinical samples used in this study.
2.2 RNA extraction and RT-qPCR
Total RNA was extracted from infectious allantoic fluids and clinical samples using the MagMAX™-96 AI/ND Viral RNA Isolation Kit (Applied Biosystems, USA) following the manufacturer’s instructions. RNA quality and concentrations were assessed using the EzDrop 1000C spectrophotometer (Blue-Ray Biotech, Taiwan). The presence of influenza RNA was confirmed using the avian influenza matrix gene RT-qPCR assay, as previously described (Spackman et al., 2002; Goraichuk et al., 2024). Extracted viral RNA were then used for the comparison of different ONT barcoding strategies.
2.3 Nanopore library preparation and sequencing
To compare the Native, Rapid, and PCR barcoding strategies, three nanopore sequencing libraries were prepared using the Native Barcoding Kit 24 V14 (SQK-NBD114.24), Rapid Barcoding Kit 24 V14 (SQK-RBK114.24), and Ligation Sequencing Kit V14 (SQK-LSK114), respectively. The resulting datasets were designated as Native, Rapid, and PCR libraries, corresponding to the respective barcoding processes used in each library preparation strategy. For both the Native and Rapid barcoding methods, amplicons were generated using multisegment RT-PCR amplification to simultaneously amplify all influenza A genome segments from 8 isolates. This was done following our previously described method using Opti primers in conjunction with the LunaScript® Multiplex One-Step RT-PCR Kit, New England Biolabs, USA) (Goraichuk et al., 2024a; Goraichuk et al., 2024b).
It is important to note that Rapid chemistry is known to be unable to capture the entire amplification product due to transposase activity during barcode attachment, which results in 15-20 nt being truncated at both termini. Therefore, the ONT protocol recommends designing primers that include an extra 15-20 bp at the start and end of the actual target sequence. The Opti primers used in this study follow this guidance and, in addition to the conserved influenza termini, include a 24-nucleotide overhanging tail to ensure complete target coverage.
To reduce preparation time while maintaining the high output and accuracy of ligation-based chemistry, we designed custom barcoded primers to incorporate barcoding during RT-PCR amplification with subsequent ligation of the sequencing adapters. These barcoded primers were designed similarly to Opti primers used in the Native and Rapid runs, consisting of two parts: the conserved influenza termini sequences and an overhanging tail. The key difference between the Opti and barcoded primers is that, in the barcoded primers, the overhanging tail corresponds to ONT’s barcode sequence. Thereby, each barcoded primer included the corresponding barcode sequence from the PCR Barcoding Expansion (EXP-PBC096, Oxford Nanopore Technologies, England) at the 5’-end, followed by the influenza Uni 12 and Uni 13 conserved termini at the 3’-end (Supplementary Table 1). Custom barcoded primer sets were purchased from Integrated DNA Technologies (Coralville, USA). For the PCR barcoding method, amplicons were generated using the LunaScript® Multiplex One-Step RT-PCR Kit, New England Biolabs, USA) with the same cycling conditions as those used for the Native and Rapid barcoding methods (Goraichuk et al., 2024a). Briefly, 50-µL reaction volumes comprised of 5 µL of total RNA, 10 µL of LunaScript Multiplex One-Step RT-PCR Reaction Mix (5X), 2.5 µL of 20 µM working primer mix solution, 2 µL of LunaScript Multiplex One-Step RT-PCR Enzyme Mix (25X), and 30.5 µl of sterile nuclease-free water. Working primer solution per each barcode was prepared by combining 100 µM stock solutions of F1, F2, and R primers from barcoded primer set in 0.35:0.65:1 ratio. RT-PCR amplification process included an initial RT step (90 min at 55°C), RT inactivation/initial denaturation (1 min at 98°C), and PCR steps of 5 cycles (10 s at 98°C, 30 s at 44°C, and 3 min 30 s at 72°C) and 30 cycles (10 s at 98°C, 30 s at 69°C, and 3 min 30 s at 72°C), followed by final extension (10 min at 72°C). Detailed protocol have been deposited at protocols.io: dx.doi.org/10.17504/protocols.io.5qpvo93e7v4o/v1 (Goraichuk and Suarez, 2024).
All amplicons were purified using the Select-a-Size DNA Clean & Concentrator (Zymo Research, USA), which has previously been shown to reduce purification time and increase efficiency in removing short reads, resulting in more uniform coverage across the polymerase segments (Goraichuk et al., 2024b). After purification, 200 fmol of amplicons were barcoded and adapters were attached using ligation-based chemistry for Native barcoding (Oxford_Nanopore_Technologies, 2024c) and rapid-based chemistry for Rapid Barcoding Kit (Oxford_Nanopore_Technologies, 2024d), in accordance with the manufacturer’s recommendations. For PCR barcoding, 200 fmol total (25 fmol per sample) of barcoded amplicons were used for further adapter ligation using Ligation Sequencing Kit V14 (Oxford_Nanopore_Technologie, 2024). Molarity was calculated based on an assumed average size of 2,000 bp for multi-segment RT-PCR fragments. The Native library preparation requires additional third-party consumables, including Blunt/TA Repair Mix, Ultra II End repair/dA-tailing Module, and Quick Ligation Module. The Rapid library preparation, in contrast, does not require any of these consumables. The PCR method, using custom barcoded primers, eliminates the need for Blunt/TA Ligase Master Mix but still requires the Ultra II End repair/dA-tailing Module and Quick Ligation Module. This difference in required consumables is the primary driver of the cost difference between the Native and Rapid methods.
The final libraries for each of the Native, Rapid, and PCR barcoding strategies were quantified using the High Sensitivity D5000 Screen Tape on a 4150 TapeStation (Agilent Technologies, USA) and Qubit 1X dsDNA High Sensitivity Kit on a Qubit 4 fluorometer (Invitrogen, USA). We then prepared 15 fmol of Native and PCR libraries in 5 µl, and 5.5 µl of the Rapid final prepared library, which were loaded onto separate R10.4.1 Flongle flow cells (FLO-FLG114, Oxford Nanopore Technologies, England) for sequencing using the Mk1C sequencer with MinKNOW 23.04.8 software. Each sequencing run lasted for 6 hours. Additionally, the PCR method was tested on clinical samples by sequencing 50 fmol for 6 hours on a MinION flow cell (FLO-MIN114, Oxford Nanopore Technologies, England) using the Mk1C with MinKNOW 24.11.8 software.
2.4 Bioinformatics analysis
The nanopore raw Pod5 files from all runs were basecalled using the MinKNOW 23.07.12 (bionic) software on a MinION Mk1C instrument with a high-accuracy algorithm to generate FastQ files. Basecalled reads with a minimum Q-score of 9 and a minimum length of 200 bp were classified as “PASS”. The Native and Rapid runs were then demultiplexed and trimmed using Dorado basecaller server 7.3.11 within the MinKNOW, while basecalled “PASS” reads from the PCR barcoding run were demultiplexed using Dorado 0.7.3 with settings for the custom barcoded primers (Supplementary Table 1). Nextflow workflow for demultiplexing libraries prepared with the custom barcoded primers can be found at https://github.com/Goraichuk/Dorado_FluA_Custom_Demultiplexing. All demultiplexed reads were further analyzed on the Galaxy platform (The Galaxy Community, 2024). Run statistics were generated using NanoPlot (De Coster et al., 2018) and NanoporeQC (Lanfear et al., 2019). Influenza genomes were assembled by aligning filtered reads to concatenated reference segments of influenza viruses previously sequenced using Illumina technology, with alignment performed using minimap2 (Li, 2018) and verified in Geneious Prime 2023.0.1. To mitigate potential bias from transposase-mediated truncation of termini during rapid-based barcode attachment, sequencing runs were re-analyzed using shorter reference sequences containing only coding regions for reference mapping assembly. Final consensus sequences were generated using the bam2consensus tool (Volkening, 2023) and assembly polishing tool Medaka. The coverage of the influenza virus genome was determined using SAMtools depth (Andrés et al., 2023).
2.5 Statistical analysis
GraphPad Prism 10.2.3 (Sović et al., 2016) was used for data visualization and statistical analysis. A one-way ANOVA followed by Tukey’s multiple comparisons test was employed to compare the relative differences in the average number of mapped reads, mean read depth, and minimum read depth coverage per sample among Native, Rapid, and PCR runs, with eight influenza A viruses sequenced in each run. The p-value ≤ 0.05 was considered statistically significant.
3 Results
3.1 Barcoding efficiency
In our efforts to optimize library preparation for high output, high accuracy, and a quick preparation time for the influenza A whole-genome nanopore sequencing, we designed and tested barcoded primers to perform barcoding during RT-PCR amplification (Goraichuk and Suarez, 2024), followed by ligase-based adapter attachment. After testing various combinations (data not shown), we determined that the presence of the barcode sequence at both the forward and reverse primers increased demultiplexing rate compared to barcoded only forward or reverse primer. Determined optimal custom barcode arrangements and corresponding Dorado demultiplexing settings are provided in Supplementary Table 1. This approach aims to maintain the higher output and accuracy of the ligase-based Native Barcoding Kit while reducing preparation time to align more closely with the throughput of the rapid-based Rapid Barcoding Kit. To verify this, the performance of the PCR barcoding method was compared to both the Native and Rapid barcoding kits.
The Native and PCR runs, both utilizing ligation-based chemistry of adapter attachment, yielded a significantly higher number of raw reads – 231,480 and 226,079, respectively (Table 3), while the Rapid run, as expected, produced fewer reads – 183,860, resulting in a 1.2X reduction compared to the ligase-based methods. Over 80% of raw reads were successfully basecalled in all three runs, with the highest percentage (84.4%) of basecalled reads produced by the PCR method. As expected, the Rapid run generated shorter reads due to the rapid-based chemistry, which uses the transposase method for barcode attachment, leading to fragmentation of amplicons.

Table 3. Summary statistics of nanopore sequencing runs of NGS libraries prepared with Native, Rapid, and PCR barcoding strategies.
The PCR run provided the highest mean read length of 1248.1 bp, closely followed by the Native run with a mean length of 1207.7 bp, while the Rapid run, as expected, produced shorter reads with a mean length of 730.6 bp (Figure 1A) due to the rapid-based chemistry, which uses the transposase method for barcode attachment, leading to fragmentation of amplicons (Figure 1A). The majority of reads in the Native and PCR runs were distributed in accordance with the length of the eight influenza genome segments, while reads in the Rapid run were fragmented into different sizes. In all three runs, the majority of reads exceeded the minimum accepted Q9 quality threshold, with the mean quality scores of demultiplexed reads ranging between 12.5 and 13.1, the highest being achieved in the Native run and the lowest in the PCR run (Figure 1B).
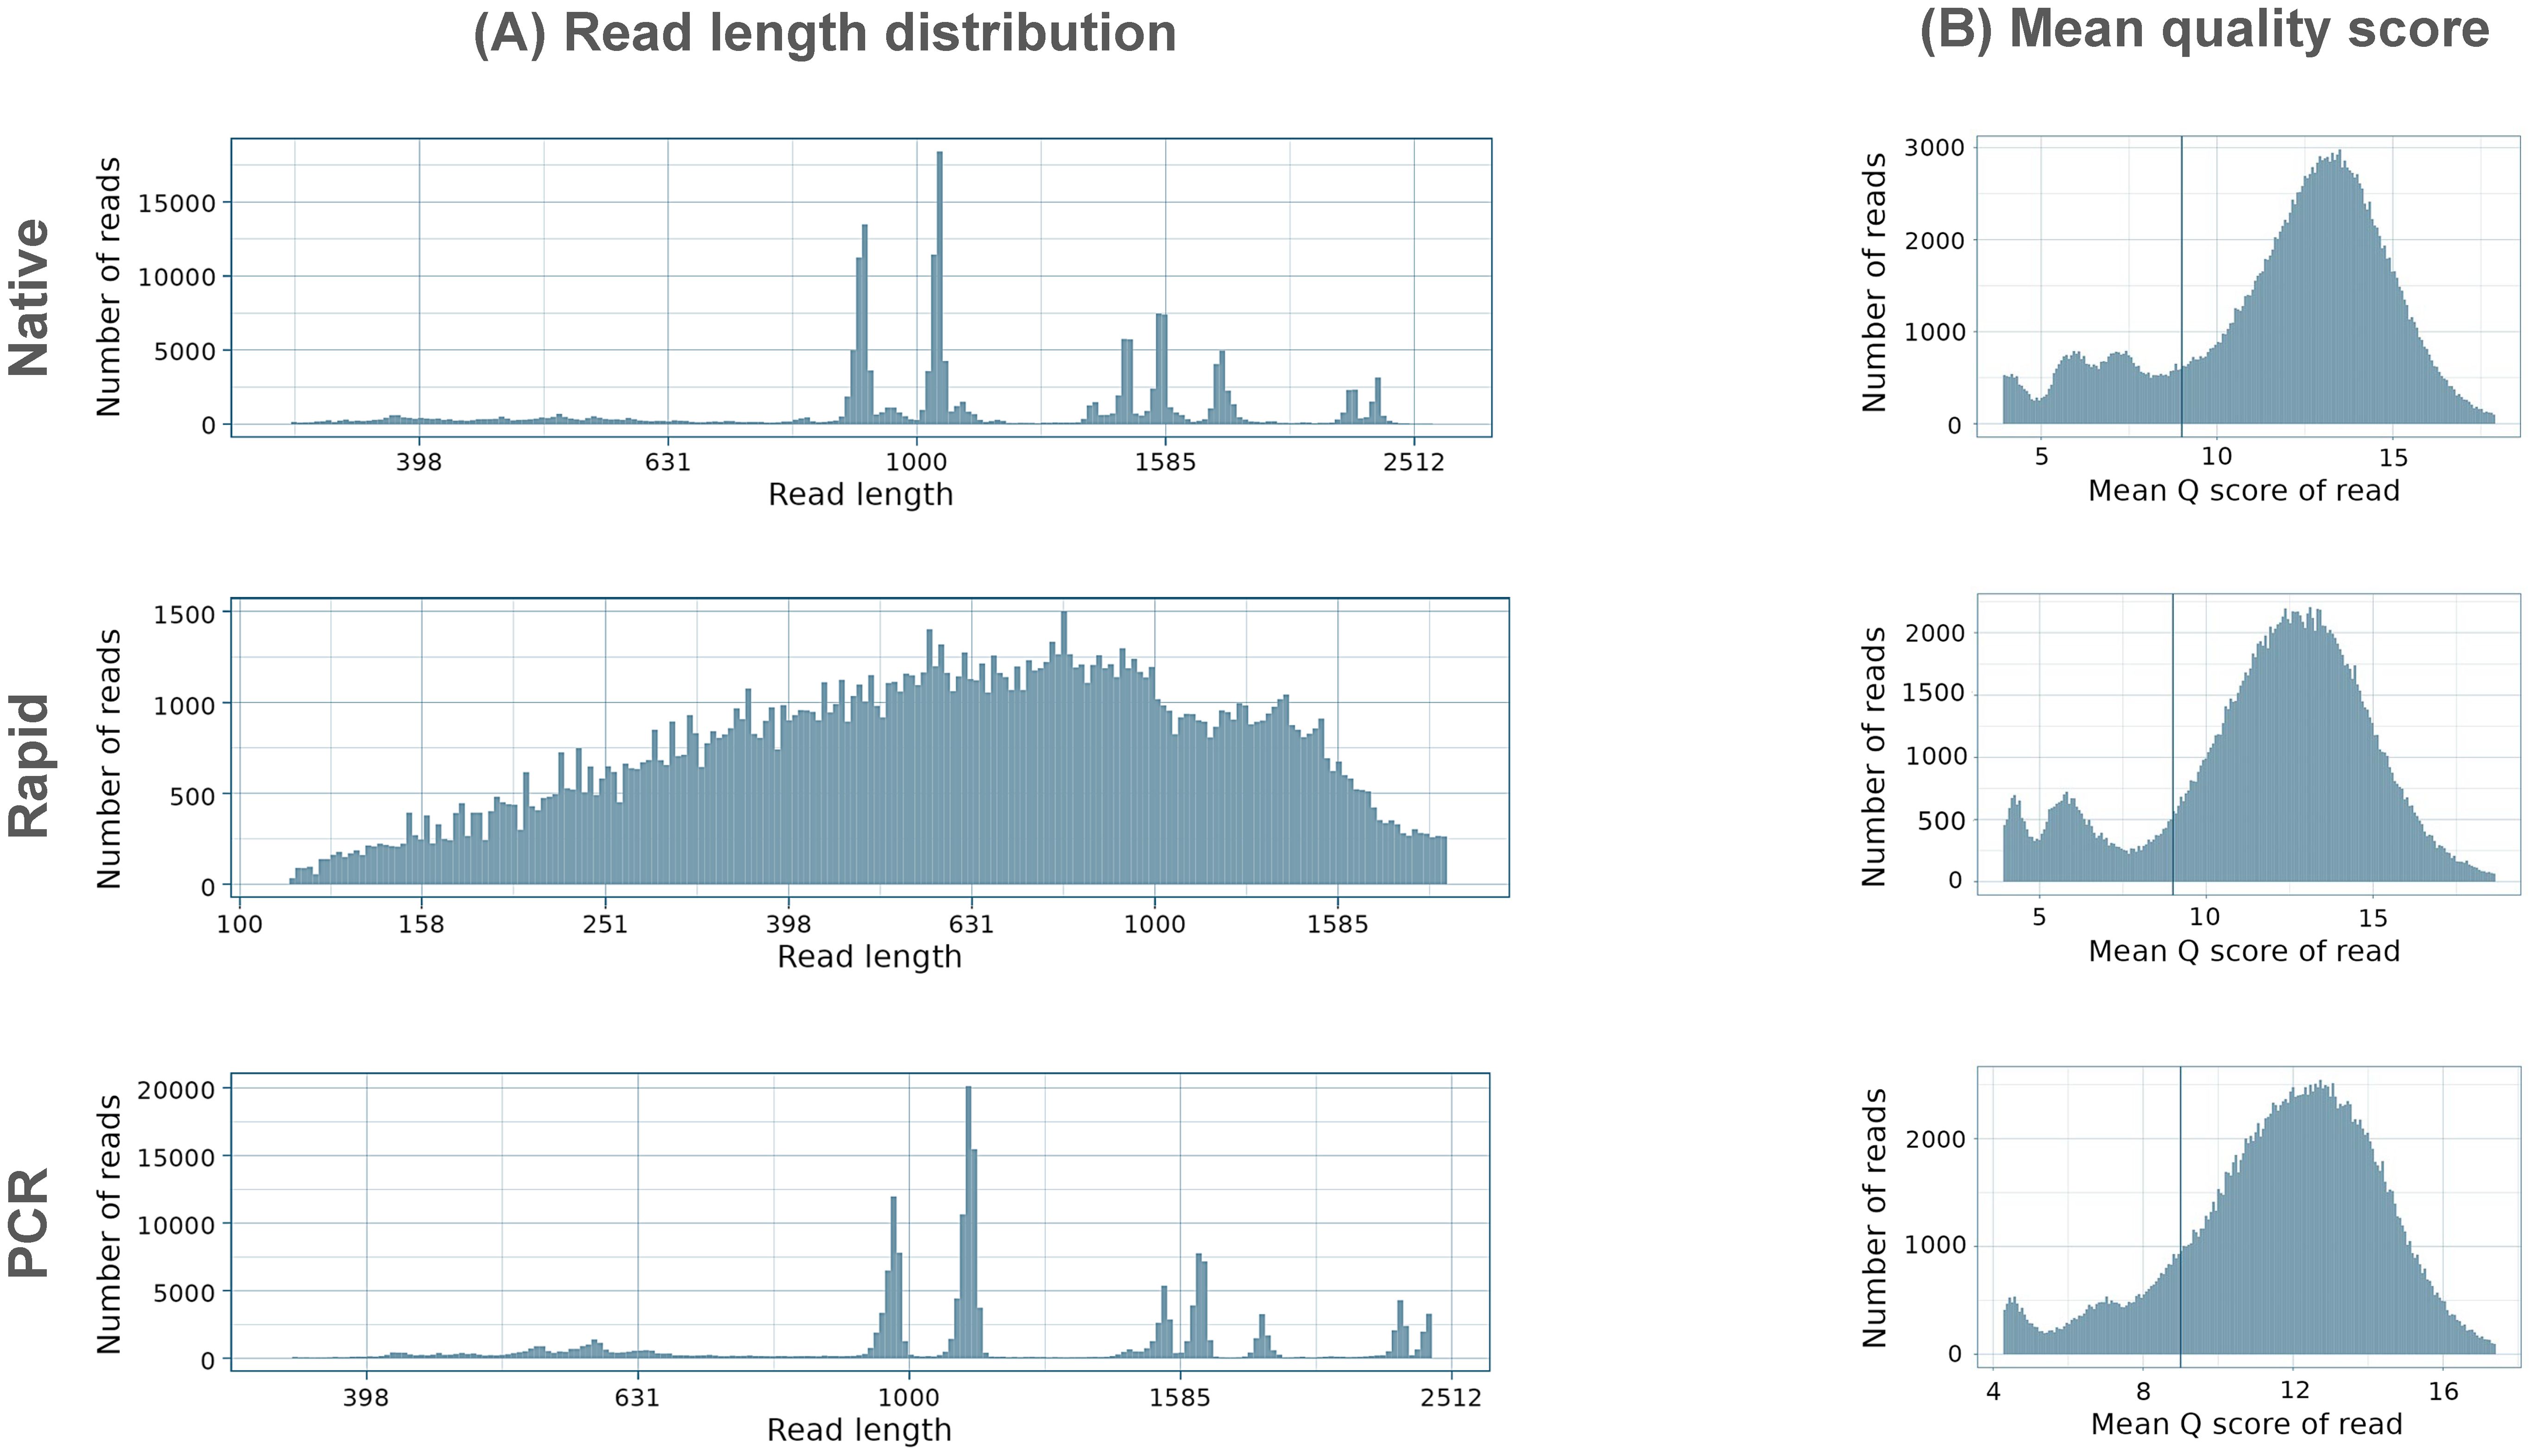
Figure 1. Summary of (A) read length distribution and (B) mean quality distributions in Native, Rapid, and PCR sequencing runs. The y-axes are scaled differently for each run to ensure a clear visualization of the distribution characteristics of each dataset.
The quality distribution of all sequenced reads was similar in both the Native and PCR runs, with patterns closely matching the length distribution of eight influenza genome segments, (Figure 2). In these runs, the majority of reads exhibited consistent quality across varying read lengths, following the typical distribution of influenza genome segments. In contrast, the Rapid run generated a large number of reads with a notable presence of shorter reads with varying quality.
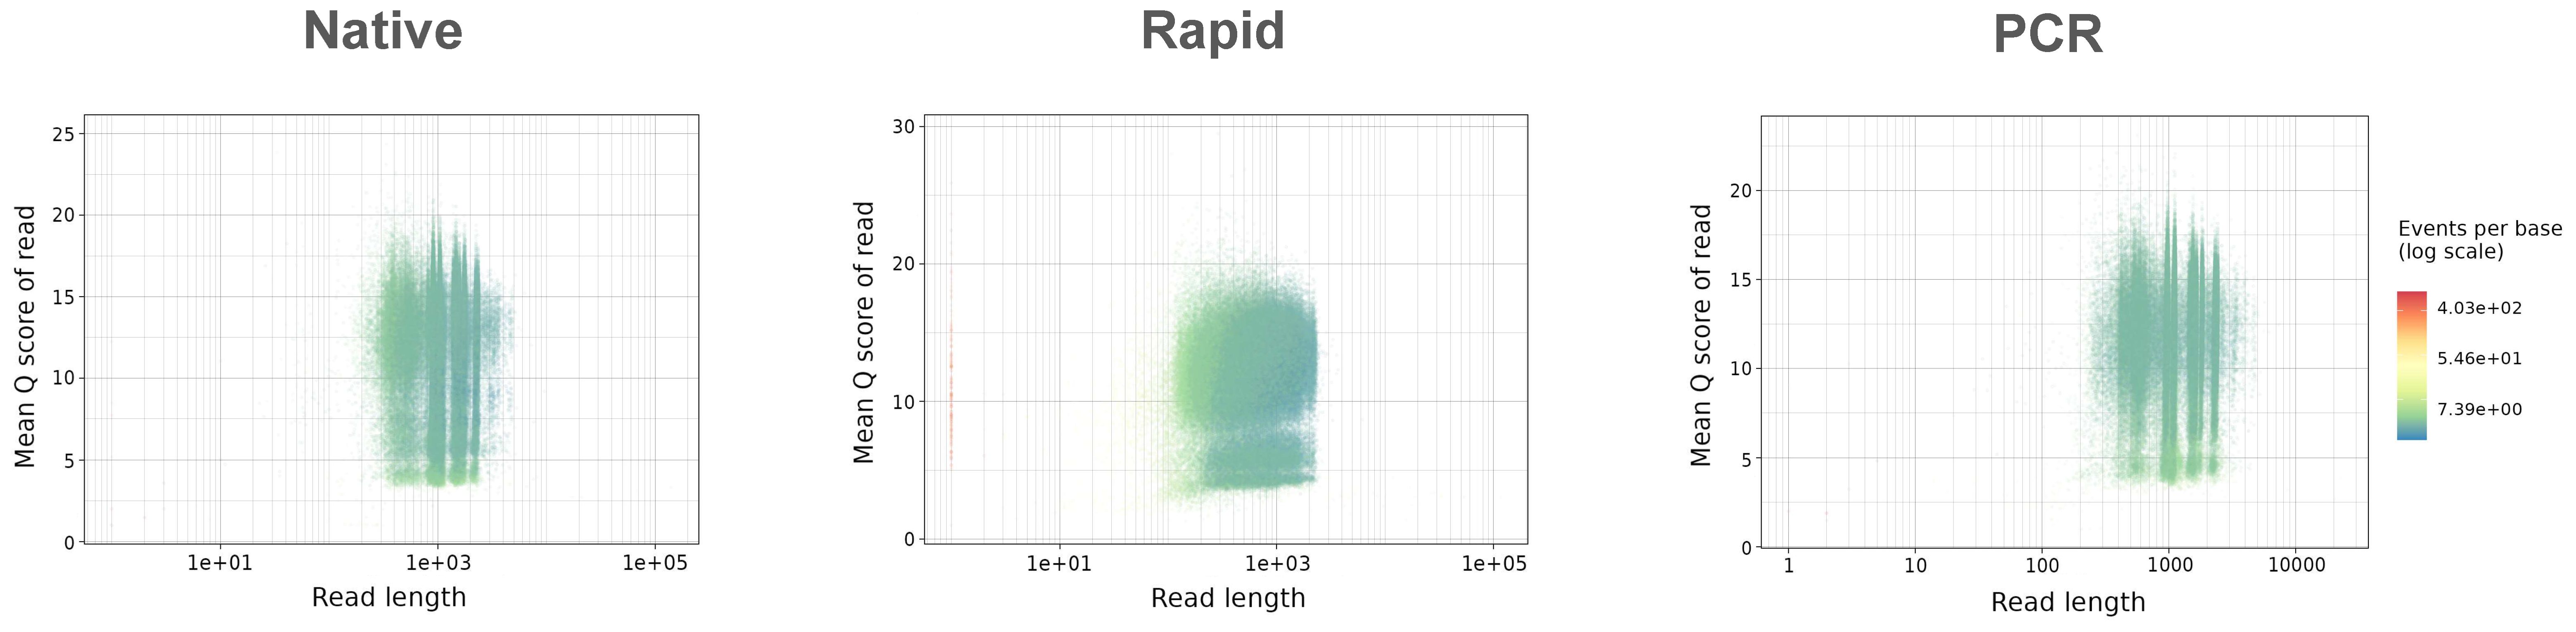
Figure 2. Summary of read length vs quality distribution in Native, Rapid, and PCR sequencing runs.
The Native run with the ligase-based barcoding method resulted in the highest percentage (97.2%) of demultiplexed reads out of basecalled, followed by the PCR method with barcoded primers (92.0%). The Rapid run, utilizing rapid-based barcode attachment chemistry, showed the lowest rate of demultiplexing (87.3%), indicating less efficient barcode attachment compared to the other two methods (Table 3). This inefficiency in demultiplexing affected the percentage of unclassified reads, with the Rapid run exhibiting the highest unclassified read rate at 12.6%. Additionally, both ligase- and rapid-based barcode attachments led to incorrect barcode assignment. Specifically, 2 incorrect barcodes were assigned in the Native run, and 9 incorrect barcodes were assigned in the Rapid run. However, the number of incorrectly barcoded reads was very low in both cases. The Dorado settings for custom demultiplexing of barcoded primers in the PCR run were optimized to minimize incorrect barcode assignment, resulting in no incorrect barcodes being assigned. The optimized setting can be found in Supplementary Table 1.
3.2 Ligase-based chemistry outperformed rapid-based chemistry
After reference mapping assembly of influenza complete genomes, we identified that the PCR run yielded the highest percentage (99.97%) of influenza reads out of all demultiplexed reads, while the Native and Rapid run provided 98.8% and 98.7%, respectively (Table 4). Although the difference in number of average reads mapped across the influenza genome was not statistically significant between all three runs (Figure 3A), the average mean and minimum depth of mapped reads produced in the Rapid run were significantly lower compared to both ligase-based Native and PCR runs (Figures 3B, C). This indicates that even though the expected reduction in total influenza read numbers was not significant between all runs, the ligase-based chemistry outperformed the rapid-based chemistry in providing better read depth, which, in turn, resulted in higher genome coverage. Both of these factors are essential for reliable SNP analysis.
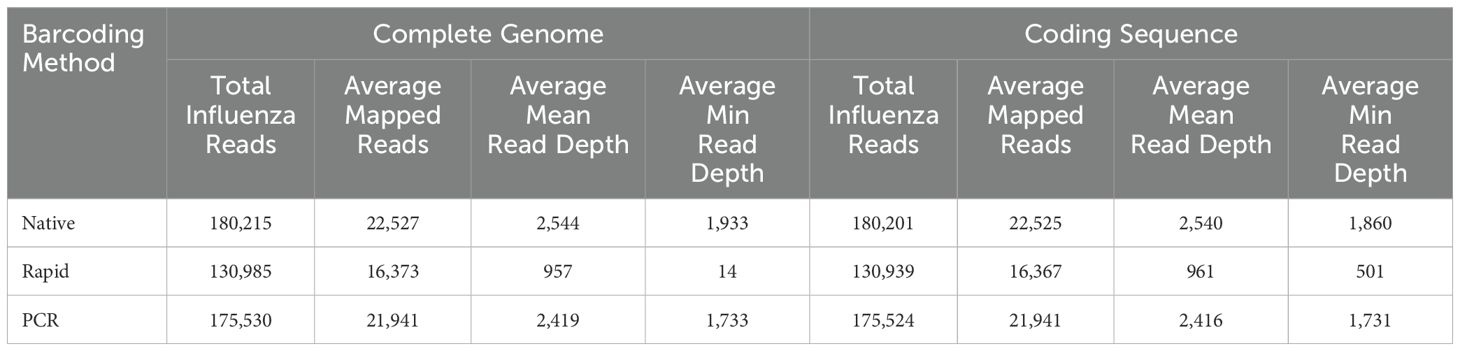
Table 4. Summary statistics of influenza A genome assembly using Native, Rapid, and PCR barcoding strategies for NGS library preparation.
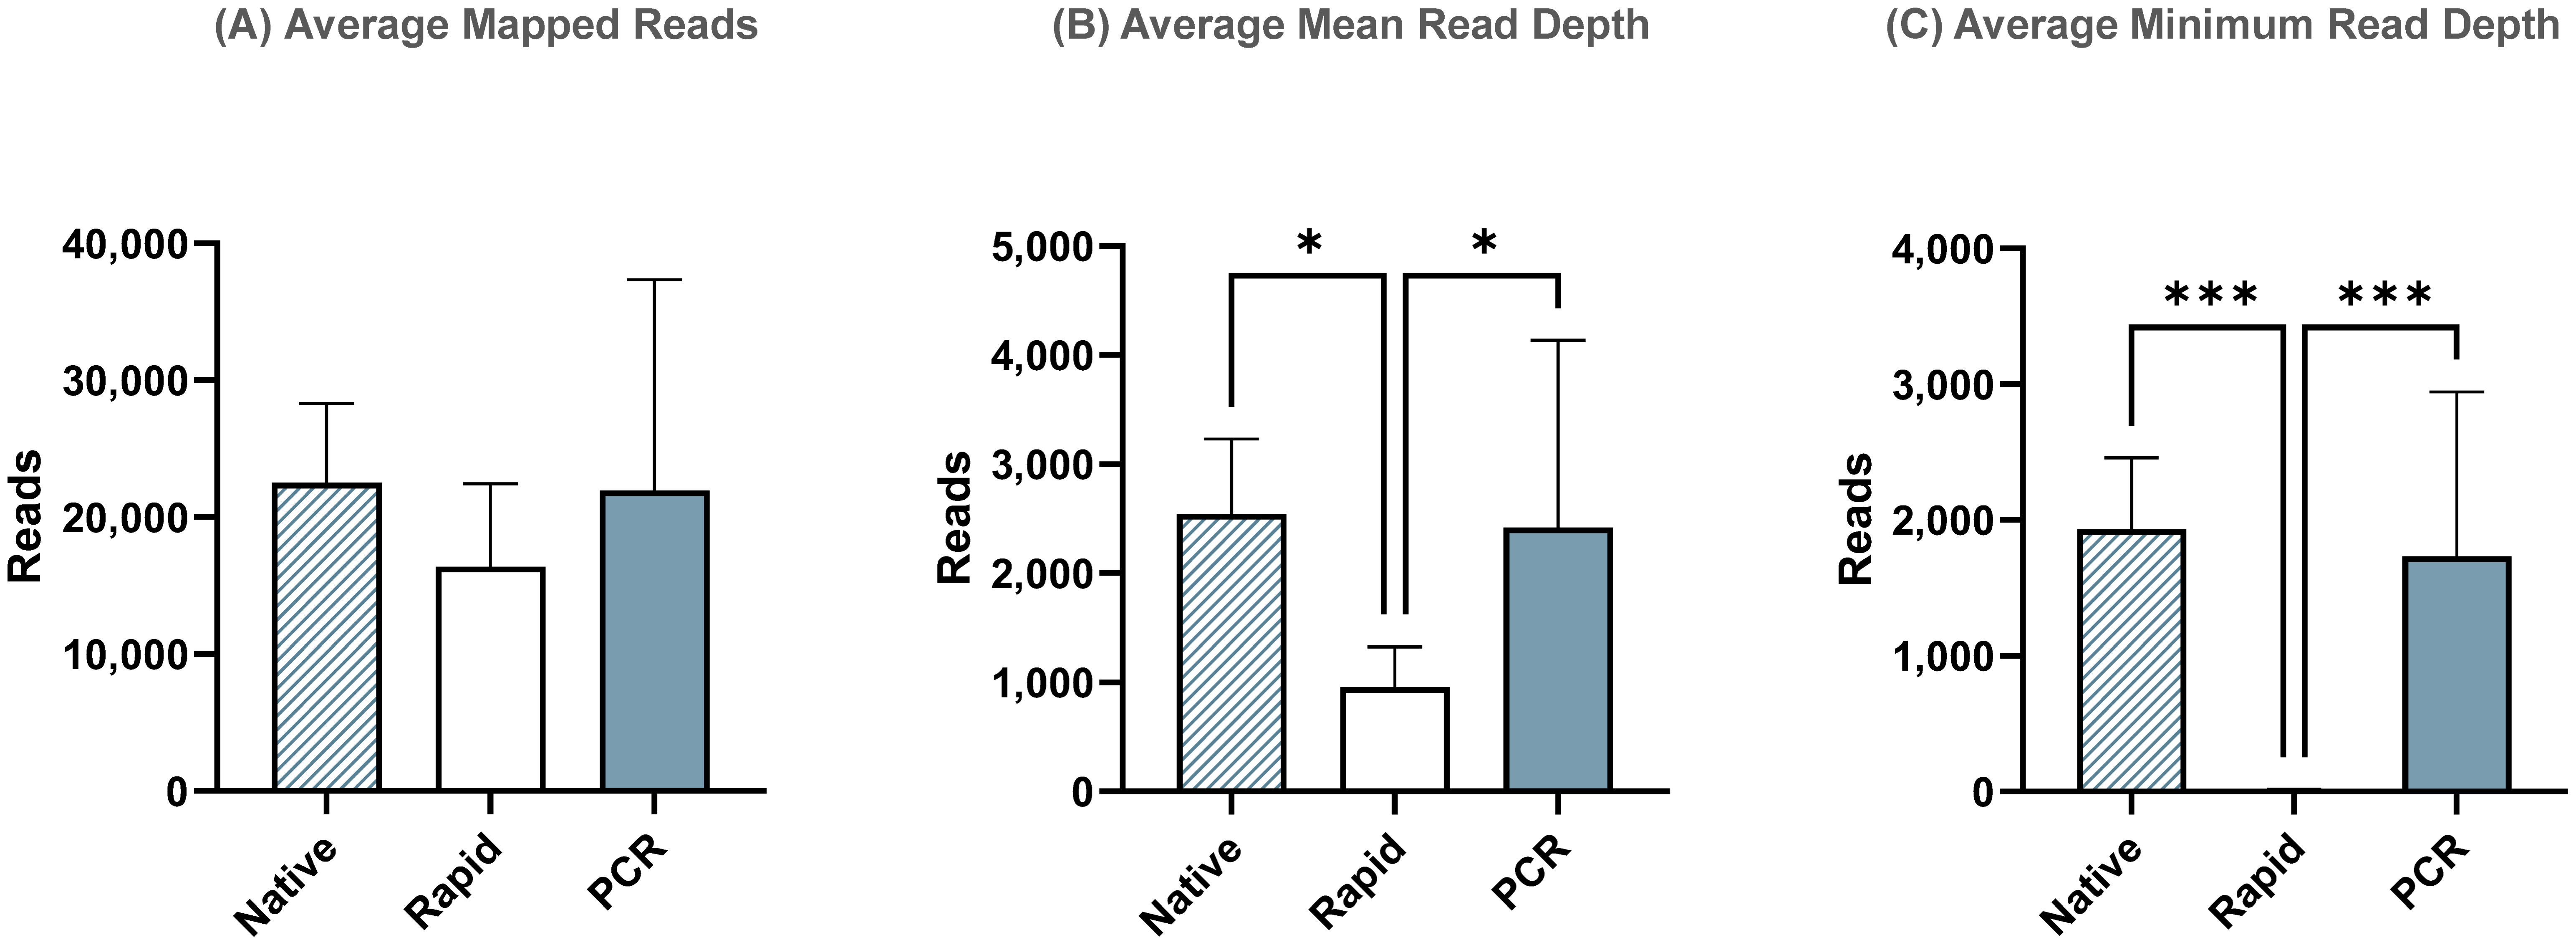
Figure 3. Sequencing summary for comparison of Native, Rapid, and PCR barcoding strategies’ performance with data mapped to full-length reference genomes. Average mapped reads (A), mean read depth (B), and minimum read depth (C) across all segments of eight different influenza A viruses. P-value is defined as follows: *p ≤ 0.05, ***p ≤ 0.001.
Additionally, despite using Opti primers with an overhanging tail longer than the recommended length to account for potential truncation of sequencing reads due to transposase activity in the Rapid run, our results indicated that this was still insufficient to fully sequence the entire influenza genome segments and read coverage was still missing at the 3’- and 5’-ends. This, in turn, resulted in incomplete influenza genome assembly and significantly lower minimum coverage in the Rapid run when compared to the ligase-based Native and PCR runs.
3.3 Barcoded primers combined Native barcoding performance with Rapid barcoding preparation time
To account for transposase-related termini truncation during rapid-based barcode attachment, we re-analyzed sequencing runs using shorter reference sequences containing only coding regions. While the average total number of influenza reads (Figure 4A) and mean read depth (Figure 4B) remained similar to those observed in the complete genome assembly, the minimum read depth significantly increased in the Rapid run for the coding-complete assembly (Figure 4C). However, it was still significantly lower compared to the ligase-based Native and PCR runs. This indicates that termini regions, which were not used in the coding-complete minimum read depth of the complete genome assembly.
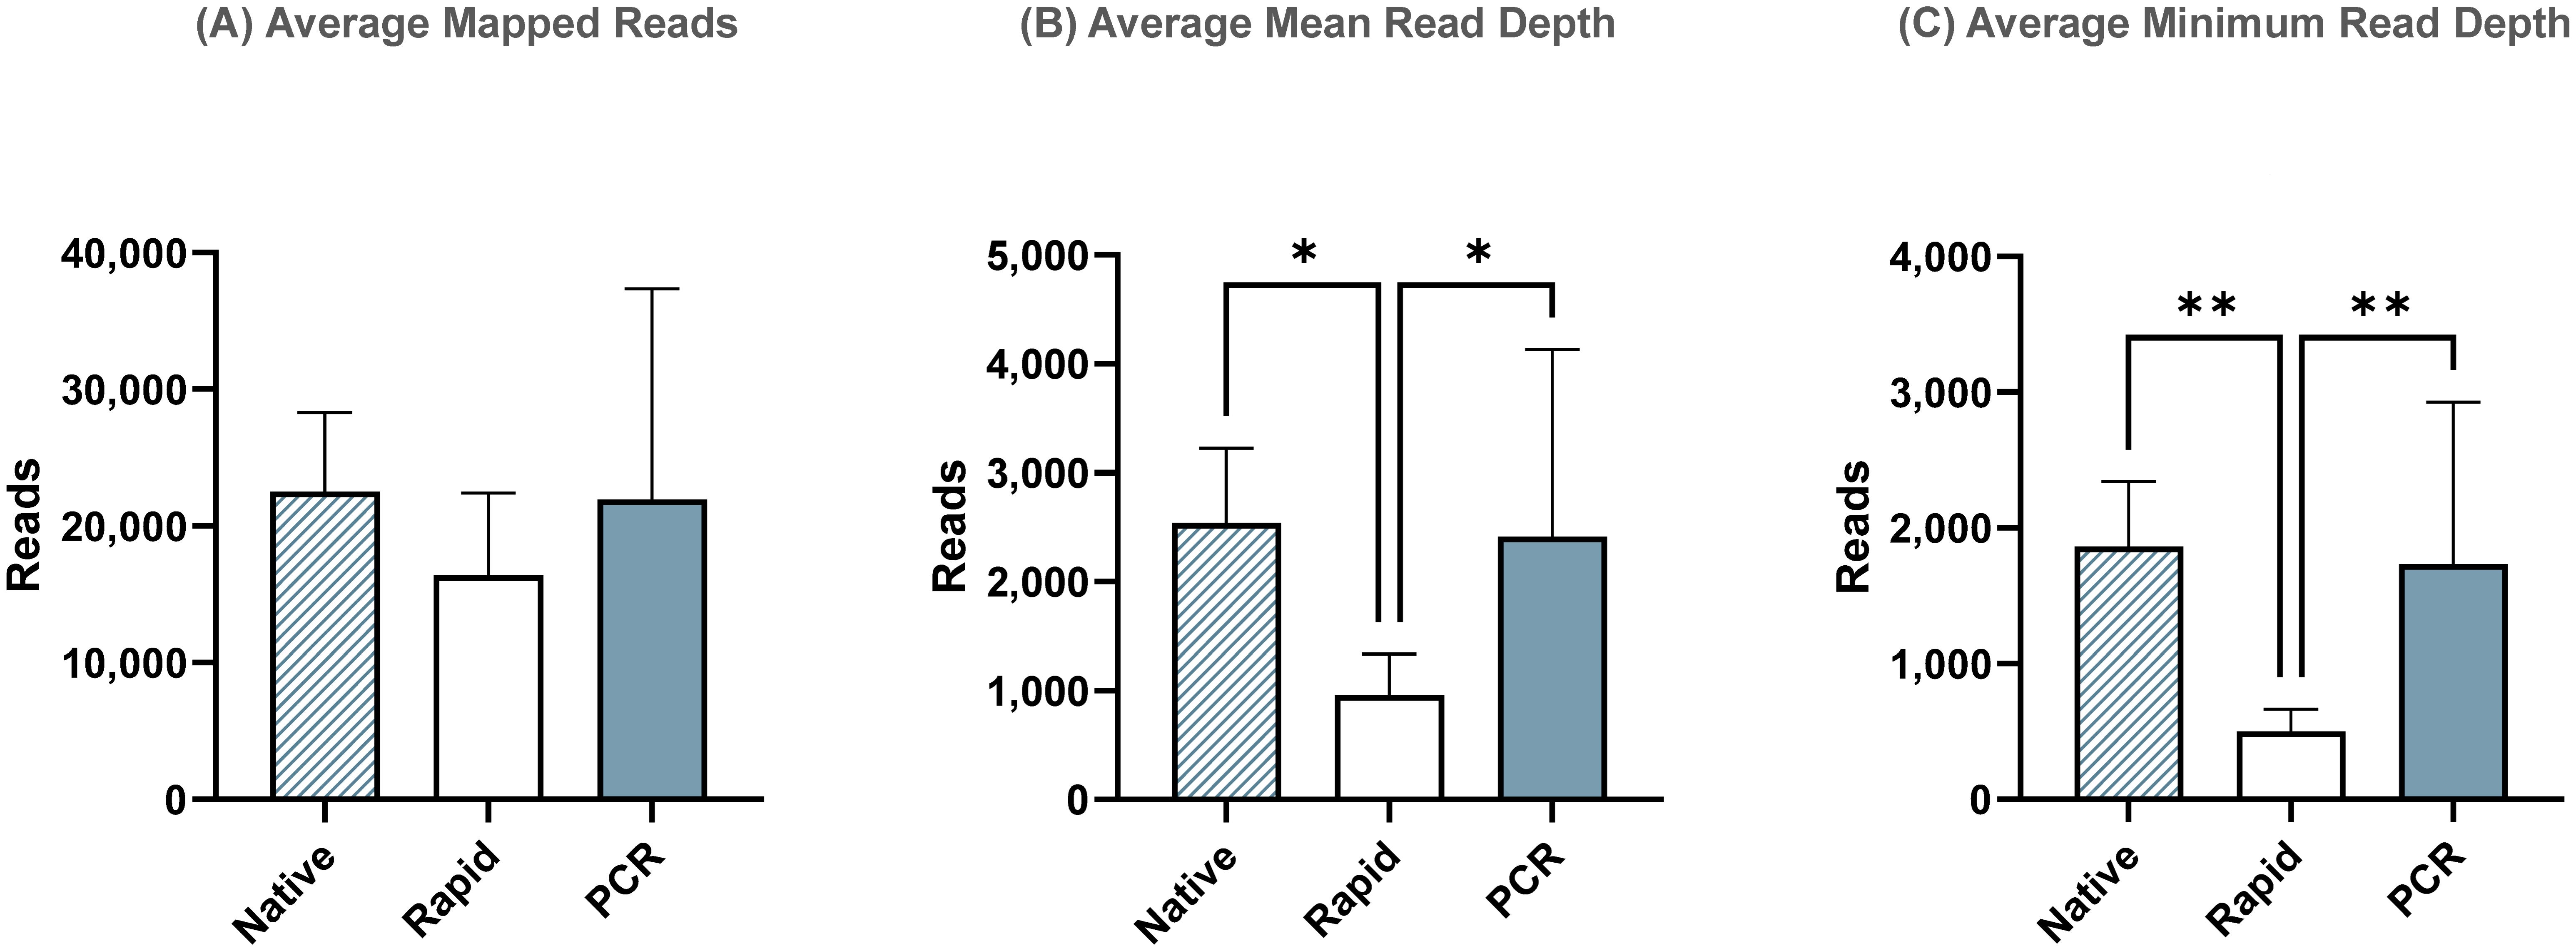
Figure 4. Sequencing summary for comparison of Native, Rapid, and PCR barcoding strategies’ performance with data mapped to reference sequences containing only coding regions to avoid potential bias from transposase cutting termini during Rapid-based barcode attachment. Average mapped (A), mean read depth (B), and minimum read depth (C) across all segments of eight different influenza A viruses. P-value is defined as follows: *p ≤ 0.05, **p ≤ 0.01.
Overall, the PCR run using custom barcoded primers performed similarly to the Native Barcoding Kit, with no statistically significant differences in the average number of influenza reads, mean read depth, or minimum read depth across both complete genome and coding-complete genome assemblies. Notably, the PCR method also provided a substantial reduction in library preparation time, 2.3X faster than the Native Barcoding Kit, and was only 15 minutes longer than the Rapid Barcoding Kit (Figure 5). Considering that the custom barcoding primer approach delivers comparable performance to the Native Barcoding Kit, with similar preparation times to the Rapid kit and a reasonable cost (~$140 per sample for MinION sequencing or ~$70 per sample for Flongle sequencing). It presents an attractive alternative that combines the benefits of both methods, offering a balanced trade-off between speed, cost, and sequencing quality.
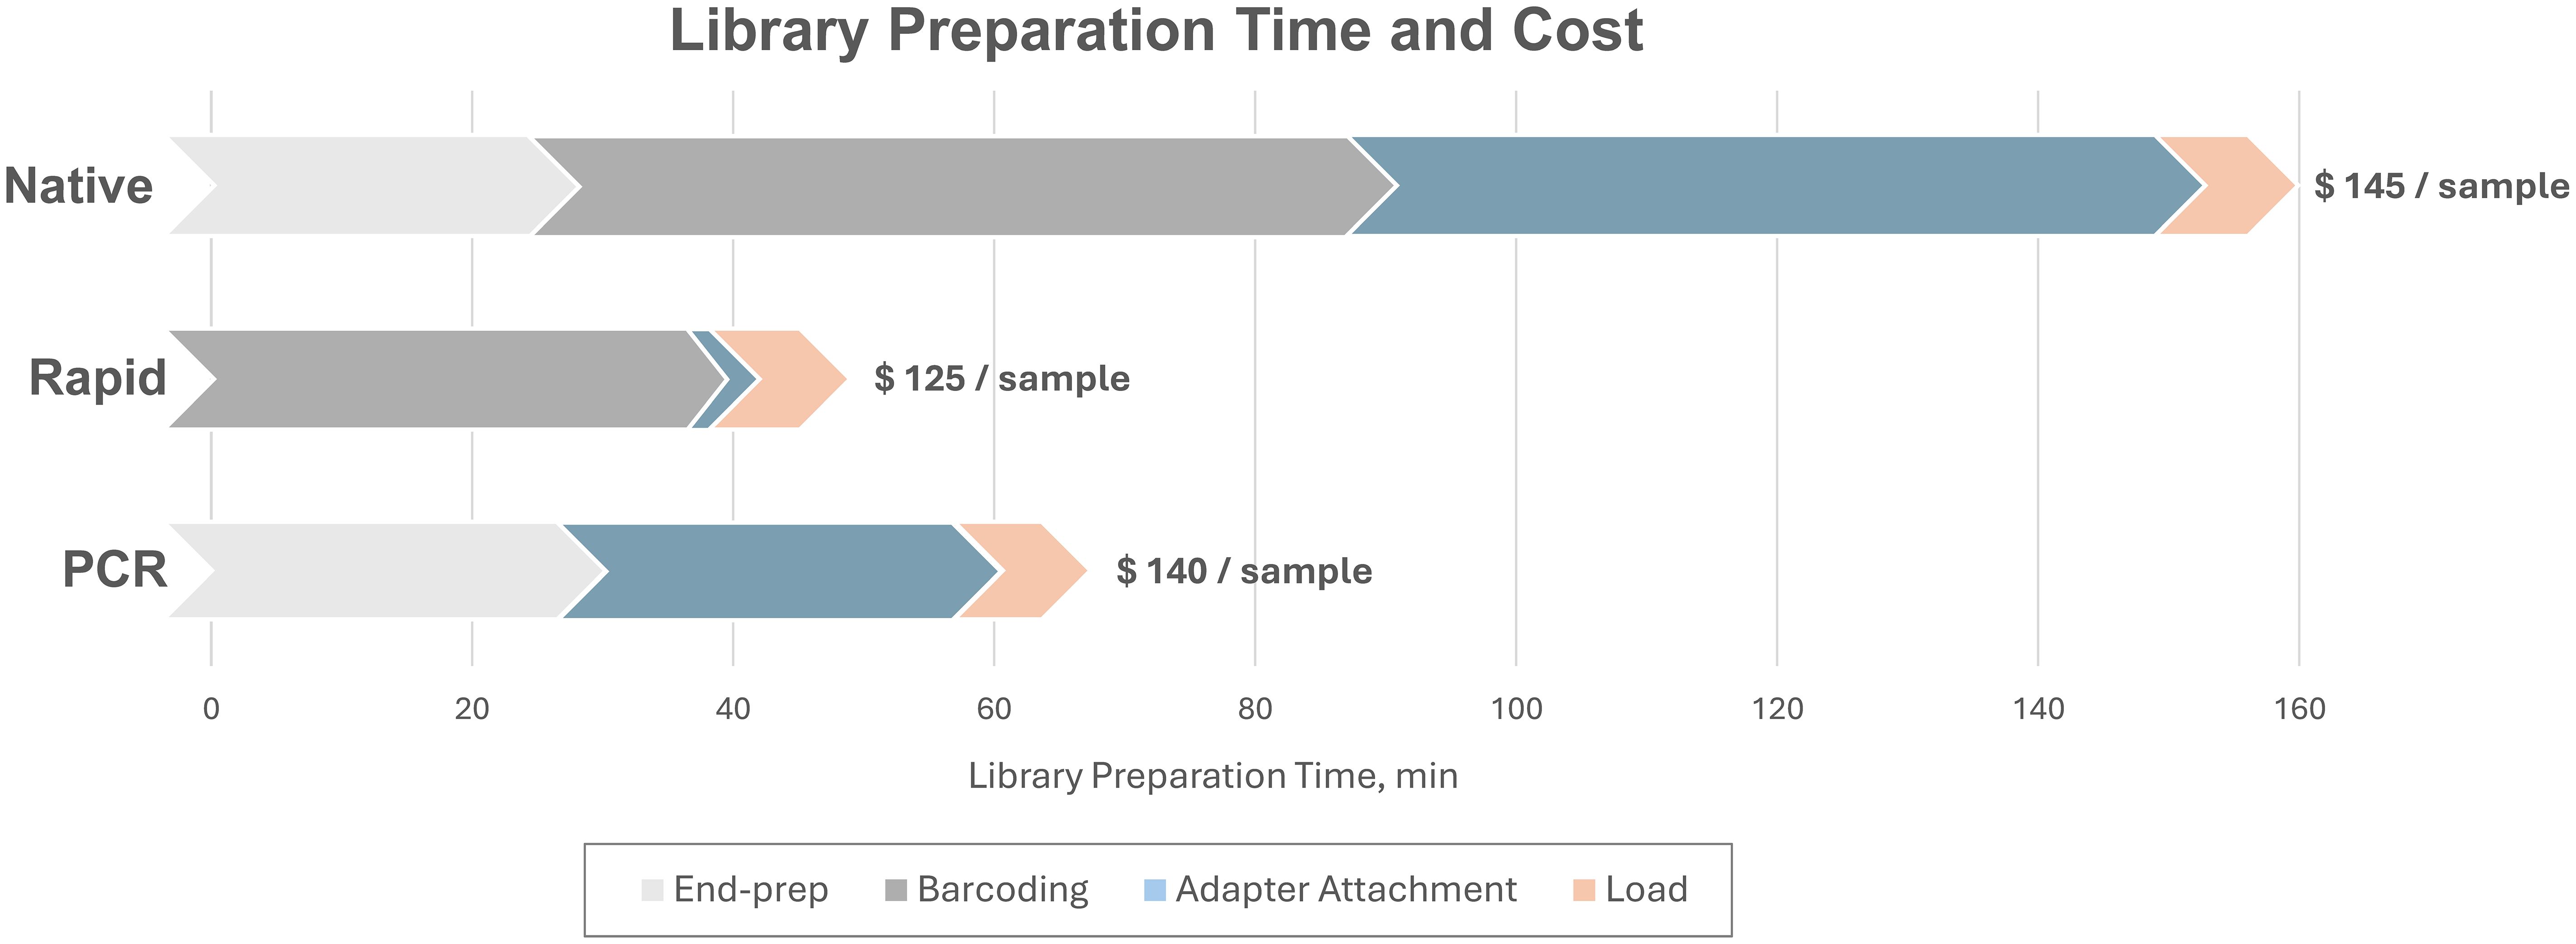
Figure 5. Comparison of time and cost of library preparation for Native, Rapid, and PCR sequencing runs on MinION flow cell. Library preparation time presented excludes RT-PCR amplification and amplicon purification. The cost presented excludes nucleic acid extraction, RT-PCR amplification, and flow cell. The current cost of R10.4.1 MinION flow cell ranges between $450 and $700 per flow cell depending on the purchased batch size, while the Flongle flow cell costs $810 per batch of 12 flow cells.
3.4 PCR method with barcoded primers validated on clinical samples
The PCR method utilizing barcoded primers was additionally tested on 12 clinical samples from different hosts and sample types. The RT-qPCR cycle threshold values for these samples ranged from 8.8 to 23.2, reflecting a different range of viral loads in tested samples (Table 2). Sequencing of 50 fmol of NGS library prepared with the PCR method for 6 hours generated 1,218,695 raw reads. Of these, 94.6% were successfully basecalled, with an average read length of 1344.4 bp and a mean quality score of 15.5 (Figure 6).
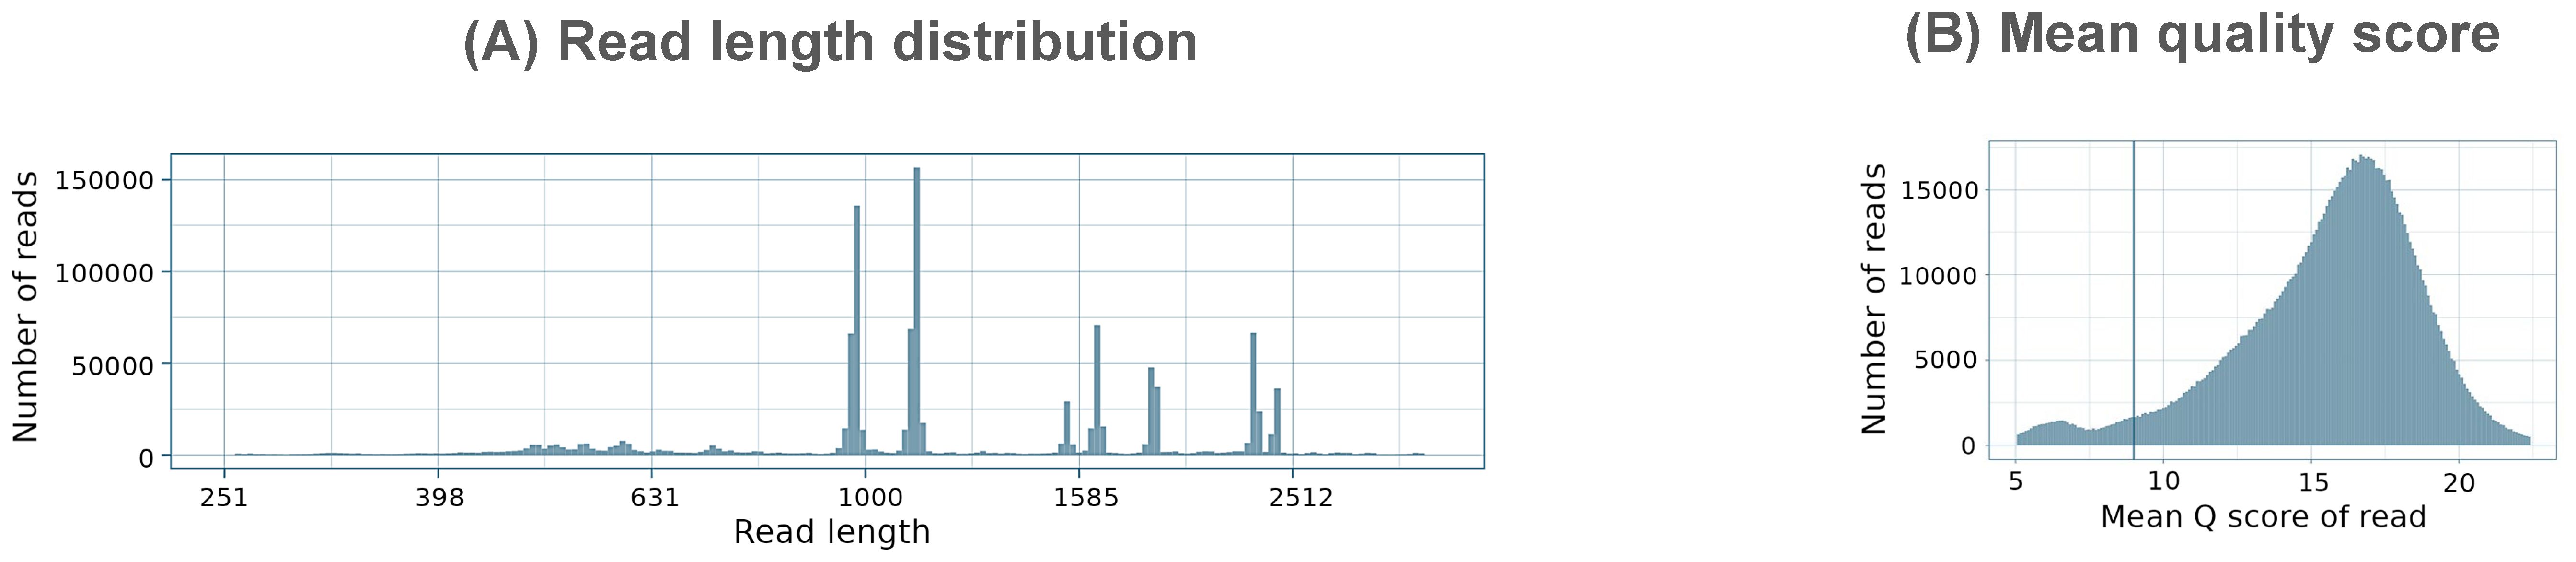
Figure 6. Summary of (A) read length distribution and (B) mean quality distributions in PCR sequencing run with clinical samples.
A total of 92.3% of the basecalled reads were successfully demultiplexed. Reference mapping analysis revealed that 95.8% of the demultiplexed reads aligned to influenza sequences (Table 5). The number of influenza reads per sample ranged from 21,991 to 154,359, indicating successful amplification and sequencing across the different clinical sample types. The average number of mapped reads across influenza segments ranged from 2,749 to 19,295, with the average mean read depth ranging from 2,348 to 15,427 and the average minimum read depth between 31 and 706 reads (Figure 7). Consensus assembly revealed genome coverage ranging from 84.81% to 100%, with all samples showing complete genome coverage except for one OP sample, which had the highest Ct value of 23.2 among all tested samples. This sample exhibited the lowest genome breadth of coverage at 84.8%, primarily due to insufficient read coverage of the PA segment, while the remaining segments had full coverage.
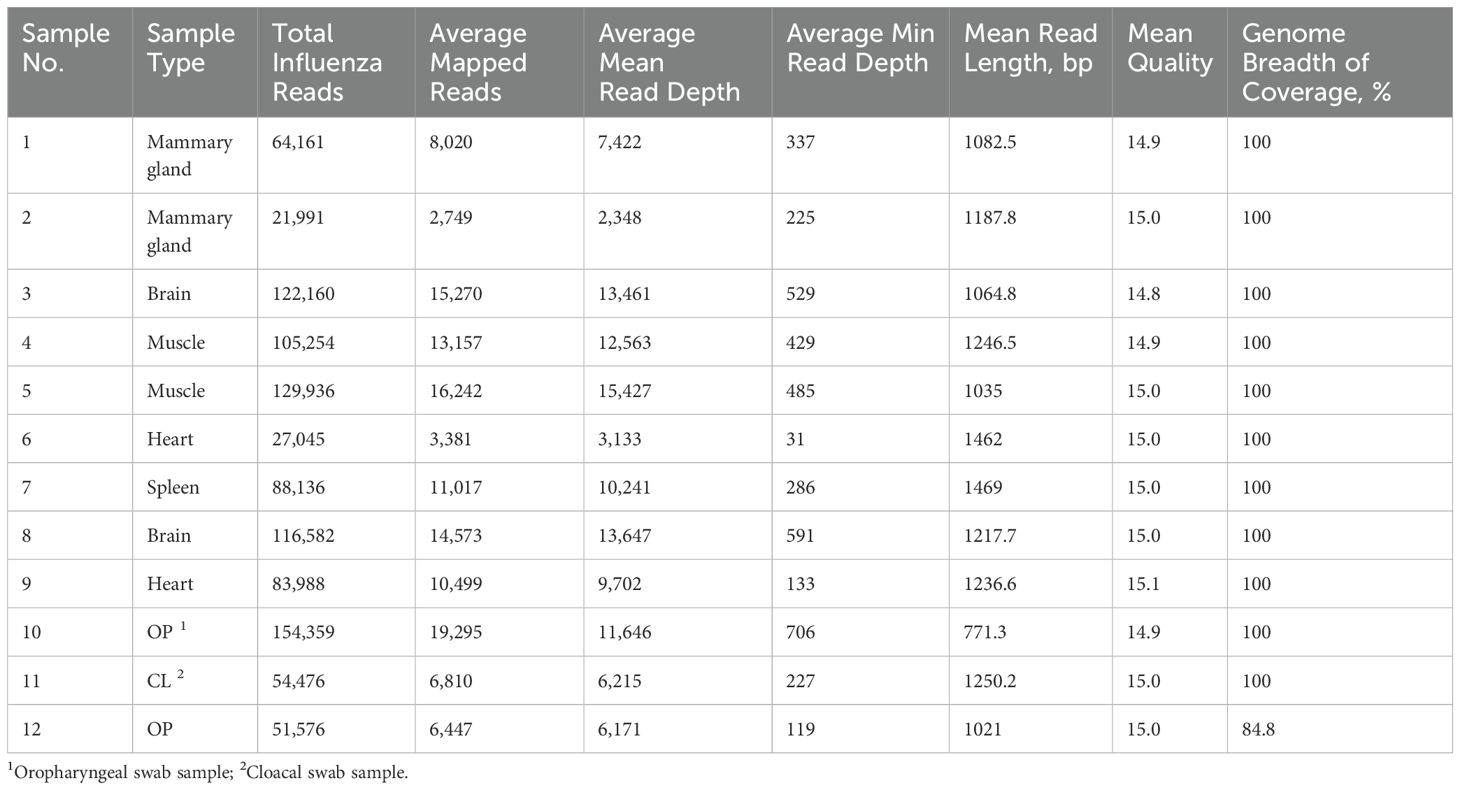
Table 5. Summary statistics of influenza A genome assembly from clinical samples using PCR barcoding strategies for NGS library preparation.
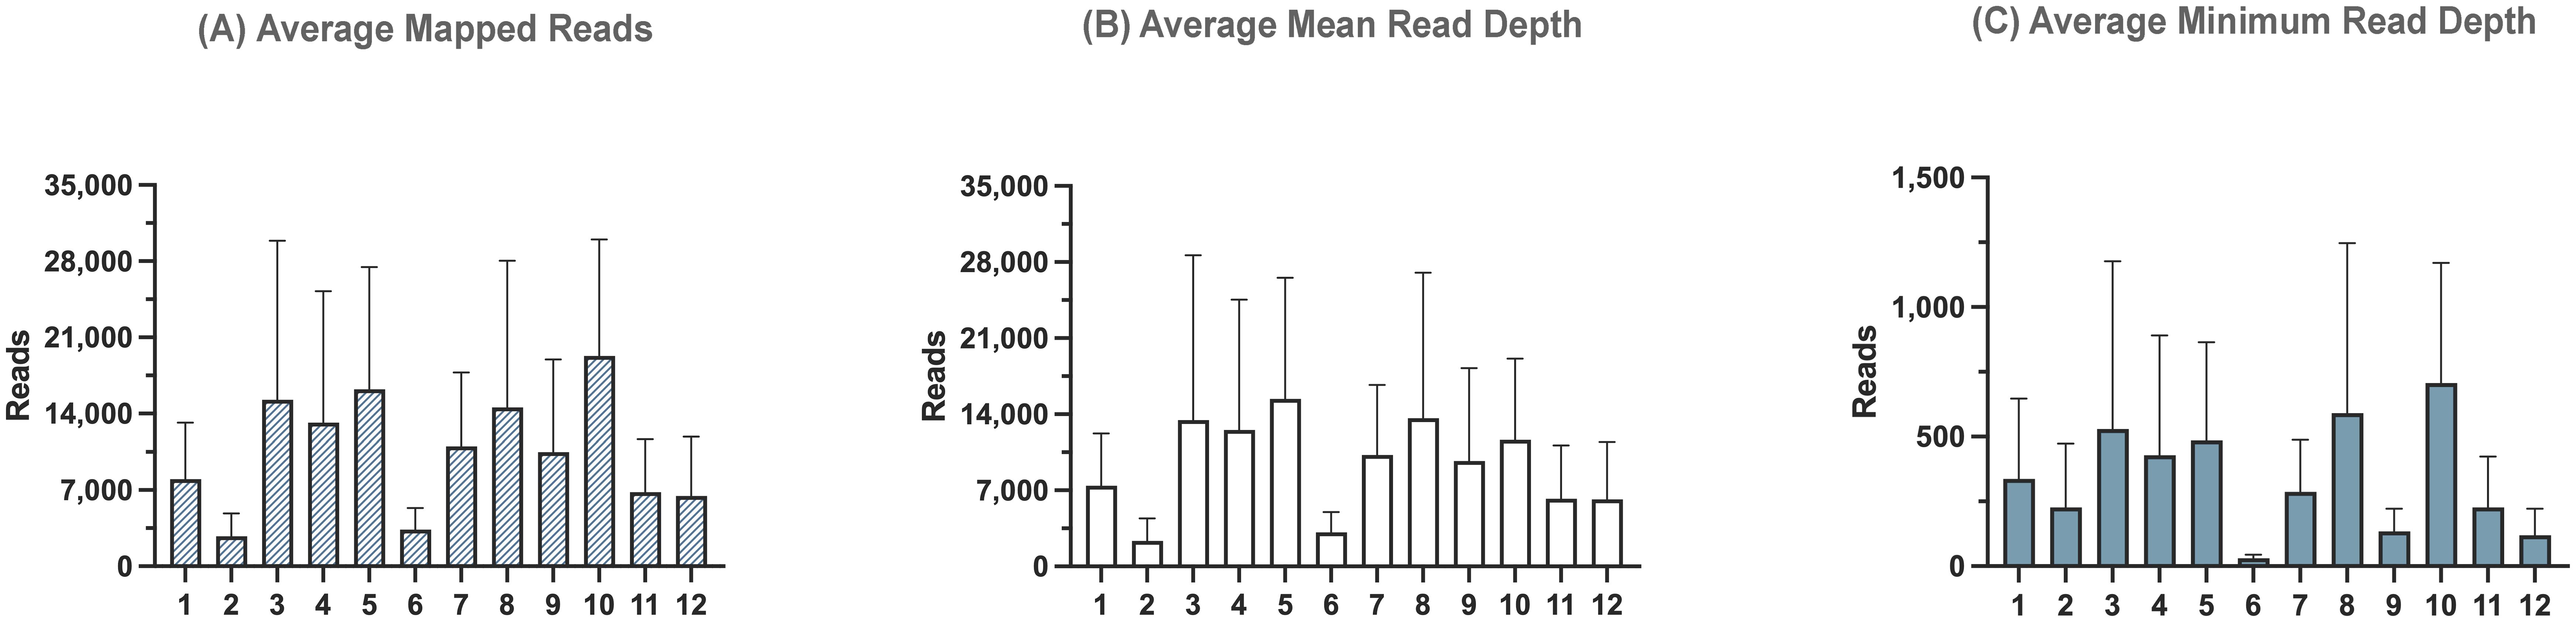
Figure 7. Sequencing summary for PCR barcoding strategies’ performance with clinical samples. Sequencing data was mapped to full-length reference genomes. Average mapped (A), mean read depth (B), and minimum read depth (C) across all segments of influenza A viruses from twelve different clinical samples.
4 Discussions
In this study, we optimized influenza A whole-genome on the nanopore sequencing platform by developing a custom barcoded primer strategy designed to provide both speed and high-quality data. Our results demonstrate that the custom barcoded primer strategy offers performance comparable to the Native Barcoding Kit, while significantly reducing library preparation time by 2.3X compared to the Native kit, and only 15 minutes longer than the Rapid Barcoding Kit. Because the custom barcode provides longer and more uniform reads than the rapid kit, it will likely require shorter sequencing runs to produce enough data for analysis, which could make it the fastest method of the three. Additionally, this method is highly versatile and can be applied to various types of samples, including egg-inoculated and clinical samples, and may prove effective with environmental and field samples, without requiring modifications to the sample preparation process. These findings present a promising solution for influenza surveillance, offering a balanced trade-off between sequencing quality, time efficiency, and cost-effectiveness.
In this study, we compared the custom barcoded primer method with the Native and Rapid barcoding kits in terms of sequencing yield, read quality, read depth, and sequencing output. Both the Native and PCR runs, utilizing ligation-based adapter attachment chemistry, yielded significantly higher numbers of raw reads compared to the Rapid run. This result is consistent with the known reduction in sequencing output associated with the Rapid Barcoding Kit. The decrease in sequencing output is likely due to the less effective rapid-based adapter attachment chemistry and the transposase-based barcoding approach used in the Rapid Barcoding Kit, which fragments amplicons during barcode attachment. While some reduction in reads with the Rapid kit was expected, our results demonstrated that this method produced a 1.2X decrease in total reads compared to the ligase-based methods, which could limit its utility in applications that require high read coverage or require longer sequencing runs to produce enough usable data.
The basecalling efficiency in all three methods was high, with over 80% of raw reads being successfully basecalled in all runs. The PCR run, in particular, achieved the highest percentage of basecalled reads (84.4%) and demonstrated the longest mean read length (1248.1 bp), closely followed by the Native run (81.0% and 1207.7 bp, respectively). Longer reads are crucial for improving genome assembly and accuracy. In contrast, the Rapid run generated shorter reads (730.6 bp), consistent with the fragmentation caused by transposase activity. While this increases speed, it reduces overall sequencing output and introduces challenges in genome assembly, particularly for isolates with recombination events. The mean quality scores were similar across all three methods and were above the minimum requirement of Q9, with scores ranging between 12.5 and 13.1. The distribution of reads across the influenza genome was more uniform in the Native and PCR runs, with reads corresponding to the length of the eight influenza genome segments. In contrast, the Rapid run exhibited a large number of shorter reads due to transposase fragmentation, leading to incomplete genome coverage, especially at the termini, which negatively impacted overall genome coverage.
The comparison of barcode attachment efficiency revealed a clear difference in demultiplexing performance. The Native run, which used ligation-based chemistry, achieved the highest percentage (97.2%) of demultiplexed reads, followed by the PCR method (92.0%). The Rapid run, in contrast, showed the lowest demultiplexing efficiency (87.3%) and the highest percentage of unclassified reads (12.6%). This lower efficiency in the Rapid run is likely due to the less effective barcode and adapter attachment associated with the rapid-based chemistry. Incorrect barcode assignments occurred in both the Native and Rapid runs, but the number of incorrectly barcoded reads was low in both cases. The PCR method, which used custom barcoded primers, showed no incorrect barcode assignments, demonstrating the effectiveness of the optimized Dorado demultiplexing settings for custom barcode arrangements. Currently, demultiplexing for custom barcodes is not supported directly within the MinKNOW software or the EPI2ME wf-basecalling workflow. As a result, it must be performed using a command-line interface with the standalone Dorado basecaller. The specific settings for the custom barcoded primers used in this study are provided in Supplementary Table 1. During the optimization of these settings, we specifically aimed to achieve no incorrect barcode assignments, which are often observed with the default demultiplexing settings for both the Native and Rapid barcoding kits. While lowering the settings for the custom barcoded primers would improve the demultiplexing rate, we prioritized accuracy over quantity. Additionally, we developed a Nextflow workflow that incorporates all necessary files and settings to streamline the demultiplexing process for custom barcodes, making it more accessible. The Nextflow workflow is available at https://github.com/Goraichuk/Dorado_FluA_Custom_Demultiplexing.
In terms of influenza genome assembly, the PCR method produced the highest percentage of reads mapped to reference influenza genome (99.97%) out of all demultiplexed reads, followed closely by the Native (98.8%) and Rapid (98.7%) runs. While the total number of reads mapped across the influenza genome was not significantly different between the three methods, the depth of coverage varied considerably. The PCR method demonstrated similar median and minimum read depths to the Native run, indicating its potential to provide high-quality data with reduced preparation time. In contrast, the Rapid run exhibited lower average mean and minimum depths of mapped reads, suggesting that the reduced read lengths and poorer coverage in the Rapid run resulted in incomplete genome assemblies and less reliable depth across the genome segments. This is particularly critical for SNP analysis and mutation detection, where high-quality and deep coverage are essential. It is important to note that, despite following ONT’s recommendations for Rapid barcoding method to add an extra 15-20 nt to primers to account for regions that will be trimmed during transposase activity, the primers used in our study included an additional 24 nt. However, despite the longer primers it still resulted in reduced read coverage at the influenza termini. Therefore, we recommend considering this when designing primers for amplification in cases where amplicons will be used for library preparation with the Rapid Barcoding Kit.
In addition to differences in read quality and genome coverage, the Native and Rapid kits also differ in cost. The main cost difference lies in the required third-party consumables. The Native library preparation requires Blunt/TA Repair Mix, Ultra II End repair/dA-tailing Module, and Quick Ligation Module. The Rapid library preparation, in contrast, does not require any of these consumables. The PCR method, using custom barcoded primers, eliminates the need for Blunt/TA Ligase Master Mix but still requires the Ultra II End repair/dA-tailing Module and Quick Ligation Module for the adapter ligation. As a result, Native barcoding incurs a higher cost per sample compared to the Rapid and PCR methods. In contrast, the Rapid method is more cost-effective due to its lower reagent requirements, making it a cheaper alternative despite its limitations in read quality and genome coverage. The PCR method presents an appealing alternative, combining the benefits of both approaches.
Additionally, the PCR method utilizing custom barcoded primers was successfully evaluated on 12 clinical samples, including those from bovine mammary gland tissues, cat brain tissues, and chicken brain, muscle, heart, spleen, OP, and CL swab samples. These samples, which varied in viral load, demonstrated the method’s versatility and robustness across different host species and sample types. All samples, except for one with the highest Ct value of 23.2, achieved 100% genome coverage. The sample with the highest Ct value exhibited reduced coverage due to missing reads for the PA segment. However, this did not affect the ability to identify the influenza subtype, as both the HA and NA segments were fully covered. While the results demonstrate the method’s effectiveness for reliable subtype identification even in samples with lower viral loads, further testing is needed to determine its limit of detection. When comparing PCR method on egg-grown virus isolates on Flongle flowcell and clinical samples on MinION flowcell, slightly higher basecalling efficiency and mean quality scores were observed in clinical samples. This can be attributed to the higher performance of the MinION flowcell, rather than differences in sample types. The demultiplexing rate remained consistent at 92.0% for Flongle and 92.3% for MinION, indicating that the efficiency of RT-PCR amplification with custom barcoded primers remained the same across clinical samples. The percentage of influenza reads was slightly lower in clinical samples (95.8%) compared to egg-grown isolates (99.97%), suggesting a marginal reduction in sequencing efficiency for clinical samples.
Overall, while both ONT barcoding kits offer solutions for different needs, with the Native kit providing higher yield but requiring longer library preparation time and higher cost, and the Rapid method being more time- and cost-efficient but lacking in read depth and genome breadth of coverage, our study demonstrates that the custom barcoded primer strategy offers a promising solution for influenza A nanopore sequencing. This method provides both high throughput and time efficiency. With a preparation time 2.3X faster than the Native Barcoding Kit and only 15 minutes longer than the Rapid kit, it strikes an ideal balance between the speed of the Rapid kit and the high-quality results of the Native kit.
5 Conclusion
In summary, our custom barcoded primer strategy for nanopore sequencing provides a balanced approach for influenza A sequencing, offering both speed and high-quality results. While the Rapid Barcoding Kit offers speed, it sacrifices sequencing yield and read depth, which are essential for comprehensive genomic analysis. The Native Barcoding Kit provides high-quality data but requires longer preparation times. The custom barcoded primer method offers a promising alternative that combines the advantages of both methods, reducing preparation time without compromising sequencing quality, making it a valuable tool for influenza A surveillance and outbreak management.
Data availability statement
The datasets presented in the study were deposited in the NCBI Sequence Read Archive under BioProject PRJNA1188165 (https://www.ncbi.nlm.nih.gov/bioproject/PRJNA1188165).
Ethics statement
The animal study was approved by the Institutional Laboratory Animal Care and Use Committee of the United States National Poultry Research Center, ARS, USDA. The study was conducted in accordance with the local legislation and institutional requirements.
Author contributions
IVG: Writing – original draft, Conceptualization, Methodology, Software, Validation, Investigation, Formal analysis, Data Curation, Visualization. DLS: Writing – review & editing, Conceptualization, Methodology, Supervision, Formal analysis, Data curation, Project administration, Funding acquisition.
Funding
The author(s) declare that financial support was received for the research and/or publication of this article. This study was funded by the U.S. Department of Agriculture through Agricultural Research Service Project No. 6040-32000-081-00D, APHIS NALHN Enhancement grant no. AP21VSD&B000C005, and APHIS subaward with Iowa State University AP22VSD&B000C010.
Acknowledgments
The authors thank Dawn Williams-Coplin, Suzanne DeBlois, and Ricky Zoller for their technical assistance with this work. The mention of trade names or commercial products in this publication is solely for providing specific information and does not imply recommendation or endorsement by the USDA-ARS. We gratefully acknowledge all data contributors, i.e., the Authors and their Originating laboratories responsible for obtaining the specimens, and their Submitting laboratories for generating the genetic sequence and metadata and sharing via the GISAID Initiative, on which this research is based. A table of the contributors is available in Supplementary Table 2.
Conflict of interest
The authors declare that the research was conducted in the absence of any commercial or financial relationships that could be construed as a potential conflict of interest.
Generative AI statement
The author(s) declare that no Generative AI was used in the creation of this manuscript.
Publisher’s note
All claims expressed in this article are solely those of the authors and do not necessarily represent those of their affiliated organizations, or those of the publisher, the editors and the reviewers. Any product that may be evaluated in this article, or claim that may be made by its manufacturer, is not guaranteed or endorsed by the publisher.
Supplementary material
The Supplementary Material for this article can be found online at: https://www.frontiersin.org/articles/10.3389/fcimb.2025.1545032/full#supplementary-material
References
Andrés, C., Cuerpo, M.D., Rabella, N., Piñana, M., Iglesias-Cabezas, M. J., González-Sánchez, A., et al. (2023). Detection of reassortant influenza B strains from 2004 to 2015 seasons in Barcelona (Catalonia, Spain) by whole genome sequencing. Virus Res. 330, 199089. doi: 10.1016/j.virusres.2023.199089
Barbachano-Guerrero, A., Perez, D. R., Sawyer, S. L. (2023). How avian influenza viruses spill over to mammals. Elife 12, e86051. doi: 10.7554/eLife.86051
Baybay, Z., Montecillo, A., Pantua, A., Mananggit, M., Romo, G. R., San Pedro, E., et al. (2024). Molecular characterization of a clade 2.3.4.4b H5N1 high pathogenicity avian influenza virus from a 2022 outbreak in layer chickens in the Philippines. Pathogens 13 (10), 844. doi: 10.3390/pathogens13100844
Carr, C. E., Bryan, N. C., Saboda, K. N., Bhattaru, S. A., Ruvkun, G., Zuber, M. T. (2020). Nanopore sequencing at Mars, Europa, and microgravity conditions. NPJ Microgravity 6, 24. doi: 10.1038/s41526-020-00113-9
Caserta, L. C., Frye, E. A., Butt, S. L., Laverack, M., Nooruzzaman, M., Covaleda, L. M., et al. (2024). Spillover of highly pathogenic avian influenza H5N1 virus to dairy cattle. Nature 634, 669–676. doi: 10.1038/s41586-024-07849-4
Castro-Wallace, S. L., Chiu, C. Y., John, K. K., Stahl, S. E., Rubins, K. H., McIntyre, A. B. R., et al. (2017). Nanopore DNA sequencing and genome assembly on the international space station. Sci. Rep. 7, 18022. doi: 10.1038/s41598-017-18364-0
CDC (2024). H5 bird flu: current situation. Available online at: https://www.cdc.gov/bird-flu/situation-summary/index.html.
Chauhan, R. P., Gordon, M. L. (2022). Review of genome sequencing technologies in molecular characterization of influenza A viruses in swine. J. Vet. Diagn. Invest. 34, 177–189. doi: 10.1177/10406387211068023
de Carvalho Araujo, A., Cho, A. Y., Silva, L. M. N., Corrêa, T. C., de Souza, G. C., Albuquerque, A. S., et al. (2024). Mortality in sea lions is associated with the introduction of the H5N1 clade 2.3.4.4b virus in Brazil October 2023: whole genome sequencing and phylogenetic analysis. BMC Vet. Res. 20, 285. doi: 10.1186/s12917-024-04137-1
De Coster, W., D’Hert, S., Schultz, D. T., Cruts, M., Van Broeckhoven, C. (2018). NanoPack: visualizing and processing long-read sequencing data. Bioinformatics 34, 2666–2669. doi: 10.1093/bioinformatics/bty149
Dinis, J. M., Florek, K. R., Fatola, O. O., Moncla, L. H., Mutschler, J. P., Charlier, O. K., et al. (2016). Deep sequencing reveals potential antigenic variants at low frequencies in influenza A virus-infected humans. J. Virol. 90, 3355–3365. doi: 10.1128/JVI.03248-15
Faria, N. R., Sabino, E. C., Nunes, M. R., Alcantara, L. C., Loman, N. J., Pybus, O. G. (2016). Mobile real-time surveillance of Zika virus in Brazil. Genome Med. 8, 97. doi: 10.1186/s13073-016-0356-2
García, M., Suarez, D. L., Crawford, J. M., Latimer, J. W., Slemons, R. D., Swayne, D. E., et al. (1997). Evolution of H5 subtype avian influenza A viruses in North America. Virus Res. 51, 115–124. doi: 10.1016/s0168-1702(97)00087-7
Goraichuk, I. V., Harden, M., Spackman, E., Suarez, D. L. (2024). The 28S rRNA RT-qPCR assay for host depletion evaluation to enhance avian virus detection in Illumina and Nanopore sequencing. Front. Microbiol. 15, 1328987. doi: 10.3389/fmicb.2024.1328987
Goraichuk, I., Risalvato, J., Pantin-Jackwood, M., Suarez, D. L. (2024a). Optimized RT-PCR protocols for whole genome amplification of influenza A virus for NGS. protocols.io. doi: 10.17504/protocols.io.bp2l62r15gqe/v1
Goraichuk, I., Risalvato, J., Pantin-Jackwood, M., Suarez, D. (2024b). Improved influenza A whole-genome sequencing protocol front. Cell. Infect. Microbiol. 14, 1497278. doi: 10.3389/fcimb.2024.1497278
Goraichuk, I., Suarez, D. (2024). Barcoded primers: influenza A whole genome amplification for nanopore sequencing. In protocols.io. doi: 10.17504/protocols.io.5qpvo93e7v4o/v1
Gowers, G. F., Vince, O., Charles, J. H., Klarenberg, I., Ellis, T., Edwards, A. (2019). Entirely off-grid and solar-powered DNA sequencing of microbial communities during an ice cap traverse expedition. Genes (Basel) 10 (11), 902. doi: 10.3390/genes10110902
Graziosi, G., Lupini, C., Catelli, E., Carnaccini, S. (2024). Highly pathogenic avian influenza (HPAI) H5 clade 2.3.4.4b virus infection in birds and mammals. Anim. (Basel) 14 (11), 902. doi: 10.3390/ani14091372
Guo, X., Zhou, Y., Yan, H., An, Q., Liang, C., Liu, L., et al. (2024). Molecular markers and mechanisms of influenza A virus cross-species transmission and new host adaptation. Viruses 16 (6), 883. doi: 10.3390/v16060883
Hall, M. B., Wick, R. R., Judd, L. M., Nguyen, A. N., Steinig, E. J., Xie, O., et al. (2024). Benchmarking reveals superiority of deep learning variant callers on bacterial nanopore sequence data. Elife 13, RP98300. doi: 10.7554/eLife.98300
Hoenen, T., Groseth, A., Rosenke, K., Fischer, R. J., Hoenen, A., Judson, S. D., et al. (2016). Nanopore sequencing as a rapidly deployable ebola outbreak tool. Emerg. Infect. Dis. 22, 331–334. doi: 10.3201/eid2202.151796
Hoffmann, E., Stech, J., Guan, Y., Webster, R. G., Perez, D. R. (2001). Universal primer set for the full-length amplification of all influenza A viruses. Arch. Virol. 146, 2275–2289. doi: 10.1007/s007050170002
Imai, K., Tamura, K., Tanigaki, T., Takizawa, M., Nakayama, E., Taniguchi, T., et al. (2018). Whole genome sequencing of influenza A and B viruses with the minION sequencer in the clinical setting: A pilot study. Front. Microbiol. 9. doi: 10.3389/fmicb.2018.02748
Ip, H. S., Uhm, S., Killian, M. L., Torchetti, M. K. (2023). An evaluation of avian influenza virus whole-genome sequencing approaches using nanopore technology. Microorganisms 11 (2), 529. doi: 10.3390/microorganisms11020529
Johnson, S. S., Zaikova, E., Goerlitz, D. S., Bai, Y., Tighe, S. W. (2017). Real-time DNA sequencing in the antarctic dry valleys using the oxford nanopore sequencer. J. Biomol Tech 28, 2–7. doi: 10.7171/jbt.17-2801-009
Kandeil, A., Patton, C., Jones, J. C., Jeevan, T., Harrington, W. N., Trifkovic, S., et al. (2023). Rapid evolution of A(H5N1) influenza viruses after intercontinental spread to North America. Nat. Commun. 14, 3082. doi: 10.1038/s41467-023-38415-7
Kang, M., Wang, L. F., Sun, B. W., Wan, W. B., Ji, X., Baele, G., et al. (2024). Zoonotic infections by avian influenza virus: changing global epidemiology, investigation, and control. Lancet Infect. Dis. 24, e522–e531. doi: 10.1016/S1473-3099(24)00234-2
Karamendin, K., Kydyrmanov, A., Seidalina, A., Asanova, S., Sayatov, M., Kasymbekov, E., et al. (2016). Complete genome sequence of a novel avian paramyxovirus (APMV-13) isolated from a wild bird in Kazakhstan. Genome Announc 4 (3), e00167-16. doi: 10.1128/genomeA.00167-16
Khare, S., Gurry, C., Freitas, L., Schultz, M. B., Bach, G., Diallo, A., et al. (2021). GISAID’s role in pandemic response. China CDC Wkly 3, 1049–1051. doi: 10.46234/ccdcw2021.255
Kim, J. Y., Jeong, S., Kim, D. W., Lee, D. W., Lee, D. H., Kim, D., et al. (2024). Genomic epidemiology of highly pathogenic avian influenza A (H5N1) virus in wild birds in South Korea during 2021-2022: Changes in viral epidemic patterns. Virus Evol. 10, veae014. doi: 10.1093/ve/veae014
King, J., Harder, T., Globig, A., Stacker, L., Günther, A., Grund, C., et al. (2022). Highly pathogenic avian influenza virus incursions of subtype H5N8, H5N5, H5N1, H5N4, and H5N3 in Germany during 2020-21. Virus Evol. 8, veac035. doi: 10.1093/ve/veac035
Koopmans, M. P. G., Barton Behravesh, C., Cunningham, A. A., Adisasmito, W. B., Almuhairi, S., Bilivogui, P., et al. (2024). The panzootic spread of highly pathogenic avian influenza H5N1 sublineage 2.3.4.4b: a critical appraisal of One Health preparedness and prevention. Lancet Infect. Dis. 24 (12), e774–81. doi: 10.1016/S1473-3099(24)00438-9
Lagan, P., Hamil, M., Cull, S., Hanrahan, A., Wregor, R. M., Lemon, K. (2024). Swine influenza A virus infection dynamics and evolution in intensive pig production systems. Virus Evol. 10, veae017. doi: 10.1093/ve/veae017
Lanfear, R., Schalamun, M., Kainer, D., Wang, W., Schwessinger, B. (2019). MinIONQC: fast and simple quality control for MinION sequencing data. Bioinformatics 35, 523–525. doi: 10.1093/bioinformatics/bty654
Lee, D. H., Torchetti, M. K., Killian, M. L., Brown, I., Swayne, D. E. (2024). Genome sequences of haemagglutinin cleavage site predict the pathogenicity phenotype of avian influenza virus: statistically validated data for facilitating rapid declarations and reducing reliance on. Avian Pathol. 53, 242–246. doi: 10.1080/03079457.2024.2317430
Leyson, C. M., Alkhamis, M. A., Goraichuk, I. V. (2023). Editorial: Sequencing and phylogenetic analysis as a tool in molecular epidemiology of veterinary infectious diseases. Front. Vet. Sci. 10. doi: 10.3389/fvets.2023.1236155
Li, H. (2018). Minimap2: pairwise alignment for nucleotide sequences. Bioinformatics 34, 3094–3100. doi: 10.1093/bioinformatics/bty191
Manrubia, S. C., Escarmís, C., Domingo, E., Lázaro, E. (2005). High mutation rates, bottlenecks, and robustness of RNA viral quasispecies. Gene 347, 273–282. doi: 10.1016/j.gene.2004.12.033
Maqsood, R., Smith, M. F., Holland, L. A., Sullins, R. A., Holland, S. C., Tan, M., et al. (2024). Influenza virus genomic surveillance, arizona, USA, 2023-2024. Viruses 16 (5), 692. doi: 10.3390/v16050692
McIntyre, A. B. R., Rizzardi, L., Yu, A. M., Alexander, N., Rosen, G. L., Botkin, D. J., et al. (2016). Nanopore sequencing in microgravity. NPJ Microgravity 2, 16035. doi: 10.1038/npjmgrav.2016.35
Miah, M., Hossain, M. E., Hasan, R., Alam, M. S., Puspo, J. A., Hasan, M. M., et al. (2023). Culture-independent workflow for nanopore minION-based sequencing of influenza A virus. Microbiol. Spectr. 11, e0494622. doi: 10.1128/spectrum.04946-22
Mitchell, P. K., Cronk, B. D., Voorhees, I. E. H., Rothenheber, D., Anderson, R. R., Chan, T. H., et al. (2021). Method comparison of targeted influenza A virus typing and whole-genome sequencing from respiratory specimens of companion animals. J. Vet. Diagn. Invest. 33, 191–201. doi: 10.1177/1040638720933875
Oxford_Nanopore_Technologie (2024). Ligation sequencing amplicons V14 (SQK-LSK114). Available online at: https://nanoporetech.com/document/ligation-sequencing-amplicons-sqk-lsk114.
Oxford_Nanopore_Technologies (2024a). Ligation sequencing influenza whole genome V14 (SQK-NBD114.24 or SQK-NBD114.96). Available online at: https://nanoporetech.com/document/ligation-sequencing-influenza-whole-genome-v14.
Oxford_Nanopore_Technologies (2024b). Chemistry technical document. Available online at: https://nanoporetech.com/document/chemistry-technical-document.
Oxford_Nanopore_Technologies (2024c). Ligation sequencing amplicons - Native Barcoding Kit 24 V14 (SQK-NBD114.24). Available online at: https://nanoporetech.com/document/ligation-sequencing-amplicons-native-barcoding-v14-sqk-nbd114-24.
Oxford_Nanopore_Technologies (2024d). Rapid sequencing V14 - Amplicon sequencing (SQK-RBK114.24 or SQK-RBK114.96). Available online at: https://nanoporetech.com/document/rapid-sequencing-gdna-barcoding-sqk-rbk114.
Parker, J., Helmstetter, A. J., Devey, D., Wilkinson, T., Papadopulos, A. S. T. (2017). Field-based species identification of closely-related plants using real-time nanopore sequencing. Sci. Rep. 7, 8345. doi: 10.1038/s41598-017-08461-5
Plancarte, M., Kovalenko, G., Baldassano, J., Ramírez, A. L., Carrillo, S., Duignan, P. J., et al. (2023). Human influenza A virus H1N1 in marine mammals in California, 2019. PloS One 18, e0283049. doi: 10.1371/journal.pone.0283049
Plaza, P. I., Gamarra-Toledo, V., Euguí, J. R., Lambertucci, S. A. (2024). Recent changes in patterns of mammal infection with highly pathogenic avian influenza A(H5N1) virus worldwide. Emerg. Infect. Dis. 30, 444–452. doi: 10.3201/eid3003.231098
Pomerantz, A., Peñafiel, N., Arteaga, A., Bustamante, L., Pichardo, F., Coloma, L. A., et al. (2018). Real-time DNA barcoding in a rainforest using nanopore sequencing: opportunities for rapid biodiversity assessments and local capacity building. Gigascience 7 (4), giy033. doi: 10.1093/gigascience/giy033
Powell, J. D., Thomas, M. N., Anderson, T. K., Zeller, M. A., Gauger, P. C., Vincent Baker, A. L. (2024). 2018-2019 human seasonal H3N2 influenza A virus spillovers into swine with demonstrated virus transmission in pigs were not sustained in the pig population. J. Virol. 98 (12), e0008724. doi: 10.1128/jvi.00087-24
Pugh, J. (2023). The current state of nanopore sequencing. Methods Mol. Biol. 2632, 3–14. doi: 10.1007/978-1-0716-2996-3_1
Quick, J., Loman, N. J., Duraffour, S., Simpson, J. T., Severi, E., Cowley, L., et al. (2016). Real-time, portabl e genome sequencing for Ebola surveillance. Nature 530, 228–232. doi: 10.1038/nature16996
Reperant, L. A., Rimmelzwaan, G. F., Kuiken, T. (2009). Avian influenza viruses in mammals. Rev. Sci. Tech 28, 137–159. doi: 10.20506/rst.28.1.1876
Senne, D. A. (2008). “Virus propagation in embryonated eggs,” in A laboratory manual for the isolation, identification and characterization of avian pathogens. Eds. Dufour-Zavala, L., Swayne, D. E., Glisson, J. R., Pearson, J. E., Reed, W. M., Jackwood, M. W., Woolcock, P. R. (The American Association of Avian Pathologists, Athens, GA).
Siegers, J. Y., Wille, M., Yann, S., Tok, S., Sin, S., Chea, S., et al. (2024). Detection and phylogenetic analysis of contemporary H14N2 Avian influenza A virus in domestic ducks in Southeast Asia (Cambodia). Emerg. Microbes Infect. 13, 2297552. doi: 10.1080/22221751.2023.2297552
Sović, I., Šikić, M., Wilm, A., Fenlon, S. N., Chen, S., Nagarajan, N. (2016). Fast and sensitive mapping of nanopore sequencing reads with GraphMap. Nat. Commun. 7, 11307. doi: 10.1038/ncomms11307
Spackman, E., Jones, D. R., McCoig, A. M., Colonius, T. J., Goraichuk, I. V., Suarez, D. L. (2024). Characterization of highly pathogenic avian influenza virus in retail dairy products in the US. J. Virol. 98, e0088124. doi: 10.1128/jvi.00881-24
Spackman, E., Senne, D. A., Myers, T. J., Bulaga, L. L., Garber, L. P., Perdue, M. L., et al. (2002). Development of a real-time reverse transcriptase PCR assay for type A influenza virus and the avian H5 and H7 hemagglutinin subtypes. J. Clin. Microbiol. 40, 3256–3260. doi: 10.1128/JCM.40.9.3256-3260.2002
Suarez, D. L., Goraichuk, I. V., Killmaster, L., Spackman, E., Clausen, N. J., Colonius, T. J., et al. (2025). Testing of retail cheese, butter, ice cream, and other dairy products for highly pathogenic avian influenza in the US. J. Food Prot 88, 100431. doi: 10.1016/j.jfp.2024.100431
Suarez, D. L. (2017). Influenza A virus Animal influenza. Ed. Swayne, D. E. (Wiley-Blackwell: Ames, IA, USA). doi: 10.1002/9781118924341.ch1
Sun, X., Belser, J. A., Maines, T. R. (2020). Adaptation of H9N2 influenza viruses to mammalian hosts: A review of molecular markers. Viruses 12 (5), 541. doi: 10.3390/v12050541
Suttie, A., Deng, Y. M., Greenhill, A. R., Dussart, P., Horwood, P. F., Karlsson, E. A. (2019). Inventory of molecular markers affecting biological characteristics of avian influenza A viruses. Virus Genes 55, 739–768. doi: 10.1007/s11262-019-01700-z
Swayne, D., Suarez, D., Sims, L. (2020). Influenza, in Diseases of poultry. Eds. de Swayne, M. B., Logue, C. M., Nair, MD LR, V, Suarez, D. L., et al (John Wiley & Sons, Inc., Hoboken, NJ).
The Galaxy Community. (2024). The Galaxy platform for accessible, reproducible, and collaborative data analyses: 2024 update, Nucleic Acids Research. Nucleic Acids Res. 52 (W1), W83–W94. doi: 10.1093/nar/gkae410
Urban, L., Holzer, A., Baronas, J. J., Hall, M. B., Braeuninger-Weimer, P., Scherm, M. J., et al. (2021). Freshwater monitoring by nanopore sequencing. Elife 10, e61504. doi: 10.7554/eLife.61504
Uyeki, T. M., Milton, S., Abdul Hamid, C., Reinoso Webb, C., Presley, S. M., Shetty, V., et al. (2024). Highly pathogenic avian influenza A(H5N1) virus infection in a dairy farm worker. N Engl. J. Med. 390, 2028–2029. doi: 10.1056/NEJMc2405371
Volkening, J. (2023). b2b-utils v0.016. Available online at: https://github.com/jvolkening/b2b-utils (Accessed March 1, 2025).
Wang, X., Kim, K. W., Walker, G., Stelzer-Braid, S., Scotch, M., Rawlinson, W. D. (2024). Genome characterization of influenza A and B viruses in New South Wales, Australia, in 2019: A retrospective study using high-throughput whole genome sequencing. Influenza Other Respir. Viruses 18, e13252. doi: 10.1111/irv.13252
Wang, J., Moore, N. E., Deng, Y. M., Eccles, D. A., Hall, R. J. (2015). MinION nanopore sequencing of an influenza genome. Front. Microbiol 6, 766. doi: 10.3389/fmicb.2015.0076610.3389/fmicb.2015.00766
Warburton, P. E., Sebra, R. P. (2023). Long-read DNA sequencing: recent advances and remaining challenges. Annu. Rev. Genomics Hum. Genet. 24, 109–132. doi: 10.1146/annurev-genom-101722-103045
WHO (2023). Fact sheet: influenza (seasonal) (World Health Organization). Available online at: https://www.who.int/news-room/fact-sheets/detail/influenza-(seasonal).
Youk, S., Torchetti, M. K., Lantz, K., Lenoch, J. B., Killian, M. L., Leyson, C., et al. (2023). H5N1 highly pathogenic avian influenza clade 2.3.4.4b in wild and domestic birds: Introductions into the United States and reassortments, December 2021-April 2022. Virology 587, 109860. doi: 10.1016/j.virol.2023.109860
Keywords: next-generation sequencing, NGS, WGS, influenza, nanopore, MinION, flongle
Citation: Goraichuk IV and Suarez DL (2025) Custom barcoded primers for influenza A nanopore sequencing: enhanced performance with reduced preparation time. Front. Cell. Infect. Microbiol. 15:1545032. doi: 10.3389/fcimb.2025.1545032
Received: 13 December 2024; Accepted: 10 March 2025;
Published: 15 April 2025.
Edited by:
Rebecca P. Wilkes, Purdue University, United StatesReviewed by:
Jobin Jose Kattoor, University of Pittsburgh, United StatesKevin Lahmers, Virginia Tech, United States
Copyright © 2025 Goraichuk and Suarez. This is an open-access article distributed under the terms of the Creative Commons Attribution License (CC BY). The use, distribution or reproduction in other forums is permitted, provided the original author(s) and the copyright owner(s) are credited and that the original publication in this journal is cited, in accordance with accepted academic practice. No use, distribution or reproduction is permitted which does not comply with these terms.
*Correspondence: David L. Suarez, ZGF2aWQuc3VhcmV6QHVzZGEuZ292; Iryna V. Goraichuk, aXJ5bmEuZ29yYWljaHVrQHVzZGEuZ292