 Jiaxin Wu1,2Xuan Lu1Ming Huang1Shuyan Wu3
 Maomao Zeng1Zhaojun Liu1Keyang Yu1
 Xiujuan Zhang1
 Xiaoying Sun1
 Xiaoyuan Wang1
 Xiaoqing Hu1*
- 1School of Biotechnology, Jiangnan University, Wuxi, China
- 2School of Modern Engineering and Applied Sciences, Nanjing University, Nanjing, China
- 3AgResearch Ltd., Hopkirk Research Institute, Massey University, Palmerston North, New Zealand
Antimicrobial blue light (aBL) is an effective non-thermal disinfection method against foodborne bacterial pathogens. While aBL-induced oxidative stress is known to cause cell membrane damage, its specific effects on bacterial lipid composition remain poorly understood. This study investigated aBL-triggered lipidomic changes in two major foodborne pathogens (Escherichia coli and Salmonella Typhimurium). We identified more than 70 lipid species across 6 classes, with over 50% showing significant variations in profile, intensity, and degree of unsaturation following aBL exposure. Phosphatidylethanolamine (PE) species exhibited the most pronounced alterations. Notably, both strains demonstrated decreased unsaturated lipid intensity alongside increased malondialdehyde levels—a key oxidative stress marker. These findings provide crucial insights into bacterial lipid dynamics under aBL stress and advance our understanding of the molecular mechanisms behind aBL-mediated bacterial inactivation.
1 Introduction
Antimicrobial blue light (aBL), with in the spectrum of 400–470 nm, has shown effective antimicrobial properties against a variety of pathogens, including Gram-negative bacteria such as Escherichia coli, Salmonella enterica, Acinetobacter baumannii, Stenotrophomonas maltophilia, Pseudomonas aeruginosa, Elizabethkingia meningoseptica and Helicobacter pylori, and Gram-positive bacteria such as Staphylococcus aureus and Enterococcus faecium (Bumah et al., 2015; Dos Anjos et al., 2019; Enwemeka et al., 2008; Halstead et al., 2016; Mussi et al., 2010). The antimicrobial effectiveness of aBL has also led to its application in the preservation of several foods (Josewin et al., 2018; Kim et al., 2017a), including milk (Dos Anjos et al., 2020), eggs, and meat products (Guffey et al., 2016; Kim et al., 2017b; Özyürek et al., 2020). Our previous work showed that 415 nm-aBL inactivated 4 meat-borne pathogens (E. coli, S. enterica, S. aureus and Cronobacter sakazakii) on fresh beef and reduced the bacterial load of S. Enteritidis on eggshell surfaces by 5.19 log CFU/mL (Hu et al., 2021a; Luo et al., 2022).
The bactericidal mechanism of aBL is known to involve endogenous photosensitizing chromophores that, when excited by aBL (Dai et al., 2012), generate substantial reactive oxygen species (ROS) (Dai et al., 2012). These ROS subsequently damage critical intracellular biomolecules including DNA, RNA, and proteins (Kim and Yuk, 2017). Our previous studies (Chu et al., 2019; Wu et al., 2018) demonstrated that aBL exposure causes structural damage to cellular surfaces - particularly the cell wall and membrane - in both methicillin-resistant S. aureus and C. sakazakii, while also significantly reducing unsaturated fatty acids in these strains. Nevertheless, the comprehensive lipidomic alterations in foodborne pathogens under sublethal aBL irradiation remain largely unexplored.
In Gram-negative bacteria, the majority of lipids are embedded within the cell membrane, which were characterized by a diverse array of phospholipids (Zhang and Rock, 2008). The major structural phospholipids, based on their structures (Lin and Weibel, 2016), are mainly classified into phosphatidylethanolamine (PE), phosphatidylglycerol (PG), and cardiolipin (CL). Compared with them, phosphatidylcholine (PC) and phosphatidylinositole (PI) are less prevalent but essential in the lipid synthesis pathway (Sohlenkamp and Geiger, 2016). The lipid profiles in this study were determined by UHPLC-ESI-MS/MS, following methods described previously (Gao et al., 2019; Gidden et al., 2009). Additionally, mass spectrometry methods such as MALDI-TOF/TOF have been applied in lipid analysis for E. coli and B. subtilis, highlighting their utility in lipidomic studies. In this study, we focus on analyzing changes in phospholipids during aBL irradiation, with quantitative lipid analysis conducted using liquid chromatography-mass spectrometry.
Previously, lipidomic studies has been employed to examine lipid alteration in E. coli and Staphylococcus warneri during photodynamic therapy (PDT) based on Tri-Py+-Me-PF (Alves et al., 2013a, Alves et al., 2013b). These studies identified membrane lipids as key molecular targets of PDT. Alves et al. reported that PGs, a dominant lipid in S. warneri, showed an overall increase in the abundance.
Unlike PDT, aBL achieves antibacterial effects without the need for exogeneous photosensitizers. This study aims to investigate the impact of aBL on the lipidome in two clinically relevant pathogens (E. coli and Salmonella Typhimurium) following sublethal aBL treatment. By elucidating how sublethal aBL exposure modifies bacterial lipid profiles, we aim to uncover the relationship between light-induced oxidative stress and bacterial susceptibility. These insights could inform the development of optimized light-based disinfection strategies for enhanced pathogen control in clinical and industrial settings.
2 Materials and methods
2.1 Strains and culture condition
Both E. coli W3110 and S. Typhimurium SL1344 were purchased from ATCC. All of the stains were cultivated at 37°C on Luria-Bertani agar plates containing 10 g/L tryptone 5 g/L yeast extract, 10 g/L NaCl and 15 g/L agar. Subsequently, a single colony was selected and inoculated into 5 mL of LB broth, then incubated at 37°C with shaking at 200 rpm. Cells were harvested once the optical density at 600 nm (OD600) reached the desired level for further investigation.
2.2 Sub-lethal irradiation by aBL
The procedure of aBL irradiation was carried out using a method previously reported (Wu et al., 2018). The aBL irradiation was performed using a 415 nm LED array (Omnilux clear-UTM, Photo Therapeutics, Inc.) with a peak wavelength of 415 nm and a bandwidth of 20 nm. The LED array was positioned at a fixed height to ensure an irradiation intensity of 16.7 mW/cm². The cell suspension with OD600 at 2.0 was prepared for aBL treatment testing. Five mL of cell suspension was transferred to a well of a 6-well clear flat-bottom plate (36 mm diameter, 16.5 mm height) and placed on a magnetic stirrer at 30 rpm with gentle stirring. The bacterial suspensions were illuminated with aBL, and the survival rates were measured (Lipovsky et al., 2009; Wu et al., 2018). Aliquots of 20 µL were taken from the aBL-treated cell suspensions at the irradiation doses of 0, 10, 20, 30, 60, 90, and 120 J/cm2 respectively. Visible cell counts of the aBL-treated bacterial population were measured and the bacterial cell reduction was calculated by comparison with untreated control group. Cells exposed to the sub-lethal aBL doses of 15 J/cm2 and 30 J/cm2 were harvested separately to lipid extraction, as detailed in the procedure below.
2.3 Extraction of lipids
Lipid extraction from S. Typhimurium and E. coli cells following aBL treatment was performed using a modified protocol based on the method of (Folch et al., 1957). Thirty mL of cell suspensions were centrifuged at 4,000 × g for 10 min at 4 °C. The cell pellets were washed thrice with ultrapure water, with each wash followed by 5-min of vibration. After washing, the bacterial cells were subjected to three freeze-thaw cycles by alternately immersing them in liquid nitrogen for 1 min and thawing on ice for 3 min to promote lysis. The lysed cells were resuspended in 6 mL of ultrapure water and gently vortexed for 30 s. For lipid extraction, 900 μL of pre-cooled chloroform/methanol (2:1, v/v) was added to the suspension. The mixture was vortexed for 30 s and centrifuged at 4,000 × g for 10 min at 4 °C. The lower organic phase was carefully collected. A second round of extraction was performed using the same solvent system, and both organic phases were combined. The combined extracts were dried under a gentle stream of nitrogen gas. The resulting lipid residues were reconstituted in a mixture of acetonitrile/isopropanol and chloroform/methanol (1:1, v/v), and stored at –20°C until LC-MS analysis.
2.4 Isolation and quantitative analysis of lipids by liquid chromatography–mass spectrometry
The Lipid extracts were separated using a UHPLC system (Ultimate 3000, Thermo Scientific, Bremen, Germany) coupled to a ThermoFisher Q Exactive™ Plus Hybrid Quadrupole-Orbitrap™ mass spectrometer. Chromatographic separation was performed using two mobile phases: mobile phase A, composed of acetonitrile and water (60:40, v/v) with 10 mM ammonium acetate, and mobile phase B, composed of isopropanol and acetonitrile (90:10, v/v) with 10 mM ammonium acetate. The sample was injected into a Waters CSH C18 column (2.1 mm × 100 mm, 1.7 μm) and separated using a linear gradient, transitioning from 60% mobile phase A to 95% mobile phase B over 20 minutes, followed by re-equilibration to initial conditions. The flow rate was maintained at 0.25 mL/min. The MS analysis was performed in the negative ion mode with an electrospray voltage of 2.8 kV, a capillary temperature of 350°C, and a sheath gas flow rate of 35 units. MS and MS/MS data acquisition were acquired over an m/z range of 80-1200 (Schwalbe-Herrmann et al., 2010).
2.5 Lipid identification and data analysis
Lipid species were identified using LipidSearch software based on retention time, accurate mass, and MS/MS spectra. Specific ion forms were used for lipid identification, including [M-2H]2- for CL and [M-H]- for PE, PG, and PS. MS/MS spectra further characterized lipids, particularly for those containing two fatty acid chains. For example, PE(17:0-18:0) was identified by characteristic m/z signals corresponding to its head group and fatty acid carboxylate ions. Normalized data sets were analyzed using MetaboAnalyst 5.0. Partial least squares discriminant analysis (PLS-DA) revealed clear clustering between aBL-treated and control groups, differentiating lipidomic profiles under varying aBL irradiation conditions. All experiments were conducted in triplicate, and results were expressed as mean ± standard deviation (SD). Statistical analyses were performed using Origin with one-way analysis of variance (ANOVA), followed by appropriate post hoc testing to evaluate differences between treatment groups. A p-value less than 0.05 was considered statistically significant. In Figures 1 and 5, lowercase letters above the bars indicate statistically significant differences between specific time points:
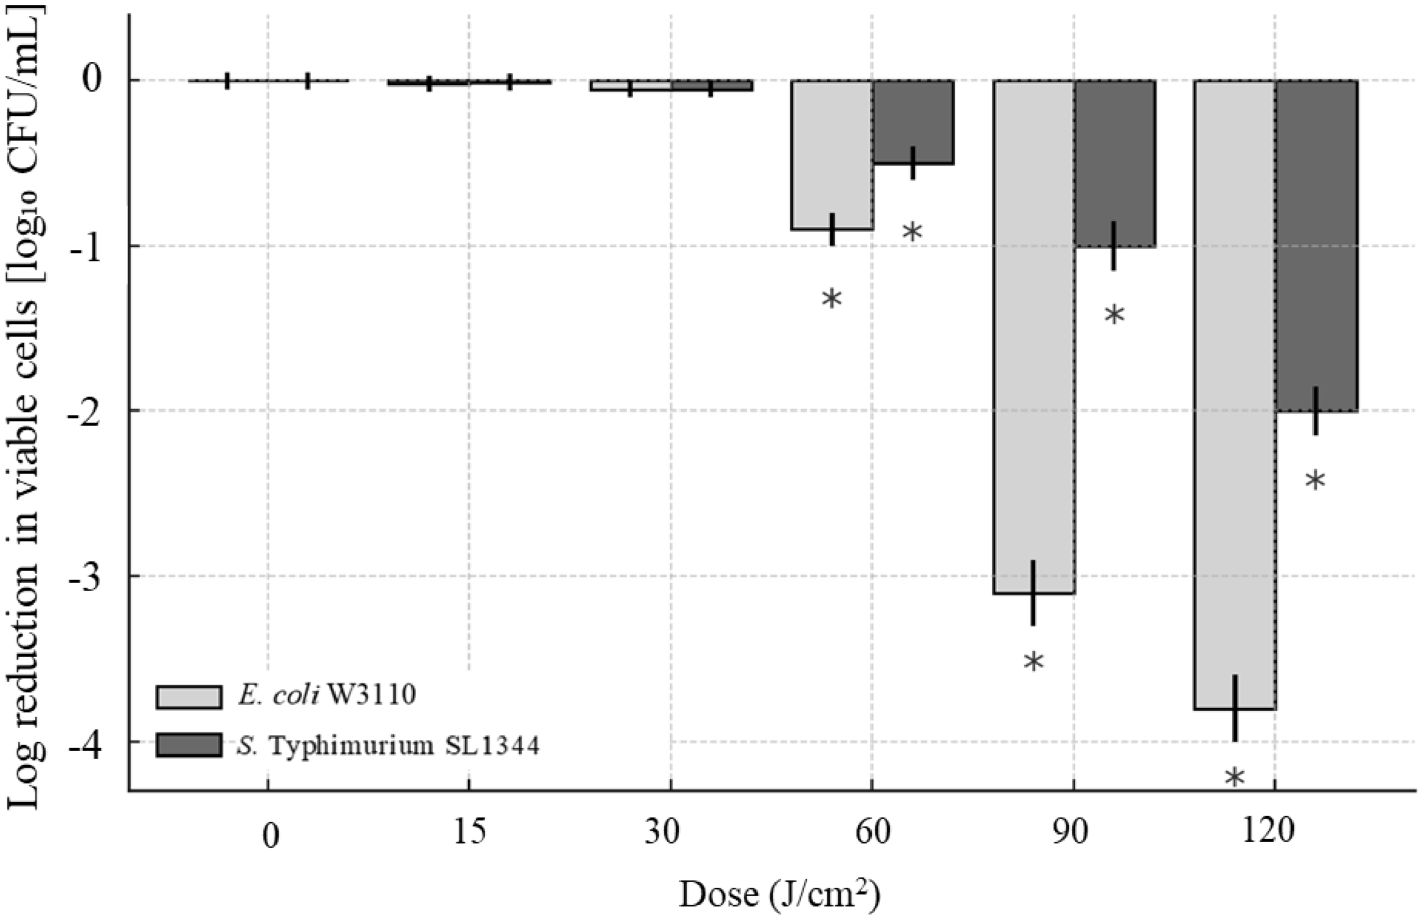
Figure 1. Intensity of lipids changes under different aBL irradiation doses in E. coli W3110 (A) Overall lipid intensity variation under 0, 15, and 30 J/cm² aBL. There existed significant differences between different samples (p < 0.05). “a” meant significant differences between samples under 0 and 15 J/cm², “b” meant that under 0 and 30 J/cm², and “c” meant that under 15 and 30 J/cm²; (B, C) Representative lipids exhibiting discontinuous changes in the intensity under different aBL doses.
● “a” indicates a significant difference between 15 min and 0 min (p < 0.05);
● “b” indicates a significant difference between 30 min and 0 min (p < 0.05);
● “c” indicates a significant difference between 30 min and 15 min (p < 0.05).
● These annotations help to highlight the temporal progression of the observed effects.
2.6 Quantification of lipid peroxidation
The procedure of malondialdehyde (MDA) exact and analysis was identical to that previously reported by our group (Wu et al., 2018). The absorbance of the supernatant at 532 nm was measured and MDA content was calculated using a standard curve. The detailed procedure followed the manufacturer’s protocol (Kit #S0103, Beyotime, China). The intracellular ROS was detected based on our previous report (Wu et al., 2018).
2.7 Determination of the outer membrane permeability and potassium leakage
OM permeability was assessed using the N-phenyl-α-naphthylamine (NPN) uptake method (Qiao et al., 2021). Following aBL irradiation at different doses (0, 15, and 30 J/cm2), the cells were resuspended in 1.92 mL of phosphate buffer solution (OD600 = 0.5). Subsequently, 80 μL of NPN solution (1 mM) was added to the cell suspension, and the fluorescence intensity was immediately measured using a spectrofluorometer (Hitachi, Tokyo, Japan). The excitation wavelength was set at 350/10 nm, and the emission wavelength was set at 420/10 nm. Potassium leakage was determined by measuring extracellular K+ concentration in the supernatant using a flame photometer after centrifugation at 12,000 × g for 5 min (Wu et al., 2018).
3 Results and discussions
3.1 Bacterial inactivation of E. coli and S. Typhimurium upon aBL
The aBL exhibited efficient bactericidal effect against E. coli W3110 and S. Typhimurium SL1344, while two strains exhibited differential sensitivity to aBL in a dose-dependent manner. As shown in Figure 2, when aBL dose exceeded 30 J/cm2, the population of E. coli W3110 began to decrease, and when irradiation was extended to 120 J/cm2, it was further reduced by 3.76 log CFU/mL. Previous studies have shown that aBL at various wavelengths produced similar bactericidal effects against E. coli isolates. For examples, 410-nm aBL irradiation at 412.50 J/cm2 dose killed E. coli ST10 beyond 3.7 logCFU and E. coli ST648 at 2.8 logCFU, respectively (Dos Anjos et al., 2019). Furthermore, E. coli ST131 and O127:H7 became non-culturable following aBL exposure (Dos Anjos et al., 2019). Another study reported that 455-nm aBL illumination at 120 J/cm2 reduced 1.5-2.5 log CFU/mL of E. coli DH5α and 1 log CFU/mL of E. coli MG1655 (Abana et al., 2017). In the present study, 415-nm aBL illumination at 120 J/cm2 achieved comparable inactivation efficiency. These variations of bactericidal efficiency of aBL were likely due to differences in strain-specific sensitivity, initial bacterial concentration, culture conditions, and light exposure parameters such as wavelength and irradiance uniformity. In our previous report on S. Typhimurium SL1344 (Hu et al., 2021a), even a single mutation of lipopolysaccharide located at OM significantly changed its photosensitivity, thus for these E. coli strains mentioned above, substantial differences in genetic background and OM properties plausibly account for the observed discrepancies across studies.
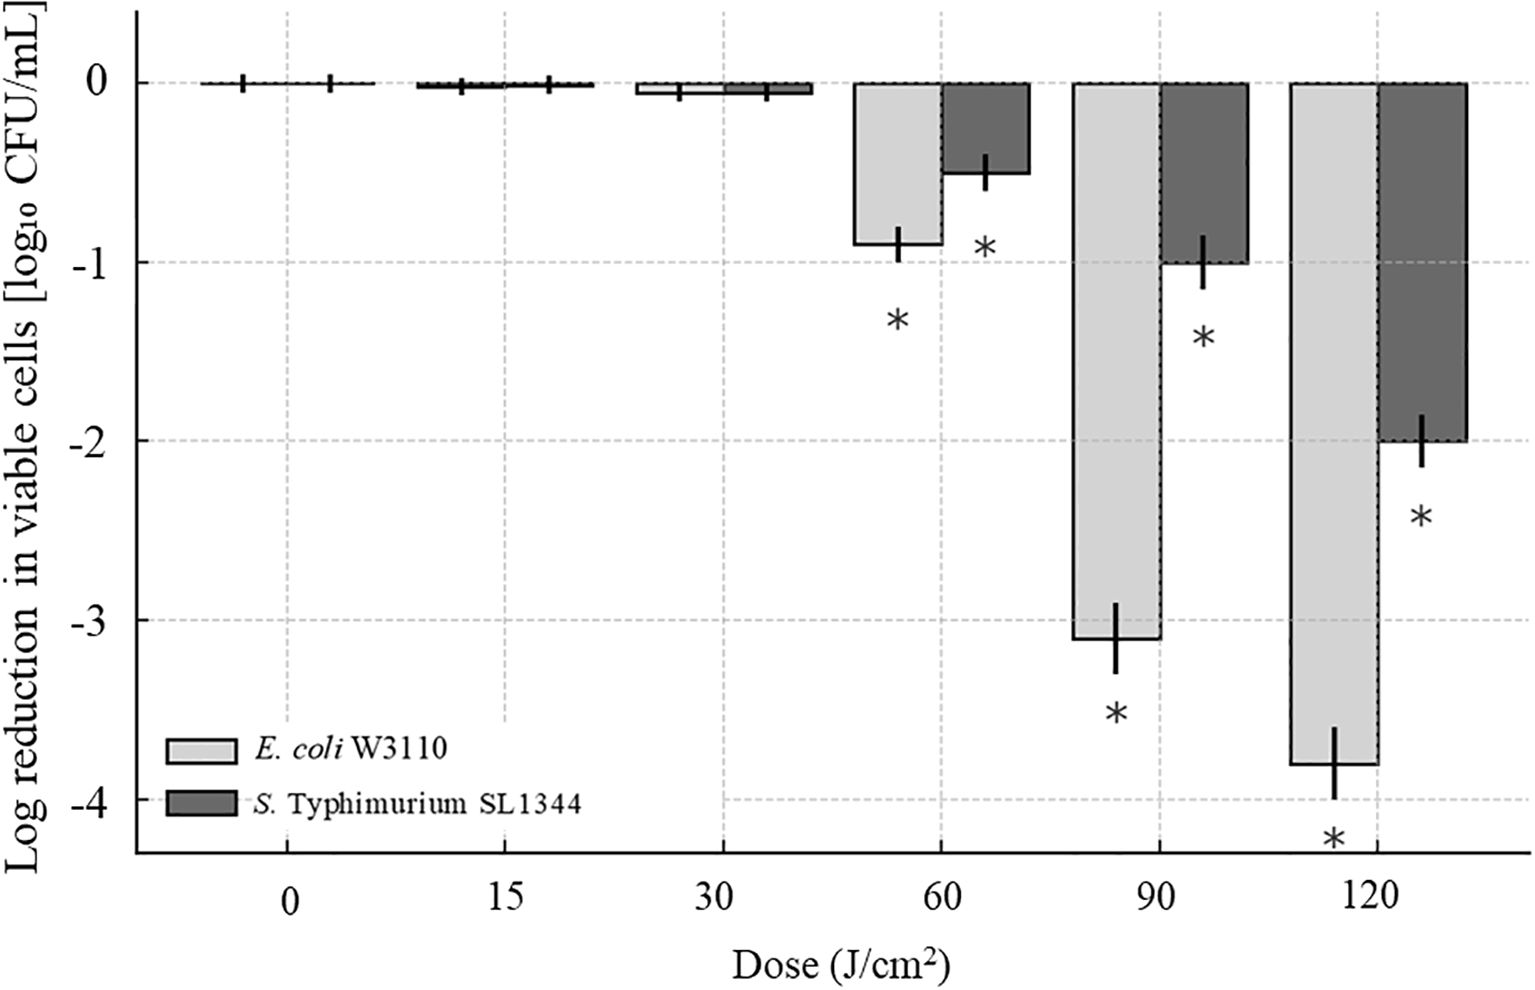
Figure 2. Inactivation of BL against E. coli W3110 and S. Typhimurium SL1344. Bacterial cultures were exposed to increasing doses of aBL (0–120 J/cm²). The reduction in viable cells was quantified by plating serial dilutions and calculating the log10 reduction in colony-forming units (CFU/mL). Data were shown as mean ± SD from three independent experiments. Statistical significance was evaluated using two-way ANOVA, and representative trends were displayed without individual p-value markers for clarity.
The inactivation of S. Typhimurium SL1344 was observed when aBL dose exceeded 60 J/cm2 (Figure 2). Viable cell counts decreased by 1.03 log CFU/mL after 90 J/cm2 and by 2.02 after 120 J/cm2. In contrast, our previous study reported 383 J/cm2 aBL inactivated SL1344 by 4 log CFU/mL (Hu et al., 2021a). Similarly, other studies reported that 405 nm aBL reduced S. enterica serovar Enteritidis by 1.4 log CFU/mL after 739.6 J/cm² exposure (Endarko et al., 2012), and reduced S. Enteritidis and S. Saintpaul by 2.0 log CFU/mL and 1.0 log CFU/mL, respectively, after 288 J/cm2 treatment (Kim and Yuk, 2017).
In summary, our study demonstrated the bactericidal efficacy of 415-nm aBL against both E. coli and S. Typhimurium, while revealing species-specific susceptibility to aBL treatment. At the maximum aBL dose at 120 J/cm², viable cell counts decreased by 3.76 log CFU/mL for E. coli W3110 and 2.02 log CFU/mL for S. Typhimurium SL1344. Notably, aBL could be generated using simple LED-based devices without requiring exogenous photosensitizers, and exert bactericidal effect against a broad spectrum of foodborne pathogens. These findings supported aBL as a promising non-thermal disinfection strategy for foodborne pathogens.
3.2 Influence of aBL on lipidomics of E. coli
3.2.1 Lipid identification and profiling
The UHPLC system, equipped with a C18 column, effectively separated lipids from pooled lipid extracts of E. coli W3110 cells treated with 0, 15, and 30 J/cm2 aBL doses, and the PLS-DA was analysis was showed in Supplementary Figure S1. In the untreated E. coli cells (the control group), 70 lipid species belonging to 5 lipid classes were identified, including 30 PE, 22 PG, 6 CL, 4 LPE, and 14 PS species. MS chromatograms of these lipids were demonstrated in Supplementary Figure S2 and Supplementary Figure S3, and all lipids information were listed in Supplementary Table S1. These lipids comprised of 55 unsaturated lipids and 15 saturated lipids, with the detailed information summarized in Supplementary Table S2. In the group treated with 15 J/cm² aBL, a total of 71 lipid species were detected. Compared to the control group, four lipid species were absent, including two PSs [PS(16:0-8:0), PS(16:0-19:2)] and two PEs [PE(16:1-14:1), PE(17:1-12:0)]. Five lipids were uniquely detected in the treated group, including three PSs [PS(16:0-17:1), PS(16:1-17:2), PS(17:1-17:2)], PG(18:1-18:1), and CL(18:1/16:1/16:0/18:1) (Figure 3A). In the treated cell group irradiated by 30 J/cm2, 73 lipid species were detected (Figure 3A). This light dose induced the emergence of 3 PSs [PS(16:0-19:2), PS(19:2-14:1), PS(18:1-19:2)], while CL(18:1/16:1/16:0/18:1) became undetectable, these changes were not observed in the control group. The number of PEs and PGs remained consistent at 28 and 22, respectively.
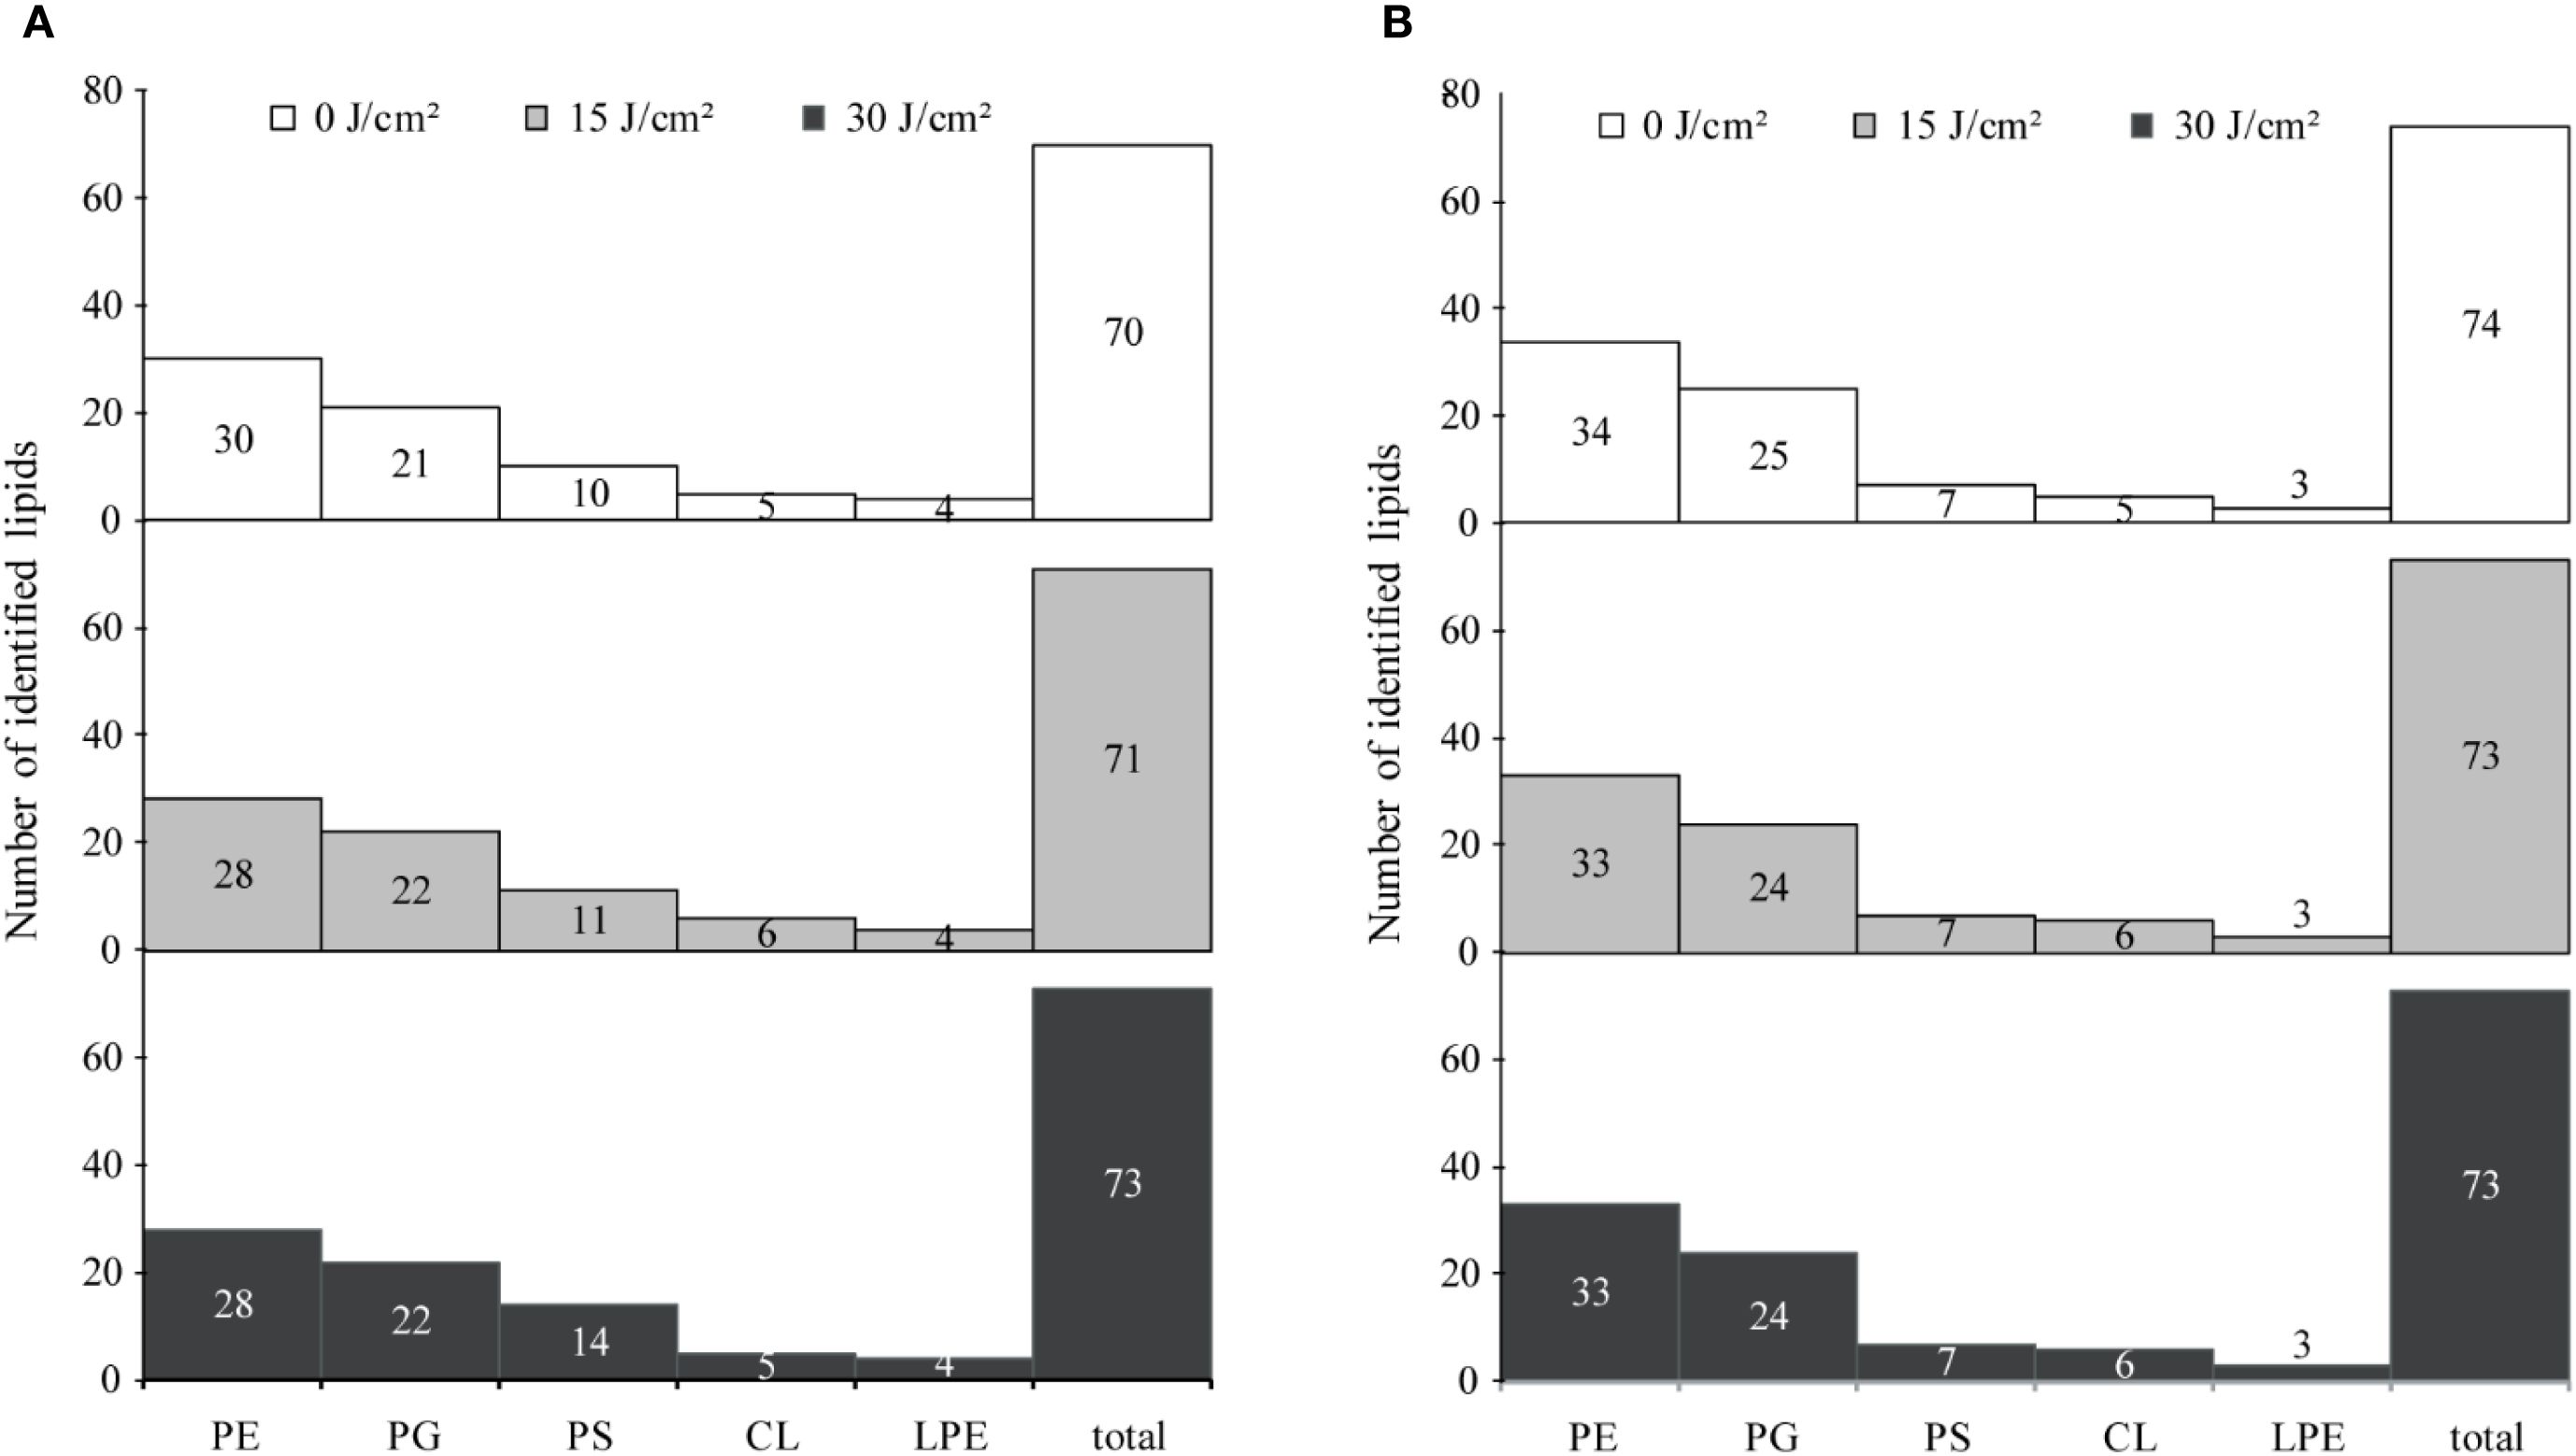
Figure 3. Distribution and number of identified lipid species under different doses of antimicrobial blue light (aBL). (A) E. coli W3110; (B) S. Typhimurium SL1344. The total number of identified lipid species and the distribution of lipid variations were assessed in each strain after treatment with 0, 15, or 30 J/cm2 aBL. Changes reflect differences in membrane lipid composition induced by sublethal aBL exposure.
In E. coli, cell membrane lipids, including both the outer and inner membrane, constitute approximately 95% of total lipids (Silhavy et al., 2010). The biosynthesis of these lipids follows conserved pathways shared between eukaryotes and prokaryotes. For instance, PA, synthesized from glycerol-3-P, serves as precursor of various lipid forms. Through conversion to CDP-DAG, PA gives rise to both the zwitterionic lipid PE and the anionic lipids PG and CL (Dowhan, 2013). Notably, LPE can be produced either during PE synthesis or through the breakdown of bacterial membranes (D’Arrigo and Servi, 2010).
Considering the well-established influence of lipid composition on membrane integrity and aBL sensitivity (Chu et al., 2019; Hu et al., 2021a, Hu et al., 2021b), significant diversity and dynamic changes in global lipids under aBL irradiation were discovered in the subsequent sections.
3.2.2 Variations in lipid intensity during aBL irradiation
Although only minor changes in lipid species composition were observed following aBL exposure, significant shifts in lipid intensity occurred throughout the irradiation process. These changes in the abundance of lipids are summarized in Tables 1 and 2.
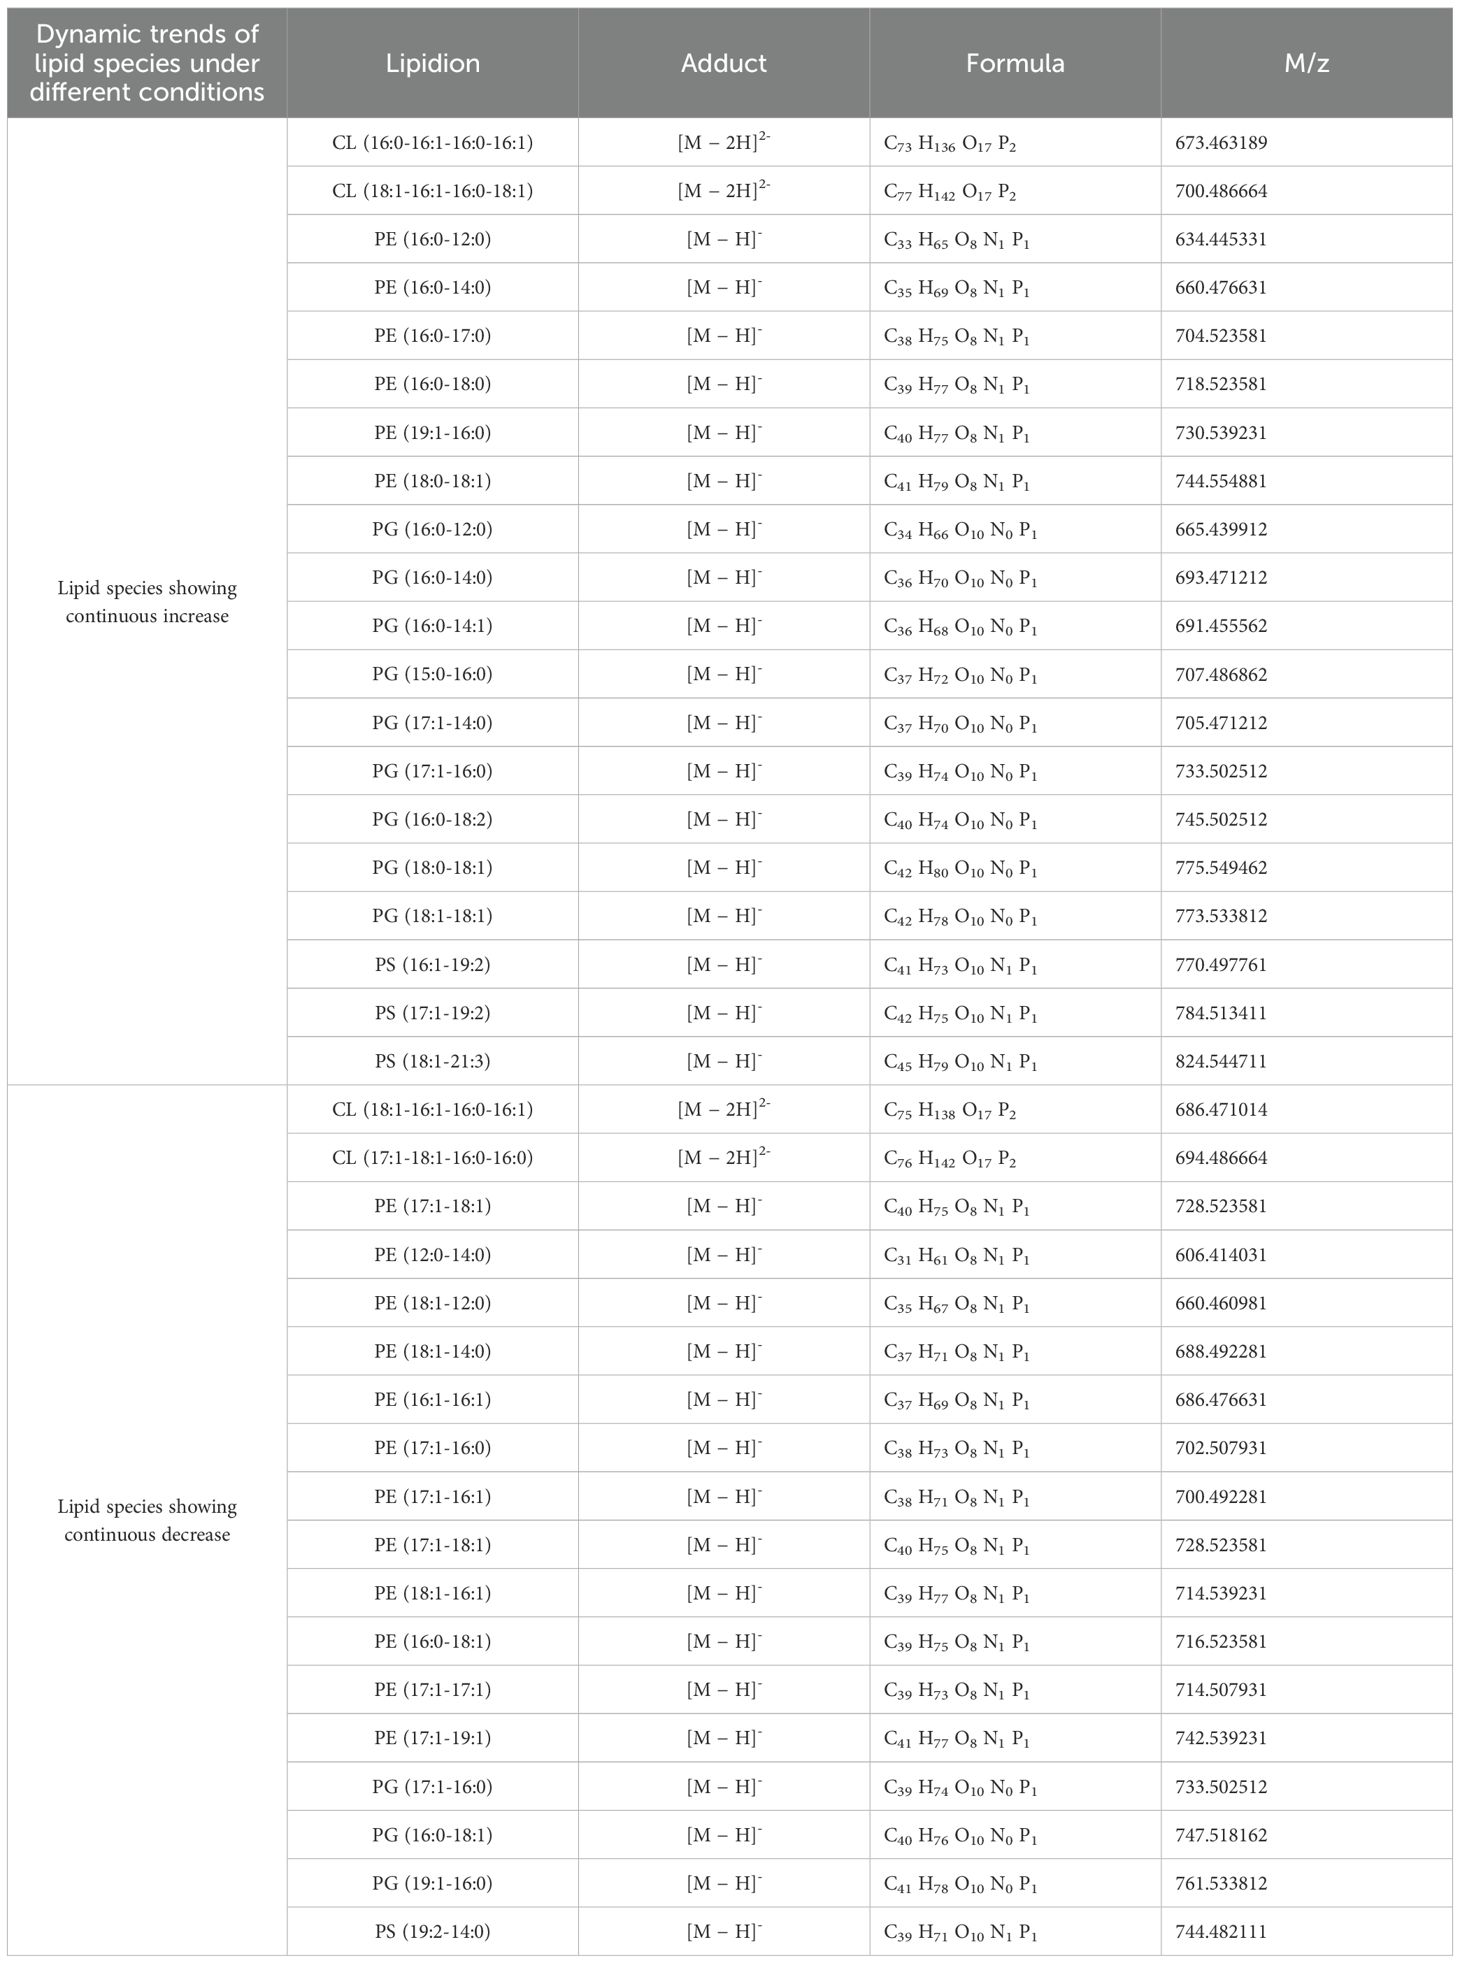
Table 1. The continuous changes in specific lipid species of E. coli W3110 during aBL treatment.
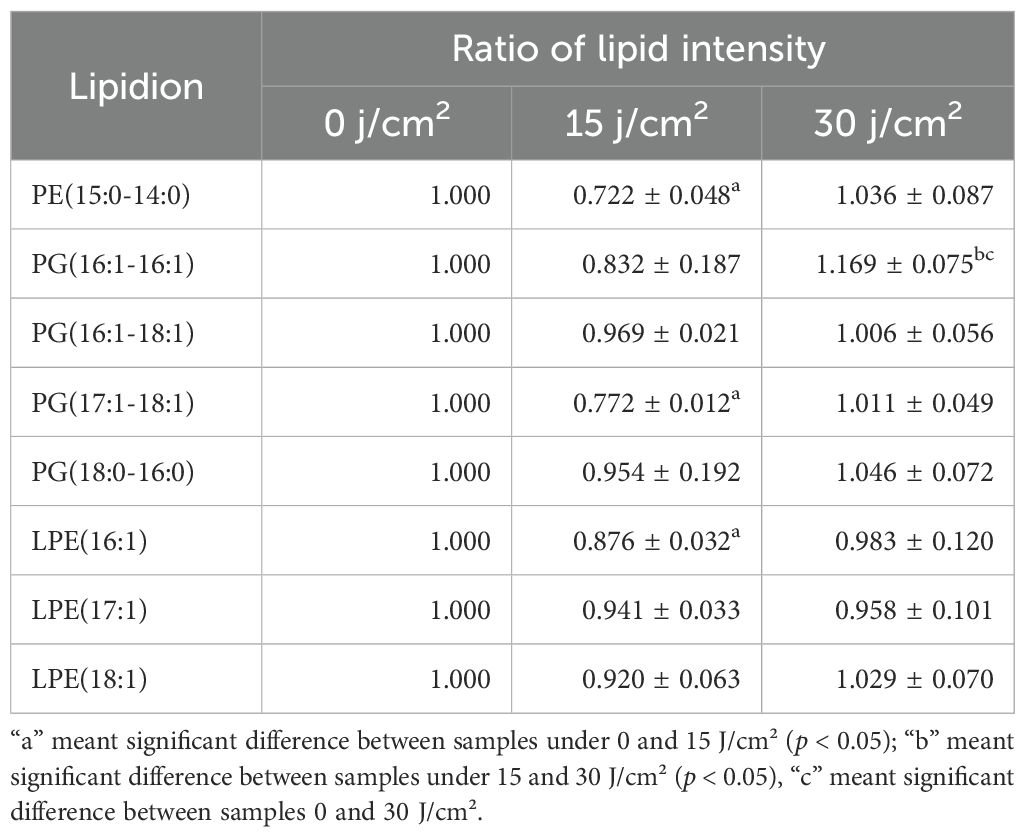
Table 2A. Two distinct patterns of specific lipid species in E. coli W3110 upon aBL treatment: (A) initial decrease followed by increase, and (B) initial increase followed by decrease.
First, over half of the total lipid species exhibited consistent changes of intensity (Table 1). Unless otherwise specified, the terms “increase” or “decrease” referred to changes relative to the immediately preceding sample, for example, samples under 15 J vs. 0 J, and 30 J vs. 15 J. During aBL irradiation, firstly, 20 lipid species showed continuous increase in the intensity, including 6 PEs, 9 PGs, and 3 PSs. Especially, CL(18:1-16:1-16:0-18:1) and PG(18:1-18:1) showed significant increase; PE(16:0-18:0) and PG(17:1-16:0) displayed a 2-fold rise (Figure 1A). The majority of these 20 lipid species were unsaturated, with 6 mono-unsaturated species and 7 poly-unsaturated species. Secondly, 18 lipid species showed a continuous decrease in intensity, including 12 PEs, 3 PGs, and 1 PS. Except PE(12:0-14:0), the remaining 17 lipids were unsaturated, including 7 monounsaturated species and 10 polyunsaturated species. Notably, PE(16:0-18:1), PG(16:0-18:1), and PE(17:1-17:1) showed the greatest reductions beyond 96.0% (Figure 1A). Unsaturated fatty acyl chains are known to be susceptible to ROS-induced peroxidation (Yang and Stockwell, 2016). Upon aBL treatment, lipid peroxidation preferentially targets these unsaturated chains, leading to a significant decrease in their abundance. Similar patterns were observed in the photodynamic inactivation studies reported previously, where PE and PG species containing unsaturated chains were preferentially oxidized (Alves et al., 2013a; Chu et al., 2019). Notably, the lipids across all three biological replicates (Supplementary Table S1) showed the similar change trends. For most lipid species showing significant upregulation or downregulation, the direction of change remained consistent, and the variation across replicates was minimal (coefficient of variation < 15%). Statistical analysis indicated significant differences between irradiated sample and the previous one (Tables 1, 2).
Besides, other lipids did not show a continuous increase or decrease trend. On the one hand, as shown in Tables 2A and 2B, there existed 8 lipid species initially decreased in the intensity at 15 J/cm² but subsequently increased at 30 J/cm², which was particularly evident in PE(15:0-14:0) and PG(16:1-16:1). On the other hand, there were other 11 lipid species initially increased while late declined in the level. The most significant example was PE(15:0-16:0), which exhibited the doubled level at 15 J/cm2 irradiation while 16.7% lower level after 30 J/cm2 of aBL irradiation. Similar trends were also observed for PE(18:1-18:1), PE(19:1-18:1), and PS(16:0-19:2) (Figure 1C). The change of these lipid species mentioned above reflected the high variability of global lipids, a major contributor to cell surface damage during aBL illumination. PE lipids exhibited the most pronounced alterations among all classes. This could be attributed to the high abundance of PE in bacterial membranes and its structural propensity to form non-lamellar phases, making it more reactive and susceptible to peroxidative damage under ROS stress (Mileykovskaya and Dowhan, 2009). The reduction of specific PE species may reflect both oxidative lipid damage and active membrane turnover during stress response. Additionally, CL(16:1-16:1-16:0-16:1) became undetectable at 30 J/cm2 (Figure 1A). These variations likely reflect cell membrane damage, suggesting further investigation into MDA accumulation and OM permeability. Another possible mechanism for lipid alteration may involve cells responding to oxidative stress. Although this response ultimately failed to avert cell membrane rupture and cell death, such changes were manifested by lipids alteration under sub-lethal-dose aBL irradiation. At present, the latter possibility remains speculative and requires experimental evidence such as transcriptomics and RT-PCR in future studies. Collectively, the data indicate aBL-induced oxidative stress selectively alters membrane lipid composition, particularly targeting unsaturated phospholipids such as PE and PG. These changes may compromise membrane function, providing a plausible explanation for increased OM permeability and eventual bacterial inactivation.
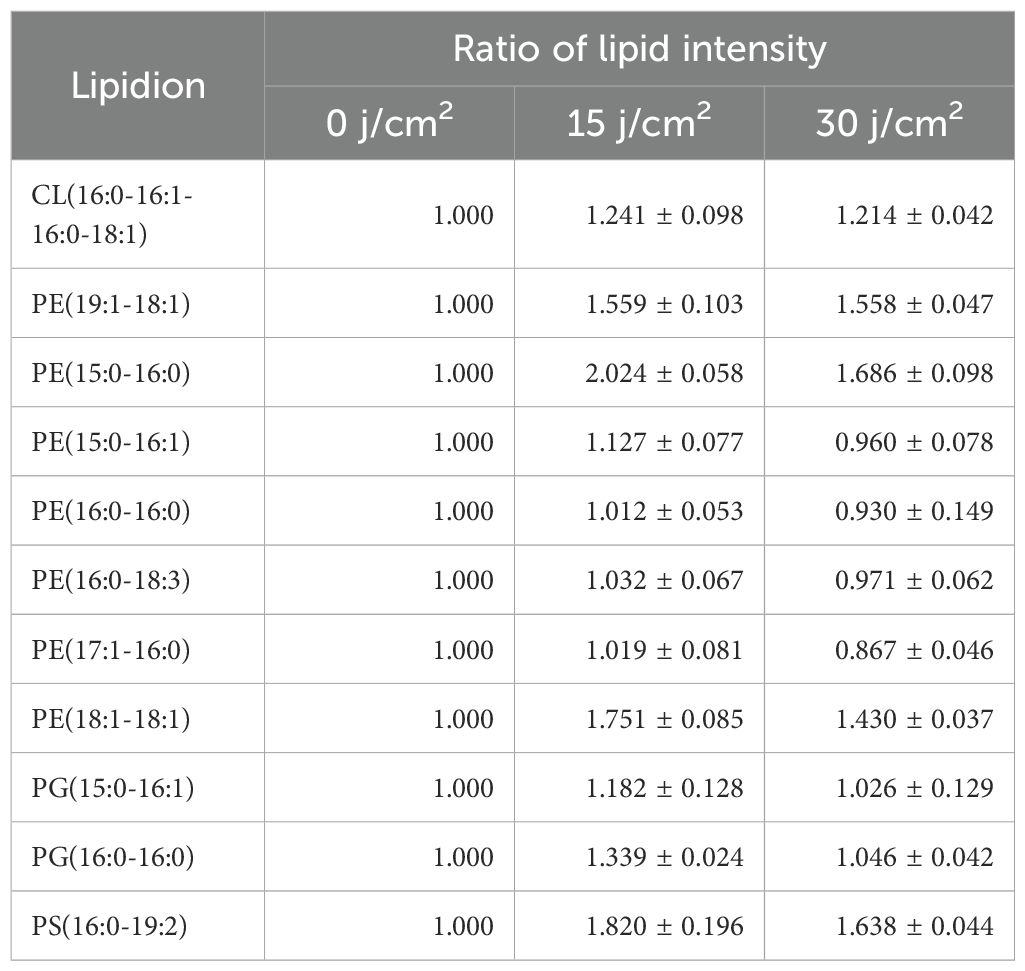
Table 2B.
3.2.3 Changes of intracellular MDA, OM permeability and potassium leakage
MDA was widely recognized as a marker of oxidative stress. Figure 4A illustrated a progressive increase in MDA levels in cells subjected to aBL irradiation. With 15 J/cm² irradiation, the MDA content increased 2.85-fold, rising from 3.30 ± 0.56 µM/OD600 to 9.44 ± 1.66 µM/OD600 (p < 0.001). This increase was closely correlated with increase of ROS (Supplementary Figure S4), similar to our previous report (Wu et al., 2018). At aBL dose of 30 J/cm2, MDA level further increased to 22.64 ± 3.28 µM/OD600 (p < 0.001). OM permeability increased by approximately 65.20% and 130.40% at 15 and 30 J/cm², respectively, compared to the untreated control (Figure 4A). Besides, the extracellular potassium level also rose from 0.82 × 10⁵ ppm at 0 J/cm² to 1.53 × 10⁵ ppm at 15 J/cm², and further increased to 2.03 × 10⁵ ppm at 30 J/cm² (p < 0.05). The steady increase indicated substantial leakage of cytoplasmic potassium, supporting the reduction of OM compactness.
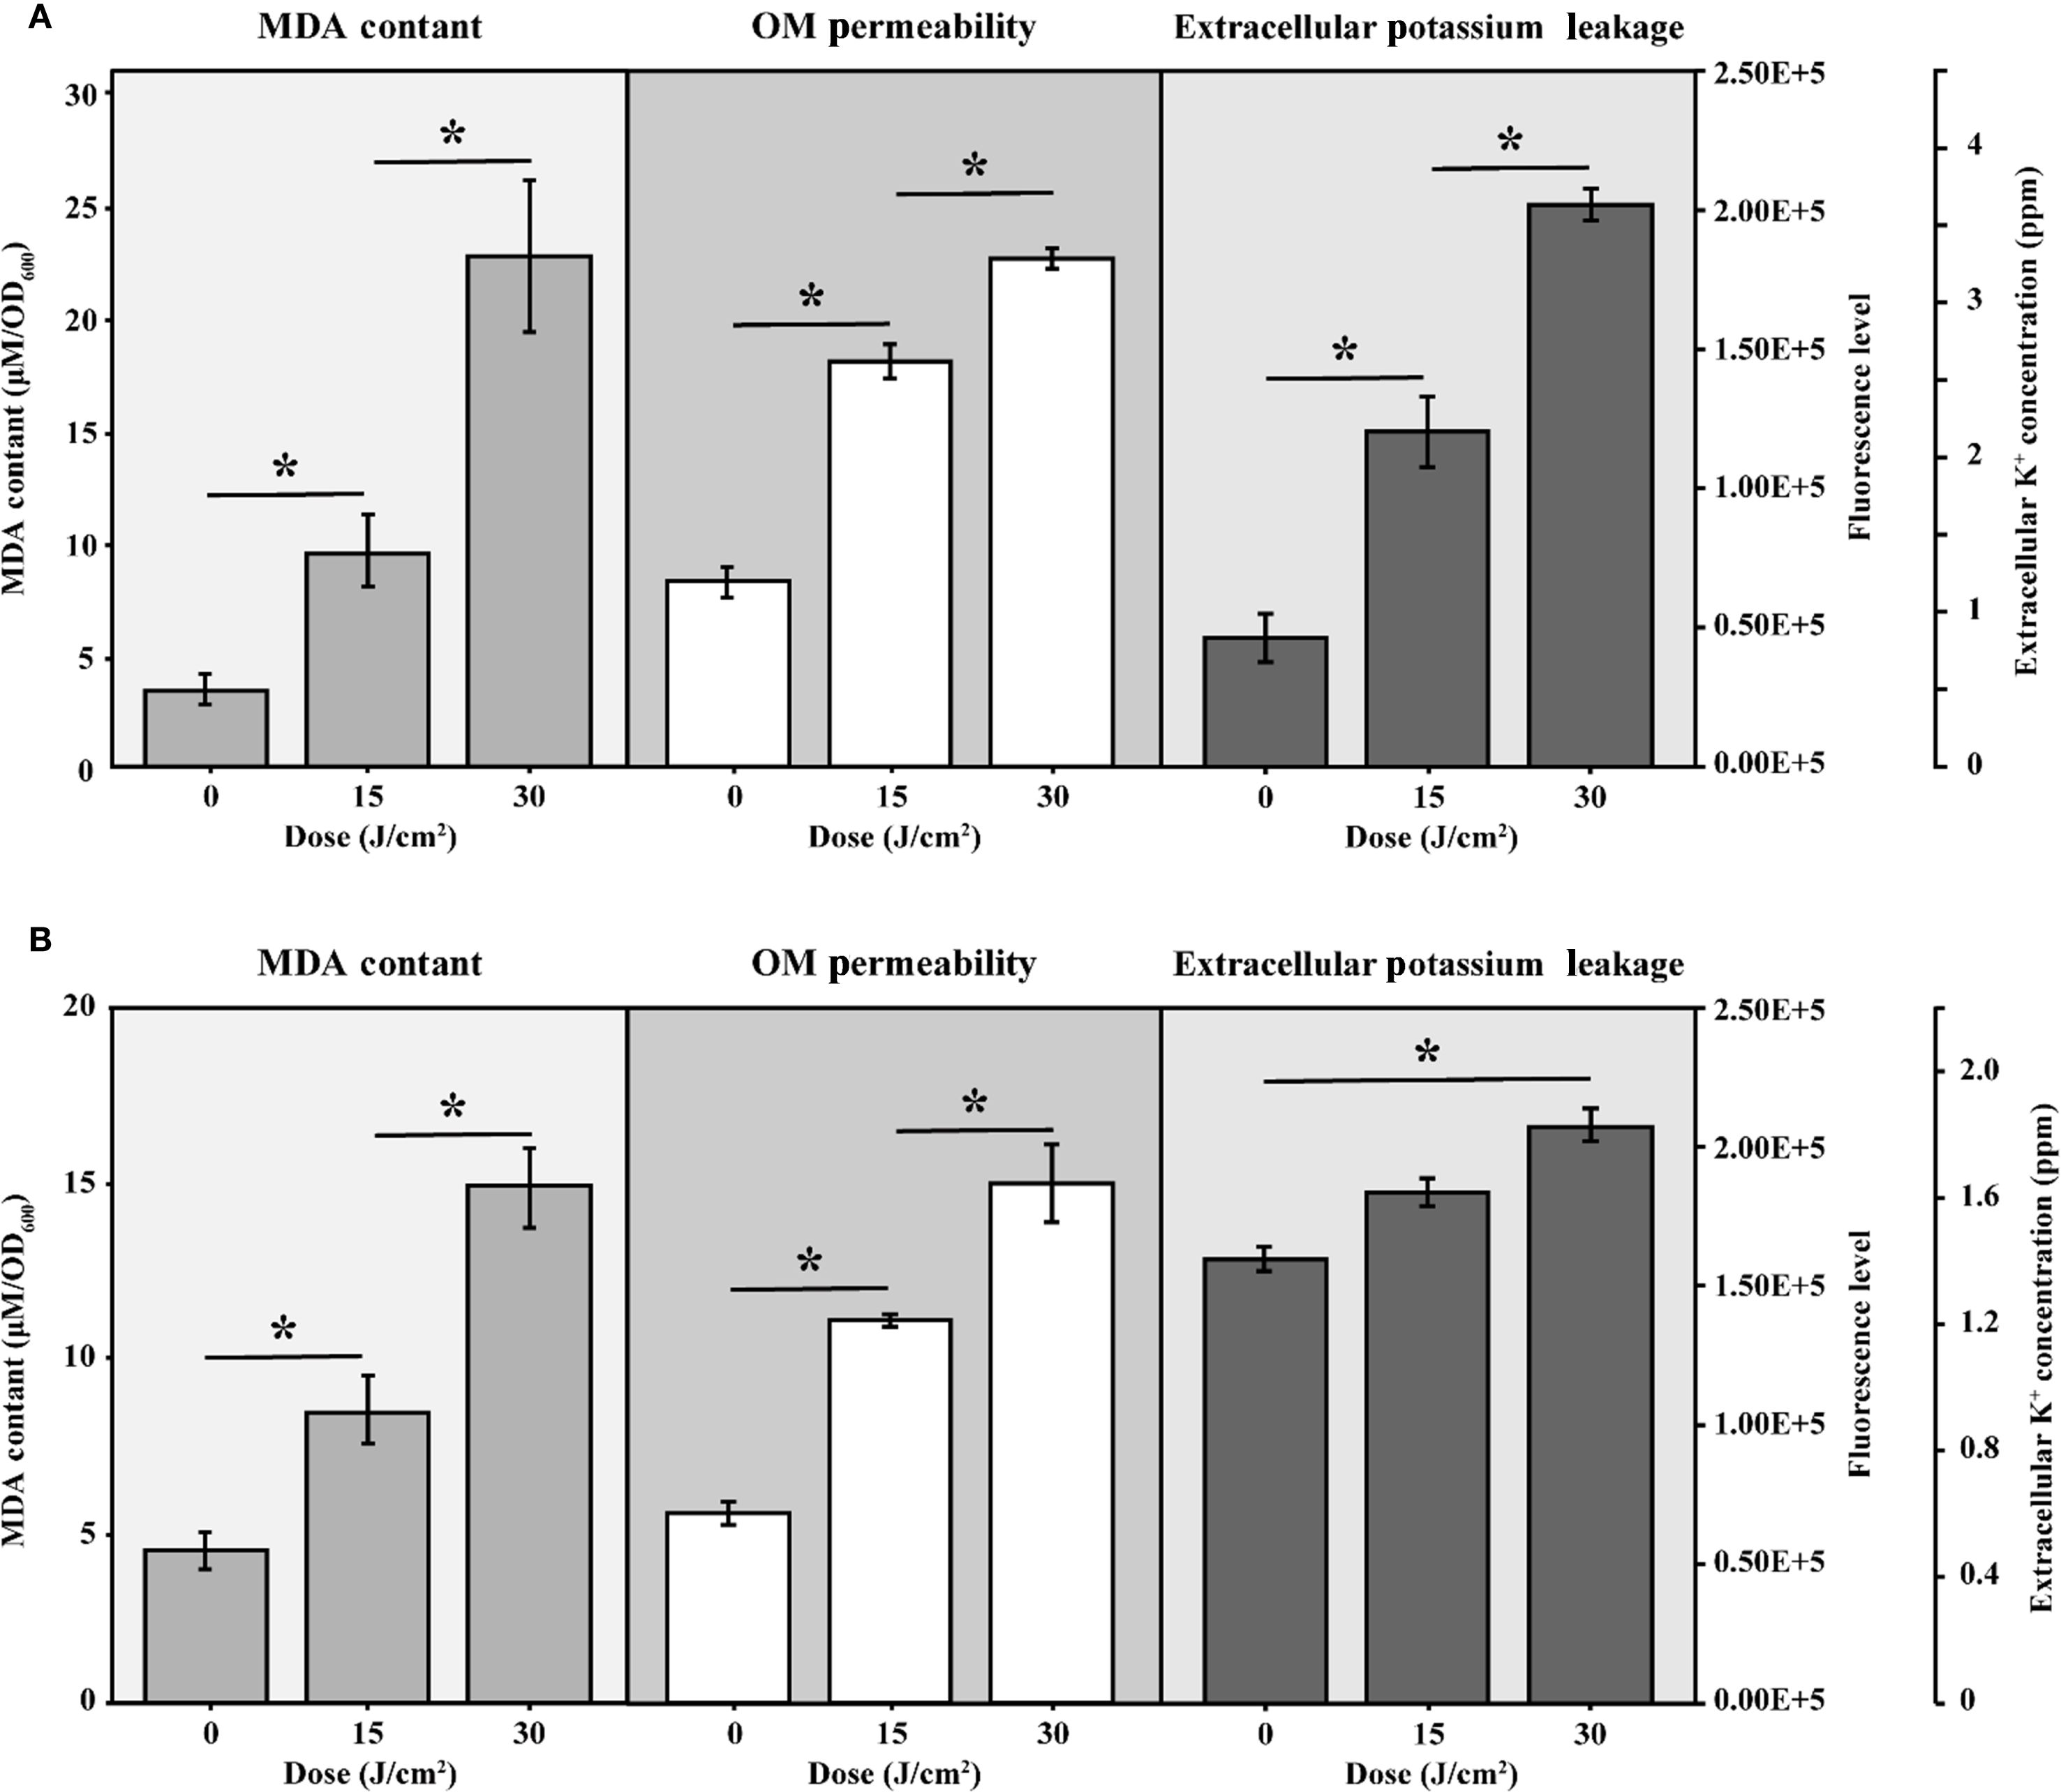
Figure 4. The intracellular MDA levels, OM permeability and extracellular potassium leakage of (A) E coli W3110 and (B) S. Typhimurium SL1344 during aBL irradiation. Intracellular MDA levels were measured as markers of lipid peroxidation, OM permeability was assessed using NPN uptake assays, and extracellular potassium leakage was measured by a flame photometer. Data represent the mean ± SD of three biological replicates, with significance set at p < 0.05.
The progressive rise in MDA levels indicates enhanced lipid peroxidation within E. coli. These lipid disturbances most likely contribute to membrane damage and eventual bacterial inactivation as evidenced by the increased OM permeability, as determined by the NPN uptake assay, following aBL irradiation. The following section provides a detailed discussion of the alterations in unsaturated lipids.
3.2.4 The impact of aBL on changes of unsaturated lipids
During aBL irradiation process, the unsaturated lipids exhibited significantly variability (Table 1). Lipids showing a stable increase mainly contained saturated fatty acid chains such as 16:0, 18:0, and 18:1, whereas those displaying a decrease were primarily composed of unsaturated chains such as 16:1, 17:1, and 18:1. Notably, unsaturated PE class became dominant. Among the various lipid classes, PE and PG exhibited the most significant changes under aBL irradiation. Among the 12 PE species that gradually declined, only PE(12:0-14:0) was saturated, while 4 species were mono-unsaturated, and 7 species were poly-unsaturated. Previous studies on PDT revealed that PE molecules with C16:1, C18:1, and C18:2 fatty acyl chains were particularly susceptible to ROS induced by photosensitizers (Alves et al., 2013b). In this study, PE, characterized by a high concentration of unsaturated double bonds, appeared more vulnerable to oxidative stress from aBL irradiation.
A similar result was also obtained for PG. All PG species showing decreasing trends were unsaturated, including PG(17:1-16:0), PG(16:0-18:1), and PG(19:1-16:0). The decline in unsaturated lipids, particularly PE and PG, was closely related to oxidative stress during aBL illumination, as demonstrated in various microbes in previous studies (Chu et al., 2019; Hu et al., 2021a; Wu et al., 2018).
Changes in the abundance of unsaturated lipids were also detected. As shown in Figure 5A, the intensity of total saturated lipids increased after 15 J/cm2 and maintained stably when the irradiation was extended to 30 J/cm2. Notably, no saturated CL was detected during aBL treatment. Conversely, the intensity of unsaturated lipids decreased along with aBL irradiation. Unsaturated PE decreased by 12% and 24% at 15 and 30 J/cm2, respectively. However, unsaturated PG initially declined but later increased, and unsaturated CL showed an upward increase. CL was worth researching since it has been reported to induce apoptosis in prokaryotic cells (Mileykovskaya and Dowhan, 2009). It was postulated that CL play a critical role in aBL-induced bacterial death. Besides, the ratio of saturated to unsaturated lipids (SLs/ULs) was used to assess the degree of unsaturation in membrane lipids, with a higher SLs/ULs ratio indicating a reduced proportion of unsaturated membrane lipids. The shift from unsaturated to saturated lipid species, particularly in PE and PG, indicating fluctuations of membrane lipids. Lipids in biological membranes are thought to be functionally organized, attributed to their chemical diversity and the stoichiometry, i. e. their lipid composition (Melero and Jimenez-Rojo, 2023; Melero and Jimenez-Rojo, 2023). From a perspective of lipidomics, the study is the first to reveal changes in lipids profile and their intensity following aBL treatment, which critically contribute to cell membrane dysfunction, such as but not limited to the increased OM permeability.
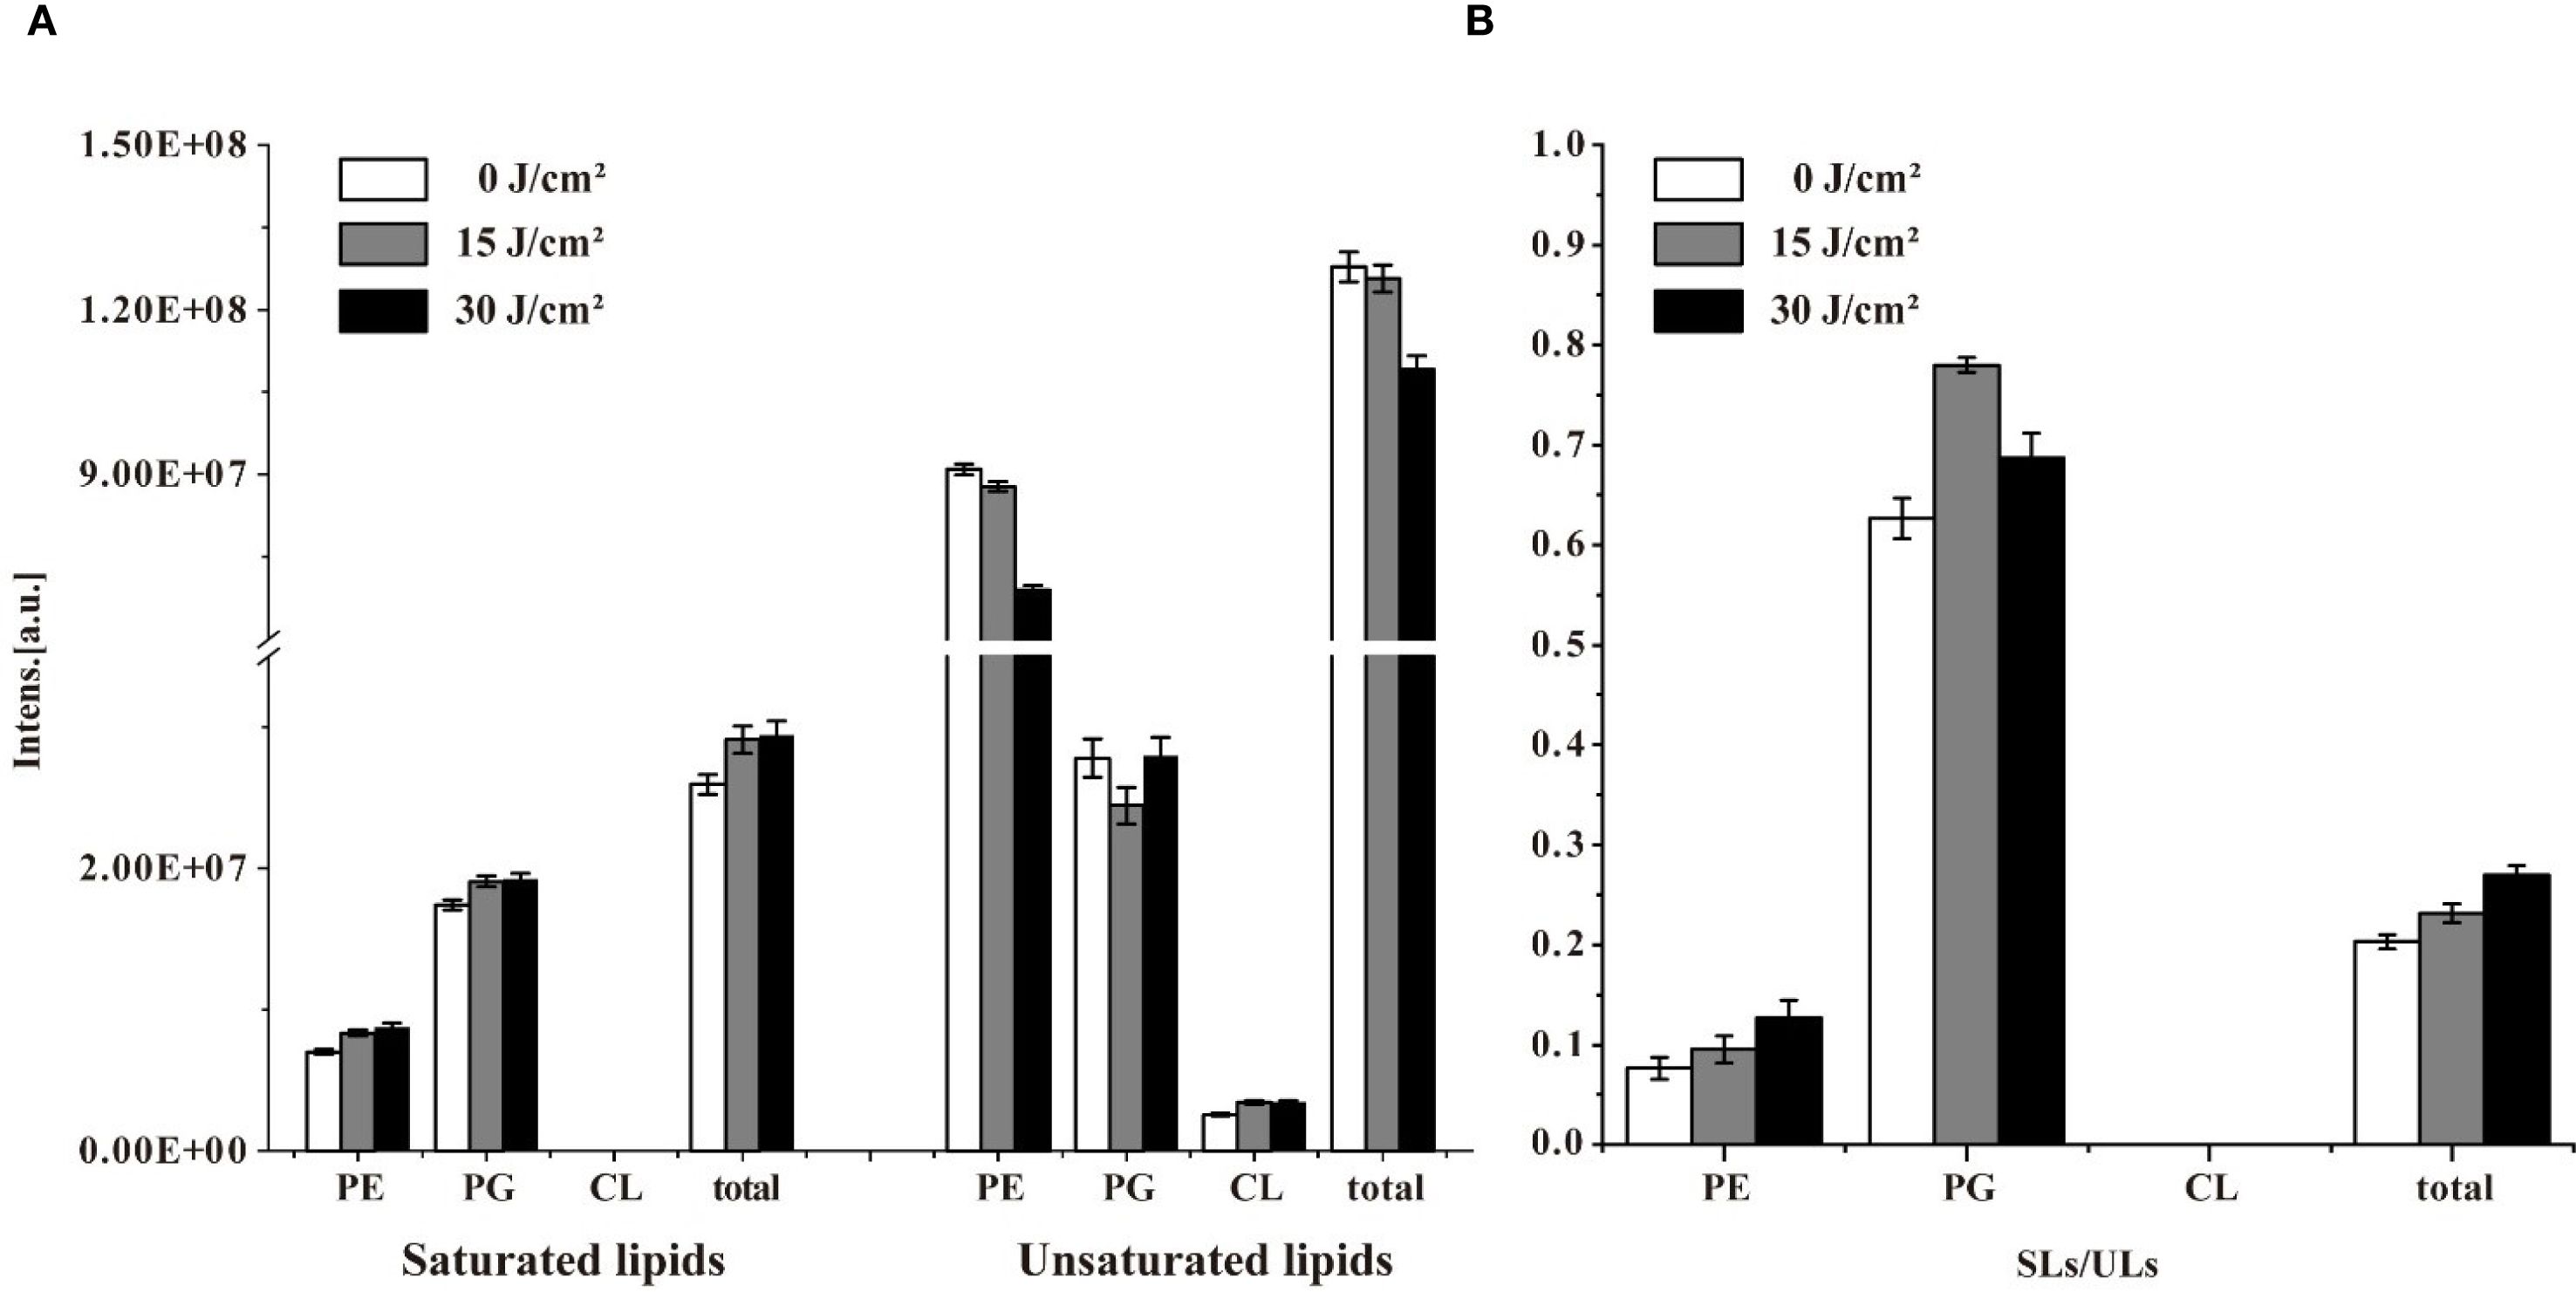
Figure 5. The intensity of saturated lipids (SLs) and unsaturated lipids (ULs), and their ratio (SLs/ULs) in in E. coli W3110 under different aBL doses. (A) Changes in the abundance of SLs and ULs were analyzed after exposure to 0, 15, and 30 J/cm2. (B) The SLs/ULs ratio reflected the degree of unsaturation in membrane lipids.
As shown in Figure 5B. The SLs/ULs ratio for total lipids, particularly PE, progressively increased during aBL irradiation, consistent with the trends observed in Figure 5A. The observed increase in saturated lipids and concurrent decrease in unsaturated lipid species suggest a shift in membrane composition, since the membrane composition of cells belonging to a single species is not constant and varies with environmental conditions (Dowhan, 2013; Sohlenkamp and Geiger, 2016). Our study revealed that aBL irradiation significantly alters the composition and content of lipids in E. coli, particularly affecting unsaturated lipid species. Similar to that exposed to abiotic stress, the lipids modifications upon aBL illumination are not restricted to the fatty acid moieties but also occur at the headgroup level. The effects of aBL on S. Typhimurium lipids are discussed in the next section.
3.3 Influence of aBL on lipidomics of S. Typhimurium by LC-MS analysis
Similarly, in S. Typhimurium, 74 lipid species across 5 classes were identified using PLS-DA (Supplementary Figure S1B). PE and PG were the predominant lipids class, comprising 23 PE species and 12 PG species, all of which were identical to those found in E. coli, respectively. For other lipid classes such as LPE, PS and CL, there are 3, 6, 2 species similar to those in E. coli. These 46 lipids mentioned above maybe conserved in E. coli and S. Typhimurium.
Similar to its impact on E. coli, aBL irradiation induced notable changes in the lipidome of S. Typhimurium. All lipids were listed in Supplementary Table S3, and some lipids were demonstrated in Supplementary Table S4. Following exposure to 15 J/cm2 aBL treatment, changes were observed in the types and intensities of PE, PG, and CL (Figure 3B). Increasing the dose to 30 J/cm² further altered the lipid profile and content, as detailed below.
Under aBL irradiation, S. Typhimurium exhibited more variable lipid changes compared to E. coli., with 18 species showing erratic lipid changes (Figure 6; Table 4). Eleven PE species initially decreased at a 15 J/cm2 dose, and subsequently increased at 30 J/cm2. Comparatively, the changes in PE lipids showed a similar trend in both E. coli and S. Typhimurium (Tables 2A, 2B). However, in S. Typhimurium, a notable increase in saturated lipids and a decline in unsaturated lipids were observed, particularly within the PE class (Figure 6; Table 5).
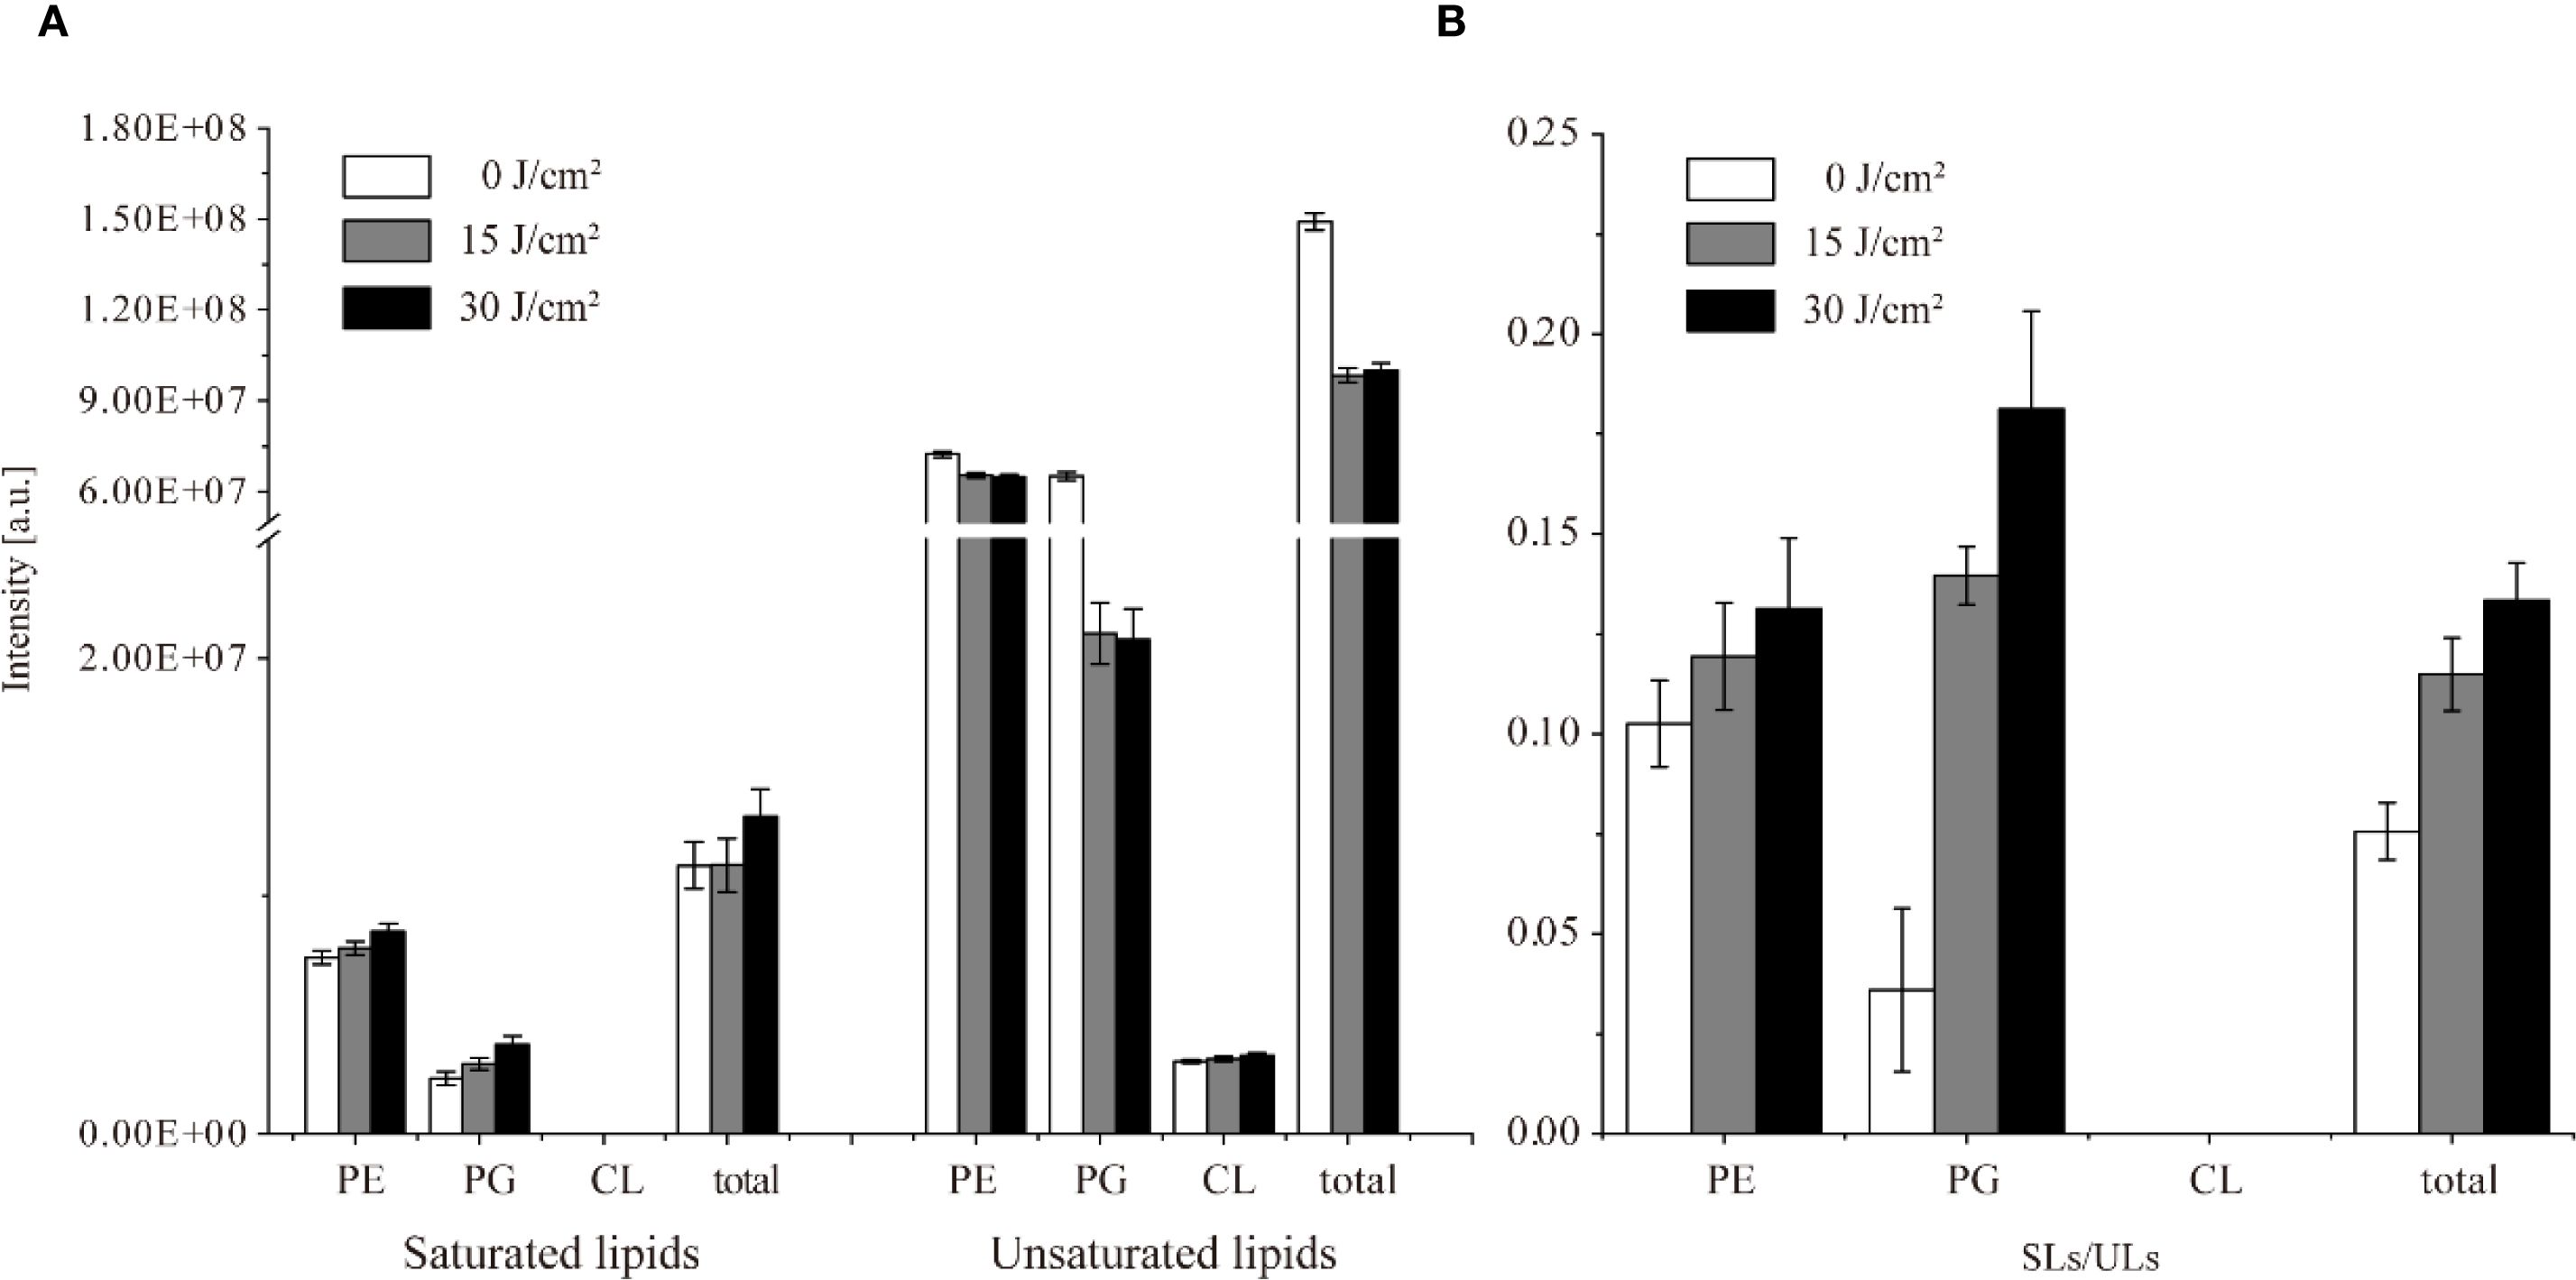
Figure 6. The intensity of saturated lipids (SLs) and unsaturated lipids (ULs), and their ratio (SLs/ULs) in S. Typhimurium SL1344 under different aBL doses. Changes in the abundance of SLs and ULs were analyzed after exposure to 0, 15, and 30 J/cm². The SLs/ULs ratio reflected the degree of unsaturation in membrane lipids.
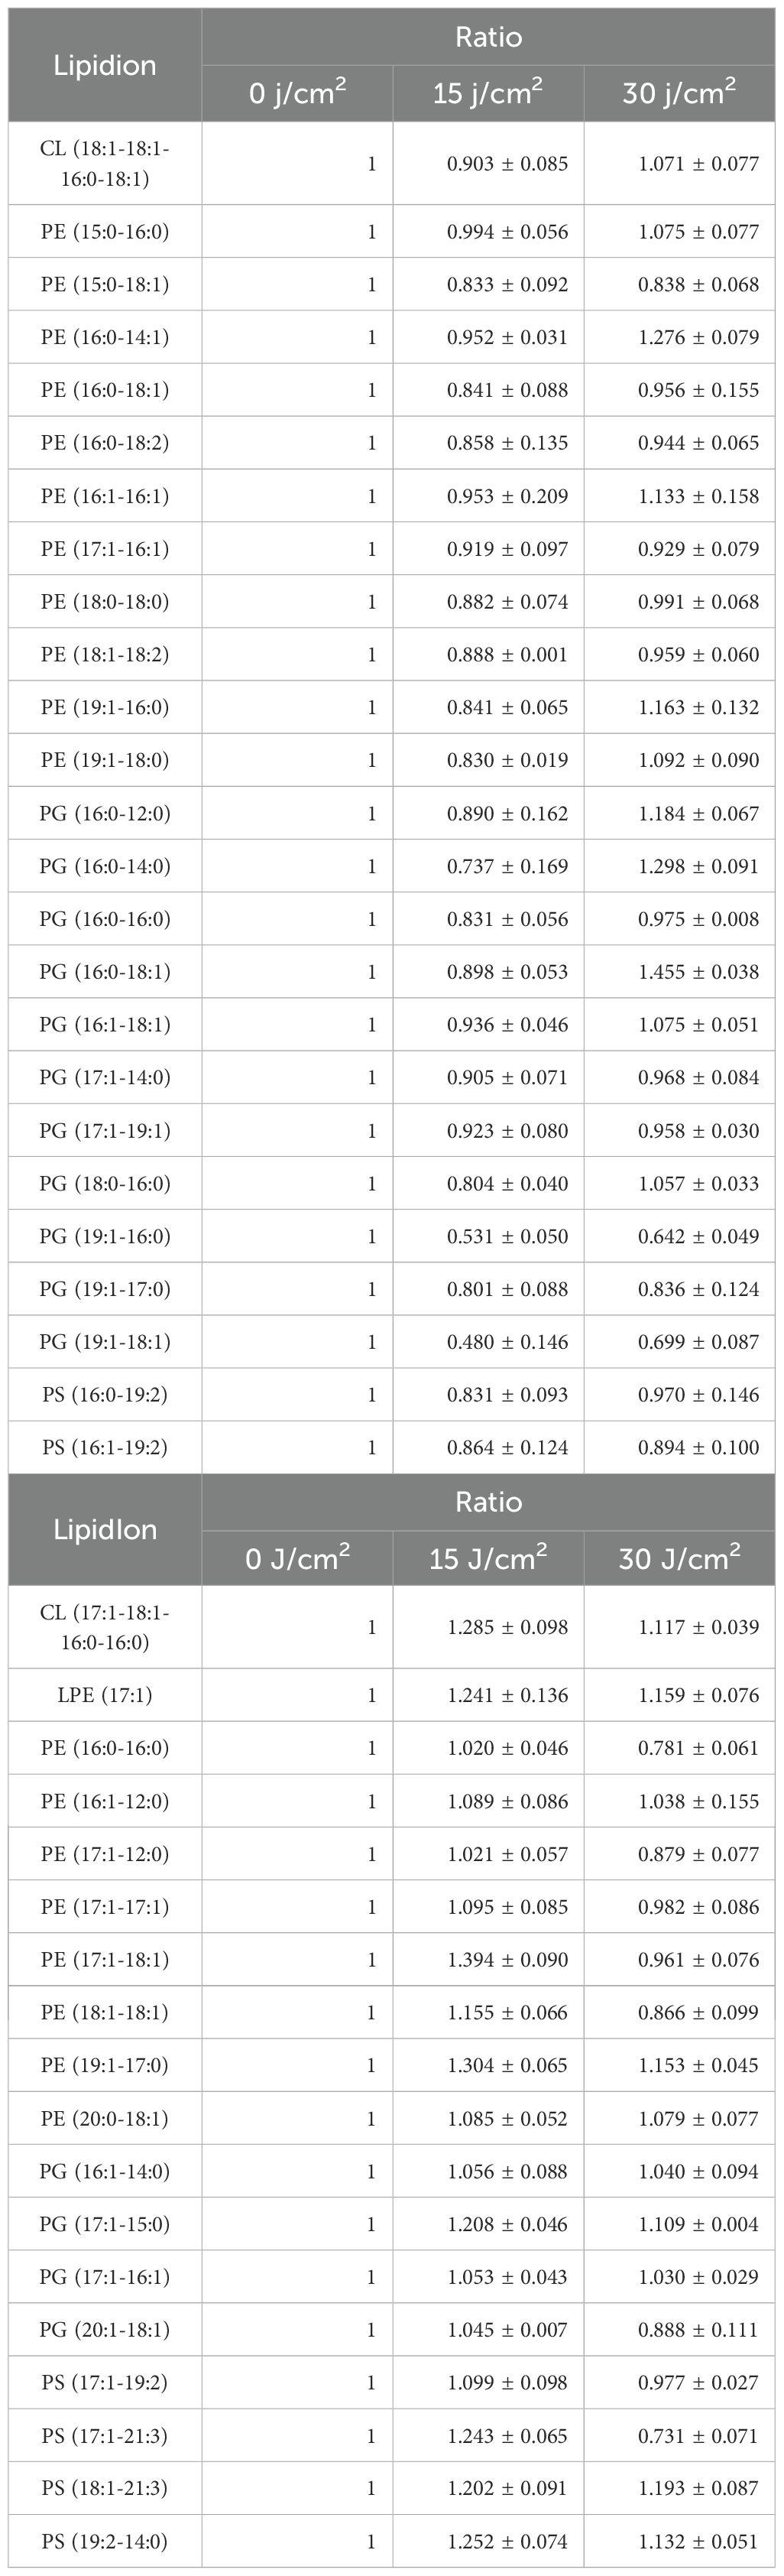
Table 3. Two distinct patterns of specific lipid species in S. Typhimurium SL1344 upon aBL treatment: (A) initial decrease followed by increase, and (B) initial increase followed by decrease.
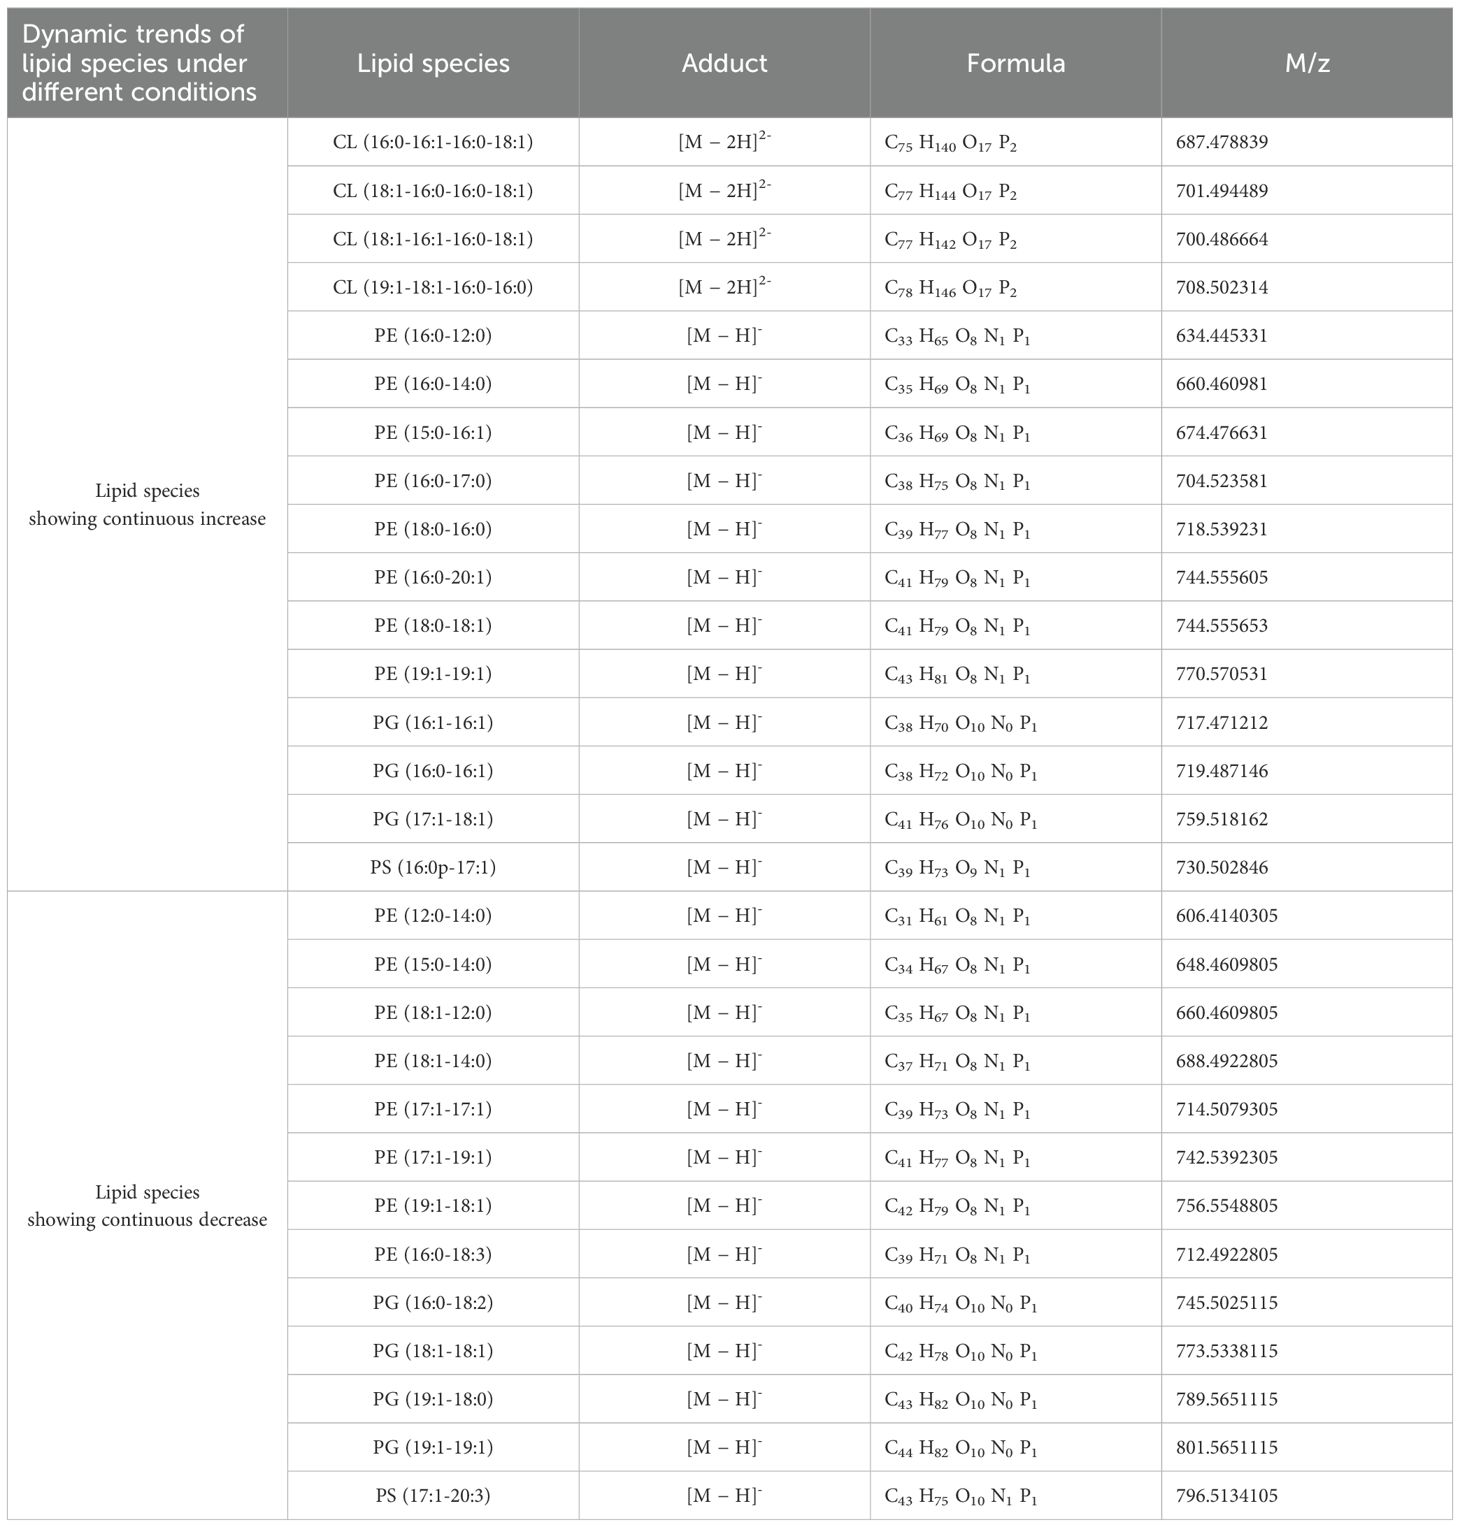
Table 5. The continuous changes in specific lipid species of S. Typhimurium SL1344 during aBL treatment.
More PG species were detected in S. Typhimurium than in E. coli, although fewer of them exhibited changes during aBL irradiation (Figure 7A). Seven PG species exhibited continuous increases or decreases, whereas 16 PG species displayed erratic patterns. Additionally, CL species in S. Typhimurium differed from those found in E. coli. Notably, CL(18:1-16:1-16:0-18:1) increased in S. Typhimurium but decreased in E. coli.
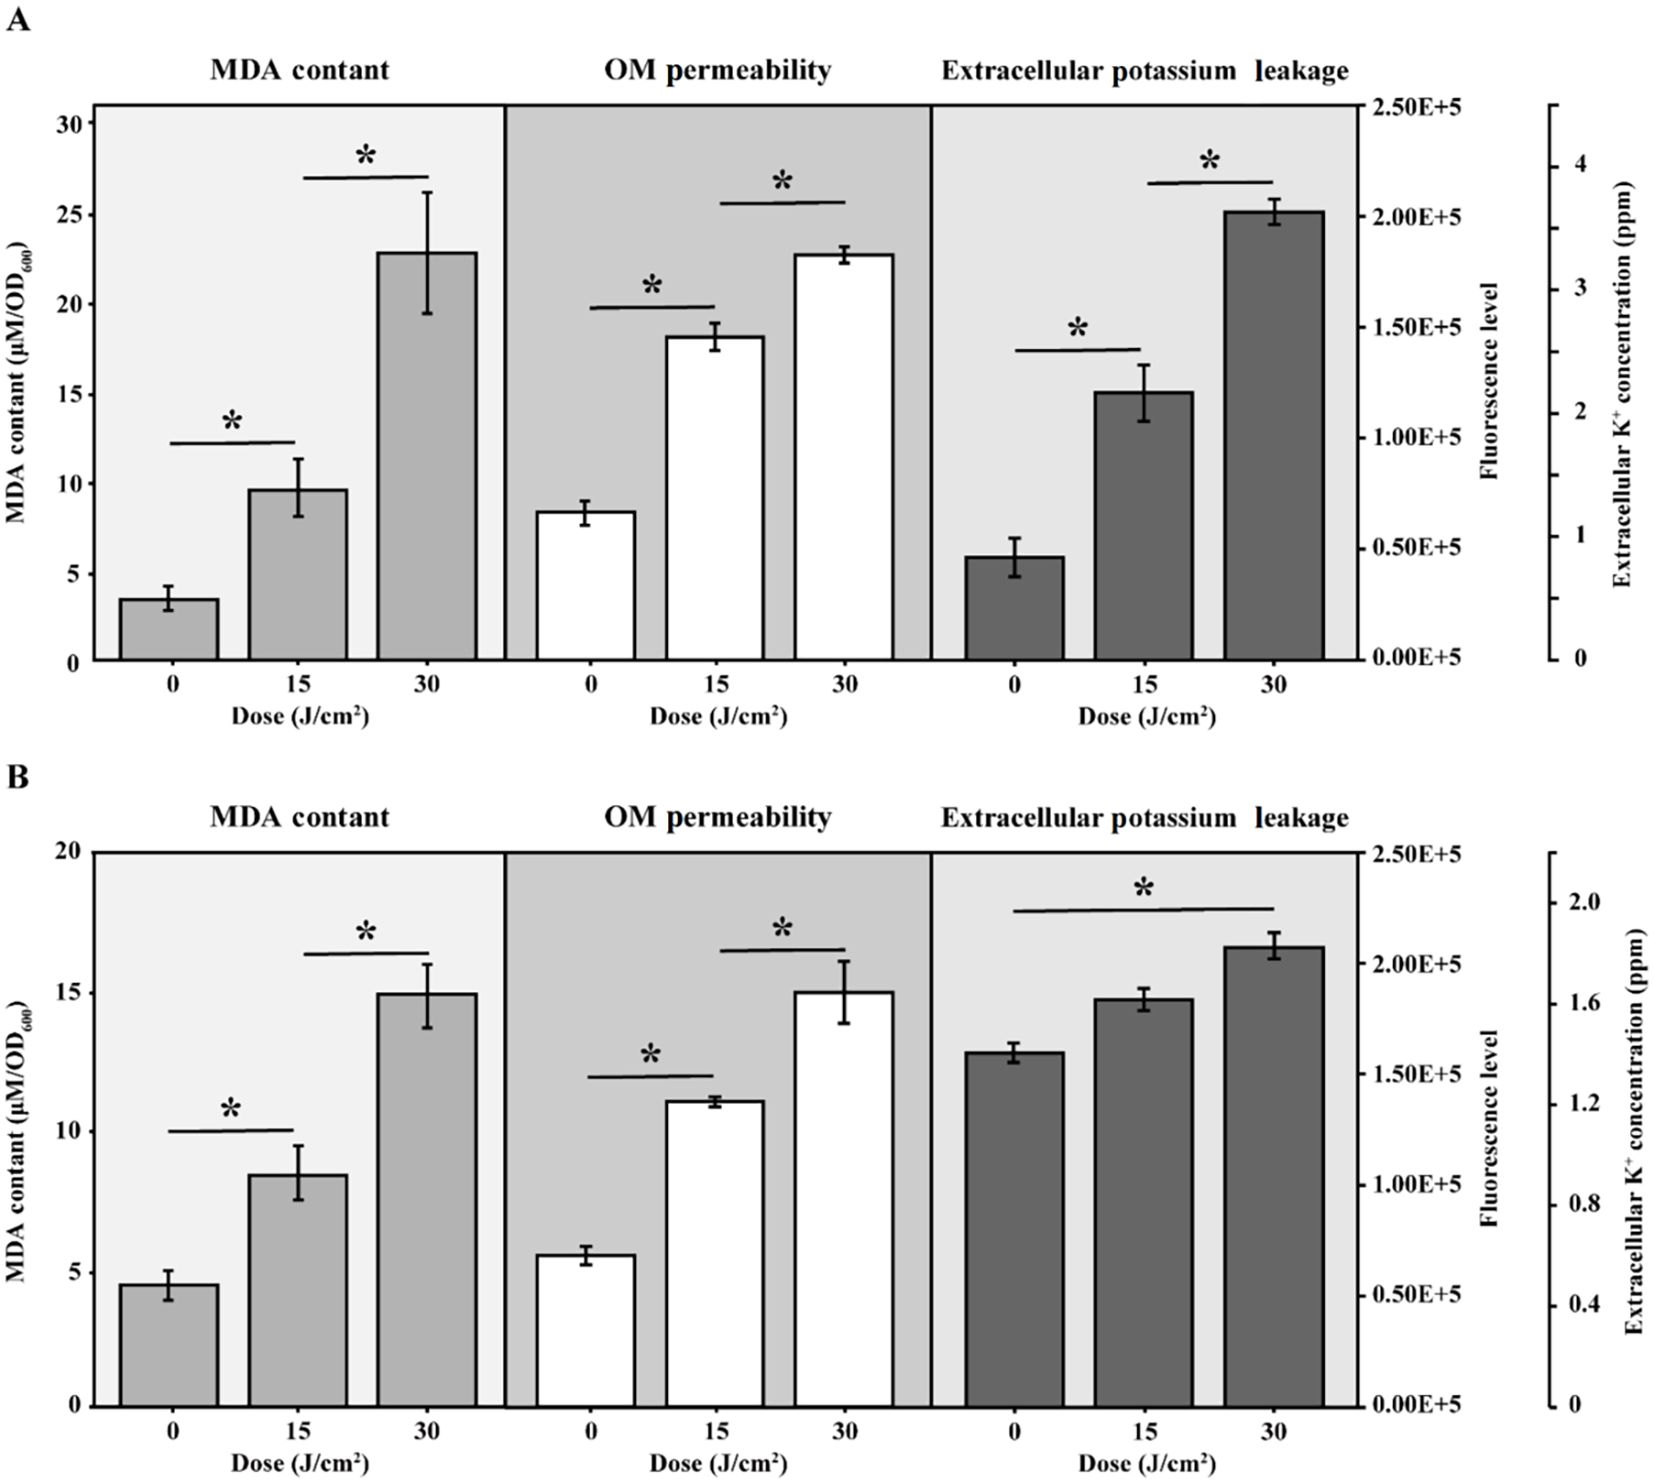
Figure 7. Intensity of lipids under different aBL irradiation doses in S. Typhimurium SL1344 (A) Total lipid intensity changes under 0, 15, and 30 J/cm² aBL. There existed significant differences between different samples (p < 0.05). “a” meant significant differences between samples under 0 and 15 J/cm², “b” meant that under 0 and 30 J/cm², and “c” meant that under 15 and 30 J/cm²; (B, C) Representative lipids exhibiting discontinuous changes in the intensity under different aBL doses.
However, the overall extent of lipid changes, particularly in PE and PG species, was less pronounced and less consistent in S. Typhimurium compared to E. coli, as fewer lipid species exhibited statistically significant or directional changes across irradiation doses. This raises the question of whether such differences in lipid fluctuation correlate with S. Typhimurium’s lower sensitivity to aBL irradiation.
Next, MDA level, OM permeability and potassium leakage in S. Typhimurium exposed to aBL were determined. As illustrated in Figure 4B, the MDA levels increased from 4.37 ± 0.71 µM/OD600 before aBL irradiation to 8.37 ± 0.97 µM/OD600 after 15 J/cm2, then declined to 4.77 ± 1.69 µM/OD600 at after 30 J/cm2 dose. Compared to E. coli, where MDA levels increased to 22.64 ± 3.28 µM/OD600 at 30 J/cm2, S. Typhimurium exhibited lower MDA levels (p < 0.001). Besides, OM permeability in S. Typhimurium increased markedly, rising by 101.65% at 15 J/cm2 and reaching 174.38% at 30 J/cm2 (Figure 6B), likely due to the oxidative stress-induced alterations in membrane composition (p < 0.001). Additionally, although S. Typhimurium exhibited high background leakage, it still showed a significant increase along with aBL irradiation.
This study demonstrates the profound impact of aBL irradiation on the lipidomic profiles of S. Typhimurium and E. coli. Our findings reveal substantial diversity and variability in lipid composition across sublethal aBL irradiations. Notably, we observed significant alteration membrane lipids—particularly unsaturated species—likely driven by aBL-induced oxidative stress. These insights are critical for deciphering the bactericidal mechanisms of aBL and uncovering the molecular basis of strain-specific difference in aBL sensitivity.
Data availability statement
The raw data supporting the conclusions of this article will be made available by the authors, without undue reservation.
Author contributions
JW: Writing – original draft, Investigation, Formal Analysis, Conceptualization, Methodology. XL: Writing – review & editing. MH: Validation, Investigation, Writing – review & editing, Software. SW: Writing – review & editing, Formal Analysis. MZ: Writing – review & editing, Methodology. ZL: Data curation, Formal analysis, Writing – review & editing. KY: Investigation, Software, Validation, Writing – review & editing. XZ: Investigation, Software, Validation, Writing – review & editing. XS: Software, Investigation, Writing – review & editing, Validation. SW: Conceptualization, Methodology, Writing – review & editing. XW: Resources, Methodology, Writing – review & editing, Supervision. XH: Funding acquisition, Writing – review & editing, Project administration, Data curation, Investigation, Supervision.
Funding
The author(s) declare financial support was received for the research and/or publication of this article. This research was supported by the Intergovernmental Key Special Project of National Key R&D Program (2023YFE0104400).
Conflict of interest
Author SW was employed by AgResearch Ltd.
The remaining authors declare that the research was conducted in the absence of any commercial or financial relationships that could be construed as a potential conflict of interest.
Generative AI statement
The author(s) declare that no Generative AI was used in the creation of this manuscript.
Any alternative text (alt text) provided alongside figures in this article has been generated by Frontiers with the support of artificial intelligence and reasonable efforts have been made to ensure accuracy, including review by the authors wherever possible. If you identify any issues, please contact us.
Publisher’s note
All claims expressed in this article are solely those of the authors and do not necessarily represent those of their affiliated organizations, or those of the publisher, the editors and the reviewers. Any product that may be evaluated in this article, or claim that may be made by its manufacturer, is not guaranteed or endorsed by the publisher.
Supplementary material
The Supplementary Material for this article can be found online at: https://www.frontiersin.org/articles/10.3389/fcimb.2025.1612638/full#supplementary-material
References
Abana, C. M., Brannon, J. R., Ebbott, R. A., Dunigan, T. L., Guckes, K. R., Fuseini, H., et al. (2017). Characterization of blue light irradiation effects on pathogenic and nonpathogenic Escherichia coli. Microbiol. Open 6:e466. doi: 10.1002/mbo3.466
Alves, E., Melo, T., Simoes, C., Faustino, M. A., Tome, J. P., Neves, M. G., et al. (2013a). Photodynamic oxidation of Staphylococcus warneri membrane phospholipids: new insights based on lipidomics. Rapid Commun. Mass Spectrom 27, 1607–1618. doi: 10.1002/rcm.6614
Alves, E., Santos, N., Melo, T., Maciel, E., Doria, M. L., Faustino, M. A., et al. (2013b). Photodynamic oxidation of Escherichia coli membrane phospholipids: new insights based on lipidomics. Rapid Commun. Mass Spectrom. 27, 2717–2128. doi: 10.1002/rcm.6739
Bumah, V. V., Masson-Meyers, D. S., and Enwemeka, C. S. (2015). Blue 470 nm light suppresses the growth of Salmonella enterica and methicillin-resistant Staphylococcus aureus (MRSA) in vitro. Lasers Surg. Med. 47, 595–601. doi: 10.1002/lsm.22385
Chu, Z., Hu, X., Wang, X., Wu, J., Dai, T., and Wang, X. (2019). Inactivation of Cronobacter sakazakii by blue light illumination and the resulting oxidative damage to fatty acids. Can. J. Microbiol. 65, 922–929. doi: 10.1139/cjm-2019-0054
D’Arrigo, P. and Servi, S. (2010). Synthesis of lysophospholipids. Molecules 15, 1354–1377. doi: 10.3390/molecules15031354
Dai, T., Gupta, A., Murray, C. K., Vrahas, M. S., Tegos, G. P., and Hamblin, M. R. (2012). Blue light for infectious diseases: Propionibacterium acnes, Helicobacter pylori, and beyond? Drug Resist. Update 15, 223–236. doi: 10.1016/j.drup.2012.07.001
Dos Anjos, C., Sabino, C. P., Bueris, V., Fernandes, M. R., Pogliani, F. C., Lincopan, N., et al. (2019). Antimicrobial blue light inactivation of international clones of multidrug-resistant Escherichia coli ST10, ST131 and ST648. Photodiagnosis Photodyn. Ther. 27, 51–53. doi: 10.1016/j.pdpdt.2019.05.014
Dos Anjos, C., Sellera, F. P., Freitas, L. M., Gargano, R. G., Telles, E. O., Freitas, R. O., et al. (2020). Inactivation of milk-borne pathogens by blue light exposure. J. Dairy Sci 103, 1261–1268. doi: 10.3168/jds.2019-16758
Dowhan, W. (2013). A retrospective: use of Escherichia coli as a vehicle to study phospholipid synthesis and function. Biochim. Biophys. Acta 1831, 471–494. doi: 10.1016/j.bbalip.2012.08.007
Endarko, E., Maclean, M., Timoshkin, I. V., MacGregor, S. J., and Anderson, J. G. (2012). High-Intensity 405 nm Light Inactivation of Listeria monocytogenes. Photochem. Photobiol. 88, 1280–1286. doi: 10.1111/j.1751-1097.2012.01173.x
Enwemeka, C. S., Williams, D., Hollosi, S., Yens, D., and Enwemeka, S. K. (2008). Visible 405 nm SLD light photo-destroys methicillin-resistant Staphylococcus aureus (MRSA) in vitro. Lasers Surg. Med. 40, 734–737. doi: 10.1002/lsm.20724
Folch, J., Lees, M., and Sloane Stanley, G. H. (1957). A simple method for the isolation and purification of total lipides from animal tissues. J. Biol. Chem. 226, 497–509. doi: 10.1016/S0021-9258(18)64849-5
Gao, X., Liu, W., Mei, J., and Xie, J. (2019). Quantitative analysis of cold stress inducing lipidomic changes in Shewanella putrefaciens using UHPLC-ESI-MS/MS. . Molecules 24:4609. doi: 10.3390/molecules24244609
Gidden, J., Denson, J., Liyanage, R., Ivey, D. M., and Lay, J. O. (2009). Lipid compositions in Escherichia coli and Bacillus subtilis during growth as determined by MALDI-TOF and TOF/TOF mass spectrometry. Int. J. Mass Spectrom. 283, 178–184. doi: 10.1016/j.ijms.2009.03.005
Guffey, J. S., Payne, W. C., Motts, S. D., Towery, P., Hobson, T., Harrell, G., et al. (2016). Inactivation of Salmonella on tainted foods: using blue light to disinfect cucumbers and processed meat products. Food Sci Nutr. 4, 878–887. doi: 10.1002/fsn3.354
Halstead, F. D., Thwaite, J. E., Burt, R., Laws, T. R., Raguse, M., Moeller, R., et al. (2016). Antibacterial activity of blue light against nosocomial wound pathogens growing planktonically and as mature biofilms. Appl. Environ. Microbiol. 82, 4006–4016. doi: 10.1128/AEM.00756-16
Hu, X., Sun, X., Luo, S., Wu, S., Chu, Z., Zhang, X., et al. (2021a). Inactivation of Salmonella enterica Serovar Enteritidis on chicken eggshells using blue light. Agriculture. 11(8), 1–12. doi: 10.3390/agriculture11080762
Hu, X., Zhang, X., Luo, S., Wu, J., Sun, X., Liu, M., et al. (2021b). Enhanced sensitivity of Salmonella to antimicrobial blue light caused by Inactivating rfaC gene involved in lipopolysaccharide biosynthesis. Foodborne Pathog. Dis. 18, 599–606. doi: 10.1089/fpd.2020.2888
Josewin, S. W., Kim, M.-J., and Yuk, H.-G. (2018). Inactivation of Listeria monocytogenes and Salmonella spp. on cantaloupe rinds by blue light emitting diodes (LEDs). Food Microbiol. 76, 219–225. doi: 10.1016/j.fm.2018.05.012
Kim, M.-J., Adeline Ng, B. X., Zwe, Y. H., and Yuk, H.-G. (2017a). Photodynamic inactivation of Salmonella enterica Enteritidis by 405 ± 5-nm light-emitting diode and its application to control salmonellosis on cooked chicken. Food Control 82, 305–315. doi: 10.1016/j.foodcont.2017.06.040
Kim, M. J., Bang, W. S., and Yuk, H. G. (2017b). 405 ± 5 nm light emitting diode illumination causes photodynamic inactivation of Salmonella spp. on fresh-cut papaya without deterioration. Food Microbiol. 62, 124–132. doi: 10.1016/j.fm.2016.10.002
Lin, T. Y. and Weibel, D. B. (2016). Organization and function of anionic phospholipids in bacteria. Appl. Microbiol. Biotechnol. 100, 4255–4267. doi: 10.1007/s00253-016-7468-x
Lipovsky, A., Nitzan, Y., Friedmann, H., and Lubart, R. (2009). Sensitivity of Staphylococcus aureus strains to broadband visible light. Photochem. Photobiol. 85, 255–260. doi: 10.1111/j.1751-1097.2008.00429.x
Luo, S., Yang, X. I., Wu, S., Liu, M., Zhang, X., Sun, X., et al. (2022). Blue light for inactivation of meatborne pathogens and maintaining the freshness of beef. J. Food Prot 85, 553–562. doi: 10.4315/JFP-21-234
Melero, A. and Jimenez-Rojo, N. (2023). Cracking the membrane lipid code. Curr. Opin. Cell Biol. 83, 102203. doi: 10.1016/j.ceb.2023.102203
Mileykovskaya, E. and Dowhan, W. (2009). Cardiolipin membrane domains in prokaryotes and eukaryotes. Biochim. Biophys. Acta 1788, 2084–2091. doi: 10.1016/j.bbamem.2009.04.003
Mussi, M. A., Gaddy, J. A., Cabruja, M., Arivett, B. A., Viale, A. M., Rasia, R., et al. (2010). The opportunistic human pathogen Acinetobacter baumannii senses and responds to light. J. Bacteriol 192, 6336–6345. doi: 10.1128/JB.00917-10
Özyürek, F. B., Karataş, N., Tapan, M., Var, G. B., Çakır, M., and Özer, C. O. (2020). The effects of light sources and packaging types on the storage stability of fresh lean and chuck beef meat during refrigerated storage. J. Food Process. Preserv. 45 (8), e14525. doi: 10.1111/jfpp.14525
Qiao, J., Tan, X., Huang, D., Li, H., Wang, Z., Ren, H., et al. (2021). Construction and application of an Escherichia coli strain lacking 62 genes responsible for the biosynthesis of enterobacterial common antigen and flagella. J. Agric. Food Chem. 69, 4153–4163. doi: 10.1021/acs.jafc.1c00453
Schwalbe-Herrmann, M., Willmann, J., and Leibfritz, D. (2010). Separation of phospholipid classes by hydrophilic interaction chromatography detected by electrospray ionization mass spectrometry. J. Chromatogr A 1217, 5179–5183. doi: 10.1016/j.chroma.2010.05.014
Silhavy, T. J., Kahne, D., and Walker, S. (2010). The bacterial cell envelope. Cold Spring Harb. Perspect. Biol. 2, a000414. doi: 10.1101/cshperspect.a000414
Sohlenkamp, C. and Geiger, O. (2016). Bacterial membrane lipids: diversity in structures and pathways. FEMS Microbiol. Rev. 40, 133–159. doi: 10.1093/femsre/fuv008
Wu, J., Chu, Z., Ruan, Z., Wang, X., Dai, T., and Hu, X. (2018). Changes of intracellular porphyrin, reactive oxygen species, and fatty acids profiles during inactivation of methicillin-resistant Staphylococcus aureus by antimicrobial blue light. Front. Physiol. 9, 1658. doi: 10.3389/fphys.2018.01658
Yang, W. S. and Stockwell, B. R. (2016). Ferroptosis: death by lipid peroxidation. Trends Cell Biol. 26, 165–176. doi: 10.1016/j.tcb.2015.10.014
Keywords: antimicrobial blue light, lipidomics, Escherichia coli, Salmonella Typhimurium, unsaturated lipids
Citation: Wu J, Lu X, Huang M, Wu S, Zeng M, Liu Z, Yu K, Zhang X, Sun X, Wang X and Hu X (2025) The impact of sublethal antimicrobial blue light on lipidomic changes of Escherichia coli and Salmonella Typhimurium. Front. Cell. Infect. Microbiol. 15:1612638. doi: 10.3389/fcimb.2025.1612638
Received: 16 April 2025; Accepted: 26 September 2025;
Published: 26 November 2025.
Edited by:
Fábio Sellera, Universidade Metropolitana de Santos, BrazilReviewed by:
Joanna Nakonieczna, Intercollegiate Faculty of Biotechnology of University of Gdańsk and Medical University of Gdańsk, PolandRuixue Zhang, Washington University in St. Louis, United States
Copyright © 2025 Wu, Lu, Huang, Wu, Zeng, Liu, Yu, Zhang, Sun, Wang and Hu. This is an open-access article distributed under the terms of the Creative Commons Attribution License (CC BY). The use, distribution or reproduction in other forums is permitted, provided the original author(s) and the copyright owner(s) are credited and that the original publication in this journal is cited, in accordance with accepted academic practice. No use, distribution or reproduction is permitted which does not comply with these terms.
*Correspondence: Xiaoqing Hu, eGlhb3FpbmdodUBqaWFuZ25hbi5lZHUuY24=