 Xiaonan Ren1†
 Cong Wang2†
 Boyin Qin1
 Hua Yang1
 Min Wu2
 Zhanqing Zhang3Wei Lu3
 Chao Wang1Yabin Liu2*
 Xiaonan Zhang2,4*
 Xiaohui Zhou1*
- 1Department of Laboratory Animal Science, Shanghai Public Health Clinical Center, Fudan University, Shanghai, China
- 2Department of Basic Scientific Research, Shanghai Public Health Clinical Center, Fudan University, Shanghai, China
- 3Department of Hepatology, Shanghai Public Health Clinical Center, Fudan University, Shanghai, China
- 4Centre for Research in Therapeutic Solutions, Biomedical Sciences, Faculty of Science and Technology, University of Canberra, Canberra, ACT, Australia
Introduction: Hepatitis B virus (HBV) infection remains a leading cause of chronic liver disease, cirrhosis, and hepatocellular carcinoma worldwide. Despite advances in antiviral therapies, the mechanisms underlying HBV-induced metabolic reprogramming and liver fibrosis remain poorly understood.
Methods: We employed single-nucleus RNA sequencing (snRNA-seq) which is particularly suitable for hepatocytic sequencing to dissect the transcriptional landscape of HBV-infected and uninfected hepatocytes in humanized URG mice (Hu-URG).
Results and Discussion: Chronic HBV infection was successfully established in Hu-URG mice, with progressive increases in serum HBV DNA, HBsAg, and HBeAg levels. snRNA-seq revealed distinct human hepatocyte clusters (clusters 9, 16, 23) characterizing elevated expression of metabolic genes (ALB, UGT2B17, CYP2A6) in HBV-infected cells, while HBV-uninfected cells exhibited upregulation of TIMP1 and pro-fibrotic pathways. Immunofluorescence and histological analyses confirmed that HBV-uninfected hepatocytes (HBsAg-) displayed higher TIMP1 expression and reduced albumin (hALB) levels, correlating with increased collagen deposition in HBV-hu-URG mice. Notably, this TIMP1+HBsAg-hALBlow phenotype was also observed in liver biopsies from chronic HBV patients, underscoring its clinical relevance. Our findings highlight HBV-driven metabolic adaptation and identify TIMP1 as a potential mediator of fibrosis in uninfected hepatocytes, offering novel insights into HBV pathogenesis and therapeutic targeting.
1 Introduction
Chronic hepatitis B virus (HBV) infection continues to impose a substantial global health burden which affects over 296 million individuals worldwide (Cui et al., 2023). It is intricately linked to the development of viral hepatitis, liver cirrhosis, and hepatocellular carcinoma, posing a substantial threat to public health. Despite the therapeutic advancements, including nucleos(t)ide analogs and interferon-based regimens that suppress viral replication, functional cure rates remain a challenge (Lok, 2024), and the molecular interplay between HBV and host hepatocytes remains incompletely defined. Emerging evidence highlights the pivotal role of HBV-mediated metabolic reprogramming in viral persistence and immune evasion (Zhou et al., 2021). HBV infection is associated with widespread metabolic dysregulation, encompassing lipid, bile acid, glucose, amino acid, and nucleic acid metabolism (Diaz et al., 2022; Wang and Zhang, 2023).
Hepatocytes, the principal site of HBV replication, govern essential metabolic processes such as xenobiotic detoxification, lipid homeostasis, and bile acid synthesis. Due to their sensitivity to tissue dissociation, they have been poorly represented in current single-cell transcriptomic datasets. Although optimized dissociation protocols have improved hepatocyte viability, these remain predominantly applied to healthy liver tissues, leaving disease-specific adaptations underexplored. Moreover, tissue dissociation for single-cell RNA sequencing (scRNA-seq) introduces cell representation biases and de novo transcriptional stress responses, potentially masking the underlying biological state (Denisenko et al., 2020; Carlessi et al., 2023). In contrast, Single-nucleus RNA sequencing (snRNA-seq) bypasses the cell dissociation step by using detergents to release nuclei from intact cells, minimizing potential changes in gene expression resulting from enzymatic cell separation methods (Wu et al., 2019). When comparing the two platforms, they exhibit comparable diversity but distinct proportions of cell types in matched tissues. Notably, the proportion of hepatocytes in the liver is relatively higher in snRNA-seq data (Oh et al., 2022). Some studies have shown that snRNA-seq may be sufficient to replace scRNA-seq in certain scenarios and performs better in hepatocyte sequencing (Wen et al., 2022). Moreover, snRNA-seq has unique advantages in characterizing pre-mRNAs and long non-coding RNAs (lncRNAs) within nuclei (Zeng et al., 2016; Gao et al., 2017).
Recent studies have highlighted the role of host cellular metabolism in supporting HBV replication. For instance, HBV manipulates cellular metabolic pathways to enhance viral persistence and replication. Additionally, the expression of tissue inhibitors of metalloproteinases (TIMPs), such as TIMP1, has been implicated in liver fibrosis progression (Arthur, 2000; Li et al., 2020; Masuzaki et al., 2020). However, the metabolic and fibrogenic consequences of HBV infection at single-cell resolution remain elusive.
In this study, we integrated snRNA-seq with a humanized Tet-uPATg Rag2null Il2rgnull (URG) (Xie et al., 2019) mouse model, a system that supports engraftment of functional human hepatocytes to enable in vivo investigations of HBV infection, to characterize the transcriptional landscapes of HBV-infected versus uninfected bystander hepatocytes. Our findings reveal HBV-induced upregulation of peroxisomal and lipid metabolic genes, alongside a TIMP1-driven profibrotic signature in uninfected hepatocytes. These findings were validated in liver tissues from human HBV patients, bridging murine models to clinical pathology. By mapping HBV-host metabolic crosstalk and fibrosis drivers, this study provides a high-resolution atlas of HBV-host interactions and identifies TIMP1 as a key regulator of fibrosis in the HBV microenvironment.
2 Materials and methods
2.1 Mice
URG and liver humanized URG mice (Hu-URG) were obtained from the Beijing Vitalstar Biotechnology Co., Ltd. All animal experiments were performed in accordance with the procedures approved by the Institutional Animal Care and Use Committee of Shanghai Public Health Clinical Center (2020-A025-01).
2.2 Human liver samples
Human liver biopsies from HBV patient were collected with ethical approval from Shanghai Public Health Clinical Center (2018-S033-02), following written informed consent from the patients. The clinical characteristics of the patient are detailed in Table 1.
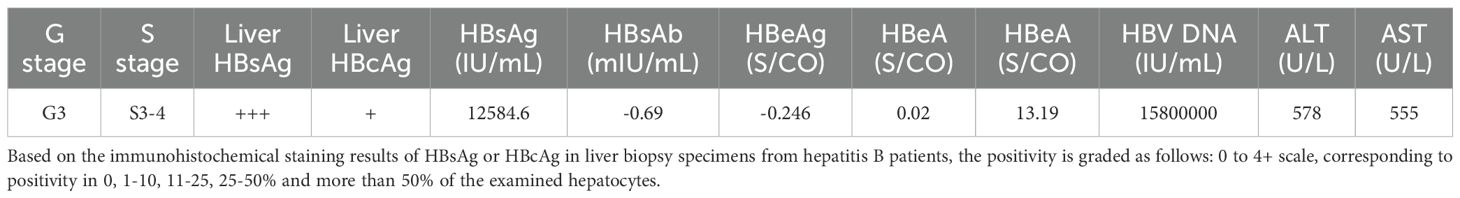
Table 1. The clinical information of the HBV patient.
2.3 Blood sample collection and analyses
Mouse blood samples were collected at 0, 7, 13, 21, 30, 36, 43, 49, 57, 64, 70, 78, 85, and 91 days post inoculation (d.p.i.) (n=4 mice per time point). The samples were centrifuged at 600×g for 15 minutes, and the serum was separated and stored at −80°C for subsequent analyses. Serum human albumin (hALB), alanine aminotransferase (ALT), HBV DNA, hepatitis B surface antigen (HBsAg), and hepatitis B e antigen (HBeAg) levels were analyzed.
2.4 Human albumin ELISA
Serum hALB levels were measured using the Human Albumin ELISA Kit (Bethyl, Catalog E88-129) according to the manufacturer’s protocol.
2.5 Measurement of transaminase activity
Serum ALT activity was measured using the Roche Cobas C702 platform, following the manufacturer’s instructions (Roche modular, Basel, Switzerland).
2.6 HBV infection of humanized mice
At 56 days post transplantation, Hu-URG mice were intravenously inoculated with 100 µl of 8×10⁸ HBV genome equivalents (genotype D), resulting in HBV-infected Hu-URG mice (HBV-hu-URG). HBV particles were harvested from HepAD38 cell supernatants after doxycycline withdrawal. Specifically, cells were expanded and supernatants collected every 3–4 days. Clarified supernatants were then concentrated using 100-kDa Millipore centrifugal filters (3,220×g, 40 minutes), aliquoted, and stored at –80°C. Viral titers quantified by TaqMan PCR averaged 8×10⁹ copies/mL. Blood samples were collected at 7, 13, 21, 30, 36, 43, 49, 57, 64, 70, 78, 85, and 91 d.p.i. (n=2 mice per time point). The samples were processed as previously described, and the mice were subsequently sacrificed for the collection of liver and serum samples.
2.7 Quantification of serum HBV markers
Serum HBV DNA was quantified using the ABI Prism 7500 Sequence Detector system with TaqMan PCR Reagents (KHB, Shanghai, China). Serum levels of HBsAg and HBeAg were measured using the AutoLumo A2000PLUS platforms, following the manufacturer’s protocol.
2.8 Hematoxylin and eosin and Picrosirius Red staining
At the time of sacrifice, livers from URG, Hu-URG, and HBV-Hu-URG mice were fixed with 4% paraformaldehyde (PFA) for 24 hours, rinsed, and stored in 70% ethanol. Formalin-fixed specimens were embedded in paraffin, sectioned, and routinely stained with hematoxylin and eosin (H&E). For Picrosirius Red staining, a staining solution was prepared using Sirius Red and saturated picric acid. Rehydrated sections were stained in Picrosirius Red solution for 30 minutes. Quantification of Sirius Red-positive areas was performed using Image J software.
2.9 Immunohistochemical staining
At the time of sacrifice, livers from Hu-URG and HBV-hu-URG mice were fixed with 4% PFA for 24 hours, then dehydrated in 70% ethanol until paraffin processing. Tissues was cryosectioned into 5 μm sections and stained with antibody against hALB (1:2000), HBsAg (1:200), and Hepatitis B core antigen (HBcAg) (1:500).
2.10 Immunofluorescence staining
Mice liver tissues were embedded in OCT and frozen at -80°C for subsequent use. Tissues were cryosectioned into 8 µm sections. Chronic HBV patient liver tissues were fixed with 4% PFA, embedded in paraffin, and cryosectioned into 5 μm sections. After deparaffinizing, antigen retrieval was performed by boiling the samples in citrate buffer for 20 minutes in a microwave oven. Both frozen mouse sections and formalin-fixed paraffin-embedded (FFPE) patient sections were permeabilized in 1×PBS with 0.5% Triton X-100 for 30 minutes. The tissues were then blocked in 1×PBS with 3% BSA for 2 hours at room temperature. Primary antibodies were diluted in 1×PBS with 3% BSA and incubated overnight tin a wet chamber at 4°C: Rabbit anti-human TIMP1 (hTIMP1) (1:200) and Mouse anti-HBsAg (1:100)/Mouse anti-HBcAg (1:100); Rabbit anti-hTIMP1 (1:200)/Rabbit anti-Ki67 (1:600) and Goat anti-hALB (1:2000). Sections were washed three times with PBS containing 0.5% Tween 20 for 5 minutes each time. Secondary antibodies, Alexa Fluor 488 and Alexa Fluor 594; Alexa Fluor 568 and FITC, were diluted 1:1000 in PBS with 3% BSA and incubated for 1 hour at room temperature. Nuclei were stained with Hoechst. Imaging was performed using a Leica confocal microscope STELLARIS 8.
2.11 Nucleus isolation
Fresh liver samples were collected from mice, and nuclei were extracted. Chopped liver tissues were resuspended in 2 mL chilled nuclei lysis buffer. The homogenates were sequentially filtered through a 40 µm cell strainer and centrifuged at 4˚C, 500 × g for 5 minutes to precipitate the nuclei. The precipitate was resuspended in 200 µl cold PBS and stained with Trypan Blue.
2.12 Single-nucleus RNA sequencing
snRNA-seq was conducted by Neo-Biotechnology Co., Ltd. (Shanghai, China). Libraries for snRNA-seq were generated using the Chromium Single Cell 3’ library from 10×Genomics, following the manufacturer’s instructions. Approximately 18,000-20,000 nuclei were profiled per library. The raw sequence data have been deposited in the Genome Sequence Archive in National Genomics Data Center, China National Center for Bioinformation/Beijing Institute of Genomics, Chinese Academy of Sciences (GSA: CRA025748).
2.13 Data analysis
2.13.1 General statistical analyses
Statistical analyses were performed using GraphPad Prism software. Group comparisons were made using unpaired Student’s t-tests. The number of repetitions is indicated in the legends of each graph. Results were expressed as means ± SEM. A P-value < 0.05 was considered statistically significant. snRNA-seq data processing, statistical analyses, and visualization were performed using the R programming language (version 4.1.3).
2.13.2 snRNA-seq data processing and analysis
BCL files were demultiplexed and converted into FASTQ format using bcl2fastq utility from Illumina BaseSpace Sequence Hub. The FASTQ files were processed using Cell Ranger 7.1.0. Raw sequencing reads were aligned to the combined human and mouse reference genome (GRCh38 and GRCm39) using the corresponding transcriptome annotation files: Human GRCh38 (GENCODE v44/Ensembl 110 annotations) and Mouse GRCm39 (GENCODE vM33/Ensembl 110 annotations). The HBV-infected sample were aligned to the HBV D genome (AF411411.1 GI:15778332). The Raw gene-barcode matrices from Cell Ranger were used for downstream analysis in R using the Seurat package (version 4.3.0). Matrices were imported using the Read10×() and CreateSeuratObject() functions. Quality control filtering was performed independently for each sample using the following criteria: nFeature_RNA > 200, nFeature_RNA < 5000, nCount_RNA < 50000, and <12.5% mitochondrial genes. Gene expression data were normalized using the NormalizeData() function with the “LogNormalize” method. Data integration across samples was performed with FindIntegrationAnchors() and IntegrateData(). Clustering was done using FindClusters() (resolution = 0.5), and dimensional reduction was achieved via principle component analysis (PCA) and uniform manifold approximation and projection (UMAP). Differentially expressed genes (DEGs) were identified using FindMarkers(). Genes with P < 0.05 and an average absolute fold change > 1.5 were considered significant.
2.14 Identification of HBV-infected single cells
To identify HBV-infected single cells, we used STAR (v2.7.10b) to map all snRNA sequences from each sample to the HBV genome. Mapped reads were extracted using samtools (v1.16.1), and the corresponding barcode sequences were identified using seqkit (v2.3.0). The HBV read count for each barcode was calculated to distinguish HBV-infected and uninfected single cells for subsequent comparative analysis.
2.15 Hallmark pathway analysis
To explore pathway differences between HBV-infected and uninfected single-cell subpopulations, hallmark pathway analysis was performed using the Molecular Signatures Database (MSigDB) Hallmark gene sets. Gene Set Enrichment Analysis (GSEA) was performed using the GSEA() function from the clusterProfiler R package (v4.6.2), with default parameters. The Hallmark gene sets were obtained from the Molecular Signatures Database (MSigDB). Genes were ranked by average log2 fold change between different cell groups. Enrichment scores (ES), nominal P-values, and false discovery rate (FDR) q-values were calculated according to the standard GSEA procedure. Pathways with FDR < 0.25 and nominal P < 0.05 were considered significantly enriched.
3 Results
3.1 Human hepatocytes engraftment in URG mice
The experimental design is illustrated in Figure 1A. URG mice were transplanted with human hepatocytes, resulting in serum hALB levels rising to 1.58-3.76 mg/mL at 0 d.p.i. (56 days post-transplantation) and then gradually declining (Figure 1B). No significant differences in the liver function biomarker ALT were observed among URG, Hu-URG, and HBV-hu-URG mice (Figure 1C). Immunohistochemical staining performed at 91 d.p.i. revealed that human hepatocytes in Hu-URG mice were positive for hALB (Figure 1D). Histological analysis further demonstrated that human hepatocytes (H) could be easily distinguished from mouse hepatocytes (M) based on their paler color and larger size (Figure 1E).
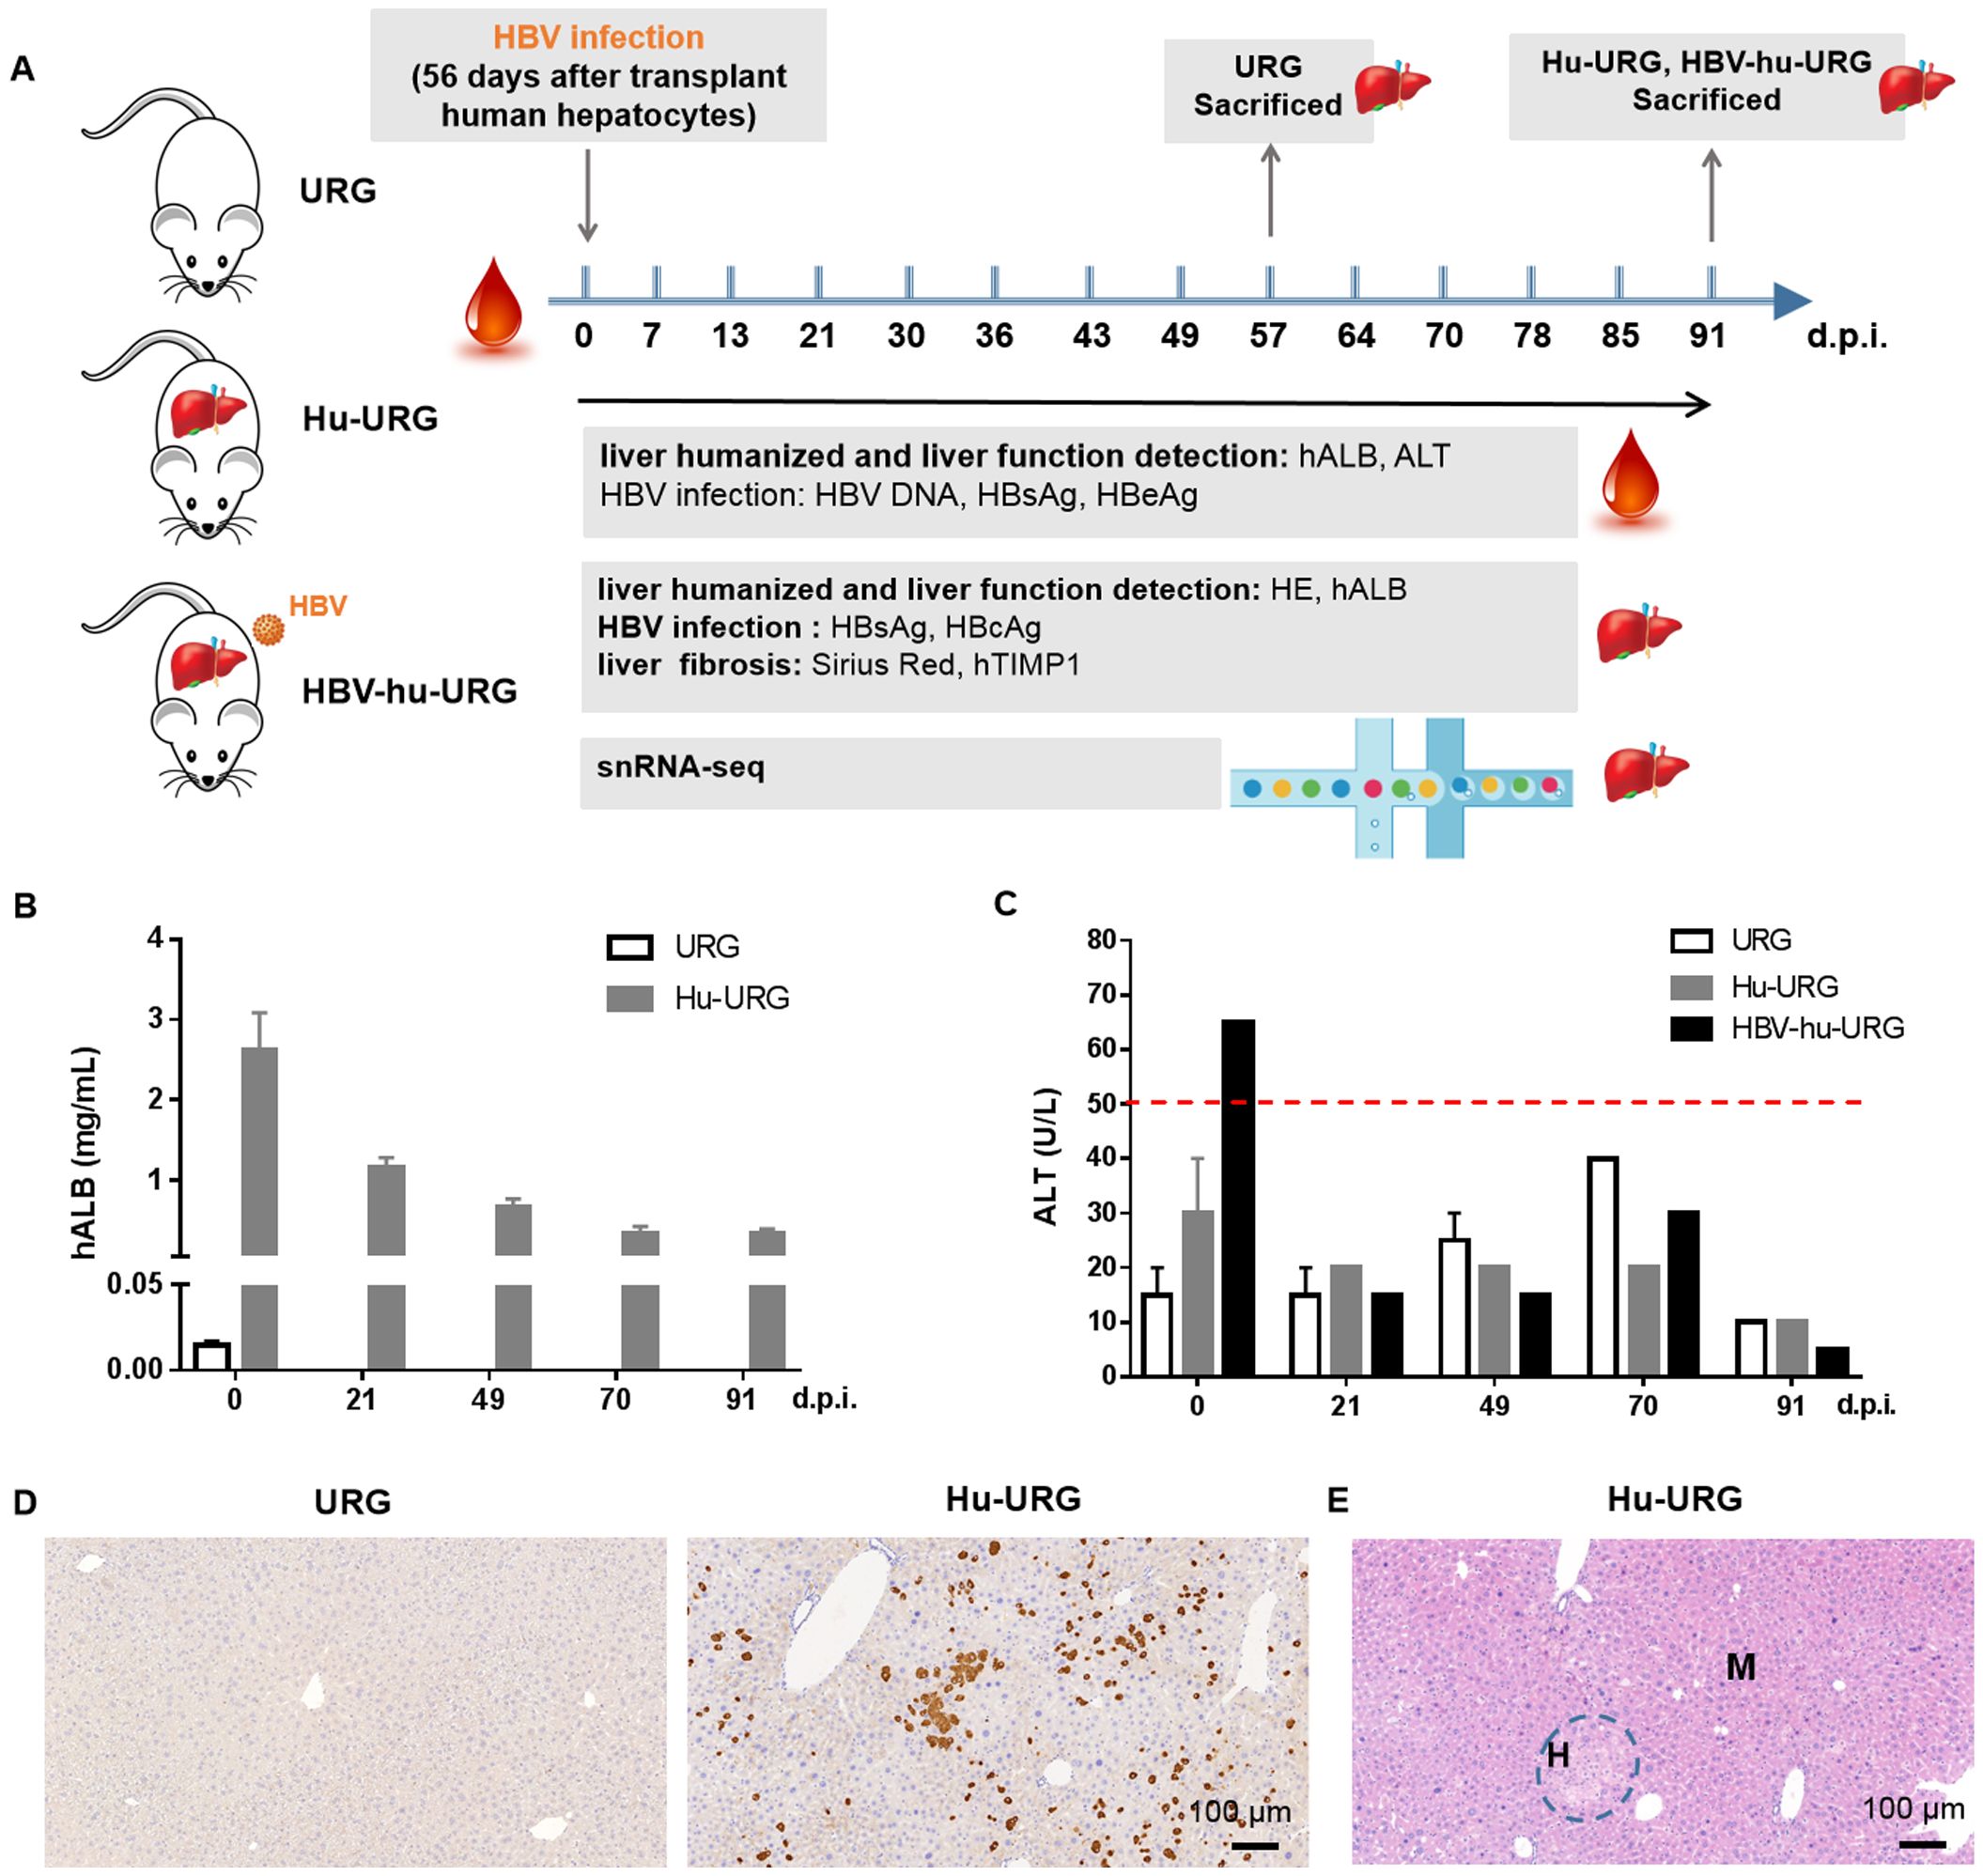
Figure 1. URG mice support engraftment of human hepatocytes in the liver. (A) Schematic representation of the experimental design and analysis. URG mice were transplanted with human hepatocytes to establish humanized liver mice, followed by HBV infection to generate HBV-infected mice. Serum samples were collected to assess liver humanization, liver function, and HBV infection. The mice were subsequently sacrificed, and liver sections were stained to evaluate liver humanization, liver function, HBV infection, and liver fibrosis. Liver tissue nuclei were extracted and used for snRNA-seq. (B) Serum hALB levels were measured in URG (n=2) and Hu-URG (n=4) mice at various d.p.i. Data are presented as the mean ± SEM. (C) Serum ALT levels were measured in URG (n=2), Hu-URG (n=2), and HBV-hu-URG (n=2) at various d.p.i. Data are presented as the mean ± SEM. (D) Representative liver samples from URG (n=2) and Hu-URG (n=4) were subjected to IHC staining for human albumin (Scale bar = 100 μm). (E) H&E staining of liver samples from Hu-URG mice. Human hepatocytes (H) and mouse hepatocytes (M) areas are indicated (Scale bar = 100 μm).
3.2 HBV infection in Hu-URG mice
56 days after human hepatocyte transplantation (0 d.p.i.), Hu-URG mice were inoculated with 8×10⁸ HBV genome equivalents (genotype D) collected from HepAD38 supernatants. Chronic HBV infection was successfully established in all mice. HBV DNA was detected in serum samples from 7 to 91 d.p.i., with viral titers progressively increasing to 1.2×10⁶ IU/mL by 91 d.p.i. (Figure 2A). Serum HBsAg and HBeAg levels increased to 53 IU/mL and 13 IU/mL, respectively (Figure 2B). Liver samples collected from URG, Hu-URG, and HBV-Hu-URG mice sacrificed between 57 and 91 d.p.i. were analyzed. As shown in Figure 2C, HBsAg and HBcAg were expressed in the livers of HBV-Hu-URG mice.
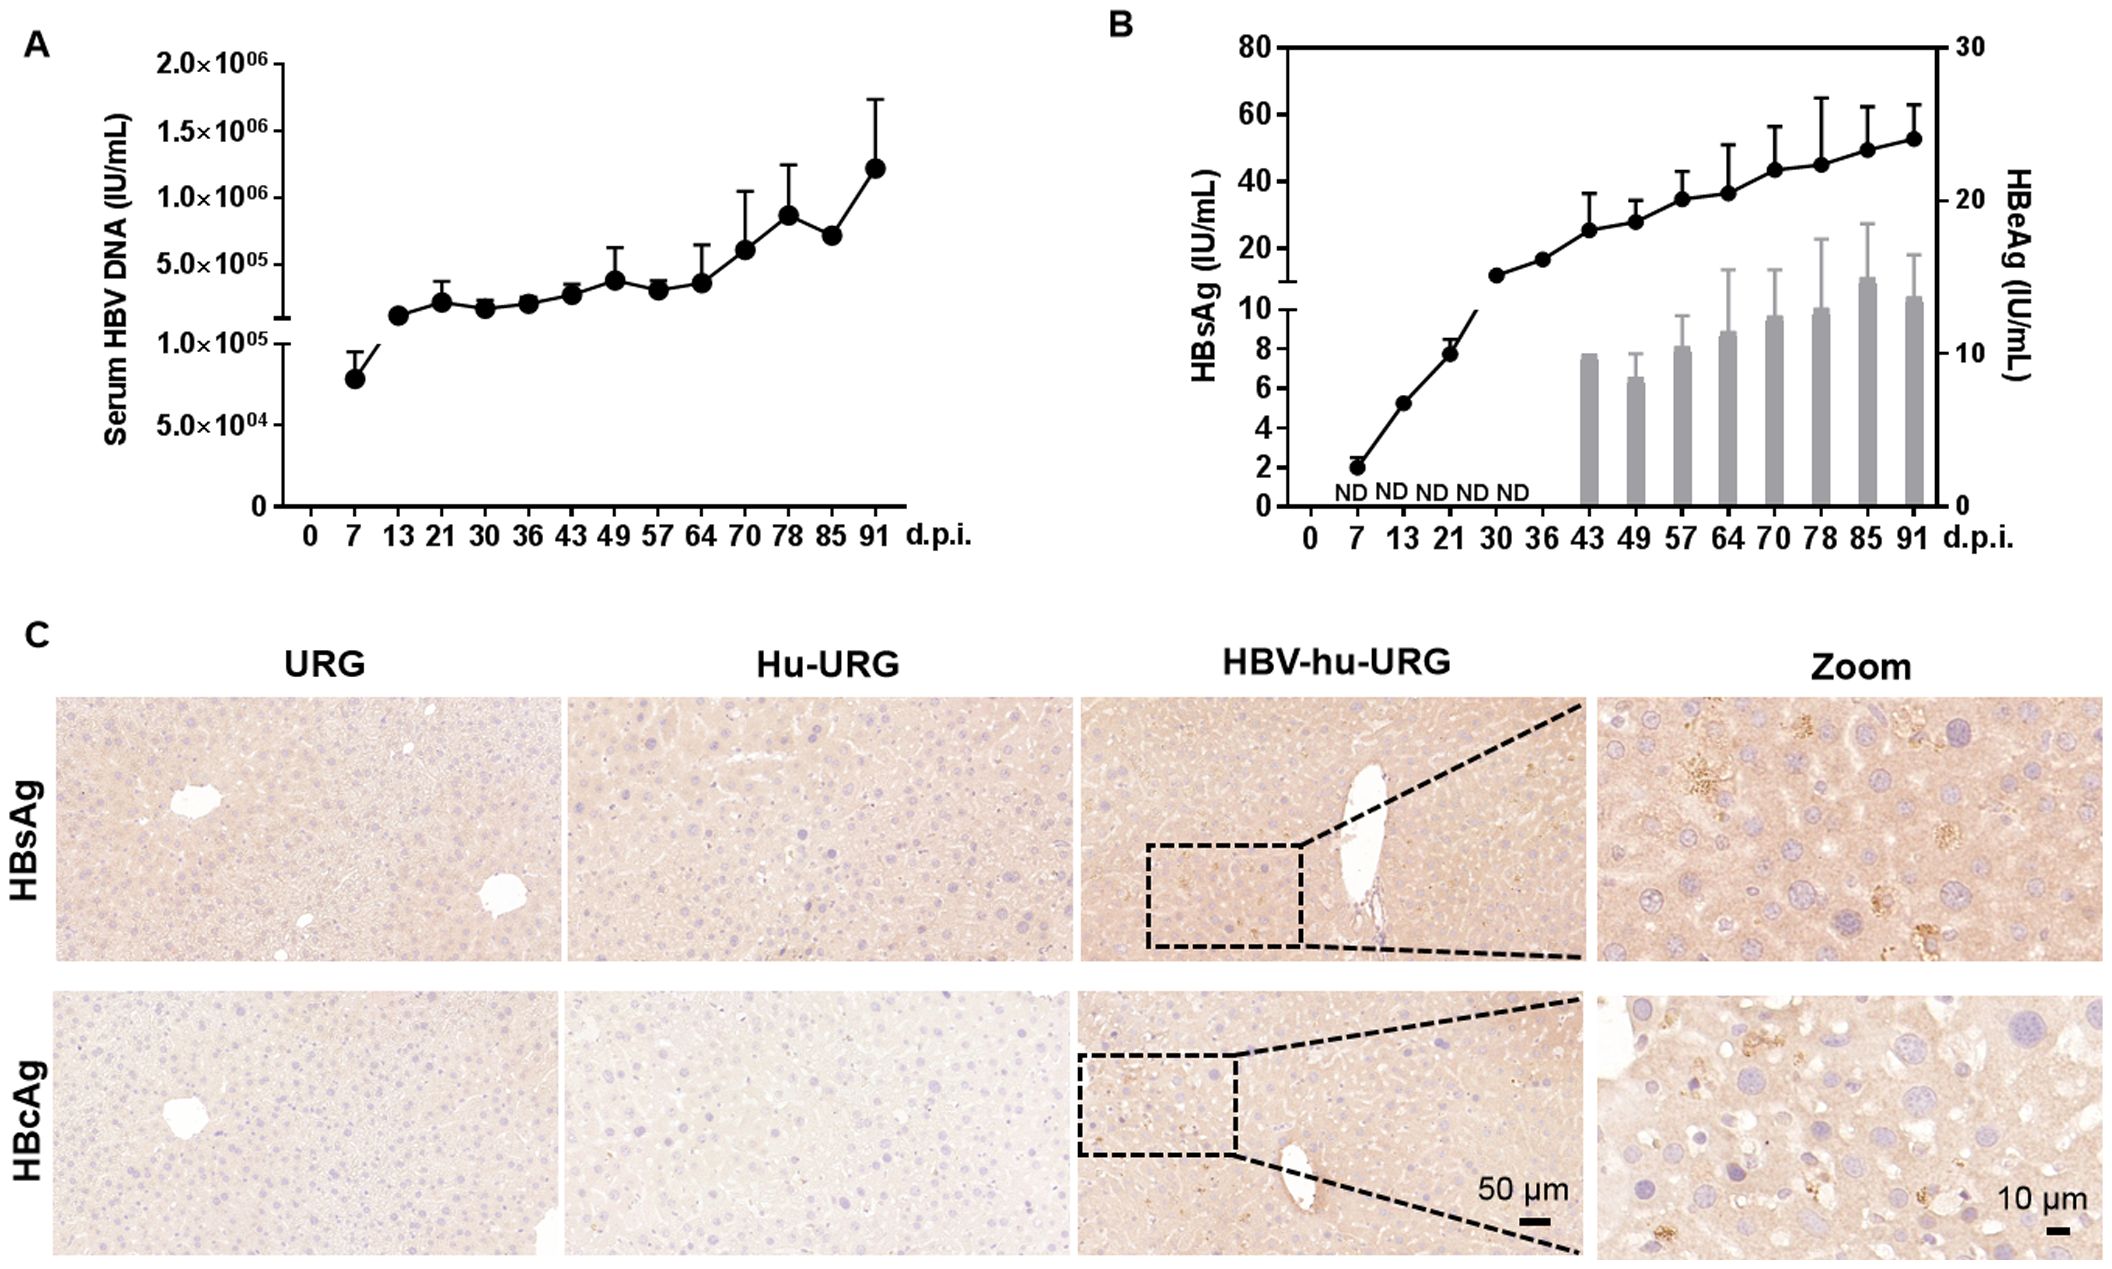
Figure 2. HBV infection in Hu-URG mice. Hu-URG (n=2) mice were inoculated with HBV (genotype D, 8×10⁸ HBV genome equivalents). Serum samples were collected at various d.p.i. Liver samples were collected at termination time points (57–91 d.p.i.). (A) Serum HBV genomic DNA was examined in HBV-infected Hu-URG mice at various time points post infection. Data are presented as the mean ± SEM. (B) HBsAg and HBeAg levels in serum were measured at various time points post infection. ND: not detectable. Data are presented as the mean ± SEM. (C) Representative liver samples from URG, Hu-URG and HBV-hu-URG mice were subjected to immunohistochemical staining for HBsAg and HBcAg (Scale bars = 50 μm and 10 μm, see images).
3.3 Single-nucleus resolution identifies and distinguishes HBV-induced differences in human and mouse cells
To investigate the pathogenic mechanisms underlying HBV infection progression, we performed snRNA-seq analysis on liver samples from URG, Hu-URG, and HBV-hu-URG mice. A total of 55,398 single nuclei were obtained (11,838 from URG, 16,680 from Hu-URG, and 26,880 from HBV-hu-URG). UMAP visualization of the combined data revealed 27 distinct cell clusters (Figures 3A, B). Clustering analysis successfully identified human and mouse hepatocyte populations based on species-specific gene expression patterns. Specifically, clusters 9, 16, and 23 were classified as human hepatocytes, characterized by the high expression of human genes such as MALAT1, NEAT1, ALB, TIMP1, FTH1, RPL13, as well as mitochondrial genes involved in oxidative phosphorylation. In contrast, other clusters exhibited high expression of mouse-specific genes, including Alb, Apoe, Apoa2, and Ttr, indicating that these clusters represented mouse hepatocytes (Figure 3C). The proportions of human cells in Hu-URG and HBV-Hu-URG mice were 2.218% and 10.145%, respectively (Figure 3D), demonstrating successful engraftment and a notable expansion of human hepatocytes following HBV infection.
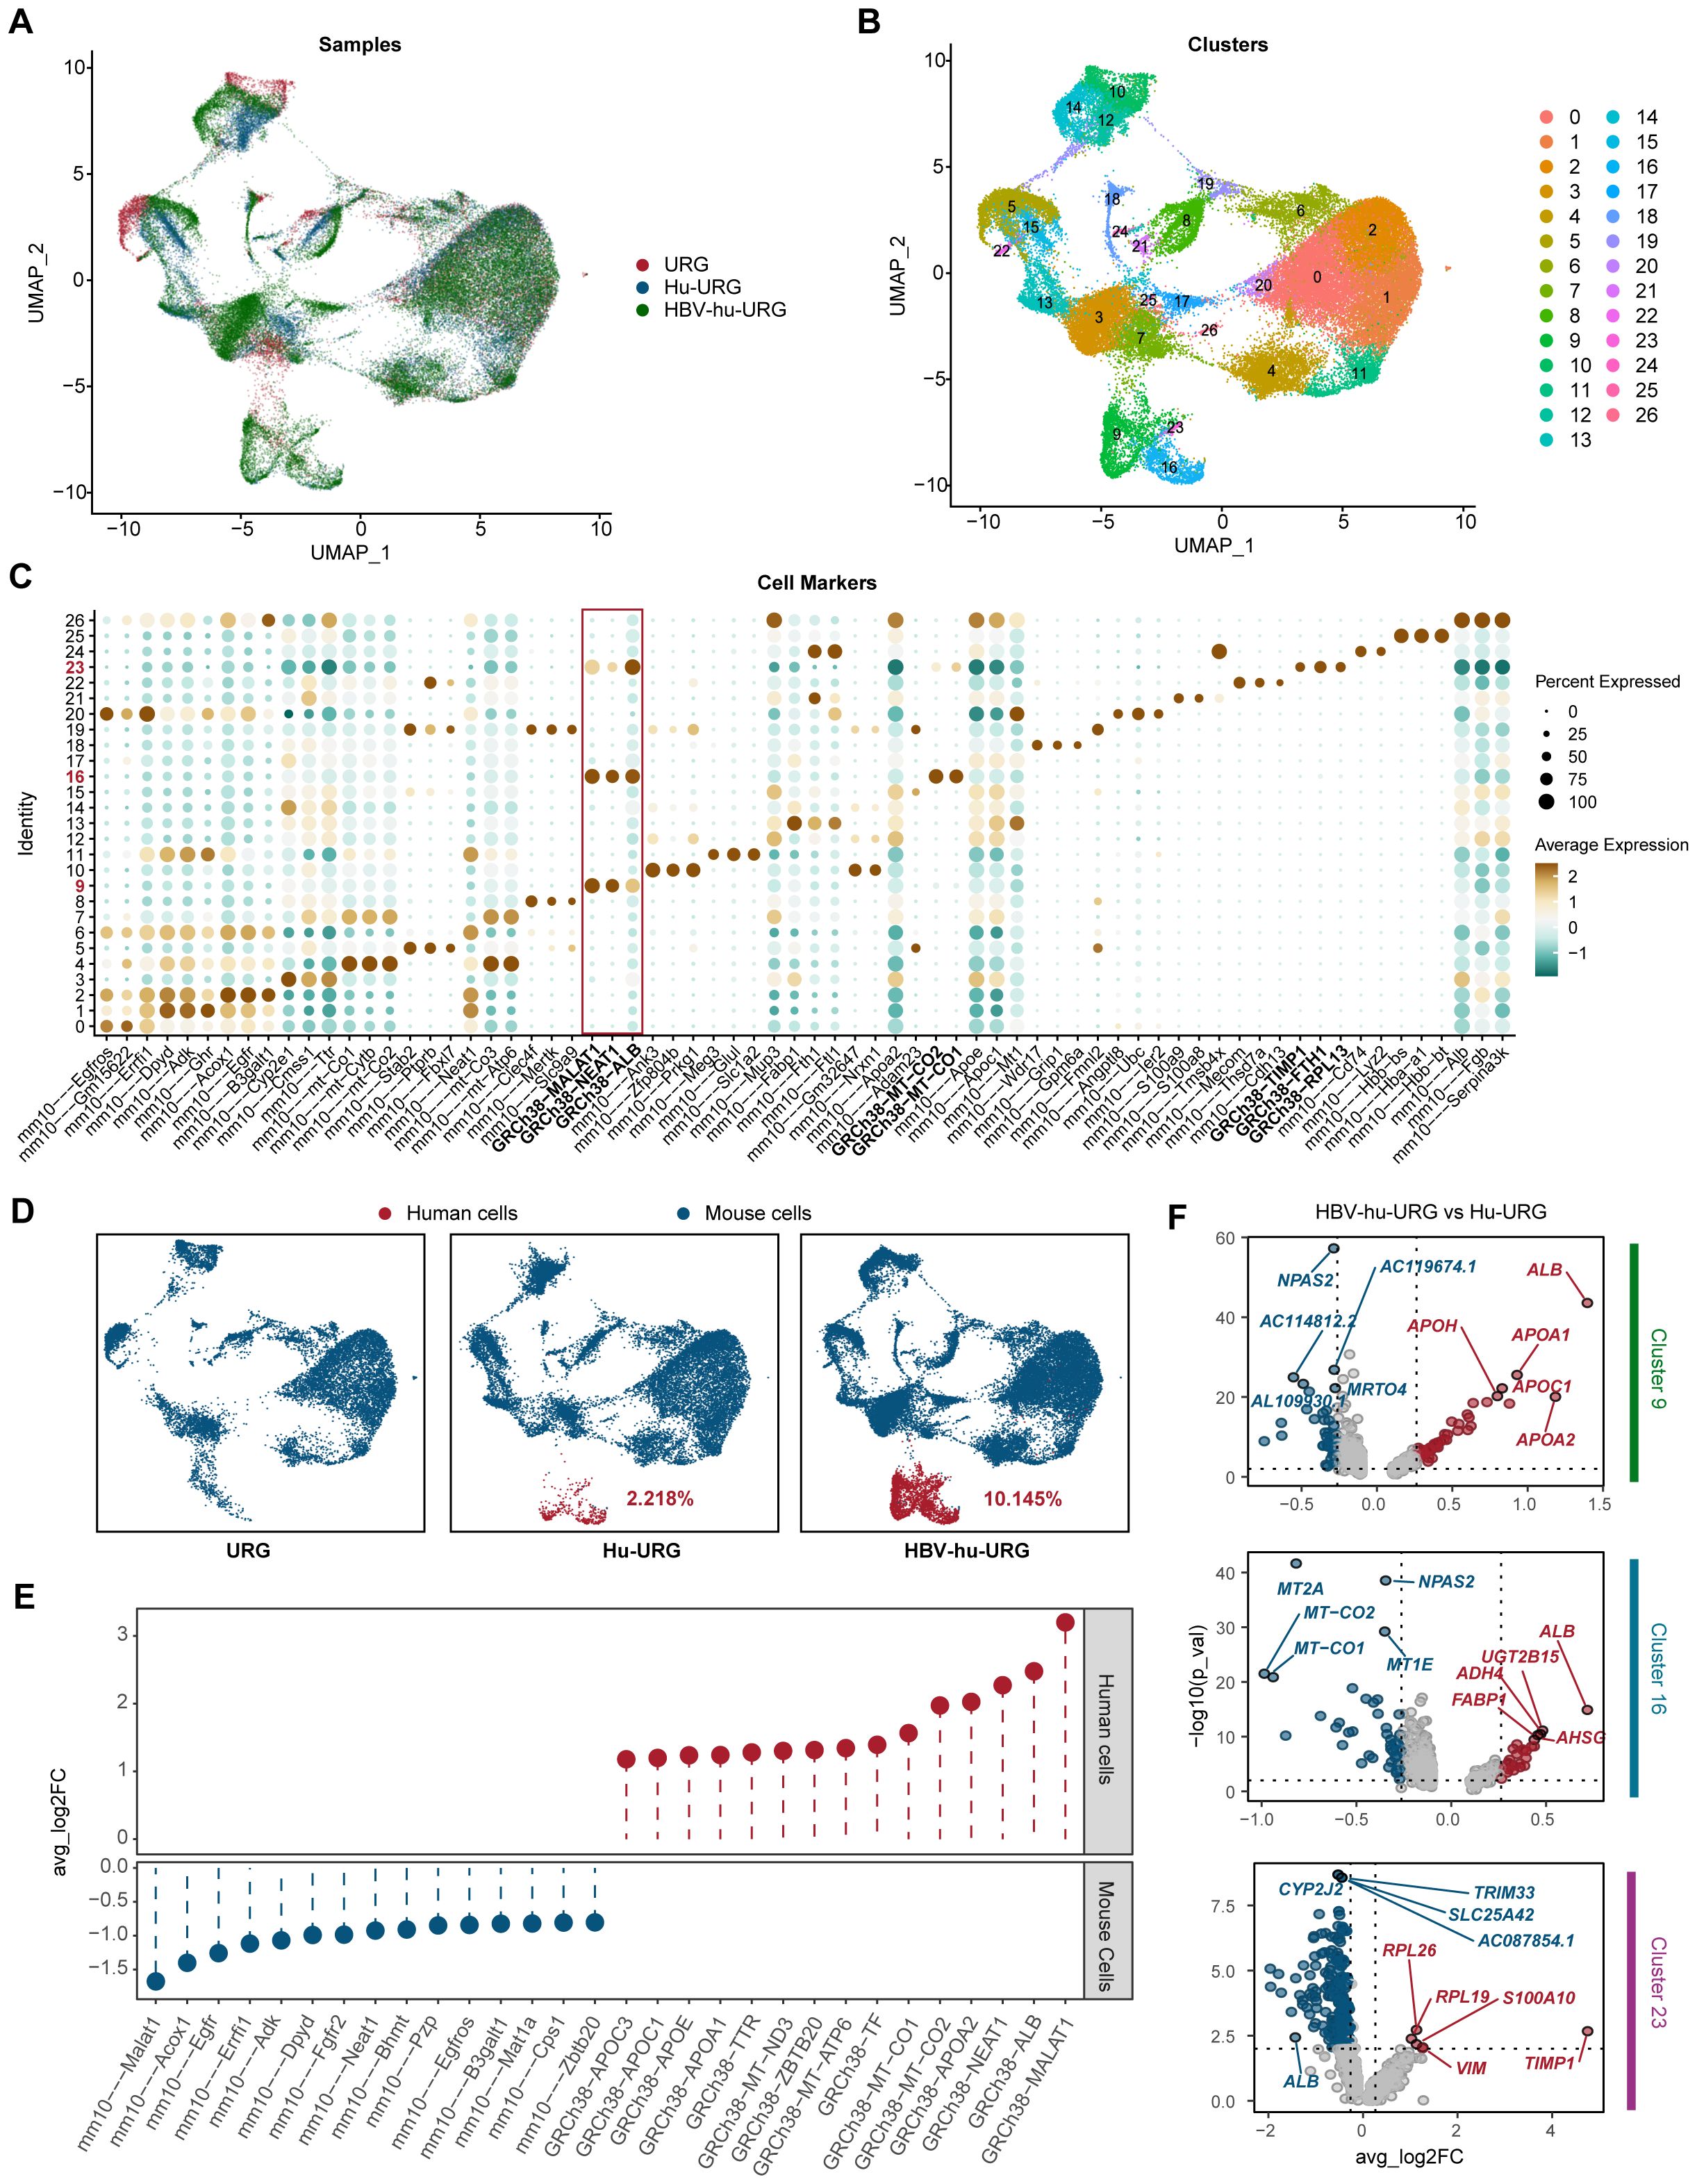
Figure 3. snRNA-seq identifies human and mouse populations in URG, Hu-URG and HBV-hu-URG mouse livers. (A) UMAP projection of combined snRNA-seq data from URG (red), Hu-URG (blue), and HBV-hu-URG (green). Each dot represents a single nucleus, and the clustering pattern reflects transcriptional similarities between cells from different groups. (B) UMAP plot showing clustering analysis of snRNA-seq data. Each cluster represents a transcriptionally distinct cell population. (C) Dot plot showing expression patterns of cell markers across the identified clusters. The x-axis lists marker genes, while the y-axis shows cluster identity. The size of each dot reflects the percentage of cells within the cluster expressing the gene, and the color intensity represents the average expression level. The red box highlights human-specific markers, which are predominantly enriched in human hepatocyte clusters. (D) UMAP plots showing the proportion of human and mouse cells in URG, Hu-URG, and HBV-hu-URG samples. Human cells (red) and mouse cells (blue) are shown. (E) Differential expression analysis between human and mouse cells showing genes with significant upregulation in human (red) and mouse (blue) hepatocytes. (F) Volcano plots showing DEGs in human hepatocytes between HBV-hu-URG and Hu-URG samples across clusters 9, 16, and 23. Red dots represent significantly upregulated genes, and blue dots represent downregulated genes.
To further explore the impact of HBV infection at the single-cell level, we first compared gene expression between human and mouse hepatocytes to establish species-specific transcriptional profiles. Human cells exhibited significantly higher expression of MALAT1, ALB, NEAT1, and APOA2, consistent with their role in human-specific liver functions. In contrast, mouse cells exhibited high expression of Malat1, Acox1, Egfr, Errfi1, and Adk, confirming expected species-specific differences (Figure 3E). We then compared gene expression within human cells (clusters 9, 16, and 23) between Hu-URG and HBV-hu-URG mice. In clusters 9 and 16, genes involved in lipid metabolism and liver function, particularly ALB, were significantly upregulated in HBV-infected cells, suggesting that HBV infection promotes metabolic reprogramming and adaptation. In contrast, cluster 23 exhibited a distinct transcriptional profile characterized by low expression of ALB and elevated expression of pro-fibrotic and inflammatory genes, including TIMP1 and S100A10. This unique expression pattern in cluster 23 indicates a shift toward a fibrosis-associated state, distinct from the metabolic adaptation observed in clusters 9 and 16. The increased expression of TIMP1 is particularly notable, as TIMP1 is a key regulator of extracellular matrix remodeling and liver fibrosis progression. These findings demonstrate that snRNA-seq can effectively distinguish human and mouse cell populations, define HBV-induced transcriptional changes at single-cell resolution, and uncover distinct metabolic and fibrotic responses in HBV-infected and bystander human cells. Key genes such as ALB and TIMP1 emerged as central regulators of HBV-associated metabolic reprogramming and fibrosis, highlighting potential therapeutic targets for HBV-related liver disease (Figure 3F).
3.4 Cluster-specific metabolic and fibrotic responses in HBV-infected and uninfected Cells
To investigate the transcriptional differences induced by HBV infection at the single-cell level, we first distinguished HBV-infected and uninfected cells by mapping sequencing reads to the HBV genome. We found that cluster 23 exhibited a lower HBV read count compared to clusters 9 and 16 in HBV-hu-URG mice, indicating that although this cluster contained both HBV-infected and uninfected cells, HBV-uninfected cells predominated. (Figure 4A). Further analysis revealed that the proportion of HBV-infected cells in cluster 23 was only 5.263%, which was significantly lower than in cluster 9 (8.763%) and cluster 16 (10.045%) (Figure 4B). UMAP plots further revealed four distinct clusters in the livers of Hu-URG and HBV-hu-URG mice (Figure 4C). Given the distinct behavior of cluster 23, we further analyzed transcriptional differences between HBV-infected and uninfected cells within this cluster. Genes significantly upregulated in HBV-infected cells of cluster 23 were primarily related to liver metabolic enzymes, including ALB, UGT2B17, CYP2A6, ACSM2A, AIG1, and PROE. In contrast, genes such as TIMP1, TPT1, EEF1A1, RPL3, and RPS4X were significantly more highly expressed in HBV-uninfected cells of cluster 23 (Figure 4D). Previous research has demonstrated that the abundance of most metabolic intermediates downstream of glucose is elevated during HBV infection (Zhou et al., 2021). Notably, TIMP1 was significantly upregulated in HBV-uninfected cells of cluster 23, while ALB was notably highly expressed in HBV-infected cells across clusters 9, 16, and 23 (Figure 4E).
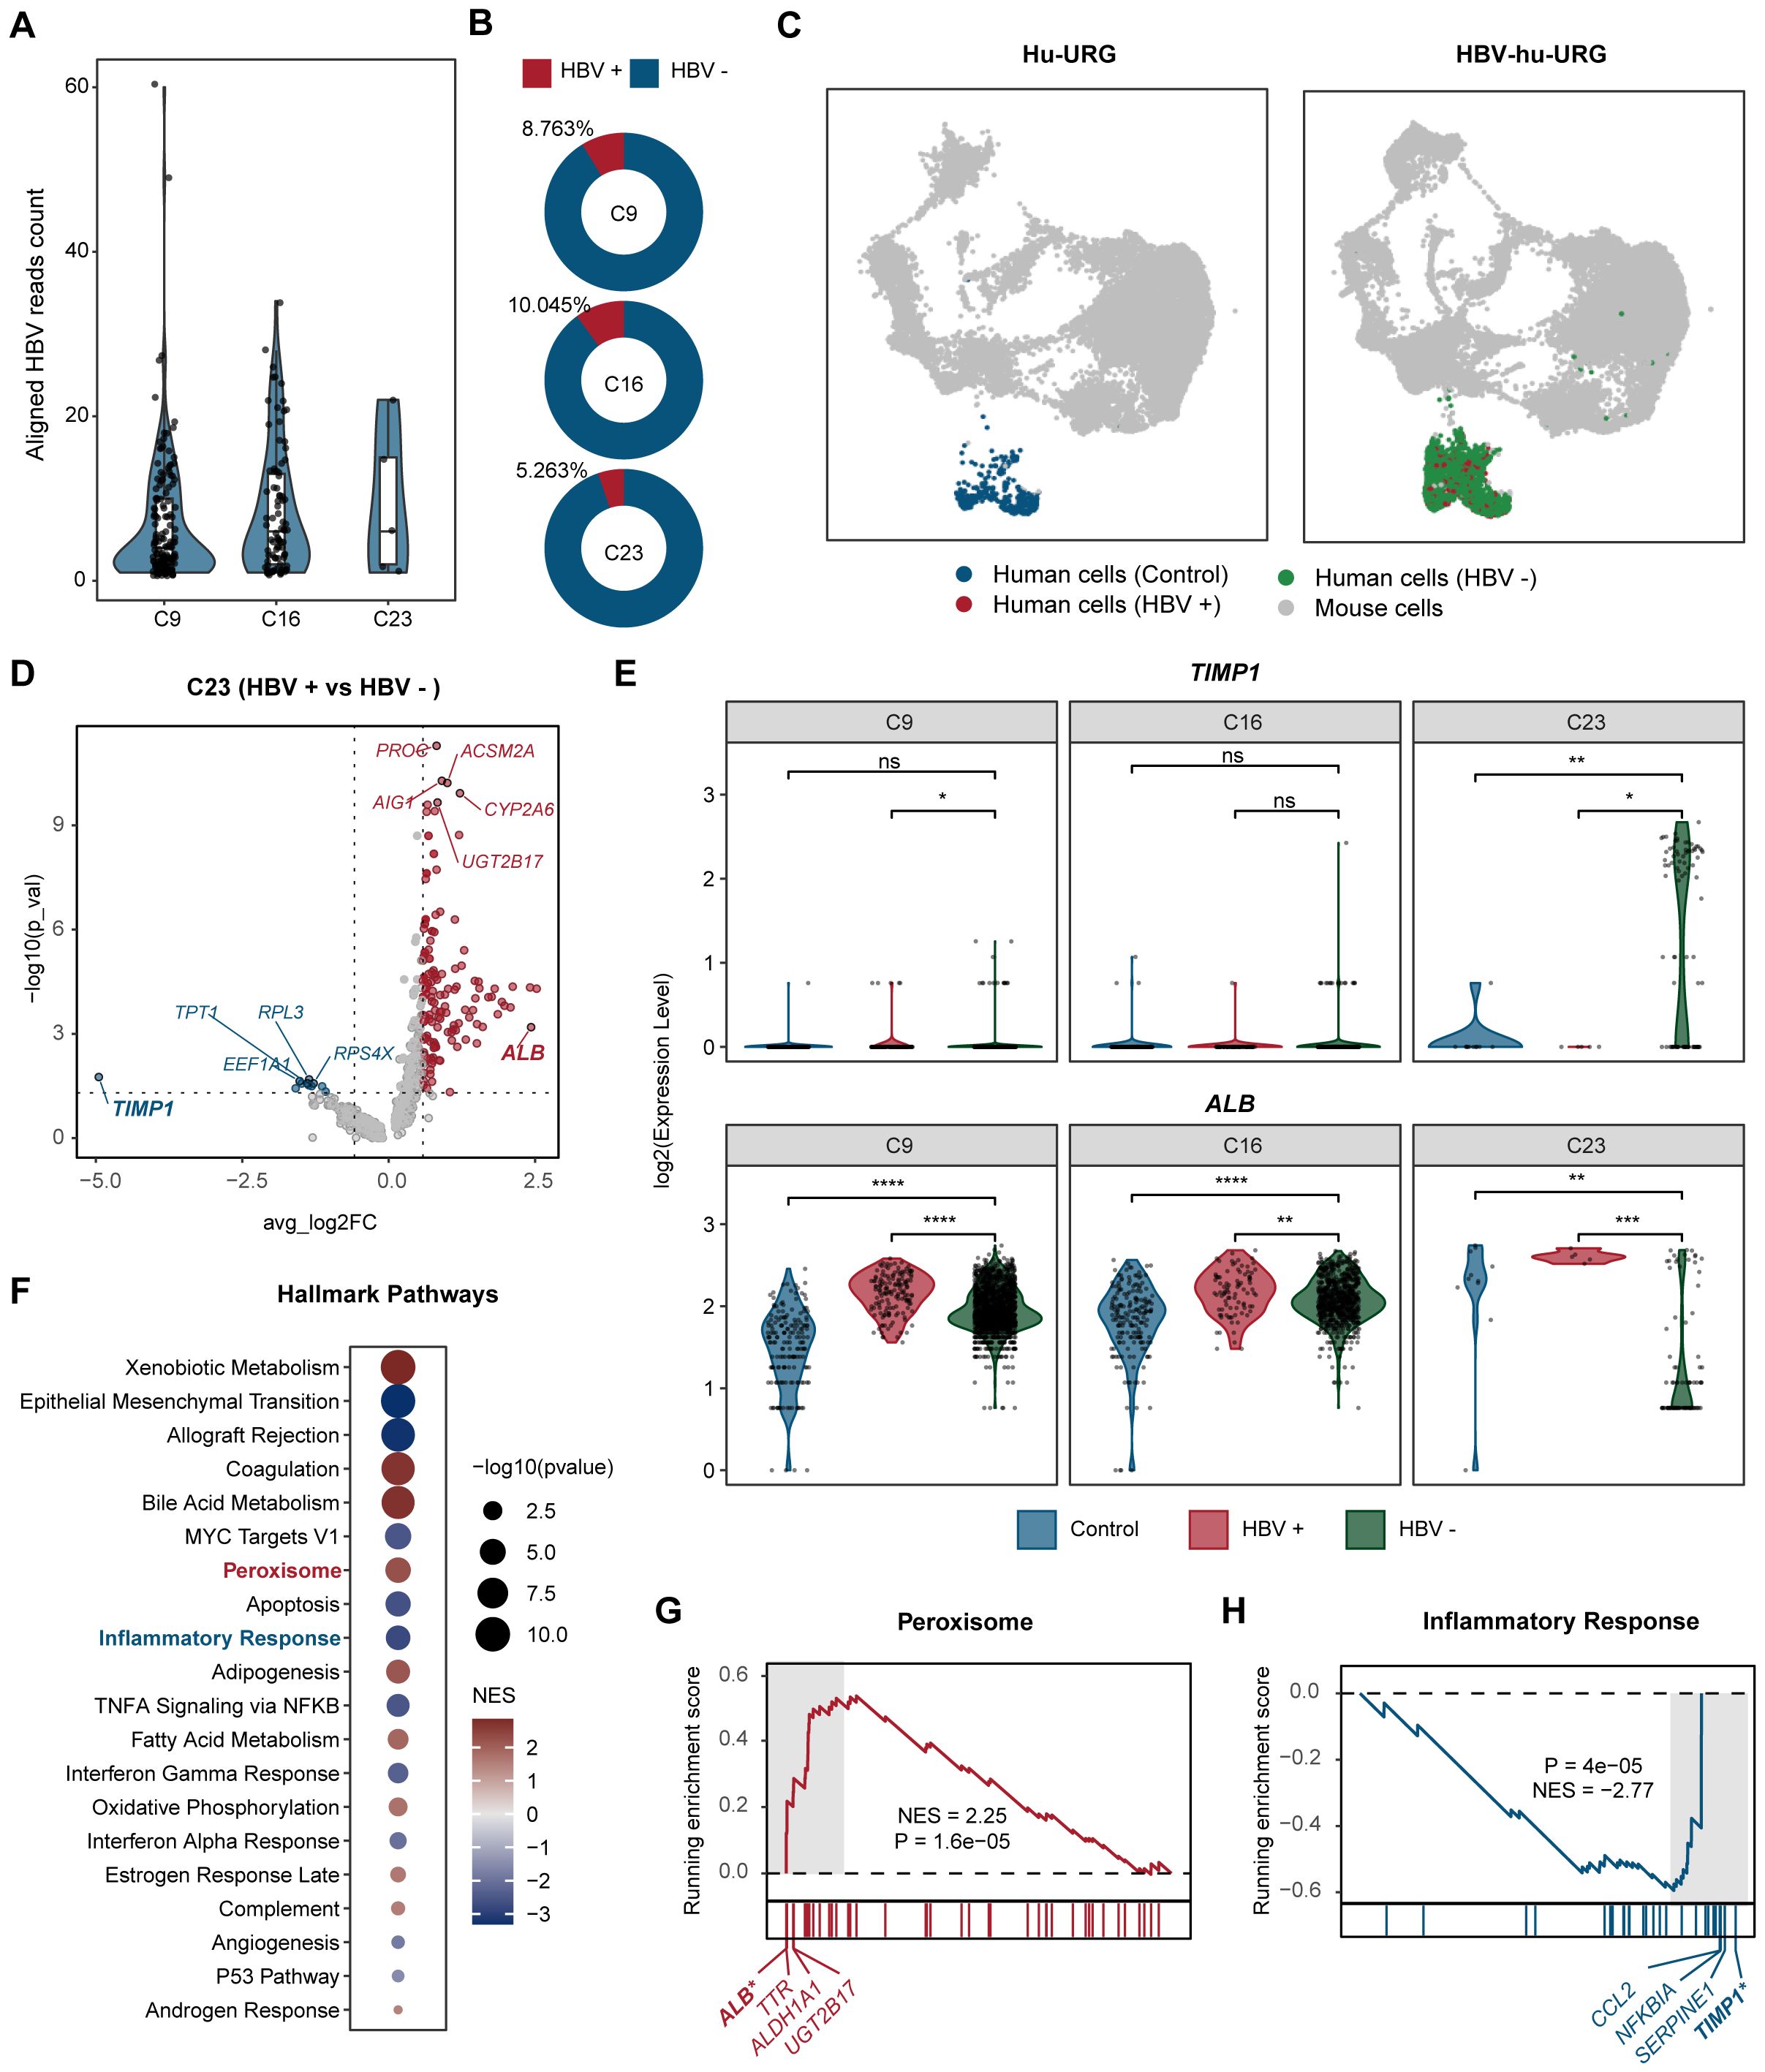
Figure 4. Comparative analysis of HBV-infected and uninfected human hepatocytes. (A) Aligned HBV read counts in clusters 9, 16, and 23 in HBV-hu-URG mice. Each dot represents a single cell. HBV read counts are significantly lower in cluster 23, suggesting a lower rate of HBV infection in this cluster. (B) Proportion of HBV-infected cells in clusters 9, 16, and 23 in HBV- hu-URG mice. (C) UMAP projection showing four distinct cell populations in Hu-URG and HBV- hu-URG, including mouse cells (gray dots), control human cells (blue dots), HBV-uninfected human cells (HBV-, green dots), and HBV-infected human cells (HBV+, red dots). (D) Volcano plot of differentially expressed genes between HBV+ and HBV- cells in cluster 23 of HBV-hu-URG mice. Genes upregulated or downregulated by more than 1.5-fold are shown in red and blue, respectively. (E) Violin plots showing TIMP1 and ALB expression in clusters 9, 16, and 23 among control (blue), HBV-infected (red), and HBV-uninfected (green) cells. (F) Hallmark pathway enrichment analysis of differentially expressed genes between HBV+ and HBV- cells in cluster 23. Dot size indicates -log10 (p-value), and color indicates normalized enrichment score (NES). (G) GSEA plot for peroxisome pathway. (H) GSEA plot for inflammatory response pathway. The p-value was calculated by the Wilcoxon test. ns, not significant, *p < 0.05, **p < 0.01, ***p < 0.001, and ****p < 0.0001.
To better understand the functional implications of these transcriptional differences, we performed hallmark pathway analysis on differentially expressed genes in HBV-infected and uninfected cells within cluster 23. Genes involved in peroxisome, bile acid metabolism, and adipogenesis were enriched in HBV-infected cells of cluster 23. In contrast, genes related to the inflammatory response and epithelial-mesenchymal transition were more prominent in HBV-uninfected cells of cluster 23, suggesting that these cells may adopt a pro-fibrotic and inflammatory phenotype, potentially triggered by a paracrine or bystander effect from neighboring HBV-infected cells of cluster 23 (Figure 4F). Specifically, peroxisome pathway showed marked activation (NES= 2.25, P=1.6 e-05) and the related genes such as ALB, TTR, ALDH1A, and UGT2B17 were upregulated in HBV-infected cells of cluster 23 (Figure 4G). Conversely, inflammatory response pathways were strongly suppressed (NES=-2.77, P=4e-05) and the genes like TIMP1, SERPINE1, NFKBIA, and CCL2 were more highly expressed in HBV-uninfected cells of cluster 23 (Figure 4H).
These findings suggest that HBV infection enhances cellular metabolism to support viral replication, while neighboring uninfected cells respond by activating fibrotic and inflammatory pathways. The contrasting transcriptional states of HBV-infected and uninfected cells in cluster 23 highlight the complex host-virus interactions that may drive HBV-associated liver fibrosis and metabolic reprogramming.
3.5 hTIMP+ HBsAg- hALBlow human hepatocytes in HBV-hu-URG mouse after HBV infection and liver fibrosis
To validate the snRNA-seq findings, liver samples from URG, Hu-URG, and HBV-hu-URG mice sacrificed 57–91 d.p.i. were analyzed using picrosirius red staining to assess liver fibrosis. Compared to URG and Hu-URG mice, HBV-hu-URG mice exhibited significant collagen accumulation (Figure 5A). Image J analysis revealed that the percentage of fibrosis-positive areas was 0.405% in URG mice, 0.326% in Hu-URG mice, and 0.931% in HBV-Hu-URG mice (Figure 5B). Multiple immunofluorescence analysis of Hu-URG and HBV-hu-URG mouse livers showed that HBV-uninfected (HBsAg-) cells had significantly higher expression of hTIMP1(Figure 5C). These cells were confirmed to be human hepatocytes, as indicated by the hepatocyte marker hALB (hALB+) (Figure 5D). Notably, these HBsAg- hTIMP1+ hALB+ hepatocytes exhibited significantly lower expression of hALB (hALBlow) (Figures 5E, F), suggesting that HBV-uninfected human hepatocytes are more likely to express hTIMP1, potentially contributing to liver fibrosis, while simultaneously reducing hALB expression. Through Ki67 immunofluorescence analysis, we further revealed that the proliferative capacity of HBV-infected human hepatocytes was higher than that in the uninfected Hu-URG group (Supplementary Figure 1).
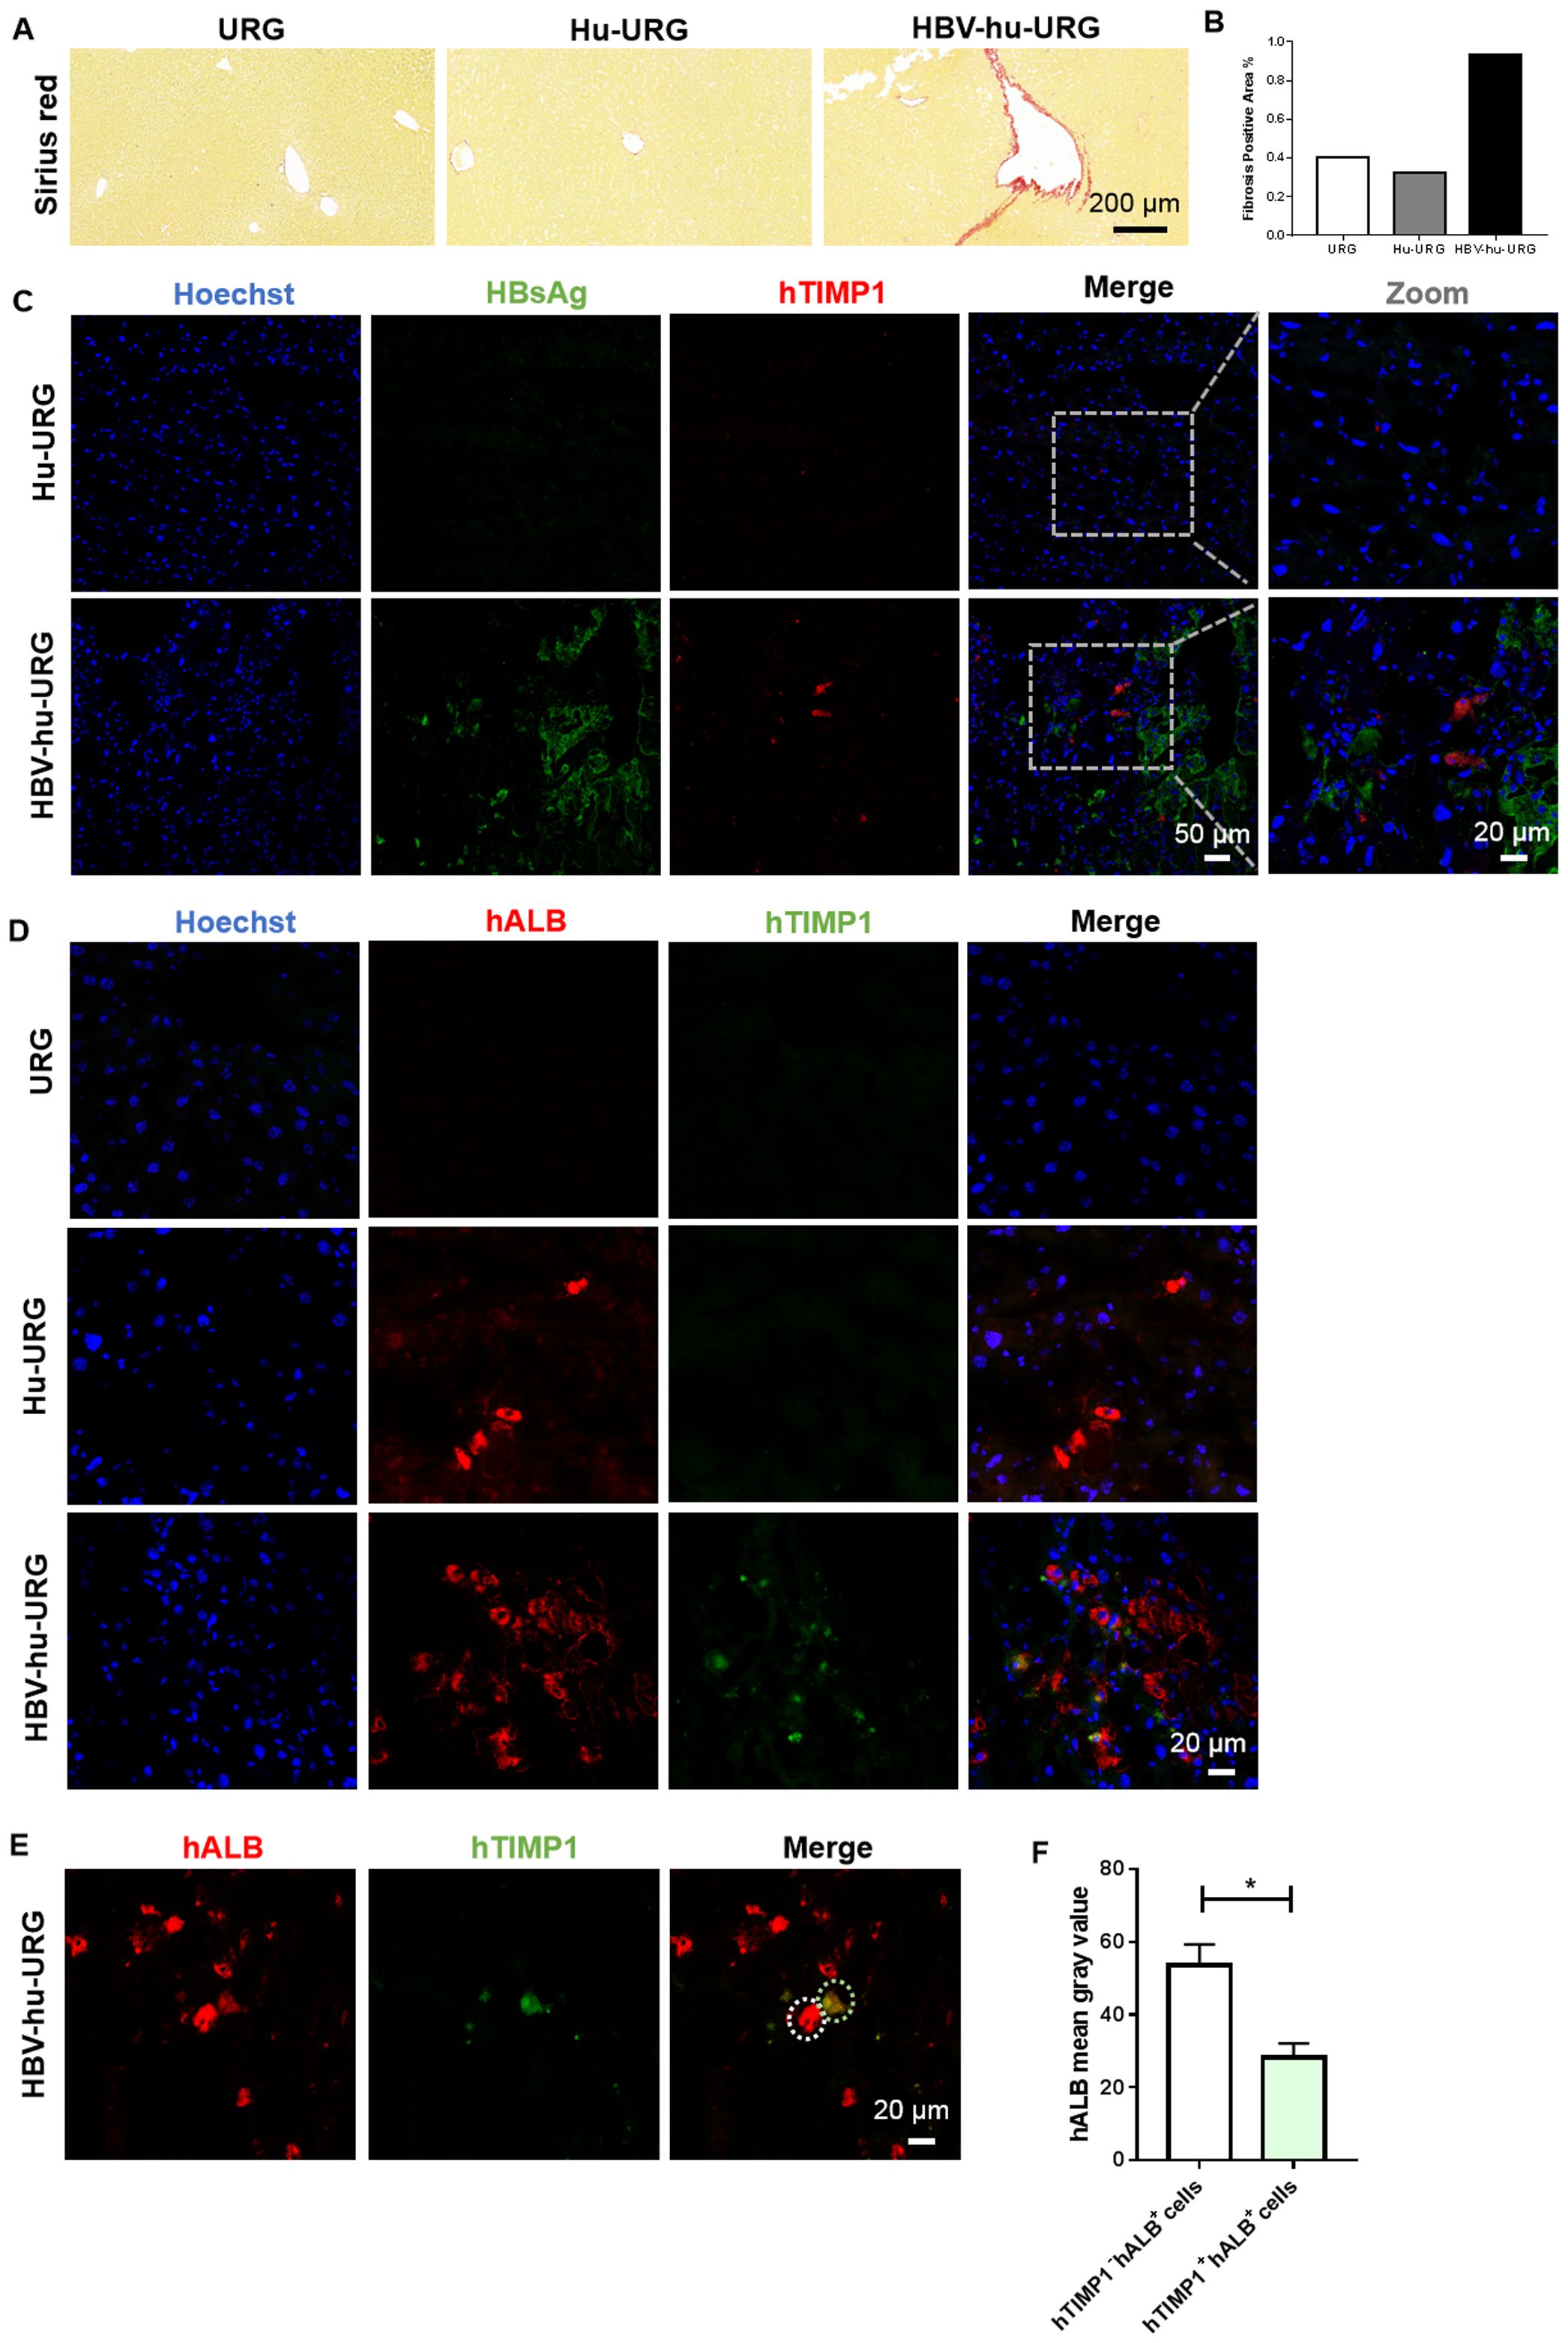
Figure 5. Picrosirius Red staining of liver fibrosis and IF staining verified hTIMP1+HBsAg- hALBlow human hepatocytes in HBV-hu-URG mice. (A) Picrosirius Red staining of liver samples from URG, Hu-URG, and HBV-hu-URG mice (Scale bar = 200 μm). (B) Analysis of fibrosis area using Image (J) (C) IF images of hTIMP1(red), HBsAg (green), and Hoechst (blue) in Hu-URG and HBV-hu-URG mice (Scale bars = 50 μm and 20 μm, see images). (D) IF images of hTIMP1 (green), hALB (red) and Hoechst (blue) in URG, Hu-URG, and HBV-hu-URG mice (Scale bar = 20 μm). (E) IF images of hTIMP1 (green) and hALB (red) in HBV-hu-URG mice. White circle: hTIMP1- hALB+ cell; green circle: hTIMP1+ hALB+ cell (Scale bar = 20 μm). (F) hALB levels of hTIMP1- hALB+ cells (n= 6) and hTIMP1+ hALB+ cells (n= 4) analyzed using Image (J) Data are presented as the mean ± SEM. *p<0.05.
3.6 hTIMP+HBsAg- hepatocytes in chronic HBV patient
To determine whether the observations in mice were relevant to human disease, we examined FFPE liver specimens from chronic HBV patients. Similar to the humanized mouse model, HBsAg- or HBcAg- cells in human liver tissue also exhibited significantly higher expression of hTIMP1 (Figures 6A, B). These cells were confirmed to be hepatocytes (hALB+) (Figure 6C). We identified hTIMP1-positive and HBsAg-negative hepatocytes in the liver tissue of chronic HBV patient, indicating a similar pattern to that observed in the humanized mouse model. Together, these results illustrate that HBV-uninfected human hepatocytes exhibit high expression of hTIMP1, whereas HBV-infected human hepatocytes show high expression of hALB (Figure 6D).
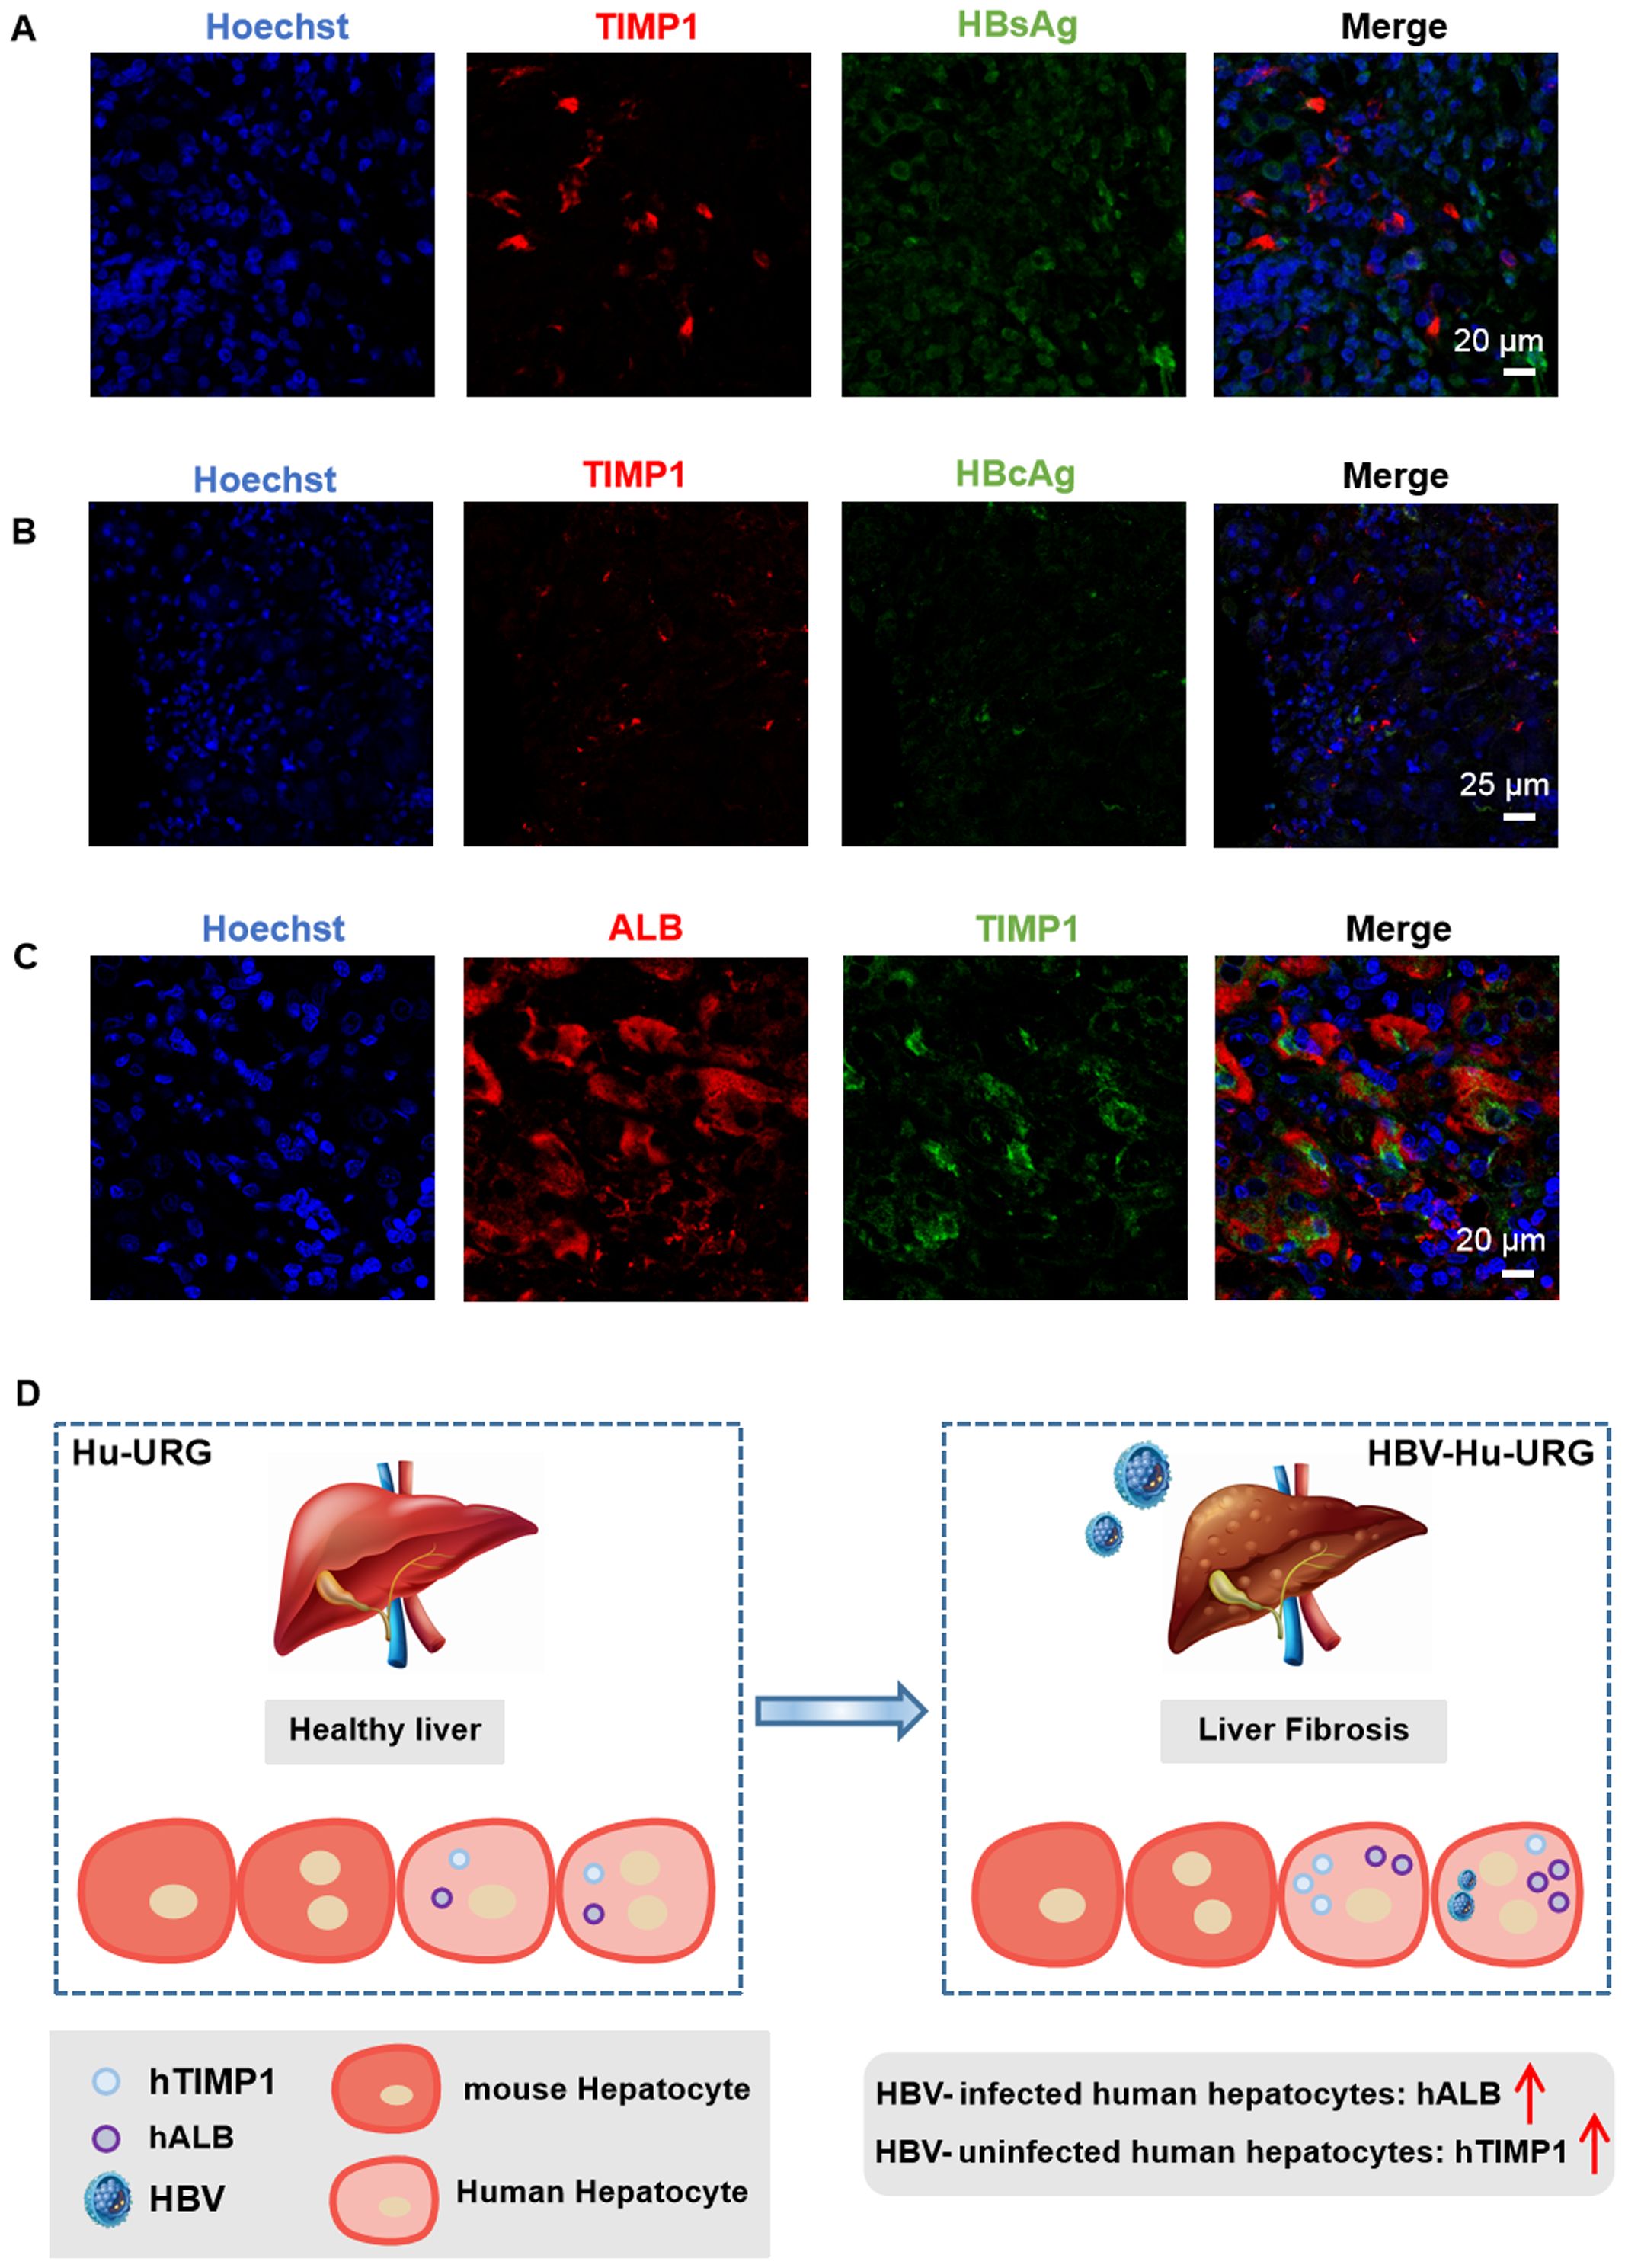
Figure 6. IF staining verified hTIMP1+ HBsAg- hepatocytes in HBV patient. (A) IF images of hTIMP1 (red), HBsAg (green), and Hoechst (blue) (Scale bar = 20 μm). (B) IF images of hTIMP1 (red), HBcAg (green), and Hoechst (blue) (Scale bar = 25 μm). (C) IF images of hALB (red), hTIMP1 (green), and Hoechst (blue) (Scale bar = 20 μm). (D) Differential expression of hTIMP1 and hALB in HBV-uninfected and infected human hepatocytes.
4 Discussion
This study leverages the novel Hu-URG mouse model combined with snRNA-seq to elucidate the intricate interplay between HBV infection, host metabolic reprogramming, and fibrosis progression. The Hu-URG model, characterized by a relatively high chimerism rate (20-95%) through Tet-On system-driven inducible human hepatocyte repopulation, effectively bridges the gap between murine studies and human pathophysiology by replicating clinical HBV-infected liver tissue signatures (Song et al., 2009; Lai et al., 2021). It has been documented that snRNA-seq shown advantages and performs better than scRNA-seq in hepatocyte sequencing. The methodology of applying snRNA-seq in HBV infected Hu-URG mouse model provide the ability to distinguish between infected and bystander hepatocytes at single-cell resolution, which addresses a critical need in virology, where heterogeneous cellular responses often obscure mechanistic interpretations (Alvarez et al., 2022; Andrews et al., 2022).
Our findings revealed significant upregulation of metabolic enzymes such as ALB, UGT2B17, CYP2A6, and ACSM2A in HBV-infected hepatocytes, aligning with previous research on HBV-induced metabolic reprogramming. Specifically, HBV’s impact on lipid and glucose metabolism is evident through impaired triglyceride synthesis and reduced lipid droplet formation, as observed by Yasumoto (Yasumoto et al., 2017). Lamontagne (Lamontagne et al., 2018) further supports these findings, noting increased expression of long-chain fatty acids like myristate and palmitate in HBV-infected hepatocytes. The role of CD36 in HBV replication and subsequent fatty acid synthesis underscores this metabolic shift (Miquilena-Colina et al., 2011; Huang et al., 2017). Additionally, the upregulation of ALB and UGT2B17 highlights enhanced detoxification processes and bile acid metabolism, crucial for lipid digestion, consistent with Wang’s (Wang et al., 2018)observation of elevated liver cholesterol levels in HBV infection. Notably, UGT2B17, essential for lipid-to-carbohydrate conversion, was significantly upregulated in infected cells, with UGT2B17-deficient livers showing increased abundance of altered proteins enriched in metabolic, chemical defense, and immune-related pathways (Rouleau et al., 2025). These findings illustrate HBV’s profound impact on hepatic metabolic networks, and support previous research shown that HBV functions as a “metabolic virus,” (Bar-Yishay et al., 2011)akin to HCV’s manipulation of lipid droplets for replication (Barba et al., 1997; Vogt et al., 2013).
HBV infection and uninfected hepatocytes exhibit significant spatial heterogeneity within the liver microenvironment. Infected cells create a favorable niche for viral persistence through metabolic reprogramming, such as enhanced lipid metabolism, whereas uninfected cells display pro-inflammatory and pro-fibrotic features, with notable upregulation of genes like TIMP1, SERPINE1, and CCL2, TIMP1 plays a dual role in fibrosis progression: it inhibits extracellular matrix degradation by suppressing matrix metalloproteinases (MMPs) and activates hepatic stellate cells (HSCs) via the CD63 signaling pathway, driving collagen deposition (Zan et al., 2013; Naim et al., 2017), thereby promoting collagen accumulation and fibrogenesis. Histopathological validation in HBV-infected URG mice indeed confirmed increased collagen accumulation in these mice, correlating with higher TIMP1 expression in HBV-uninfected hepatocytes. Clinical studies indicate that serum TIMP1 levels in chronic HBV patients correlate positively with fibrosis stages, with diagnostic efficacy (AUROC>0.9) validated across multiple cohorts (Zhu et al., 2012; Zhang et al., 2021). The pro-fibrotic phenotype of uninfected hepatocytes may result from paracrine signals from infected cells or immune microenvironment remodeling. For instance, HBV X protein (HBx) induces neighboring hepatocytes to secrete TGF-β1, activating HSCs and promoting their proliferation and collagen synthesis (Guo et al., 2009; Park et al., 2015). Additionally, NKT cells and Kupffer cells in HBV infection models secrete pro-fibrotic factors like IL-13 and TGF-β1 (Jin et al., 2011; Song et al., 2021), exacerbating microenvironmental imbalance. The spatial segregation of metabolic pathways (e.g., PPAR-mediated lipid metabolism (Kim et al., 2007) and inflammatory signals between infected and uninfected regions underscores the challenge in halting fibrosis progression with current antiviral therapies.
This cellular heterogeneity may stem from HBV’s differential regulation of host transcription networks. HBx sustains lipid metabolic advantages in infected cells by activating metabolic-related transcription factors like PPAR and fosters a fibrotic microenvironment through the TGF-β1/OCT4/Nanog axis (Li et al., 2022). In HBV/HCV co-infection models, this pathway activation synergistically accelerates liver fibrosis. Moreover, some studies have suggested that hepatocytes may undergo epithelial-to-mesenchymal transition (EMT) to contribute to liver fibrosis (Zeisberg et al., 2007; Cicchini et al., 2014), the role of uninfected hepatocytes in this process remains undefined.
Identifying TIMP1 as a potential driver of liver fibrosis in HBV-infected mice highlights the complexity of host-virus interactions. While infected cells turn on supporting viral replication through metabolic reprogramming, neighboring uninfected bystander hepatocytes may promote fibrosis through elevated TIMP1 expression, which is independent of direct viral cytopathic effects. This dichotomy underscores the importance of understanding both infected and bystander cell responses in the context of viral hepatitis. This “metabolic-fibrotic” dual strategy not only aids the virus in evading immune clearance but also promotes chronic disease by remodeling the microenvironment. Although existing antiviral drugs can suppress viral replication, they fail to effectively disrupt the pathological crosstalk between infected and uninfected zones, highlighting the need for targeted microenvironmental regulation therapies.
Despite these insights, several questions remain. The Hu-URG model lacks functional immune components, precluding analysis of lymphocyte-mediated responses to HBV. Although the model cannot be extrapolated directly to immunocompetent hosts, it uniquely isolates hepatocyte-intrinsic fibrogenic mechanisms relevant to immunosuppressed HBV patients—a population with accelerated fibrosis risk. Future iterations incorporating human immune reconstitution could elucidate how metabolic changes in hepatocytes influence antiviral immunity by integration of multi-omics approaches for metabolomic, lipidomic and transcriptomic analyses. Spatial transcriptomics would help map the anatomical distribution of TIMP1-expressing bystander cells relative to infected foci, testing our hypothesis of paracrine signaling gradients. A critical limitation of this study is the absence of functional validation to delineate whether TIMP1 drives fibrosis initiation or merely reflects a secondary response to hepatic injury. Future studies should employ TIMP1 knockout or overexpression models are needed to establish causality between bystander HBV-uninfected hepatocytes and collagen deposition. Finally, the clinical correlation, while statistically significant, requires validation in larger longitudinal cohorts to assess TIMP1’s prognostic value. By dissecting HBV-host interactions at cellular and molecular levels, this work redefines our understanding of viral hepatitis pathogenesis.
In conclusion, our study offers valuable insights into the molecular mechanisms of the host-virus interactions and pathogenesis of chronic HBV infection and liver fibrosis initiation at the single cellular resolution with holistic transcriptional landscapes and metabolic reprogramming analysis. The finding that bystander hepatocytes contribute to fibrosis via TIMP1 rewiring shifts the focus of therapy from just targeting infected cells to modifying the overall hepatic microenvironment. Additionally, the metabolic weaknesses in HBV-infected hepatocytes offer potential targets for antiviral strategies. Novel avenues designed for therapeutic to disrupt viral persistence and fibrosis progression could be hence rationally derived. This study, the first to integrate humanized liver models with single-nucleus transcriptomics in HBV research, provides a framework for exploring host-pathogen interactions in other liver infections, enhancing our understanding of virology and informing precision medicine for chronic liver disease.
Data availability statement
The original contributions presented in the study are publicly available. This data can be found here: [https://ngdc.cncb.ac.cn/sso/loginservice=https://ngdc.cncb.ac.cn/gsa-human/login/ accession number: CRA025748].
Ethics statement
The studies involving humans were approved by Shanghai Public Health Clinical Center Ethics Committee. The studies were conducted in accordance with the local legislation and institutional requirements. The participants provided their written informed consent to participate in this study. The animal study was approved by Shanghai Public Health Clinical Center Ethics Committee. The study was conducted in accordance with the local legislation and institutional requirements. Written informed consent was obtained from the individual(s) for the publication of any potentially identifiable images or data included in this article.
Author contributions
XR: Conceptualization, Data curation, Formal analysis, Investigation, Methodology, Writing – original draft. CoW: Investigation, Methodology, Writing – review & editing. BQ: Writing – review & editing. HY: Investigation, Writing – review & editing. MW: Investigation, Writing – review & editing. ZZ: Resources, Writing – review & editing. WL: Resources, Writing – review & editing. ChW: Writing – review & editing. YL: Formal analysis, Methodology, Visualization, Writing – review & editing. XZha: Resources, Writing – review & editing. XZho: Conceptualization, Funding acquisition, Supervision, Writing – review & editing.
Funding
The author(s) declare financial support was received for the research and/or publication of this article. This work was funded by the National Key Research and Development Project (grant number 2023YFF0724801), Shanghai Public Health Clinical Center Project (grant number KY-GW-2021-05, KY-GW-2025-07).
Conflict of interest
The authors declare that the research was conducted in the absence of any commercial or financial relationships that could be construed as a potential conflict of interest.
Generative AI statement
The author(s) declare that no Generative AI was used in the creation of this manuscript.
Any alternative text (alt text) provided alongside figures in this article has been generated by Frontiers with the support of artificial intelligence and reasonable efforts have been made to ensure accuracy, including review by the authors wherever possible. If you identify any issues, please contact us.
Publisher’s note
All claims expressed in this article are solely those of the authors and do not necessarily represent those of their affiliated organizations, or those of the publisher, the editors and the reviewers. Any product that may be evaluated in this article, or claim that may be made by its manufacturer, is not guaranteed or endorsed by the publisher.
Supplementary material
The Supplementary Material for this article can be found online at: https://www.frontiersin.org/articles/10.3389/fcimb.2025.1654903/full#supplementary-material
Supplementary Figure 1 | IF staining of Ki67 in URG, Hu-URG and HBV-hu-URG mice. Images of hTIMP1 (red), Ki67 (green), and Hoechst (blue) (Scale bars = 25 μm).
References
Alvarez, M., Benhammou, J. N., Darci-Maher, N., French, S. W., Han, S. B., Sinsheimer, J. S., et al. (2022). Human liver single nucleus and single cell RNA sequencing identify a hepatocellular carcinoma-associated cell-type affecting survival. Genome Med. 14, 50. doi: 10.1186/s13073-022-01055-5
Andrews, T. S., Atif, J., Liu, J. C., Perciani, C. T., Ma, X. Z., Thoeni, C., et al. (2022). Single-cell, single-nucleus, and spatial RNA sequencing of the human liver identifies cholangiocyte and mesenchymal heterogeneity. Hepatol. Commun. 6, 821–840. doi: 10.1002/hep4.1854
Arthur, M. J. (2000). Fibrogenesis II. Metalloproteinases and their inhibitors in liver fibrosis. Am. J. Physiol. Gastrointest Liver Physiol. 279, G245–G249. doi: 10.1152/ajpgi.2000.279.2.G245
Barba, G., Harper, F., Harada, T., Kohara, M., Goulinet, S., Matsuura, Y., et al. (1997). Hepatitis C virus core protein shows a cytoplasmic localization and associates to cellular lipid storage droplets. Proc. Natl. Acad. Sci. U.S.A. 94, 1200–1205. doi: 10.1073/pnas.94.4.1200
Bar-Yishay, I., Shaul, Y., and Shlomai, A. (2011). Hepatocyte metabolic signalling pathways and regulation of hepatitis B virus expression. Liver Int. 31, 282–290. doi: 10.1111/j.1478-3231.2010.02423.x
Carlessi, R., Denisenko, E., Boslem, E., Köhn-Gaone, J., Main, N., Abu Bakar, N. D. B., et al. (2023). Single-nucleus RNA sequencing of pre-malignant liver reveals disease-associated hepatocyte state with HCC prognostic potential. Cell Genomics 3, 100301. doi: 10.1016/j.xgen.2023.100301
Cicchini, C., Amicone, L., Alonzi, T., Marchetti, A., Mancone, C., and Tripodi, M. (2014). Molecular mechanisms controlling the phenotype and the EMT/MET dynamics of hepatocyte. Liver Int. 35, 302–310. doi: 10.1111/liv.12577
Cui, F., Blach, S., Manzengo Mingiedi, C., Gonzalez, M. A., Sabry Alaama, A., Mozalevskis, A., et al. (2023). Global reporting of progress towards elimination of hepatitis B and hepatitis C. Lancet Gastroenterol. Hepatol. 8, 332–342. doi: 10.1016/s2468-1253(22)00386-7
Denisenko, E., Guo, B. B., Jones, M., Hou, R., de Kock, L., Lassmann, T., et al. (2020). Systematic assessment of tissue dissociation and storage biases in single-cell and single-nucleus RNA-seq workflows. Genome Biol. 21, 130. doi: 10.1186/s13059-020-02048-6
Diaz, O., Vidalain, P.-O., Ramière, C., Lotteau, V., and Perrin-Cocon, L. (2022). What role for cellular metabolism in the control of hepatitis viruses? Front. Immunol. 13. doi: 10.3389/fimmu.2022.1033314
Gao, R., Kim, C., Sei, E., Foukakis, T., Crosetto, N., Chan, L.-K., et al. (2017). Nanogrid single-nucleus RNA sequencing reveals phenotypic diversity in breast cancer. Nat. Commun. 8, 228. doi: 10.1038/s41467-017-00244-w
Guo, G. H., Tan, D. M., Zhu, P. A., and Liu, F. (2009). Hepatitis B virus X protein promotes proliferation and upregulates TGF-beta1 and CTGF in human hepatic stellate cell line, LX-2. Hepatobiliary Pancreat Dis. Int. 8, 59–64.
Huang, J., Zhao, L., Yang, P., Chen, Z., Ruan, X. Z., Huang, A., et al. (2017). Fatty acid translocase promoted hepatitis B virus replication by upregulating the levels of hepatic cytosolic calcium. Exp. Cell Res. 358, 360–368. doi: 10.1016/j.yexcr.2017.07.012
Jin, Z., Sun, R., Wei, H., Gao, X., Chen, Y., and Tian, Z. (2011). Accelerated liver fibrosis in hepatitis B virus transgenic mice: involvement of natural killer T cells. Hepatology 53, 219–229. doi: 10.1002/hep.23983
Kim, K. H., Shin, H. J., Kim, K., Choi, H. M., Rhee, S. H., Moon, H. B., et al. (2007). Hepatitis B virus X protein induces hepatic steatosis via transcriptional activation of SREBP1 and PPARgamma. Gastroenterology 132, 1955–1967. doi: 10.1053/j.gastro.2007.03.039
Lai, F., Wee, C. Y. Y., and Chen, Q. (2021). Establishment of humanized mice for the study of HBV. Front. Immunol. 12. doi: 10.3389/fimmu.2021.638447
Lamontagne, R. J., Casciano, J. C., and Bouchard, M. J. (2018). A broad investigation of the HBV-mediated changes to primary hepatocyte physiology reveals HBV significantly alters metabolic pathways. Metabolism 83, 50–59. doi: 10.1016/j.metabol.2018.01.007
Li, W., Duan, X., Zhu, C., Liu, X., Jeyarajan, A. J., Xu, M., et al. (2022). Hepatitis B and hepatitis C virus infection promote liver fibrogenesis through a TGF-beta1-induced OCT4/nanog pathway. J. Immunol. 208, 672–684. doi: 10.4049/jimmunol.2001453
Li, W., Yu, X., Chen, X., Wang, Z., Yin, M., Zhao, Z., et al. (2020). HBV induces liver fibrosis via the TGF−β1/miR−21−5p pathway. Exp. Ther. Med. 21, 169. doi: 10.3892/etm.2020.9600
Lok, A. S. F. (2024). Toward a functional cure for hepatitis B. Gut Liver 18, 593–601. doi: 10.5009/gnl240023
Masuzaki, R., Kanda, T., Sasaki, R., Matsumoto, N., Ogawa, M., Matsuoka, S., et al. (2020). Noninvasive assessment of liver fibrosis: current and future clinical and molecular perspectives. Int. J. Mol. Sci. 21, 4906. doi: 10.3390/ijms21144906
Miquilena-Colina, M. E., Lima-Cabello, E., Sanchez-Campos, S., Garcia-Mediavilla, M. V., Fernandez-Bermejo, M., Lozano-Rodriguez, T., et al. (2011). Hepatic fatty acid translocase CD36 upregulation is associated with insulin resistance, hyperinsulinaemia and increased steatosis in non-alcoholic steatohepatitis and chronic hepatitis C. Gut 60, 1394–1402. doi: 10.1136/gut.2010.222844
Naim, A., Pan, Q., and Baig, M. S. (2017). Matrix metalloproteinases (MMPs) in liver diseases. J. Clin. Exp. Hepatol. 7, 367–372. doi: 10.1016/j.jceh.2017.09.004
Oh, J.-M., An, M., Son, D.-S., Choi, J., Cho, Y. B., Yoo, C. E., et al. (2022). Comparison of cell type distribution between single-cell and single-nucleus RNA sequencing: enrichment of adherent cell types in single-nucleus RNA sequencing. Exp. Mol. Med. 54, 2128–2134. doi: 10.1038/s12276-022-00892-z
Park, S. A., Kim, M. J., Park, S. Y., Kim, J. S., Lim, W., Nam, J. S., et al. (2015). TIMP-1 mediates TGF-beta-dependent crosstalk between hepatic stellate and cancer cells via FAK signaling. Sci. Rep. 5, 16492. doi: 10.1038/srep16492
Rouleau, M., Schwab, M., Klein, K., Tremmel, R., Haag, M., Schaeffeler, E., et al. (2025). The liver proteome of individuals with a natural UGT2B17 complete deficiency. Sci. Rep. 15, 5458. doi: 10.1038/s41598-025-89160-4
Song, X., Gao, X., Wang, Y., Raja, R., Zhang, Y., Yang, S., et al. (2021). HCV core protein induces chemokine CCL2 and CXCL10 expression through NF-kappaB signaling pathway in macrophages. Front. Immunol. 12. doi: 10.3389/fimmu.2021.654998
Song, X., Guo, Y., Duo, S., Che, J., Wu, C., Ochiya, T., et al. (2009). A mouse model of inducible liver injury caused by tet-on regulated urokinase for studies of hepatocyte transplantation. Am. J. Pathol. 175, 1975–1983. doi: 10.2353/ajpath.2009.090349
Vogt, D. A., Camus, G., Herker, E., Webster, B. R., Tsou, C. L., Greene, W. C., et al. (2013). Lipid droplet-binding protein TIP47 regulates hepatitis C Virus RNA replication through interaction with the viral NS5A protein. PloS Pathog. 9, e1003302. doi: 10.1371/journal.ppat.1003302
Wang, Y., Wu, T., Hu, D., Weng, X., Wang, X., Chen, P. J., et al. (2018). Intracellular hepatitis B virus increases hepatic cholesterol deposition in alcoholic fatty liver via hepatitis B core protein. J. Lipid Res. 59, 58–68. doi: 10.1194/jlr.M079533
Wang, H. and Zhang, J. (2023). The glucose metabolic reprogramming in hepatitis B virus infection and hepatitis B virus associated diseases. J. Gastroenterol. Hepatol. 38, 1886–1891. doi: 10.1111/jgh.16340
Wen, F., Tang, X., Xu, L., and Qu, H. (2022). Comparison of single−nucleus and single−cell transcriptomes in hepatocellular carcinoma tissue. Mol. Med. Rep. 26, 339. doi: 10.3892/mmr.2022.12855
Wu, H., Kirita, Y., Donnelly, E. L., and Humphreys, B. D. (2019). Advantages of single-nucleus over single-cell RNA sequencing of adult kidney: rare cell types and novel cell states revealed in fibrosis. J. Am. Soc. Nephrol. 30, 23–32. doi: 10.1681/asn.2018090912
Xie, B., Sun, D., Du, Y., Jia, J., Sun, S., Xu, J., et al. (2019). A two-step lineage reprogramming strategy to generate functionally competent human hepatocytes from fibroblasts. Cell Res. 29, 696–710. doi: 10.1038/s41422-019-0196-x
Yasumoto, J., Kasai, H., Yoshimura, K., Otoguro, T., Watashi, K., Wakita, T., et al. (2017). Hepatitis B virus prevents excessive viral production via reduction of cell death-inducing DFF45-like effectors. J. Gen. Virol. 98, 1762–1773. doi: 10.1099/jgv.0.000813
Zan, Y., Zhang, Y., and Tien, P. (2013). Hepatitis B virus e antigen induces activation of rat hepatic stellate cells. Biochem. Biophys. Res. Commun. 435, 391–396. doi: 10.1016/j.bbrc.2013.04.098
Zeisberg, M., Yang, C., Martino, M., Duncan, M. B., Rieder, F., Tanjore, H., et al. (2007). Fibroblasts derive from hepatocytes in liver fibrosis via epithelial to mesenchymal transition. J. Biol. Chem. 282, 23337–23347. doi: 10.1074/jbc.M700194200
Zeng, W., Jiang, S., Kong, X., El-Ali, N., Ball, A. R., Ma, C. I. H., et al. (2016). Single-nucleus RNA-seq of differentiating human myoblasts reveals the extent of fate heterogeneity. Nucleic Acids Res. 44, e158. doi: 10.1093/nar/gkw739
Zhang, J., Ling, N., Lei, Y., Peng, M., Hu, P., and Chen, M. (2021). Multifaceted interaction between hepatitis B virus infection and lipid metabolism in hepatocytes: A potential target of antiviral therapy for chronic hepatitis B. Front. Microbiol. 12. doi: 10.3389/fmicb.2021.636897
Zhou, L., He, R., Fang, P., Li, M., Yu, H., Wang, Q., et al. (2021). Hepatitis B virus rigs the cellular metabolome to avoid innate immune recognition. Nat. Commun. 12, 98. doi: 10.1038/s41467-020-20316-8
Keywords: HBV, snRNA-seq, liver humanized mice, TIMP1, ALB, URG
Citation: Ren X, Wang C, Qin B, Yang H, Wu M, Zhang Z, Lu W, Wang C, Liu Y, Zhang X and Zhou X (2025) Single-nucleus RNA sequencing reveals HBV-driven metabolic reprogramming and TIMP1-mediated fibrosis in human-liver-chimeric mice. Front. Cell. Infect. Microbiol. 15:1654903. doi: 10.3389/fcimb.2025.1654903
Received: 27 June 2025; Accepted: 06 August 2025;
Published: 02 September 2025.
Edited by:
Haitao Guo, University of Pittsburgh, United StatesReviewed by:
Xupeng Hong, The Rockefeller University, United StatesJames Ahodantin, University of Maryland, United States
Copyright © 2025 Ren, Wang, Qin, Yang, Wu, Zhang, Lu, Wang, Liu, Zhang and Zhou. This is an open-access article distributed under the terms of the Creative Commons Attribution License (CC BY). The use, distribution or reproduction in other forums is permitted, provided the original author(s) and the copyright owner(s) are credited and that the original publication in this journal is cited, in accordance with accepted academic practice. No use, distribution or reproduction is permitted which does not comply with these terms.
*Correspondence: Xiaohui Zhou, emhvdXhpYW9odWlAc2hhcGhjLm9yZw==; Xiaonan Zhang, WGlhb25hbi5aaGFuZ0BjYW5iZXJyYS5lZHUuYXU=; Yabin Liu, bGl1eWFiaW5Ac2p0dS5lZHUuY24=
†These authors have contributed equally to this work