 Chenggui Liu
 Jiuda Li1†
 Qin Wang
 Shuzhe Yang
- 1Department of Performance Appraisal Management, Chengdu Women’s and Children’s Central Hospital, School of Medicine, University of Electronic Science and Technology of China, Chengdu, China
- 2Department of Clinical Laboratory, Chengdu Women’s and Children’s Central Hospital, School of Medicine, University of Electronic Science and Technology of China, Chengdu, China
- 3Department of Clinical Laboratory, Sichuan Province Orthopedic Hospital, Chengdu, China
Background: Respiratory tract infections among children are commonly caused by several pathogens, and their prevalence varies across different groups. The goal of this study is to investigate the prevalence of Influenza A virus (Flu A), Influenza B virus (Flu B), respiratory syncytial virus (RSV), Adenovirus (ADV), Rhinovirus (RV), and Mycoplasma pneumoniae (MP) among children in different groups in Chengdu and analyze their differences.
Methods: This retrospective cross-sectional study included 39,190 children, with 21,847 males and 17,343 females. All respiratory specimens from the participants were tested for Flu A, Flu B, RSV, ADV, RV, and MP using multiplex PCR.
Results: The overall prevalence of single infection, double co-infection, and triple co-infection was 48.19%, 7.09%, and 0.25%, respectively. The pathogen-specific prevalence from highest to lowest was RV (21.43%), ADV (16.69%), MP (11.73%), RSV (8.12%), Flu A (3.78%), and Flu B (1.37%). Significant differences were observed in the prevalence of the six pathogens across all six age groups (all p < 0.001). The prevalence of Flu A, Flu B, ADV, and MP was highest in school-aged children and lowest in newborns; RSV prevalence peaked in infants and was lowest in adolescents; RV was most prevalent in toddlers and least in newborns. The prevalence of Flu A, Flu B, and RSV was significantly higher in spring/winter than in summer/autumn (p < 0.001). MP and RV prevalence was significantly higher in spring/summer than in autumn/winter (p < 0.001), while ADV prevalence was significantly higher in autumn/summer than in winter/spring (p < 0.001). Among the five clinical diagnosis groups, Flu A and Flu B prevalence was highest in SRLT and lowest in CRDs; RSV and MP peaked in ALRTIs and bottomed in AURTIs; RV was highest in CRDs and lowest in AURTIs; ADV was highest in AURTIs and lowest in CRDs.
Conclusions: Over half of the children were infected with at least one of the six respiratory pathogens, with RV, ADV, and MP being predominant. While co-infections were less common than single infections, they still occurred, with double co-infections being the main form. Notably, the prevalence varied significantly by age, season, and clinical diagnosis. These findings may offer useful references for developing targeted prevention and control strategies.
Introduction
Respiratory tract infections (RTIs) represent a severe and widespread health issue, particularly among the pediatric population globally. These infections are highly prevalent and rank among the most common respiratory diseases affecting children worldwide. Currently, RTIs pose a significant and far-reaching challenge to public health, primarily attributed to their high morbidity and mortality rates (Yang et al., 2022; Xu et al., 2025). A wide range of pathogens can cause RTIs, including viruses, bacteria, atypical pathogens, fungi, and parasites (Niederman and Torres, 2022; Georgakopoulou et al., 2024). Among these, viruses are the predominant infectious agents. Influenza A virus (Flu A), Influenza B virus (Flu B), respiratory syncytial virus (RSV), Adenovirus (ADV), and Rhinovirus (RV) are the most common respiratory viruses that cause RTIs (Lin et al., 2020; Cilloniz et al., 2022). Furthermore, the emergence of coronaviruses—particularly the global spread of severe acute respiratory syndrome coronavirus type 2 (SARS-CoV-2), the causative agent of COVID-19—has underscored their significant role in the spectrum of respiratory pathogens and the critical need for their surveillance (Tabibzadeh et al., 2020). Moreover, co-infections of SARS-CoV-2 with other respiratory viruses, such as Flu A, Flu B, RSV, and RV, are not uncommon, and such viral co-infections may be associated with more severe clinical outcomes (Lai et al., 2020; Eisen et al., 2021; Sadeh Tehrani et al., 2024). In addition, with the advancement of pathogen detection technology, especially the widespread application of nucleic acid amplification tests (NAATs) in clinical practice, the role of atypical pathogens in RTIs, such as Mycoplasma pneumoniae (MP), has attracted increasing attention (Miyashita, 2022; Liu et al., 2023).
The pathogens causing RTIs exhibit remarkable adaptability and the ability to infiltrate both the upper respiratory tract and lower respiratory tract. When the upper respiratory tract is invaded, these pathogens may give rise to a range of diseases such as pharyngitis, laryngitis, and sinusitis. Viral agents like Flu A, Flu B, RSV, ADV, and RV, are among the most common triggers for such upper RTIs (Clementi et al., 2021). In contrast, when the lower respiratory tract is affected by these pathogens, especially in vulnerable populations such as infants, young children, or immunocompromised individuals, it can trigger more severe conditions. These include tracheitis, bronchitis, bronchiolitis, and pneumonia (Lowe, 2022; Hong et al., 2024). Flu A and Flu B are well-known for their biphasic tropism. Infection with Flu A and/or Flu B may cause mild respiratory symptoms, which are initially confined to the URT. Typical manifestations include fever, sore throat, rhinitis, cough, fatigue, and headache and then progress to cause more significant damage to the LRT, potentially leading to severe pneumonia (Mifsud et al., 2021). MP can also cause URT and/or LRT infections, typically presenting with a persistent cough. In immunocompromised children and other susceptible populations, it may lead to more serious respiratory complications and extrapulmonary manifestations, including involvement of the skin, hematologic system, cardiovascular system, musculoskeletal system, and nervous system (Loconsole et al., 2021).
There are several methods for diagnosing pathogens causing RTIs, including microscopy, culture, immunoassays (for antigen or antibody detection), and NAATs such as traditional polymerase chain reaction (PCR), nested PCR, real-time quantitative PCR, and multiplex PCR. Microscopy with Gram staining provides rapid preliminary assessment for certain bacterial infections, but its sensitivity is significantly lower than other methods and it is ineffective for cell-wall-deficient pathogens like MP. Although MP can be cultured for diagnosis and drug susceptibility testing, this method is not routinely used as a preferred approach in clinical practice due to its technically demanding nature, prolonged turnaround time, low yield, and associated challenges (Kumar and Kumar, 2023). For viral RTIs, both microscopy and culture face substantial limitations: conventional light microscopy cannot resolve viruses, electron microscopy is impractical for routine use, and viral culture requires specialized cell lines, stringent laboratory conditions, extended incubation periods, and may still miss fastidious or uncommon strains, resulting in poor sensitivity and limited clinical utility.
Immunoassays for antigens or antibodies have diagnostic value in the detection of pathogens causing RTIs. For pathogens such as RSV, Flu A, and Flu B, antigen detection is faster, easier to perform, and less costly, which makes it suitable for patients with high viral loads. However, these tests have lower sensitivity and specificity, leading to false-negative results (especially at low viral loads) and false-positive results due to potential cross-reactivity (Li et al., 2024; Murphy et al., 2024). In contrast, serological antibody tests (IgM and/or IgG) are applicable for diagnosing pathogens causing RTIs, including RSV, Flu A, Flu B, ADV, and atypical pathogens such as MP (Liu et al., 2023). These tests are particularly useful for detecting specific IgM, which supports serological diagnosis (Liu et al., 2023; Tian et al., 2023). However, they have several limitations, including a delayed antibody response window that may lead to early false negatives, an inability to distinguish acute from past infections solely based on IgG positivity, and a need for clinical correlation for accurate result interpretation. Additionally, serology testing cannot track the dynamics of an infection or identify individuals immune to influenza-like illnesses (Toczek-Kubicka et al., 2022).
Metagenomic next-generation sequencing (mNGS) can also be used to detect pathogens causing RTIs. However, mNGS is both complex and expensive, and it may face challenges such as sample contamination risks and difficult result interpretation in clinical applications, which to some extent limits its widespread adoption in emergency or primary healthcare settings (Yin et al., 2024). By contrast, clinical molecular diagnostic techniques based on PCR, leveraging the dual advantages of high sensitivity and specificity, have demonstrated significant analytical and clinical benefits in the detection of pathogens causing RTIs, gradually replacing traditional identification techniques in many clinical scenarios. Besides high sensitivity and specificity, multiplex PCR panels also offer several advantages, including small sample requirement, rapid detection, etc. They can simultaneously detect multiple pathogens, providing accurate etiological evidence for mixed infections to optimize clinical decision-making (Clark et al., 2023; Azizian et al., 2025).
In this study, a multiplex PCR panel was employed to detect Flu A, Flu B, RSV, ADV, RV, and MP in respiratory specimens from children in Chengdu, China. The objective is to investigate the prevalence of these six respiratory pathogens (including patterns of single and co-infections) among children in different age groups, across seasons, and among clinical diagnosis subgroups in this region, and to analyze differences in their distribution, thereby providing a basis for developing targeted prevention and control strategies for pediatric RTIs.
Materials and methods
Study participants
A retrospective cross-sectional study was conducted at Chengdu Women’s and Children’s Central Hospital, School of Medicine, University of Electronic Science and Technology of China, covering the period from January 1, 2024, to December 31, 2024. A total of 48,162 individuals underwent tests for Flu A, Flu B, RSV, ADV, RV, and MP using multiplex PCR on pharyngeal swab specimens. Among them, 39,190 eligible child participants were included in the present study, comprising 21,847 male participants aged 0–18 years (mean age: 3.29 ± 3.02 years) and 17,343 female participants aged 0–18 years (mean age: 3.59 ± 3.10 years). Specifically, children were divided into six age groups: 1,451 newborns aged 0 to 28 days, 7,222 infants aged 29 days to 1 year, 8,599 toddlers aged 1 to 3 years, 12,778 preschoolers aged 3 to 6 years, 8,491 school-aged children aged 6 to 12 years, 649 adolescents aged 12 to 18 years. The child participant selection process is described in detail in Figure 1.
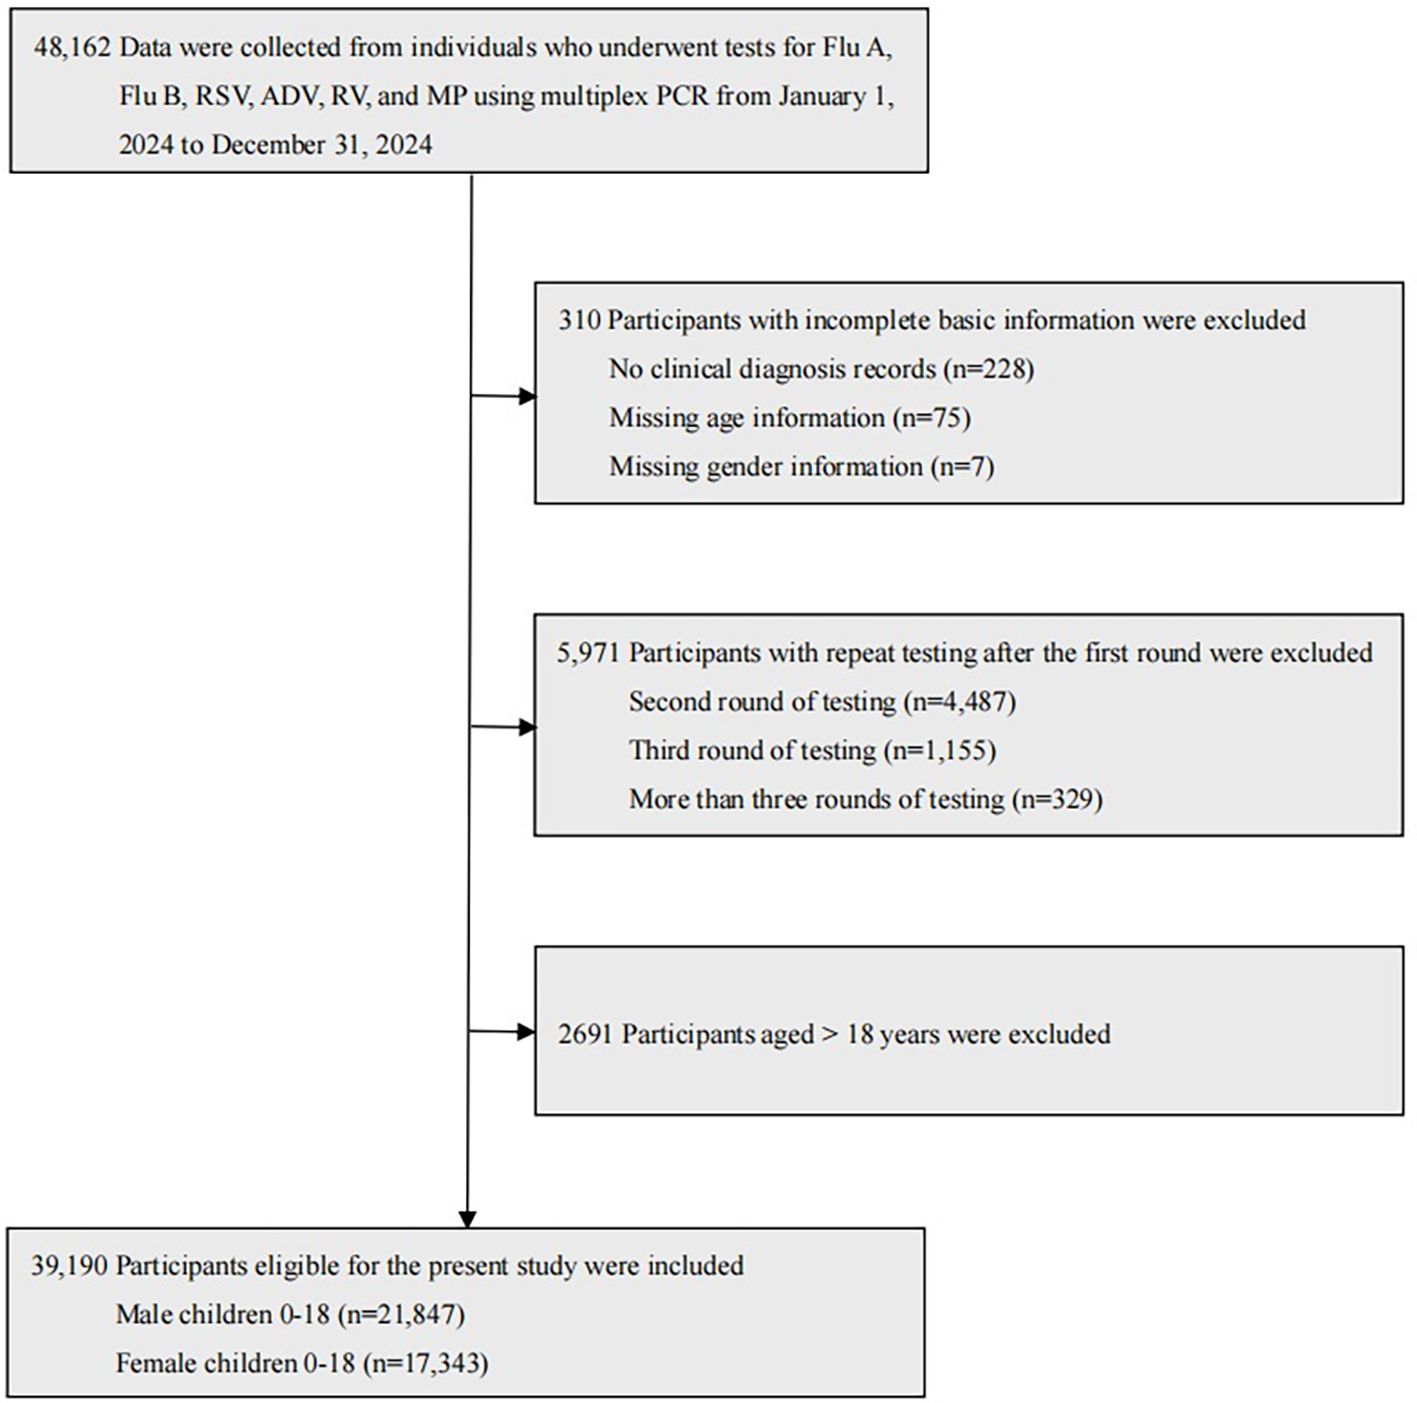
Figure 1. Selection of male and female child participants aged 0–18 years.
The exclusion criteria were as follows: (a) Participants with incomplete basic information, including lack of clinical diagnosis records, or missing age or gender information. (b) Participants with repeated tests conducted within 28 days after the first round. (c) Participants aged over 18 years.
According to the medical settings, 39,190 eligible child participants were divided into outpatients (n=7,752) and inpatients (n=31,438). Based on their clinical diagnoses, participants were categorized into five groups: acute lower respiratory tract infections (ALRTIs), acute upper respiratory tract infections (AURTIs), chronic respiratory diseases (CRDs), non-respiratory diseases (NRDs), and self-requested laboratory testing (SRLT). For participants with multiple clinical diagnoses, the first diagnosis recorded in medical records was selected as the diagnostic basis for this study.
1. ALRTIs include pneumonia, acute tracheitis, acute bronchitis, acute tracheobronchitis, acute laryngotracheitis, acute laryngotracheobronchitis, and acute bronchiolitis.
2. AURTIs include acute pharyngitis, acute laryngitis, acute tonsillitis, acute rhinitis, acute sinusitis, acute epiglottitis, and the common cold.
3. CRDs include chronic pharyngitis, chronic rhinitis, chronic sinusitis, chronic bronchitis, bronchiectasis, bronchial asthma, and pulmonary tuberculosis.
4. NRDs include Henoch-Schönlein purpura (allergic purpura), thrombocytopenic purpura, leukemia, hemophilia, infectious mononucleosis, hypothyroidism, hyperthyroidism, type 1 diabetes, diarrhea, acute gastroenteritis, acute appendicitis, acute parotitis, acute lymphadenitis, acute urinary tract infection, sepsis, epilepsy, myocarditis, Kawasaki disease, acute conjunctivitis, neonatal hyperbilirubinemia, acute urticaria, constipation etc.
5. SRLT refers to self-requested laboratory testing by participants or their legal guardians without prior physician assessment or recommendation, regardless of subjective health concerns.
Specimen collection
Pharyngeal swab sampling for children is carried out by clinicians or nurses following these procedures: (1) newborns and infants: Have a caregiver securely hold the child to stabilize the head and body. If necessary, clean the oral cavity with sterile saline. Use a small sterile swab, gently insert it into the pharynx, stay for a few seconds, rotate softly 1–2 turns, and remove the swab. (2) toddlers and preschoolers: Ask a caregiver to assist in holding the child to prevent movement. Instruct or guide the child to open the mouth; clean the oral area with sterile saline if needed. Insert a sterile swab into the pharynx, stay briefly, rotate gently 1–2 turns, and withdraw the swab. (3) school-aged children and adolescents: Instruct the child to open the mouth and say “ah” to expose the pharynx. Clean the oral region with sterile saline if necessary. Insert a sterile swab into the pharynx, stay for a few seconds, rotate firmly 1–2 turns, and remove the swab. All specimens were tested within 24 hours.
Multiplex PCR assay
Six respiratory pathogens (Flu A, Flu B, RSV, ADV, RV, and MP) were detected using a multiplex PCR nucleic acid diagnostic kit (Sansure Biotech Inc., Changsha, China). The standard operating procedures (SOP) were as follows:
Preparation of reagents
Remove all kit components from storage and allow them to equilibrate to room temperature. Briefly vortex each component and set aside for use. Prepare the negative control containing internal control by adding 10 μL of internal control to every 200 μL of negative control, mix thoroughly, and briefly centrifuge. Based on the number of test specimens plus positive and negative controls, prepare PCR Master Mix A by combining 43.5 μL of PCR Mix A and 1.5 μL of Enzyme Mix per reaction; mix thoroughly and briefly centrifuge. Similarly, prepare PCR Master Mix B using PCR Mix B and Enzyme Mix in the same proportions; mix thoroughly and briefly centrifuge.
Specimen processing and loading
Add 200 μL each of the test specimen, negative control, and positive control into separate 1.5 mL centrifuge tubes. Extract nucleic acids using the Multi-type Sample DNA/RNA Extraction-Purification Kit (Magnetic Bead Method) manufactured by Sansure Biotech Inc., following the product’s instructions. Add 5 μL of each extracted nucleic acid (from test specimens, positive control, and negative control) into corresponding 0.2 mL PCR reaction tubes, then add 45 μL of PCR Master Mix A to each tube and seal the tube caps. Similarly, add 5 μL of the extracted nucleic acids into a separate set of 0.2 mL PCR reaction tubes, add 45 μL of PCR Master Mix B to each, and seal the tube caps.
PCR amplification
Use the MA-6000 Real-Time Quantitative Thermal Cycler (Suzhou Molarray Co., Ltd., Suzhou, China). Place the PCR reaction tubes into the sample wells of the amplification instrument, arranging the positive control, negative control, and unknown specimens in sequence, and input the specimen information. For reactions with PCR Master Mix A, select the FAM channel (Reporter: FAM, Quencher: None) for Flu A detection, HEX or VIC channel (Reporter: HEX/VIC, Quencher: None) for Flu B, CY5 channel (Reporter: CY5, Quencher: None) for RSV, and ROX channel (Reporter: ROX, Quencher: None) for internal control; set the reaction volume to 50 μL. For reactions with PCR Master Mix B, select the FAM channel (Reporter: FAM, Quencher: None) for ADV, HEX or VIC channel (Reporter: HEX/VIC, Quencher: None) for RV, CY5 channel (Reporter: CY5, Quencher: None) for MP, and ROX channel (Reporter: ROX, Quencher: None) for internal control; set the reaction volume to 50 μL. Set the cycling parameters as follows: Step 1 (reverse transcription) at 50 °C for 30 min (1 cycle); Step 2 (pre-denaturation) at 95 °C for 1 min (1 cycle); Step 3 (denaturation) at 95 °C for 15 sec and Step 4 (annealing, extension, and fluorescence collection) at 60 °C for 30 sec (45 cycles); Step 5 (optional instrument cooling) at 25 °C for 10 sec (1 cycle).
Result interpretation
A specimen was considered positive for a respiratory pathogen if the corresponding detection channel (within its assigned Master Mix reaction) exhibited a typical S-shaped amplification curve with a cycle threshold (Ct) value ≤ 40. Specifically, positivity for Flu A, Flu B, or RSV was determined in the Master Mix A reaction (FAM, HEX/VIC, and CY5 channels, respectively), while positivity for ADV, RV, or MP was determined in the Master Mix B reaction (FAM, HEX/VIC, and CY5 channels, respectively). A specimen was deemed negative for a pathogen if no amplification curve (no Ct value detected) or a Ct value > 40 was observed in its specific detection channel. For validity verification via the ROX internal control channel: no specific requirement was imposed on the internal control result for positive specimens, while negative specimens (no target pathogen detected) were required to have a positive internal control result (Ct ≤ 40) to confirm valid specimen processing and assay performance. If the internal control for a negative specimen showed a Ct value > 40 or no Ct value was detected, the test result was classified as invalid, and relevant factors (e.g., specimen quality, nucleic acid extraction efficiency, or reagent integrity) were investigated before recollecting and retesting the specimen.
Statistical analysis
SPSS software version 19.0 (SPSS, Inc., Chicago, IL, USA) was used for all statistical analyses. The prevalence of Flu A, Flu B, RSV, ADV, RV, and MP was expressed as percentages, with differences analyzed using the Chi-Square test (χ2). Initially, univariate logistic regression was applied to assess associations between positivity for each pathogen and relevant variables, including gender, age, medical settings, seasons, and clinical diagnoses. Variables yielding a p-value < 0.25 in univariate analysis were deemed potentially relevant and included in subsequent analyses. Multivariate logistic regression was then performed to determine the independent effects of these variables on pathogen positivity, employing the Stepwise Forward Wald method to select the most impactful variables for the final model while adjusting for potential confounders. Odds ratios (OR) and their 95% confidence intervals (95% CI) were computed to quantify the strength and direction of associations, enabling the identification of variables that independently influence outcomes and enhancing the robustness of associations between predictors and pathogen positivity. A p-value < 0.05 was defined as statistically significant.
Results
Prevalence of six respiratory pathogens among children
More than half (55.53%) of the children were infected with at least one of the six respiratory pathogens. The overall prevalence of single infection, double co-infection, and triple co-infection was 48.19%, 7.09%, and 0.25%, respectively, with no quadruple, quintuple, or sextuple co-infections observed. The pathogen-specific prevalence from the highest to the lowest was as follows: RV (21.43%), ADV (16.69%), MP (11.73%), RSV (8.12%), Flu A (3.78%), and Flu B (1.37%) (χ2 = 12,221.187, p < 0.001). For single infections, the pathogens with the highest prevalence were RV (16.32%), ADV (12.98%), and MP (8.76%), while those with the lowest prevalence were Flu B (1.01%), Flu A (3.00%), and RSV (6.12%). For double co-infections, the combinations with the highest prevalence were ADV+RV (2.18%), RV+MP (1.48%), and RSV+RV (0.94%), whereas those with the lowest prevalence were Flu A+Flu B (0.01%), Flu B+ADV (0.05%), and Flu B+RV (0.05%). For triple co-infections, ADV+RV+MP (0.08%), RSV+ADV+RV (0.05%), and RSV+RV+MP (0.03%) showed the highest prevalence, in contrast to the three combinations including Flu A+Flu B+ADV, Flu A+RSV+MP, and Flu B+RSV+ADV, for which no cases were detected. The prevalence of single infection and multiple co-infections with the six pathogens among male and female children and the prevalence of specific double co-infections and triple co-infections with these six pathogens in 39,190 children are reported in Table 1 and Table 2, respectively.
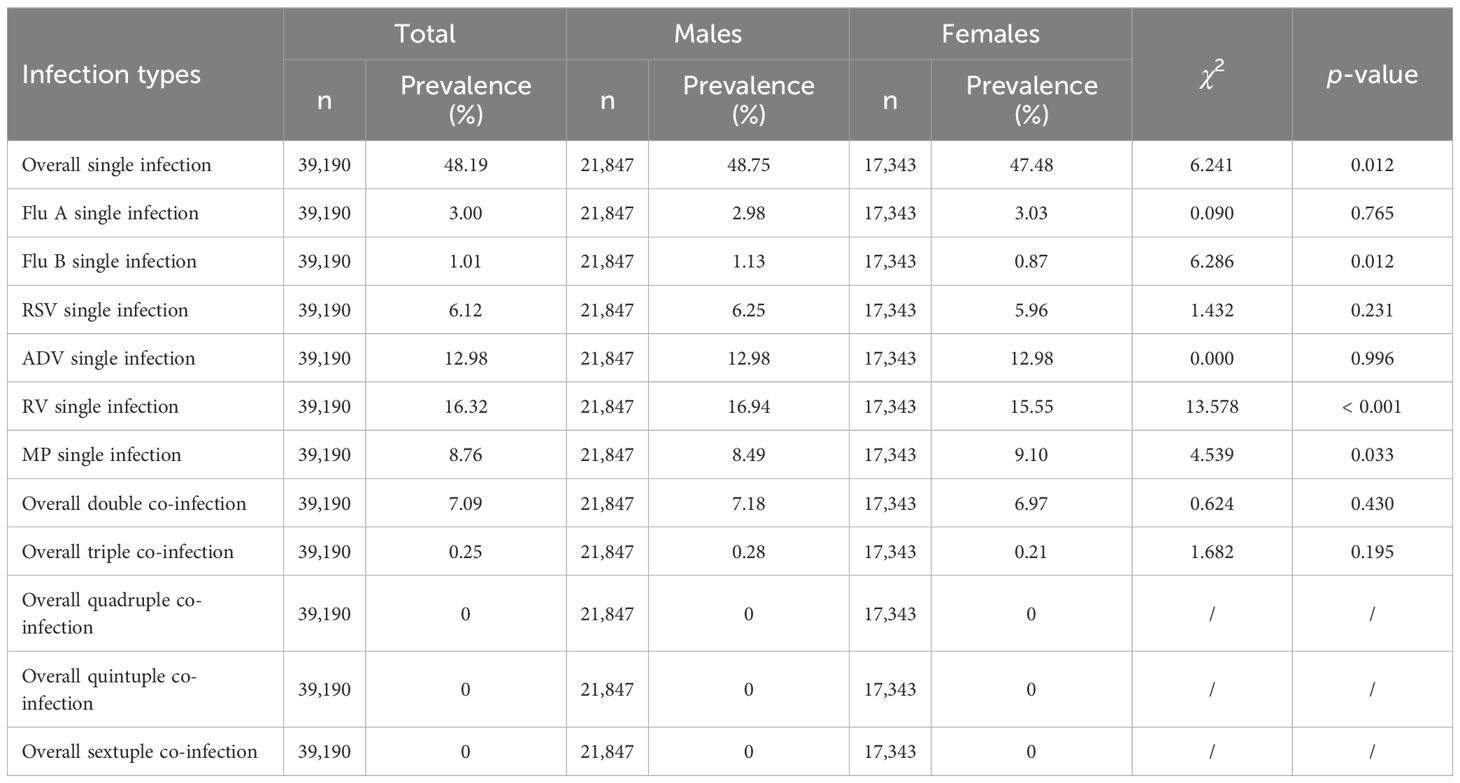
Table 1. Prevalence of single infections and multiple co-infections with Flu A, Flu B, RSV, ADV, RV and MP in male and female children.
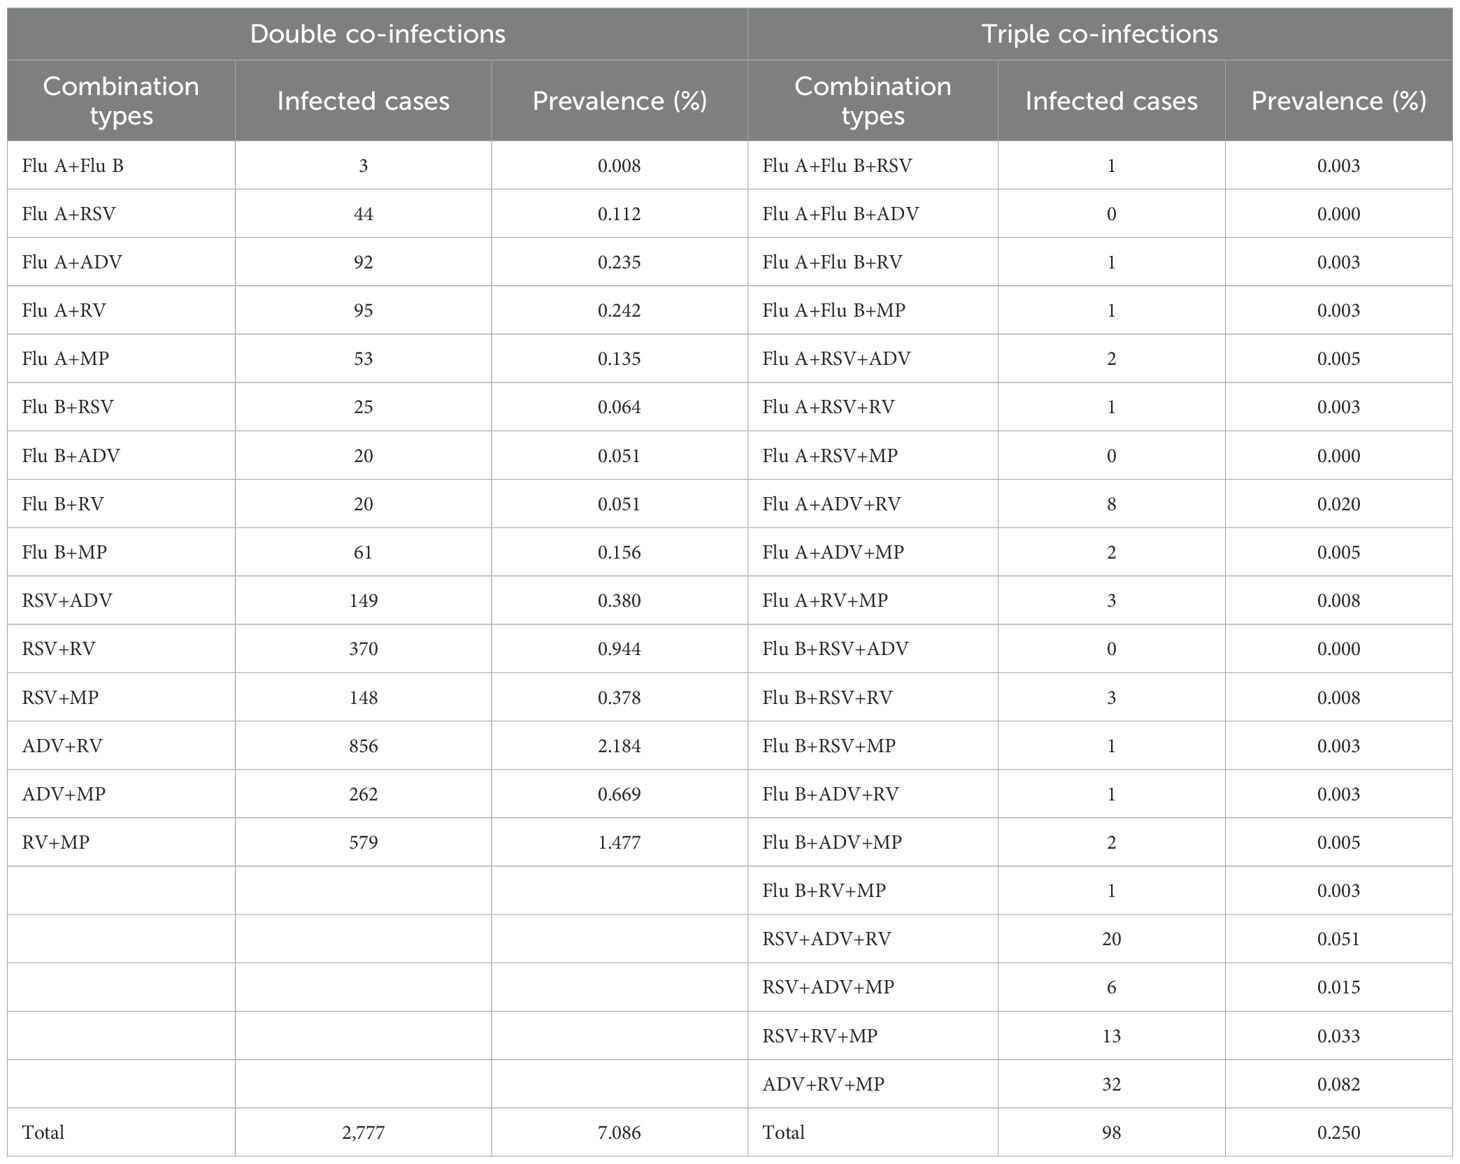
Table 2. Prevalence of specific double co-infections and triple co-infections with Flu A, Flu B, RSV, ADV, RV, and MP in 39,190 children.
In terms of gender, the prevalence of Flu B and RV was slightly higher among male children than among female children (1.53% vs 1.17% for Flu B, 22.22% vs 20.44% for RV, both p < 0.01). However, there was no significant difference in the prevalence of Flu A, RSV, ADV, and MP between male and female children (all p>0.05). In terms of medical settings, the prevalence of Flu A, Flu B, and ADV among children was higher in outpatient than in inpatient (7.68% vs 2.82% for Flu A, 2.22% vs 1.16% for Flu B, 30.71% vs 13.23% for ADV, all p < 0.001). However, the prevalence of RSV, RV, and MP among children was lower in outpatient than in inpatient (5.90% vs 8.66% for RSV, 15.83% vs 22.82% for RV, 9.57% vs 12.26% for MP, all p < 0.001). The prevalence of six respiratory pathogens among male and female children is shown in Figure 2.
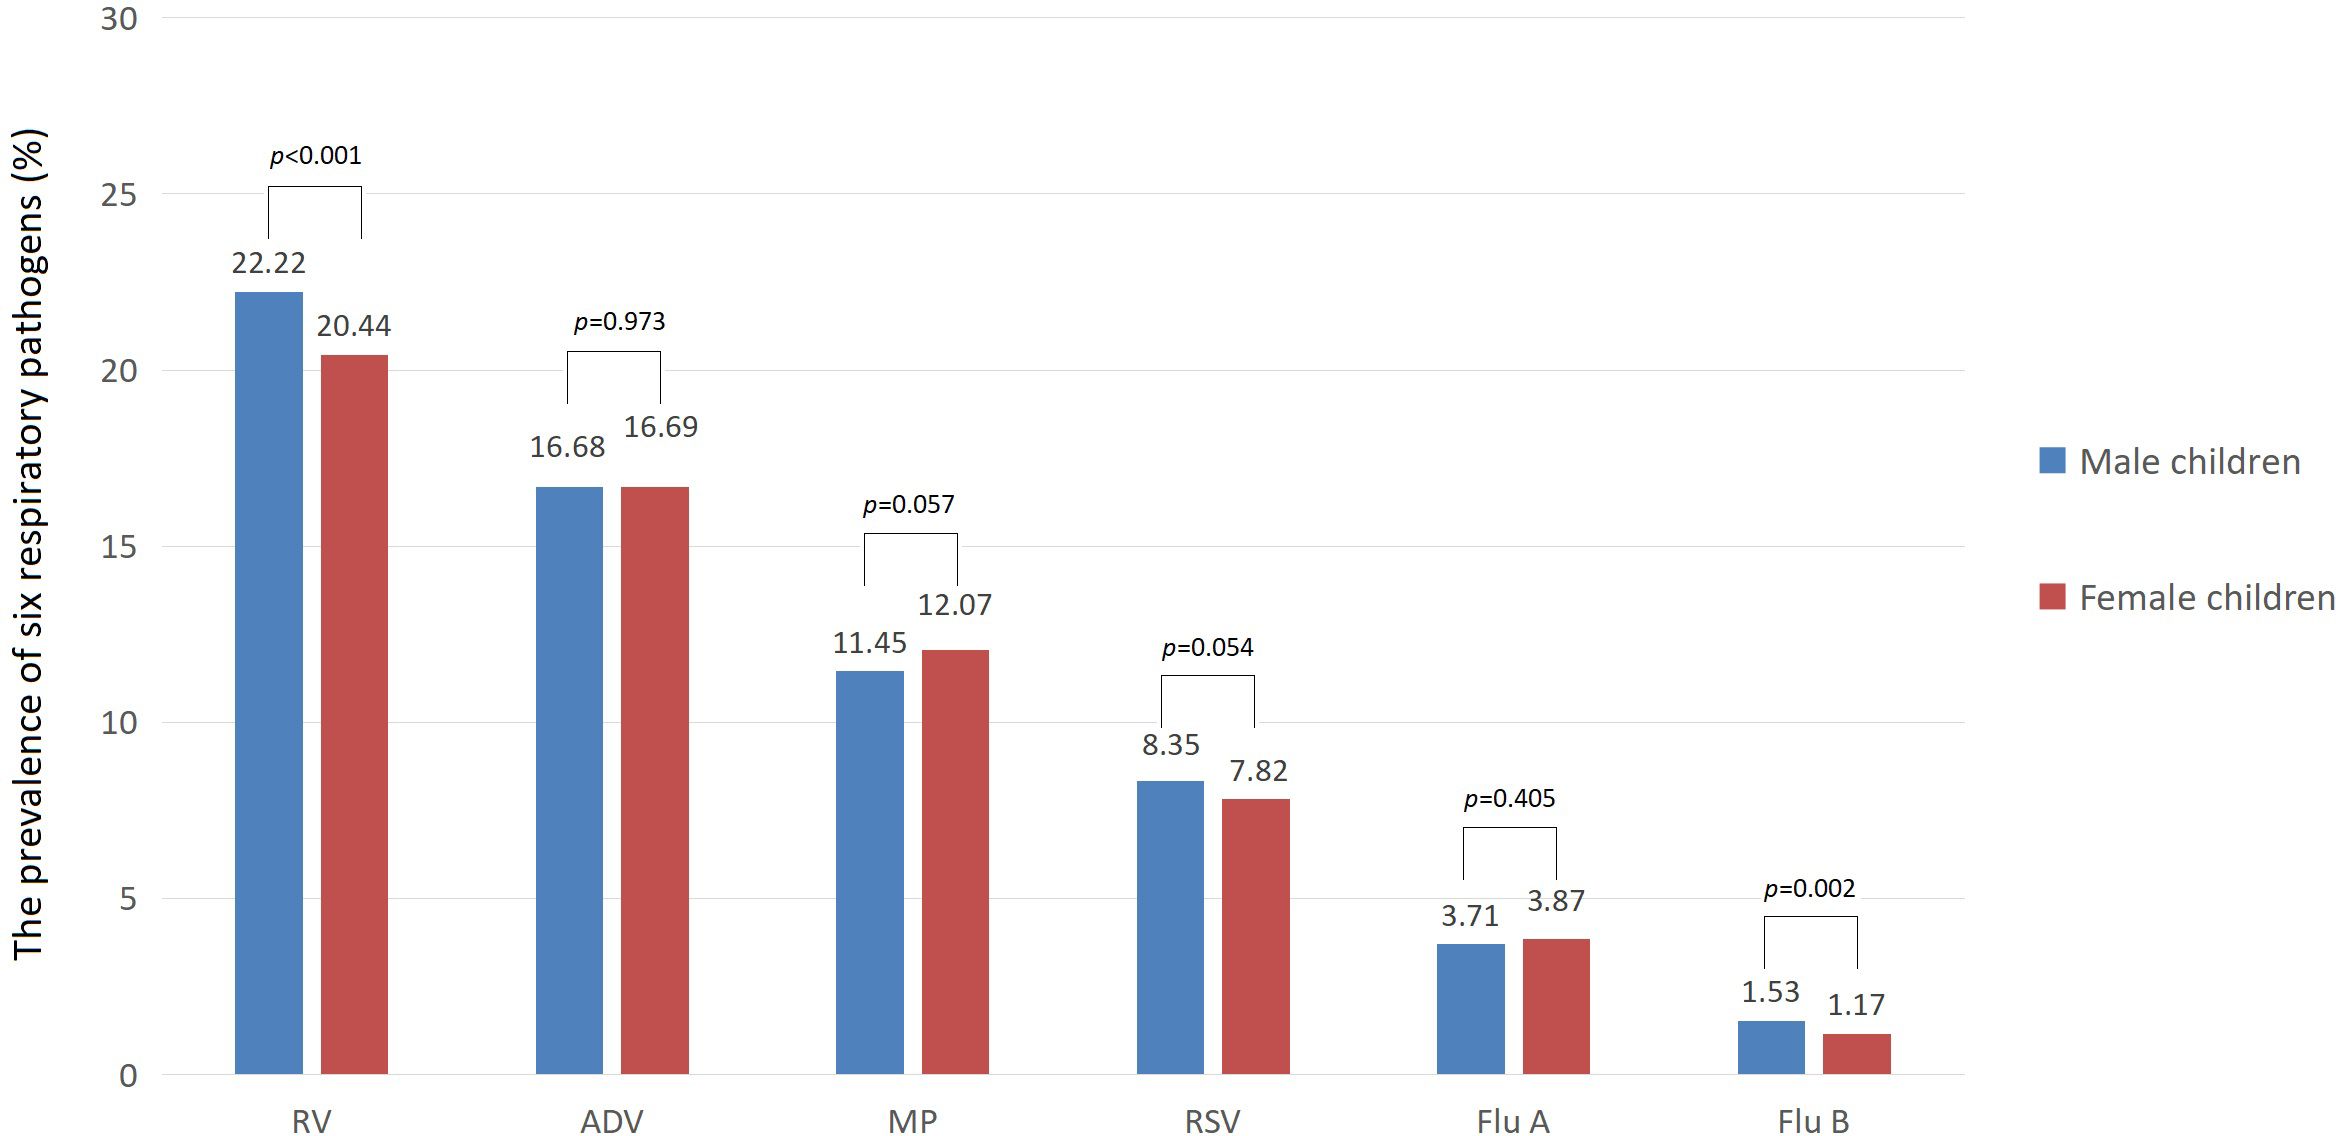
Figure 2. Prevalence of six respiratory pathogens among both males and females children (%).
Comparison of the prevalence of six respiratory pathogens in different age groups among children
The prevalence of Flu A, Flu B, ADV, and MP was the highest in school-aged children (5.05% for Flu A, 1.96% for Flu B, 24.00% for ADV and 20.85% for MP) and the lowest in newborns (0.41% for Flu A, 0.48% for Flu B, 2.96% for ADV and 1.31% for MP), with the remaining age groups—infants, toddlers, preschoolers, and adolescents—showing intermediate values. Specifically, for Flu A, the prevalence decreased in the following order: toddlers (4.04%), preschoolers (3.97%), adolescents (3.54%), and infants (2.34%). For Flu B, the order of decreasing prevalence was: preschoolers (1.32%), infants (1.29%), toddlers (1.12%), and adolescents (0.92%). For ADV, the decreasing order was: preschoolers (22.77%), toddlers (13.39%), adolescents (8.63%), and infants (4.74%). For MP, the order of decreasing prevalence was: preschoolers (13.20%), adolescents (12.33%), toddlers (8.41%), and infants (4.39%). There were significant differences in prevalence among these six age groups (all p < 0.001).
The prevalence of RSV was the highest in infants (15.31%) and the lowest in adolescents (2.31%), with toddlers (11.33%), newborns (7.24%), preschoolers (6.04%), and school-aged children (2.46%) showing intermediate values in descending order; there were significant differences in prevalence among these six age groups (p < 0.001). The prevalence of RV was the highest in toddlers (26.20%) and the lowest in newborns (9.30%), with preschoolers (23.99%), infants (20.33%), school-aged children (16.31%), and adolescents (14.48%) showing intermediate values in descending order; there were significant differences in prevalence among these six age groups (p < 0.001). The comparison of the prevalence of six respiratory pathogens in different age groups among children is reported in Table 3.
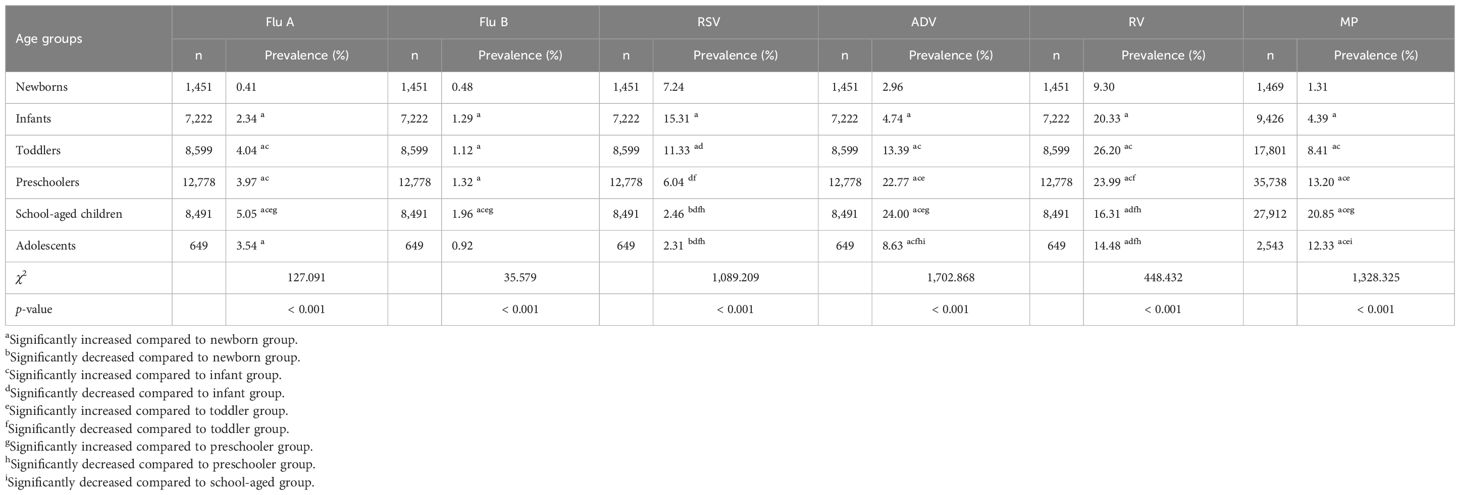
Table 3. Comparison of prevalence of Flu A, Flu B, RSV, ADV, RV and MP in different age groups among children.
Comparison of the prevalence of six respiratory pathogens in different seasons and months among children
The prevalence of Flu A, Flu B, and RSV among children was higher in spring and winter, and significantly higher than in summer and autumn (p < 0.001). Among them, the prevalence of Flu A was higher in winter than in spring (7.70% vs 3.91%, p < 0.05), while there was no significant difference in the prevalence of Flu B and RSV between winter and spring (2.82% vs 2.77% for Flu B and 15.34% vs 15.42% for RSV, both p>0.05). The prevalence of MP and RV among children was significantly higher in spring and summer than in autumn and winter (p < 0.001). Among them, the prevalence of MP was higher in spring than in summer (15.48% vs 12.41%, p < 0.05) as well as higher in winter than in autumn (10.64% vs 8.57%, p < 0.05), while no significant difference was observed in the prevalence of RV between spring and summer (23.16% vs 23.19%, p>0.05) or between winter and autumn (19.20% vs 20.21%, p>0.05). The prevalence of ADV among children was significantly higher in autumn and summer than in winter and spring (p < 0.001), with that in autumn higher than in summer (23.01% vs 21.59%, p < 0.05) and that in winter higher than in spring (13.53% vs 7.44%, p < 0.05). The comparison of the prevalence of six respiratory pathogens in different seasons among children is reported in Table 4.
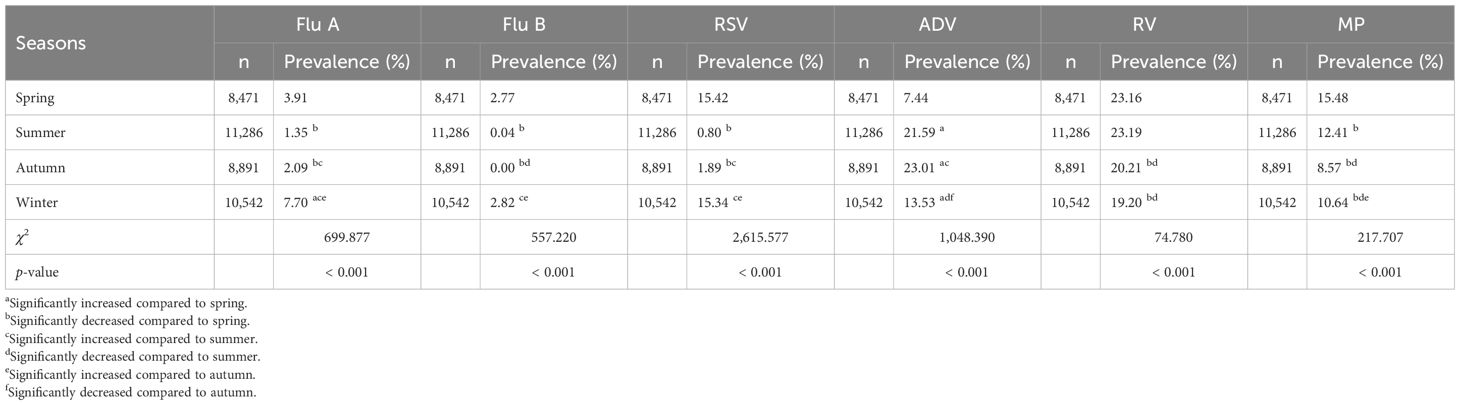
Table 4. Comparison of prevalence of Flu A, Flu B, RSV, ADV, RV and MP in different seasons among children.
There were significant differences in the monthly prevalence of each of the six pathogens among children (χ2 ranging from 1101.382 to 3467.756, with all p < 0.001). The prevalence of Flu A among children was the highest in December (11.84%), followed by March (5.41%) and January (5.30%), while it remained at a relatively low level below 2% from May to July and September to October (ranging from 0.89% to 1.79%). The prevalence of Flu B among children was the highest in January (9.74%), followed by February (4.93%) and March (3.23%), but it stayed at an extremely low level below 0.1% from May to December (ranging from 0.00% to 0.09%). The prevalence of RSV among children was the highest in February (22.92%), followed by January (20.23%) and March (18.32%), while it remained at a relatively low level below 2% from May to September (ranging from 0.33% to 1.67%). The prevalence of ADV among children was generally high, with only January to March showing levels below 10% (ranging from 4.82% to 7.12%), while all other months saw levels above 10%, and from June to September, levels even exceeded 20% (ranging from 21.21% to 29.71%). The prevalence of RV among children exceeded 10% in all months (the lowest of 11.51% in January), with October and November reaching over 30% (34.39% in October and 30.01% in November), and from March to June standing between 20% and 30% (ranging from 23.15% to 29.58%). The prevalence of MP among children was generally high, peaking in January at 27.01%, with levels remaining above 10% from February to August (ranging from 11.11% to 18.93%), while staying above 5% from September to November (ranging from 5.27% to 7.24%) and only December seeing a level below 5% (3.04%). The monthly prevalence of six respiratory pathogens among children is shown in Figure 3.
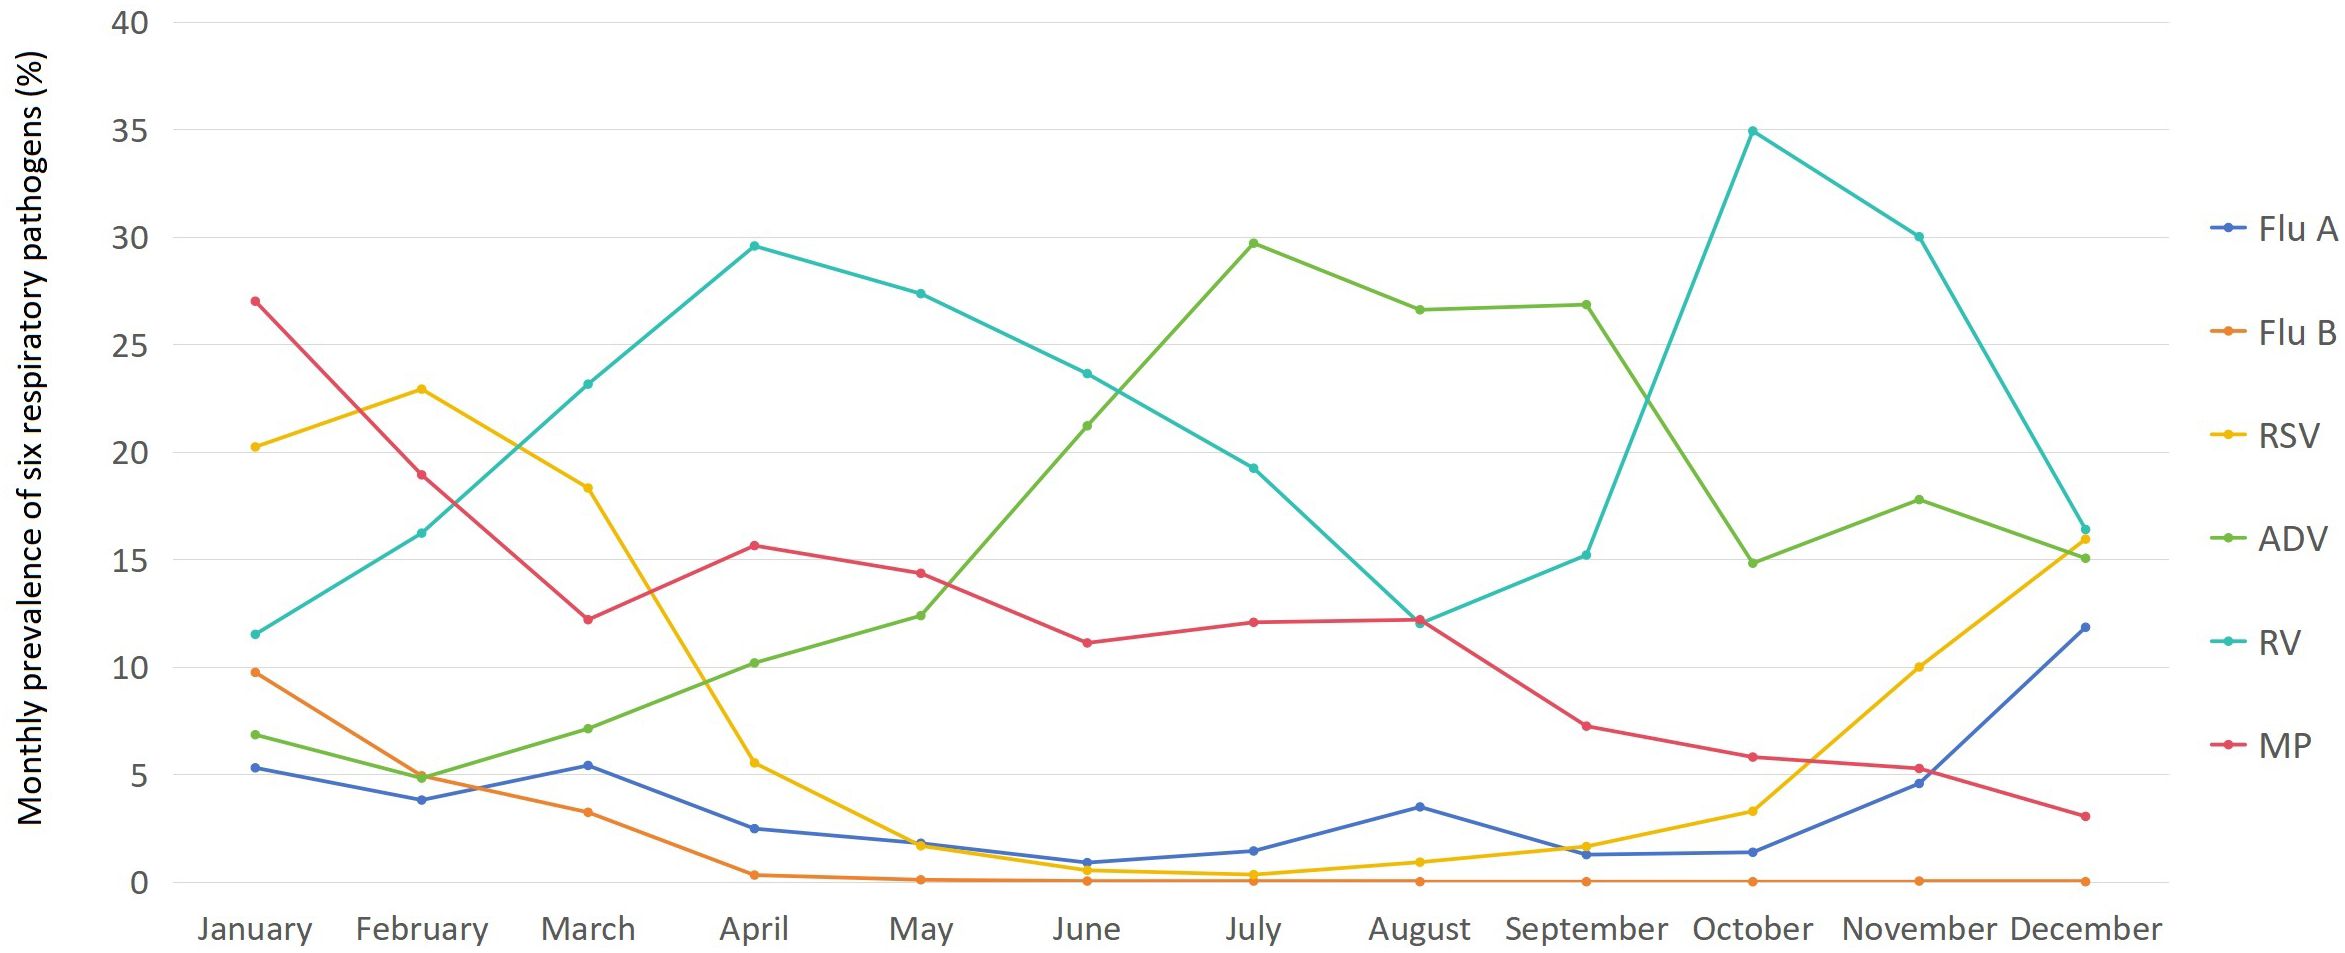
Figure 3. Monthly prevalence of six respiratory pathogens from January to December 2024 (%).
Comparison of the prevalence of six respiratory pathogens in different clinical diagnoses among children
The prevalence of Flu A and Flu B among children was the highest in the SRLT group (10.27% for Flu A and 4.11% for Flu B) and the lowest in the CRDs group (0.76% for Flu A and 0.38% for Flu B), with the remaining clinical diagnosis groups—ALRTIs, AURTIs and NRDs—showing intermediate values. Specifically, for Flu A, the prevalence decreased in the following order: AURTIs (4.74%), NRDs (3.35%), and ALRTIs (3.31%). For Flu B, the order of decreasing prevalence was: NRDs (1.42%), ALRTIs (1.34%), and AURTIs (1.05%). There were significant differences in prevalence among these five groups (all p < 0.001). The prevalence of Flu A in the AURTIs group was significantly higher than that in the ALRTIs group (p < 0.05). However, there was no significant difference in the prevalence of Flu B between the AURTIs group and the ALRTIs group (p>0.05). The prevalence of RSV and MP among children was the highest in the ALRTIs group (10.79% for RSV and 15.41% for MP) and the lowest in the AURTIs group (2.10% for RSV and 3.99% for MP), with the remaining clinical diagnosis groups—CRDs, NRDs and SRLT—showing intermediate values. Specifically, for RSV, the prevalence decreased in the following order: SRLT (7.36%), CRDs (5.70%), and NRDs (3.09%). For MP, the order of decreasing prevalence was: CRDs (9.13%), SRLT (8.98%), and NRDs (4.29%). There were significant differences in prevalence among these five groups (all p < 0.001).
The prevalence of RV among children was the highest in the CRDs group (44.87%) and the lowest in the AURTIs group (14.99%), with the ALRTIs (24.02%), SRLT (18.73%), and NRDs (16.63%) showing intermediate values in descending order; there were significant differences in prevalence among these five groups (p < 0.001). The prevalence of ADV among children was the highest in the AURTIs group (38.09%) and the lowest in the CRDs group (6.84%), with the SRLT (19.93%), NRDs (12.68%), and ALRTIs (11.21%) showing intermediate values in descending order; there were significant differences in prevalence among these five groups (p < 0.001). The comparison of the prevalence of six respiratory pathogens in different clinical diagnoses among children is reported in Table 5.
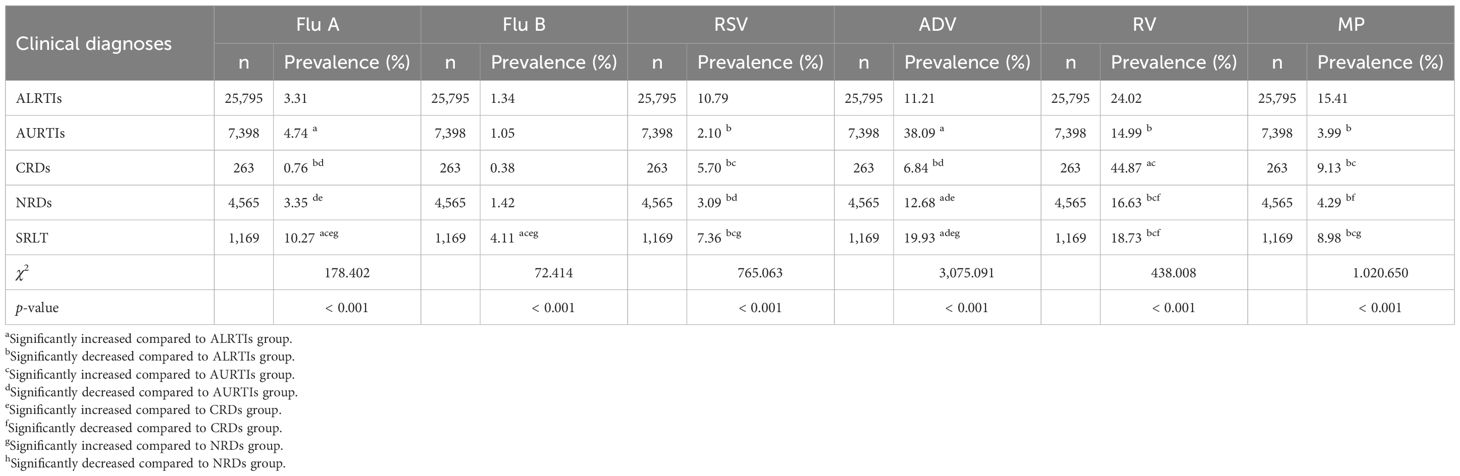
Table 5. Comparison of prevalence of Flu A, Flu B, RSV, ADV, RV and MP in different clinical diagnoses among children.
Associations between Flu A, Flu B, RSV, ADV, RV and MP positivity and variables of gender, age, seasons, clinical diagnoses and medical settings by univariate logistic regression analysis
Univariate logistic regression analysis showed that Flu A, Flu B, RSV, ADV, RV, and MP positivity were significantly associated with medical settings (inpatient vs outpatient, all p < 0.001). Flu B and RV positivity were significantly associated with gender (females vs males, both p < 0.01), but Flu A, RSV, ADV, and MP were not significantly associated with gender (females vs males, all p>0.05). Compared to the newborns, Flu A, ADV, RV, and MP positivity were significantly associated with the infants, toddlers, preschoolers, school-aged children, and adolescents (all p < 0.05). Flu B positivity was significantly associated with the infants, toddlers, preschoolers, and school-aged children (all p < 0.05), but not with the adolescents (p = 0.241). RSV positivity was significantly associated with the infants, toddlers, school-aged children, and adolescents (all p < 0.05), but not with the preschoolers (p = 0.073). Compared to spring, Flu A, ADV, and MP positivity were significantly associated with summer, autumn and winter (all p < 0.001). Flu B positivity was significantly associated with summer (p < 0.001), but not with autumn and winter (both p>0.05). RSV positivity was significantly associated with summer and autumn (both p < 0.001), but not with winter (p = 0.881). RV positivity was significantly associated with autumn and winter (both p < 0.001), but not with summer (p = 0.965). Compared to ALRTIs group, RSV, ADV, RV, and MP positivity were significantly associated with AURTIs, CRDs, NRDs and SRLT groups (all p < 0.05). Flu A positivity was significantly associated with AURTIs, CRDs and SRLT groups (all p < 0.05), but not with NRDs group (p = 0.898). Flu B positivity was significantly associated with SRLT group (p < 0.001), but not with AURTIs, CRDs, and NRDs groups (all p>0.05). The associations between Flu A, Flu B, RSV, ADV, RV and MP positivity and variables of gender, age, seasons, clinical diagnoses and medical settings among children are reported in Table 6 and its (Continued).
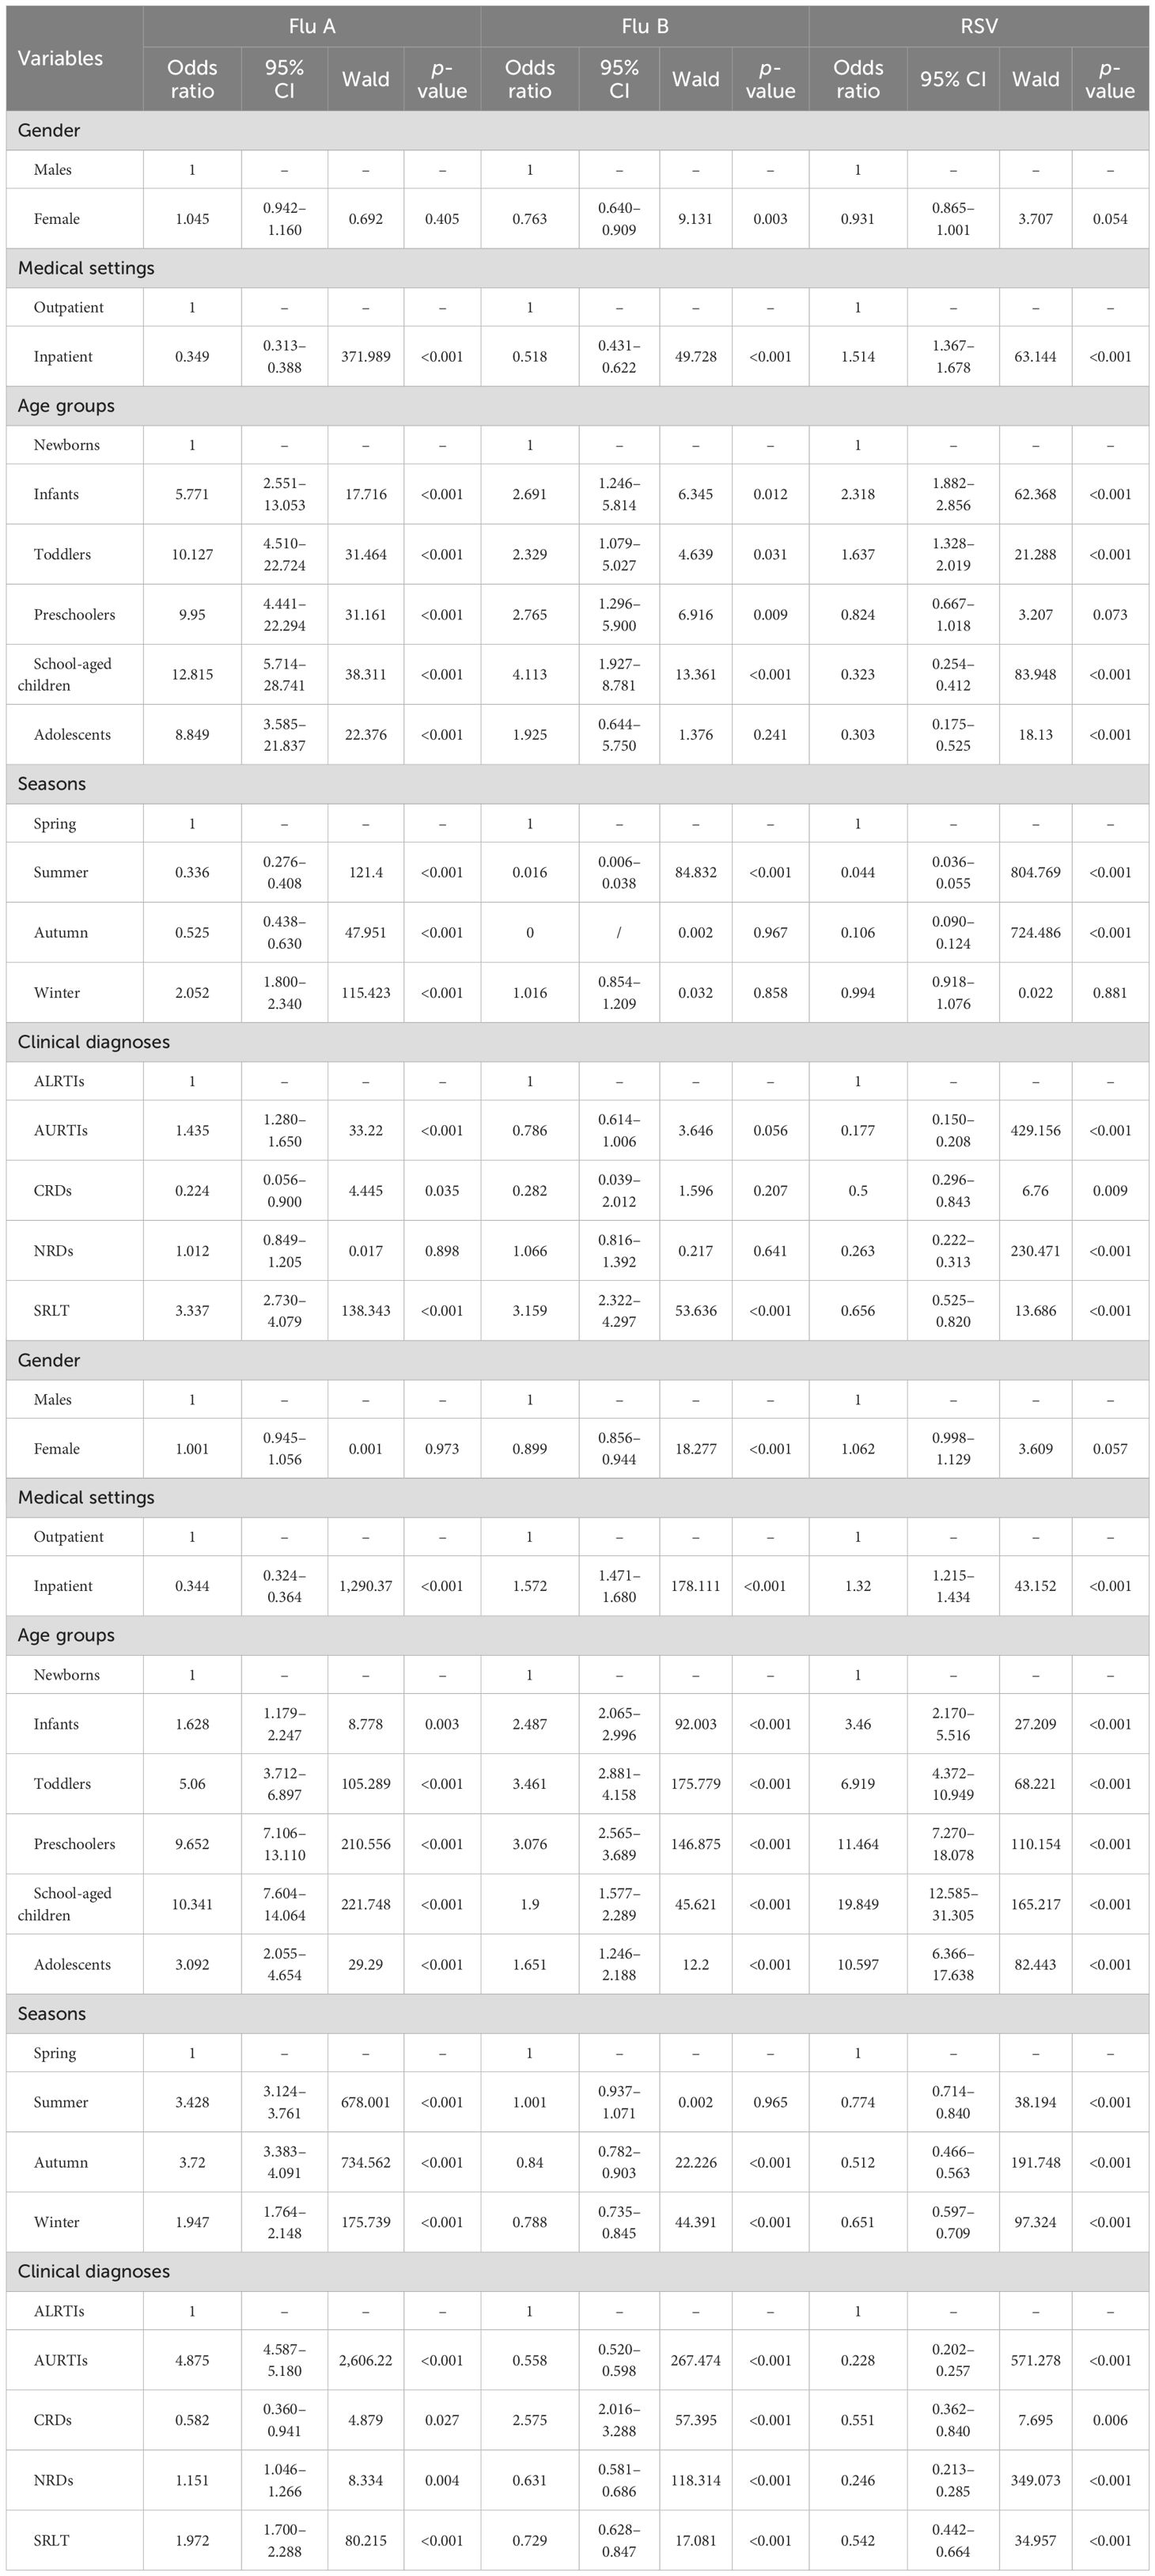
Table 6. Univariate logistic regression analysis of the association between Flu A, Flu B, RSV, ADV, RV and MP positivity and variables of gender, age, seasons, clinical diagnoses and medical settings among children.
Multivariate logistic regression analysis results for associations between six respiratory pathogens positivity and associated variables (stepwise forward Wald)
Table 7 and its (Continued) present the results of stepwise multivariate logistic regression analysis after adjustment for potential confounders. Flu B positivity was independently associated with gender (females vs males, OR: 0.742, 95% CI: 0.621–0.887, p = 0.001). Similarly, RV positivity was also independently associated with gender (females vs males, OR: 0.918, 95% CI: 0.873–0.964, p < 0.001). However, no association was observed between Flu A, ADV, RSV, or MP positivity and gender (females vs males). Flu A, Flu B, ADV, RV, and MP positivity were independently associated with medical settings (inpatient vs outpatient, all p < 0.01), but RSV positivity was not associated with medical settings. Compared with the newborns, Flu A, RV, and MP positivity were independently associated with the infants, toddlers, preschoolers, school-aged children, and adolescents (all p < 0.001), with all these age groups showing higher ORs. The highest OR was observed in the school-aged children for the Flu A model (OR: 9.410, 95% CI: 4.183–21.165), the toddlers for the RV model (OR: 4.003, 95% CI: 3.328–4.814), and the school-aged children for the MP model (OR: 31.875, 95% CI: 20.179–50.351), respectively. Flu B positivity was independently associated with the infants, preschoolers, and school-aged children (all p < 0.05), with all these groups showing higher ORs and the school-aged children having the highest (OR: 3.905, 95% CI: 1.819–8.383). ADV positivity was independently associated with the toddlers, preschoolers, school-aged children, and adolescents (all p < 0.01), with all these groups showing higher ORs and the preschoolers having the highest (OR: 6.361, 95% CI: 4.673–8.659). RSV positivity was independently associated with the infants, toddlers, school-aged children, and adolescents (all p < 0.01): higher ORs were observed in the infants and toddlers, while lower ORs were seen in the school-aged children and adolescents.
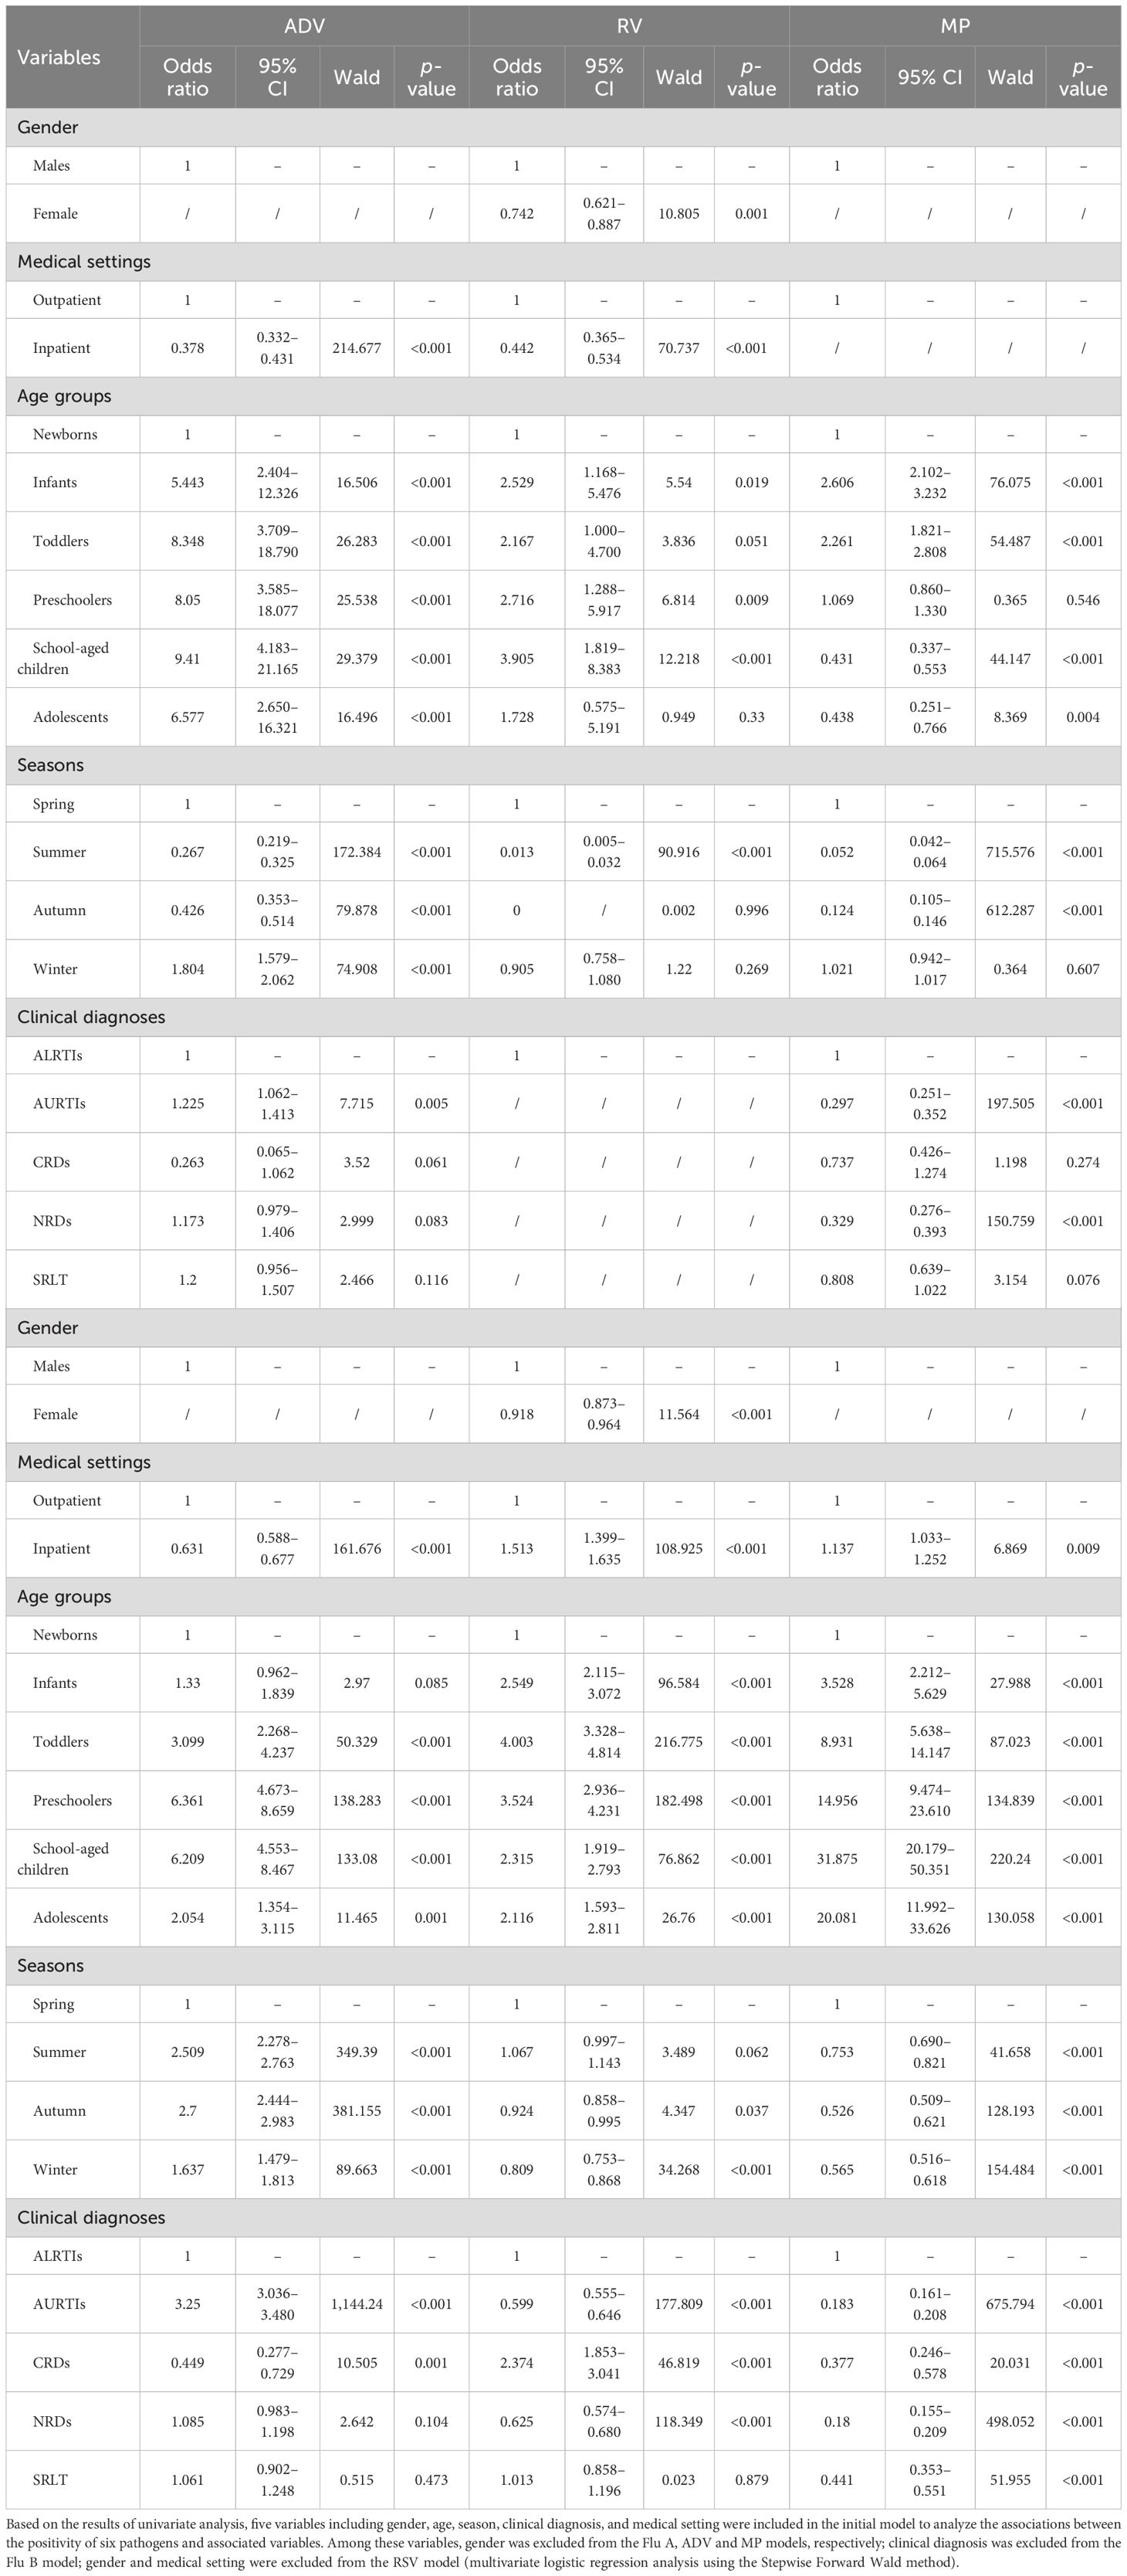
Table 7. Multivariate logistic regression (Stepwise Forward Wald) for Flu A, Flu B, RSV, ADV, RV and MP positivity among 39,190 children aged 0–18.
Compared with spring, Flu A, ADV, and MP positivity were independently associated with summer, autumn, and winter (all p < 0.001). In the ADV model, ORs were elevated in summer, autumn, and winter, peaking in autumn (OR: 2.700, 95% CI: 2.444–2.983). Conversely, the MP model showed reduced ORs during these seasons, with the lowest value in autumn (OR: 0.526, 95% CI: 0.509–0.621), while the Flu A model had a higher OR only in winter and lower ones in summer and autumn. For the Flu B model, season (summer vs spring, OR: 0.013, 95% CI: 0.005–0.032, p < 0.001) was independently associated with Flu B positivity. However, there were no significant differences in Flu B positivity between autumn and spring (p = 0.996) or between winter and spring (p = 0.269). For the RSV model, seasons (summer vs spring, OR: 0.052, 95% CI: 0.042–0.064; autumn vs spring, OR: 0.124, 95% CI: 0.105–0.146, both p < 0.001) were independently associated with RSV positivity. However, there was no significant difference in RSV positivity between winter and spring (p = 0.607). For the RV model, seasons (autumn vs spring, OR: 0.924, 95% CI: 0.858–0.995; winter vs spring, OR: 0.809, 95% CI: 0.753–0.868, both p < 0.05) were independently associated with RV positivity. However, there was no significant difference in RV positivity between summer and spring (p = 0.062).
In five different clinical diagnostic groups, clinical diagnosis was excluded in the Flu B model. For the Flu A model, compared with the ALRTIs group, Flu A positivity was independently associated with a higher OR in the AURTIs group (OR: 1.225, 95% CI: 1.062–1.413, p = 0.005), but not significantly associated with the CRDs, NRDs, and SRLT groups (all p>0.05). For the RSV model, compared with the ALRTIs group, RSV positivity was independently associated with lower ORs in the AURTIs group (OR: 0.297, 95% CI: 0.251–0.352, p < 0.001) as well as the NRDs group (OR: 0.329, 95% CI: 0.276–0.393, p < 0.001), but not significantly associated with the CRDs and SRLT groups (both p>0.05). For the ADV model, compared with the ALRTIs group, ADV positivity was independently associated with a higher OR in the AURTIs group (OR: 3.250, 95% CI: 3.036–3.480, p < 0.001) and a lower OR in the CRDs group (OR: 0.449, 95% CI: 0.277–0.729, p = 0.001), but not significantly associated with the NRDs and SRLT groups (both p>0.05). For the RV model, compared with the ALRTIs group, RV positivity was independently associated with a higher OR in the CRDs group (OR: 2.374, 95% CI: 1.853–3.041, p < 0.001) and lower ORs in the AURTIs group (OR: 0.599, 95% CI: 0.555–0.646, p < 0.001) as well as in the NRDs group (OR: 0.625, 95% CI: 0.574–0.680, p < 0.001), but not significantly associated with the SRLT group (p = 0.879). For the MP model, compared with the ALRTIs group, MP positivity was independently associated with lower ORs in the AURTIs, CRDs, NRDs and SRLT groups, with the lowest OR in the NRDs group (OR: 0.180, 95% CI: 0.155–0.209, p < 0.001).
Discussion
RTIs are common respiratory diseases among children and are the main cause of morbidity, hospitalization and death among children and cause economic losses to both families and society, with pathogen distribution patterns varying by region, age, and season (Zhu et al., 2021; Neumann and Kawaoka, 2022; GBD 2021 Lower Respiratory Infections and Antimicrobial Resistance Collaborators, 2024). Due to overlapping infections involving different pathogens (including viruses and atypical pathogens) and the numerous similarities in their clinical manifestations, diagnosing the pathogens causing RTIs poses a significant challenge. Different pathogens typically require distinct treatment strategies: for instance, viral infections may call for antiviral drugs, symptomatic interventions, and other forms of supportive care, while infections caused by MP usually respond to specific antibiotics (Wahab et al., 2022; Georgakopoulou et al., 2024). However, their shared symptoms such as fever and cough make it difficult to distinguish them based solely on clinical manifestations, which underscores the need for accurate pathogen detection to guide targeted treatment.
A retrospective study on patients’ respiratory specimens in Tengzhou China, tested for Flu A, Flu B, RSV, ADV, RV, and MP between November 2023 and January 2024 by Ma H et al (Ma et al., 2025), showed that 47.4% were identified as single-pathogen infections, 10.9% as dual-pathogen infections, and 1.5% as infections involving three or more pathogens. Flu A was the most frequently detected pathogen (27.5%), followed by RSV (10.1%), ADV (9.7%), MP (4.6%), RV (4.5%), and Flu B (2.9%). Another retrospective study, analyzing the same six respiratory pathogens among children in Yongzhou, China, from June 2023 to May 2024, by Tang Z et al (Tang et al., 2025), reported an overall prevalence of 77.0%: 52.0% single-pathogen infections and 25.0% mixed infections. RV had the highest prevalence (32.4%), followed by MP (20.9%), ADV (19.2%), RSV (14.1%), Flu A (11.5%), and Flu B (8.3%).
Our study shows that more than half (55.53%) of the children were infected with at least one of the six respiratory pathogens. The overall prevalence of single infection, double co-infection, and triple co-infection was 48.19%, 7.09%, and 0.25%, respectively, with no quadruple, quintuple, or sextuple co-infections (i.e., 4, 5, or 6 pathogens) observed. The pathogen-specific prevalence from the highest to the lowest was as follows: RV (21.43%), ADV (16.69%), MP (11.73%), RSV (8.12%), Flu A (3.78%), and Flu B (1.37%) (χ2 = 12,221.187, p < 0.001). For single infections, the pathogens with the highest prevalence were RV (16.32%), ADV (12.98%), and MP (8.76%), while those with the lowest prevalence were Flu B (1.01%), Flu A (3.00%), and RSV (6.12%). For double co-infections, the combinations with the highest prevalence were ADV+RV (2.18%), RV+MP (1.48%), and RSV+RV (0.94%), whereas those with the lowest prevalence were Flu A+Flu B (0.01%), Flu B+ADV (0.05%), and Flu B+RV (0.05%). For triple co-infections, ADV+RV+MP (0.08%), RSV+ADV+RV (0.05%), and RSV+RV+MP (0.03%) showed the highest prevalence, in contrast to the three combinations including Flu A+Flu B+ADV, Flu A+RSV+MP, and Flu B+RSV+ADV, for which no cases were detected.
The overall prevalence of the six pathogens and the prevalence of single-pathogen infections in this study were both lower than those in the Tang Z et al. study but close to those in the Ma H et al. study. However, the prevalence of multiple infections in this study was lower than that in both the Ma H et al. (10.9% dual, 1.5% triple or more) and the Tang Z et al. studies (25.0% mixed). Notably, this study further delineated the prevalence hierarchy of specific double and triple co-infection combinations—for example, ADV+RV was the most common dual combination (2.18%), and ADV+RV+MP was the most frequent triple combination (0.08%). This distinction may stem from regional differences in dominant pathogen circulation: ADV and RV, the dominant pathogens of the most prevalent co-infection combinations in our study, had relatively higher overall prevalence locally (16.69% and 21.43%, respectively) compared with the Ma H et al. study (ADV: 9.7%, RV: 4.5%), potentially increasing their chance of co-infections.
Moreover, no cases of infections involving four or more pathogens were observed in the present study, which aligns with the lack of such reports in the Ma H et al. and the Tang Z et al. studies, suggesting that quadruple or higher co-infections may be rare in pediatric respiratory infections. In terms of specific pathogens, among the six pathogens in this study, Flu B had the lowest prevalence, followed by Flu A and RSV, while RV had the highest prevalence, which is consistent with the findings of Tang Z et al. However, our study found that ADV was the second highest and MP the third highest, which differs somewhat from the results of Tang Z et al. (where MP was second and ADV third). These differences indicate that the infection characteristics of respiratory pathogens—such as overall prevalence, types of single infections and multiple co-infections, and ranking of dominant pathogen prevalence—may be influenced by factors including study population, time frames, regional differences (e.g., geographic locations) and region-specific epidemic patterns.
In the present study, the prevalence of Flu B and RV was slightly higher among male children than among female children (1.53% vs 1.17% for Flu B, 22.22% vs 20.44% for RV, both p < 0.01). However, there was no significant difference in the prevalence of Flu A, RSV, ADV, and MP between male and female children (all p>0.05). After adjustment for potential confounders, multivariate logistic regression analysis showed that Flu B positivity was independently associated with gender (females vs males, OR: 0.742, 95% CI: 0.621–0.887, p = 0.001), and RV positivity was also independently associated with gender (females vs males, OR: 0.918, 95% CI: 0.873–0.964, p < 0.001). These results suggest that gender could be a contributing factor in the incidence of Flu B and RV infections among children: the higher prevalence of Flu B and RV in male children, along with the significant OR values from the regression analysis, indicates potential underlying biological or behavioral gender differences impacting susceptibility to these pathogens, though it’s important to note that sampling errors might influence this difference and affect the generalizability of our findings.
Gender impacts outcomes of various respiratory viral infections, with gender differences in pathogenesis evident across viruses like RSV and influenza throughout the life course. Notably, males tend to be more vulnerable to severe outcomes from such infections at younger and older ages (Ursin and Klein, 2021). These broader trends are supported by specific epidemiological data from Peer V et al (Peer et al., 2025), who conducted an 11-year analysis (2012–2022) of acute respiratory tract infections (ARTIs) among hospitalized cases at Sheba Medical Center, Israel. Focusing on pathogens including ADV, influenza viruses, RV, RSV, and others, their study revealed a male excess in infection rates for all viruses, with the most notable differences in the youngest age groups (<1 year and 1–4 years). Specifically, males were more likely to be positive for RV and influenza virus in infancy and toddlers, with RV positivity 40% and 25% higher, and influenza incidence rates 42% and 28% higher, respectively, which supports the gender-associated trend we observed for RV and Flu B (a type of influenza virus). These findings reinforce that male children may generally have a higher susceptibility to certain respiratory viruses such as RV and influenza viruses, particularly in toddlers.
Reports on differences in prevalence between outpatient and inpatient settings for these six respiratory pathogens are limited. A study by Nduaguba SO et al (Nduaguba et al., 2023), which assessed over 8 seasons and years from 2011 to 2019 among children under 5 years old, showed that the annual outpatient RSV infection rates for all age groups were higher than those of inpatient settings (1.29% vs 0.14%). While another study by Yu J et al (Yu et al., 2018). on ARTIs in 11 hospitals in North China from 2012 to 2015 showed that RSV was the most common virus in hospitalized children under 2 years old (33.3%), whereas influenza virus was the most common in outpatient/emergency patients across all age groups (22.7%). Our data showed that the prevalence of Flu A, Flu B, and ADV among children was higher in outpatient than in inpatient settings (all p < 0.001), while the prevalence of RSV, RV, and MP among children was lower in outpatient than in inpatient settings (all p < 0.001). Multivariate logistic regression analysis revealed that Flu A, Flu B, ADV, RV, and MP positivity were independently associated with medical settings (inpatient vs outpatient, all p < 0.01), but RSV positivity was not associated with medical settings.
These findings indicate that the association between the prevalence of respiratory pathogens and medical settings varies by pathogen, age, and region. For instance, Nduaguba SO et al. reported higher outpatient RSV rates among children under 5 in the U.S., while Yu J et al. observed higher RSV prevalence in hospitalized children under 2 in North China. Our results, which showed lower outpatient RSV prevalence and higher outpatient prevalence of Flu A and Flu B, are consistent with the findings of Yu J et al. that influenza viruses were the most common in outpatient/emergency patients across all age groups. Notably, despite unadjusted differences in RSV prevalence, our multivariate analysis found no association between RSV positivity and medical settings, implying that confounding factors (e.g., disease severity) may influence its prevalence distribution, and these findings warrant further investigation.
Numerous studies have indicated significant associations between the prevalence of respiratory pathogens and age among children (Jiang et al., 2021; Li et al., 2024; Wu et al., 2024). Zhu G et al (Zhu et al., 2021). showed that viral infection positivity varied significantly across age groups. ADV positivity was the highest among children aged 3–6 years (18.7%), while Flu A and Flu B were most prevalent in those over 6 years old (21.6% and 6.6%, respectively), and RSV positivity was the highest in infants under 1 year old (10.6%). Lv G et al (Lv et al., 2024). found that infants had a higher RSV infection rate (4.25%) than toddlers (1.98%) and older (preschoolers and school-aged) children (0.24%). Toddlers had a higher RV infection rate (6.34%) than infants (4.19%) and older children (2.82%). Flu A and MP infection rates were higher in older children (4.53% and 3.37%, respectively) than in infants (0.36% and 0.10%, respectively) and toddlers (1.65% and 0.16%, respectively). Flu B infection rates showed no significant age-associated difference.
More recently, a retrospective analysis of 11,538 children with RTIs between December 2022 and November 2023 showed that among children in different age groups, the older the children, the higher the infection rate of Flu A and MP, and the younger the children, the higher the positive rate of RSV, while the positive rate of ADV in children aged 3–6 years and > 6 years was higher than that in children aged 0–3 years (Wang et al., 2024). Another study analyzed 9,294 children aged 0–18 years with ARTIs symptoms from July 2023 to August 2024. This study revealed that the detection rates of pathogens varied among different age groups: MP was most common in school-aged children, while Flu A was more frequent in preschoolers (He et al., 2025).
In our study, the prevalence of Flu A, Flu B, ADV, and MP was the highest in school-aged children (5.05%, 1.96%, 24.00%, 20.85%) and the lowest in newborns (0.41%, 0.48%, 2.96%, 1.31%), significant differences were obtained in prevalence across six age groups (all p < 0.001); RSV was most prevalent in infants (15.31%) and least in adolescents (2.31%), with significant intergroup differences (p < 0.001); RV peaked in toddlers (26.20%) and was the lowest in newborns (9.30%; p < 0.001 across groups). Multivariate logistic regression (compared with newborns) showed Flu A, RV, and MP positivity were independently associated with all other age groups (higher ORs, all p < 0.001), with peak ORs in school-aged children for Flu A (OR: 9.410, 95% CI: 4.183–21.165) and MP (OR: 31.875, 95% CI: 20.179–50.351), and in toddlers for RV (OR: 4.003, 95% CI: 3.328–4.814); Flu B positivity associated with infants, preschoolers, and school-aged children (all p < 0.05), peaking in school-aged children (OR: 3.905, 95% CI: 1.819–8.383); ADV positivity associated with toddlers, preschoolers, school-aged children, and adolescents (all p < 0.01), with the highest OR in preschoolers (OR: 6.361, 95% CI: 4.673–8.659); RSV positivity associated with infants, toddlers, school-aged children, and adolescents (all p < 0.01), with higher ORs in infants/toddlers but lower in school-aged children/adolescents.
Our findings are largely consistent with previous studies, reinforcing the age-associated pattern of pediatric respiratory pathogen prevalence. Flu A and MP showed higher rates in older children across our data and prior research by Zhu G et al., Lv G et al., and the 2022–2023 retrospective analysis, with school-aged children most affected, supporting age-associated exposure or immune response differences; RSV, consistent with earlier work by Lv G et al. and the 2022–2023 analysis, was most prevalent in infants in our study, highlighting their vulnerability likely tied to immature immunity; ADV aligned with Zhu G et al. in showing peak rates in preschool/school-aged children, with our regression pinpointing preschoolers as the most strongly associated group; RV mirrored Lv G et al. in having the highest prevalence in toddlers, confirming this age as a key prevention target. Notably, our inclusion of newborns and adolescents adds nuance: newborns had the lowest rates (possibly due to maternal antibodies and/or their low probability of pathogen contact), while adolescents showed lower prevalence than school-aged children, reflecting shifting immunity and behavior. These consistent patterns underscore the need for age-specific strategies.
It is well-known that respiratory virus prevalence is significantly associated with seasons. Before SARS-CoV-2, Perez A et al (Perez et al., 2022). noted seasonal patterns, with influenza and RSV peaking in late autumn and winter. Chen Z et al (Chen et al., 2024). found COVID-19 significantly altered global seasonal influenza spread over three years. Similarly, Zhao X et al (Zhao et al., 2025). reported differing respiratory virus prevalence across pre-pandemic (2019), pandemic (2020–2022), and post-pandemic (2023) phases (p < 0.001): Flu A and Flu B predominated in winter-spring, RSV peaked in winter, and ADV had no distinct pattern. After SARS-CoV-2, Zhao C et al (Zhao et al., 2025). from the Respiratory Virus Global Epidemiology Network noted altered seasonal patterns and asynchronous resurgence with non-pharmaceutical interventions eased: their 92-site analysis revealed RV resurged first, followed by seasonal coronaviruses, parainfluenza viruses, RSV, ADV, metapneumovirus, and Flu A, with Flu B exhibiting the latest resurgence; the second resurgence was similar except Flu A caught up with metapneumovirus. This asynchrony reflects virus-specific adaptability to post-pandemic seasonal conditions.
Our study showed Flu A, Flu B, and RSV prevalence was higher in spring and winter than summer and autumn (p < 0.001); Flu A was more prevalent in winter than spring (7.70% vs 3.91%, p < 0.05), with no winter-spring differences for Flu B (2.82% vs 2.77%, p>0.05) or RSV (15.34% vs 15.42%, p>0.05). MP and RV were more common in spring and summer (p < 0.001); MP was higher in spring than summer (15.48% vs 12.41%, p < 0.05) and winter than autumn (10.64% vs 8.57%, p < 0.05), while RV showed no spring-summer (23.16% vs 23.19%, p>0.05) or winter-autumn (19.20% vs 20.21%, p>0.05) differences. ADV prevalence was significantly higher in autumn and summer than in winter and spring (p < 0.001), with that in autumn higher than in summer (23.01% vs 21.59%, p < 0.05) and that in winter higher than in spring (13.53% vs 7.44%, p < 0.05). Multivariate regression (compared with spring) showed Flu A, ADV, and MP were independently associated with summer, autumn, and winter (all p < 0.001): ADV had the highest OR in autumn (OR: 2.700, 95% CI: 2.444–2.983); MP had the lowest OR in autumn (OR: 0.526, 95% CI: 0.509–0.621); Flu A had higher OR in winter but lower in summer/autumn. Flu B associated with summer (OR: 0.013, p < 0.001), not autumn and winter. RSV associated with summer (OR: 0.052) and autumn (OR: 0.124, both p < 0.001), not winter. RV associated with autumn (OR: 0.924) and winter (OR: 0.809, both p < 0.05), not summer.
Our findings align with and extend prior observations. Consistent with Perez A et al., who noted pre-pandemic influenza and RSV peaked in late autumn and winter, our data showed Flu A, Flu B, and RSV predominated in winter and spring. However, we further found that RSV maintained high levels across both seasons rather than peaking strictly in winter, and Flu A was more prevalent in winter than spring. In line with Zhao X et al., who reported differing prevalence across pre-pandemic, pandemic, and post-pandemic phases, our results confirmed the winter-spring dominance of Flu A and Flu B but added refinements: Flu B showed no significant difference between winter and spring, and ADV, which was previously thought to have no distinct pattern, exhibited a clear autumn-summer predominance. This supports Zhao C et al. observation of post-pandemic virus-specific adaptability. Consistent with Zhao C et al., who identified RV as the first to resurge post-pandemic, our study found RV was most prevalent in spring and summer. MP spring-summer peak reflected stable seasonal trends, with multivariate ORs such as ADV strongest association with autumn and Flu A with winter further reinforcing these virus-specific seasonal associations.
We found that in addition to seasonal variations of six pathogens, significant monthly differences were observed in their prevalence. Flu A peaked in December (11.84%), followed by March (5.41%) and January (5.30%), with low levels (<2%) from May–July and September–October. Flu B was the highest in January (9.74%), then in February (4.93%) and March (3.23%), but extremely low (<0.1%) from May–December. RSV peaked in February (22.92%), January (20.23%), and March (18.32%), with low levels (<2%) from May–September. ADV was generally high: <10% only in January–March, >20% in June–September. RV exceeded 10% monthly (the lowest prevalence 11.51% in January), with >30% in October–November and 20–30% in March–June. MP was high overall, peaking in January (27.01%), >10% from February–August, >5% from September–November, and <5% only in December (3.04%). These monthly prevalence characteristics further reflect the potential association between China’s seasonal weather conditions (e.g., temperature, humidity) and pathogen transmission, laying a foundation for subsequent analysis of seasonal patterns.
Our analysis identifies the observed monthly prevalence differences as re-emerging seasonal patterns of these pathogens in Chengdu, Southwest China—a subtropical humid region. Notably, the December peak of Flu A, January-February peaks of RSV, and their sustained high prevalence in spring directly mirror this environment-driven seasonality. These trends align with the well-documented seasonality of respiratory viruses, shaped by environmental drivers (e.g., temperature, humidity) and their combined effects on virus stability, transmission, and host immune responses (Moriyama et al., 2020). For instance, the prominent winter peaks of influenza and RSV reflect their enhanced transmission under cold conditions: experimental evidence confirms influenza aerosol spread is favored by low temperature (e.g., 5 °C) and low relative humidity (e.g., 20%) (Lowen et al., 2007), while low absolute humidity further enhances the stability and airborne spread of influenza viruses (Shaman and Kohn, 2009). For RSV, its circulation correlates positively with rainfall and relative humidity and negatively with temperature in subtropical settings, consistent with Chengdu’s climate (Thongpan et al., 2020). The summer-autumn predominance of ADV and spring-summer peaks of RV/MP may relate to Chengdu’s subtropical environmental features, though further research is needed to confirm drivers. Thus, our monthly prevalence data validate the association between Chengdu’s seasonal weather and pathogen activity, supporting environmental drivers in regional viral seasonality and aligning with global influenza/RSV findings.
Beyond patterns associated with gender, medical settings, age, and seasons, exploring variations in these respiratory pathogens across different clinical diagnoses such as ALRTIs and AURTIs can further enhance our understanding of their clinical relevance and etiological associations. A previous systematic review and meta-analysis by Nair H et al (Nair et al., 2011), which included studies published from January 1, 1995, to October 31, 2010, identified influenza as a common pathogen in children with ALRTIs. It also noted that influenza imposes a significant burden on global health services. Another systematic review and meta-analysis by Pratt MTG et al (Pratt et al., 2022). covering studies published between January 1, 1995, and December 31, 2019, found that RSV (22.7%) and RV (22.1%) were the most common causes of pediatric pneumonia worldwide. A systematic analysis by Li Y et al (Li et al., 2022). showed that globally in 2019, among children aged 0–60 months, there were 33.0 million RSV-associated ALRTIs episodes, 3.6 million RSV-associated hospital admissions, 26,300 RSV-associated in-hospital deaths, and 101,400 total RSV-attributable deaths. Shieh WJ et al (Shieh, 2022). reported that ADV infection can cause both AURTIs, presenting with common cold-like symptoms such as rhinorrhea, fever, cough, and sore throat, and ALRTIs including bronchitis, bronchiolitis, and pneumonia. Similarly, Kumar S et al (Kumar and Kumar, 2023). found that MP infection can affect the upper respiratory tract, lower respiratory tract, or both.
We found that the prevalence of respiratory pathogens among children varied significantly across five clinical groups (ALRTIs, AURTIs, CRDs, NRDs, SRLT). Flu A and Flu B were most prevalent in the SRLT group (10.27%, 4.11%) and least in the CRDs group (0.76%, 0.38%), with the AURTIs group having higher Flu A prevalence than the ALRTIs group (p < 0.05). RSV and MP were most common in the ALRTIs group (10.79%, 15.41%) and least in the AURTIs group (2.10%, 3.99%). RV prevalence was the highest in the CRDs group (44.87%) and the lowest in the AURTIs group (14.99%), while ADV was most prevalent in the AURTIs group (38.09%) and least in the CRDs group (6.84%) (all p < 0.001 for inter-group differences). Multivariate logistic regression showed distinct pathogen associations across clinical groups compared with ALRTIs. The AURTIs group had higher Flu A (OR: 1.225) and ADV (OR: 3.250) positivity but lower RSV (OR: 0.297) and RV (OR: 0.599). The CRDs group featured higher RV (OR: 2.374) and lower ADV (OR: 0.449). NRDs had reduced RSV (OR: 0.329), RV (OR: 0.625), and notably MP (the lowest OR: 0.180), while SRLT only showed lower MP. Flu B had no group associations.
Our findings, integrated with prior research, reveal distinct pathogen distributions across the five clinical groups, and these patterns associate clinical diagnoses to pathogen-specific risks, aiding targeted management. Flu A and Flu B showed the highest prevalence in the SRLT group and the lowest in the CRDs group. Additionally, the AURTIs group had a significantly higher Flu A prevalence compared with the ALRTIs group (p < 0.05). Aligning with Pratt MTG et al. on RSV significance, RSV dominated in ALRTIs (10.79%) but was less common in AURTIs (OR: 0.297) and NRDs (OR: 0.329). ADV ability to cause both AURTIs and ALRTIs, as noted by Shieh WJ et al., was further supported by our findings showing its high prevalence in the AURTIs group (38.09%, OR: 3.250) and low prevalence in the CRDs group (6.84%, OR: 0.449). MP can affect both respiratory tracts as Kumar S et al. noted, which aligns with our finding of its presence across groups. However, our study further specifies its predominance in ALRTIs (15.41%) and lower rates in AURTIs (3.99%) and NRDs (OR: 0.180), whereas their research focuses on its dual-tract involvement. Notably, RV shows a distinct distribution across clinical groups, with the highest prevalence in CRDs (44.87%, OR: 2.374) and a lower but still substantial rate in AURTIs (14.99%). This further underscores these pathogen-clinical associations and supports tailored diagnostic and management strategies.
Limitations
Firstly, limitations of single-site data: Data were derived from a single-site, resulting in a relatively narrow sample source. Future multi-center, large-scale studies are needed to improve the reliability of results and the generalizability of conclusions.
Secondly, limitations of the retrospective design: This study used a retrospective cross-sectional design, which may restrict us from establishing causal associations between pathogens and clinical outcomes—e.g., whether specific pathogens directly contribute to severe symptoms in certain age groups or diagnoses. Future prospective studies could help clarify such causal associations.
Thirdly, limited pathogen spectrum: Only six common respiratory pathogens (Flu A, Flu B, RSV, ADV, RV, MP) were included, excluding others like parainfluenza viruses, metapneumovirus, Chlamydia pneumoniae, Streptococcus pneumoniae, and Klebsiella pneumoniae. This may underestimate overall respiratory infection burden, overlook interactions between untested and tested pathogens, and fail to account for the potential role of Klebsiella pneumoniae (a common opportunistic bacterial pathogen associated with respiratory infections, especially in immunocompromised or hospitalized children) in pediatric RTIs. Expanding pathogen coverage to include Klebsiella pneumoniae and other untested pathogens is planned in follow-up research.
Fourthly, lack of detailed contextual data: Relevant factors influencing pathogen distribution—such as children’s vaccination status (e.g., influenza coverage), underlying conditions beyond defined clinical groups, and environmental exposures (e.g., daycare attendance)—were unanalyzed. Subsequent studies will include such contextual variables.
Finally, exclusion of coronaviruses: Our detection panel did not include coronaviruses, notably SARS-CoV-2. This precluded a dedicated assessment of their co-circulation and co-infection patterns with the six tested pathogens. Given the context of the COVID-19 pandemic, this represents a significant limitation, as it may lead to an incomplete understanding of the overall respiratory pathogen profile. Future studies should employ more comprehensive panels that incorporate coronaviruses.
Conclusions
In the present study, using multiplex PCR, we found that over half of the children in the study population were infected with at least one of the six respiratory pathogens. The predominant pathogens were RV, ADV, and MP. While single infections constituted the majority, multiple co-infections were also observed. Among these, the most common dual and triple combinations were ADV+RV and ADV+RV+MP, respectively. Notably, the prevalence of these pathogens varied significantly across different groups. By age, school-aged children had the highest rates of Flu A, Flu B, ADV, and MP; infants were most susceptible to RSV; and toddlers had the highest RV prevalence. Seasonally, Flu A, Flu B, and RSV were more prevalent in spring and winter, MP and RV in spring and summer, and ADV in autumn and summer. Among clinical diagnoses, Flu A and Flu B were most common in SRLT, RSV and MP in ALRTIs, RV in CRDs, and ADV in AURTIs. Multiplex PCR enabled simultaneous detection of multiple respiratory pathogens in a single test, enhancing efficiency by reducing sample volume and testing time while facilitating accurate identification of both single and co-infections.
Data availability statement
The raw data supporting the conclusions of this article will be made available by the authors, without undue reservation.
Ethics statement
The studies involving humans were approved by Medical Ethics Committee of Chengdu Women’s and Children’s Central Hospital. The studies were conducted in accordance with the local legislation and institutional requirements. Written informed consent for participation was not required from the participants or the participants’ legal guardians/next of kin because Informed consent from participants was waived due to the retrospective cross-sectional nature of the present study. However, strict measures were implemented to protect the privacy of all participants’ information.
Author contributions
CL: Software, Data curation, Validation, Resources, Investigation, Supervision, Writing – review & editing, Visualization, Project administration, Writing – original draft, Formal Analysis, Funding acquisition, Conceptualization, Methodology. JL: Investigation, Writing – review & editing, Resources, Methodology, Formal Analysis, Project administration, Conceptualization, Supervision. YD: Investigation, Project administration, Methodology, Data curation, Validation, Conceptualization, Writing – review & editing, Software. QW: Methodology, Formal Analysis, Software, Writing – original draft, Investigation, Conceptualization, Validation, Writing – review & editing, Supervision. XW: Investigation, Writing – original draft, Software, Visualization, Data curation, Methodology, Writing – review & editing. SY: Formal Analysis, Data curation, Software, Writing – review & editing, Resources, Investigation. WH: Methodology, Data curation, Writing – review & editing, Investigation, Formal Analysis. ZL: Writing – review & editing, Supervision, Investigation, Data curation, Conceptualization.
Funding
The author(s) declare that financial support was received for the research and/or publication of this article. This work was supported by the Sichuan Provincial Department of Science and Technology Research Foundation of China (No. 2020YFS0494) and the Sichuan Medical Association Research Foundation of China (No. 2019TG05).
Acknowledgments
We extend our sincere gratitude to all participants for their valuable contributions to the data collection process of this study. Our appreciation also goes to the entire team of staff, including physicians, medical assistants, nurses, laboratory technicians, and logistics personnel, for their unwavering dedication and hard work throughout the project. Furthermore, we would like to acknowledge all funding bodies for their financial support of this research, as well as every co-author for their time and efforts invested in developing this manuscript.
Conflict of interest
The authors declare that the research was conducted in the absence of any commercial or financial relationships that could be construed as a potential conflict of interest.
Generative AI statement
The author(s) declare that no Generative AI was used in the creation of this manuscript.
Any alternative text (alt text) provided alongside figures in this article has been generated by Frontiers with the support of artificial intelligence and reasonable efforts have been made to ensure accuracy, including review by the authors wherever possible. If you identify any issues, please contact us.
Publisher’s note
All claims expressed in this article are solely those of the authors and do not necessarily represent those of their affiliated organizations, or those of the publisher, the editors and the reviewers. Any product that may be evaluated in this article, or claim that may be made by its manufacturer, is not guaranteed or endorsed by the publisher.
Abbreviations
95% CI, 95% confidence intervals; ADV, Adenovirus; ALRTIs, acute lower respiratory tract infections; ARTIs, acute respiratory tract infections; AURTIs, acute upper respiratory tract infections; CRDs, chronic respiratory diseases; Flu A, Influenza A virus; Flu B, Influenza B virus; mNGS, metagenomic next-generation sequencing; MP, Mycoplasma pneumoniae; NAATs, nucleic acid amplification tests; NRDs, non-respiratory diseases; OR, odds ratios; PCR, polymerase chain reaction; RV, Rhinovirus; RTIs, respiratory tract infections; RSV, respiratory syncytial virus; SARS-CoV-2, severe acute respiratory syndrome coronavirus type 2; SOP, standard operating procedures; SRLT, self-requested laboratory testing.
References
Azizian, R., Mamishi, S., Jafari, E., Mohammadi, M. R., Heidari Tajabadi, F., and Pourakbari, B. (2025). From conventional detection to point-of-care tests (POCT) method for pediatric respiratory infections diagnosis: A systematic review. Arch. Iran Med. 28, 112–123. doi: 10.34172/aim.33505
Chen, Z., Tsui, J. L., Gutierrez, B., Busch Moreno, S., du Plessis, L., Deng, X., et al. (2024). COVID-19 pandemic interventions reshaped the global dispersal of seasonal influenza viruses. Science. 386, eadq3003. doi: 10.1126/science.adq3003
Cilloniz, C., Luna, C. M., Hurtado, J. C., Marcos, M.Á., and Torres, A. (2022). Respiratory viruses: their importance and lessons learned from COVID-19. Eur. Respir. Rev. 31, 220051. doi: 10.1183/16000617.0051-2022
Clark, T. W., Lindsley, K., Wigmosta, T. B., Bhagat, A., Hemmert, R. B., Uyei, J., et al. (2023). Rapid multiplex PCR for respiratory viruses reduces time to result and improves clinical care: Results of a systematic review and meta-analysis. J. Infect. 86, 462–475. doi: 10.1016/j.jinf.2023.03.005
Clementi, N., Ghosh, S., De Santis, M., Castelli, M., Criscuolo, E., Zanoni, I., et al. (2021). Viral respiratory pathogens and lung injury. Clin. Microbiol. Rev. 34, e00103–e00120. doi: 10.1128/CMR.00103-20
Eisen, A. K. A., Gularte, J. S., Demoliner, M., de Abreu Goés Pereira, V. M., Heldt, F. H., Filippi, M., et al. (2021). Low circulation of Influenza A and coinfection with SARS-CoV-2 among other respiratory viruses during the COVID-19 pandemic in a region of southern Brazil. J. Med. Virol. 93, 4392–4398. doi: 10.1002/jmv.26975
GBD 2021 Lower Respiratory Infections and Antimicrobial Resistance Collaborators (2024). Global, regional, and national incidence and mortality burden of non-COVID-19 lower respiratory infections and aetiologies, 1990-2021: a systematic analysis from the Global Burden of Disease Study 2021. Lancet Infect. Dis. 24, 974–1002. doi: 10.1016/S1473-3099(24)00176-2
Georgakopoulou, V. E., Lempesis, I. G., Tarantinos, K., Sklapani, P., Trakas, N., and Spandidos, D. A. (2024). Atypical pneumonia (Review). Exp. Ther. Med. 28, 424. doi: 10.3892/etm.2024.12713
He, Y., He, X., He, N., Wang, P., Gao, Y., Sheng, J., et al. (2025). Epidemiological trends and pathogen analysis of pediatric acute respiratory infections in Hanzhong Hospital, China: insights from 2023 to 2024. Front. Public Health 13. doi: 10.3389/fpubh.2025.1557076
Hong, R., Lin, S., Zhang, S., Yi, Y., Li, L., Yang, H., et al. (2024). Pathogen spectrum and microbiome in lower respiratory tract of patients with different pulmonary diseases based on metagenomic next-generation sequencing. Front. Cell Infect. Microbiol. 14. doi: 10.3389/fcimb.2024.1320831
Jiang, Z., Li, S., Zhu, C., Zhou, R., and Leung, P. H. M. (2021). Mycoplasma pneumoniae infections: pathogenesis and vaccine development. Pathogens. 10, 119. doi: 10.3390/pathogens10020119
Kumar, S. and Kumar, S. (2023). Mycoplasma pneumoniae: Among the smallest bacterial pathogens with great clinical significance in children. Indian J. Med. Microbiol. 46, 100480. doi: 10.1016/j.ijmmb.2023.100480
Lai, C. C., Wang, C. Y., and Hsueh, P. R. (2020). Co-infections among patients with COVID-19: The need for combination therapy with non-anti-SARS-CoV-2 agents? J. Microbiol. Immunol. Infect. 53, 505–512. doi: 10.1016/j.jmii.2020.05.013
Li, X., Sun, R., Pan, J., Shi, Z., An, Z., Dai, C., et al. (2024). Rapid and on-site wireless immunoassay of respiratory virus aerosols via hydrogel-modulated resonators. Nat. Commun. 15, 4035. doi: 10.1038/s41467-024-48294-1
Li, Y., Wang, X., Blau, D. M., Caballero, M. T., Feikin, D. R., Gill, C. J., et al. (2022). Global, regional, and national disease burden estimates of acute lower respiratory infections due to respiratory syncytial virus in children younger than 5 years in 2019: a systematic analysis. Lancet. 399, 2047–2064. doi: 10.1016/S0140-6736(22)00478-0
Li, S., Xue, Z., Feng, Y., Zhou, X., Qi, Y., Feng, N., et al. (2024). Epidemiological characteristics of eleven common respiratory viral infections in children. BMC Pediatr. 24, 827. doi: 10.1186/s12887-024-05300-1
Lin, C. Y., Hwang, D., Chiu, N. C., Weng, L. C., Liu, H. F., Mu, J. J., et al. (2020). Increased detection of viruses in children with respiratory tract infection using PCR. Int. J. Environ. Res. Public Health 17, 564. doi: 10.3390/ijerph17020564
Liu, X., Li, M., Yang, T., He, R., Guo, X., and Chen, M. (2023). Viral and atypical pathogen’s epidemiology of a large cohort of patients with acute respiratory tract infections in shaanxi province, northwest China. Int. J. Gen. Med. 16, 1671–1679. doi: 10.2147/IJGM.S400118
Loconsole, D., De Robertis, A. L., Sallustio, A., Centrone, F., Morcavallo, C., Campanella, S., et al. (2021). Update on the epidemiology of macrolide-resistant mycoplasma pneumoniae in europe: A systematic review. Infect. Dis. Rep. 13, 811–820. doi: 10.3390/idr13030073
Lowe, M. C. (2022). Childhood respiratory conditions: lower respiratory tract infection. FP Essent. 513, 20–24.
Lowen, A. C., Mubareka, S., Steel, J., and Palese, P. (2007). Influenza virus transmission is dependent on relative humidity and temperature. PloS Pathog. 3, 1470–1476. doi: 10.1371/journal.ppat.0030151
Lv, G., Shi, L., Liu, Y., Sun, X., and Mu, K. (2024). Epidemiological characteristics of common respiratory pathogens in children. Sci. Rep. 14, 16299. doi: 10.1038/s41598-024-65006-3
Ma, H., Hou, J., Wang, J., Yuan, Z., and Man, S. (2025). Analysis of common respiratory pathogens and epidemiological trends during peak influenza seasons in Tengzhou. BMC Infect. Dis. 25, 845. doi: 10.1186/s12879-025-11146-4
Mifsud, E. J., Kuba, M., and Barr, I. G. (2021). Innate immune responses to influenza virus infections in the upper respiratory tract. Viruses. 13, 2090. doi: 10.3390/v13102090
Miyashita, N. (2022). Atypical pneumonia: Pathophysiology, diagnosis, and treatment. Respir. Investig. 60, 56–67. doi: 10.1016/j.resinv.2021.09.009
Moriyama, M., Hugentobler, W. J., and Iwasaki, A. (2020). Seasonality of respiratory viral infections. Annu. Rev. Virol. 7, 83–101. doi: 10.1146/annurev-virology-012420-022445
Murphy, C., Mak, L., Cheng, S. M. S., Liu, G. Y. Z., Chun, A. M. C., Leung, K. K. Y., et al. (2024). Diagnostic performance of multiplex lateral flow tests in ambulatory patients with acute respiratory illness. Diagn. Microbiol. Infect. Dis. 110, 116421. doi: 10.1016/j.diagmicrobio.2024.116421
Nair, H., Brooks, W. A., Katz, M., Roca, A., Berkley, J. A., Madhi, S. A., et al. (2011). Global burden of respiratory infections due to seasonal influenza in young children: a systematic review and meta-analysis. Lancet. 378, 1917–1930. doi: 10.1016/S0140-6736(11)61051-9
Nduaguba, S. O., Tran, P. T., Choi, Y., and Winterstein, A. G. (2023). Respiratory syncytial virus reinfections among infants and young children in the United States, 2011-2019. PloS One 18, e0281555. doi: 10.1371/journal.pone.0281555
Neumann, G. and Kawaoka, Y. (2022). Seasonality of influenza and other respiratory viruses. EMBO Mol. Med. 14, e15352. doi: 10.15252/emmm.202115352
Niederman, M. S. and Torres, A. (2022). Respiratory infections. Eur. Respir. Rev. 31, 220150. doi: 10.1183/16000617.0150-2022
Peer, V., Mandelboim, M., Jurkowicz, M., and Green, M. S. (2025). Sex differences in acute respiratory tract infections-multi-year analysis based on data from a large tertiary care medical center in Israel. Front. Public Health 13. doi: 10.3389/fpubh.2025.1502036
Perez, A., Lively, J. Y., Curns, A., Weinberg, G. A., Halasa, N. B., Staat, M. A., et al. (2022). Respiratory virus surveillance among children with acute respiratory illnesses - new vaccine surveillance network, United States, 2016-2021. MMWR Morb Mortal Wkly Rep. 71, 1253–1259. doi: 10.15585/mmwr.mm7140a1
Pratt, M. T. G., Abdalla, T., Richmond, P. C., Moore, H. C., Snelling, T. L., Blyth, C. C., et al. (2022). Prevalence of respiratory viruses in community-acquired pneumonia in children: a systematic review and meta-analysis. Lancet Child Adolesc. Health 6, 555–570. doi: 10.1016/S2352-4642(22)00092-X
Sadeh Tehrani, R., Mohammadjafari, H., Alizadeh, S., Naseroleslami, M., and Karbalaie Niya, M. H. (2024). The prevalence of 17 common respiratory viruses in patients with respiratory illness but negative for COVID-19: A cross-sectional study. Health Sci. Rep. 7, e1986. doi: 10.1002/hsr2.1986
Shaman, J. and Kohn, M. (2009). Absolute humidity modulates influenza survival, transmission, and seasonality. Proc. Natl. Acad. Sci. U.S.A. 106, 3243–3248. doi: 10.1073/pnas.0806852106
Shieh, W. J. (2022). Human adenovirus infections in pediatric population - An update on clinico-pathologic correlation. BioMed. J. 45, 38–49. doi: 10.1016/j.bj.2021.08.009
Tabibzadeh, A., Zamani, F., Laali, A., Esghaei, M., Safarnezhad Tameshkel, F., Keyvani, H, et al. (2020). SARS-CoV-2 Molecular and Phylogenetic analysis in COVID-19 patients: A preliminary report from Iran. Infect. Genet. Evol. 84, 104387. doi: 10.1016/j.meegid.2020.104387
Tang, Z., Fan, H., Tian, Y., and Lv, Q. (2025). Epidemiological characteristics of six common respiratory pathogen infections in children. Microbiol. Spectr 13, e0007925. doi: 10.1128/spectrum.00079-25
Thongpan, I., Vongpunsawad, S., and Poovorawan, Y. (2020). Respiratory syncytial virus infection trend is associated with meteorological factors. Sci. Rep. 10, 10931. doi: 10.1038/s41598-020-67969-5
Tian, J., Liu, C., Wang, X., Zhang, L., Zhong, G., Huang, G., et al. (2023). Comparative analysis of clinical features of lower respiratory tract infection with respiratory syncytial virus and influenza virus in adults: a retrospective study. BMC Pulm Med. 23, 350. doi: 10.1186/s12890-023-02648-5
Toczek-Kubicka, K., Szenborn, F., Kuchar, E. P., and Szenborn, L. (2022). Upper respiratory tract infections and influenza-like illnesses among healthcare workers: are serological tests useful in monitoring influenza and influenza-like illness? Med. Pr 73, 441–447. doi: 10.13075/mp.5893.01296
Ursin, R. L. and Klein, S. L. (2021). Sex differences in respiratory viral pathogenesis and treatments. Annu. Rev. Virol. 8, 393–414. doi: 10.1146/annurev-virology-091919-092720
Wahab, S., Ahmad, I., Irfan, S., Siddiqua, A., Usmani, S., and Ahmad, M. P. (2022). Pharmacological efficacy and safety of glycyrrhiza glabra in the treatment of respiratory tract infections. Mini Rev. Med. Chem. 22, 1476–1494. doi: 10.2174/1389557521666210927153001
Wang, P., Zhang, Z., Fang, K., Yao, J., Huang, X., and Lu, S. (2024). Analysis of the epidemic characteristics of common respiratory pathogens infection in children in a 3A special hospital. BMC Infect. Dis. 24, 879. doi: 10.1186/s12879-024-09784-1
Wu, Y., Zhou, J., Shu, T., Li, W., Shang, S., and Du, L. (2024). Epidemiological study of post-pandemic pediatric common respiratory pathogens using multiplex detection. Virol. J. 21, 168. doi: 10.1186/s12985-024-02441-8
Xu, M., He, W., Xie, S., Ren, Z., Chen, J., and Nuerbolati, B. (2025). Epidemiological and pathological characterization of acute respiratory infections. APMIS. 133, e13484. doi: 10.1111/apm.13484
Yang, F. F., Yu, S. J., Du, W. N., Wang, H. M., Yao, X. X., Xue, D. D., et al. (2022). Global morbidity and mortality of lower respiratory infections: A population -based study. Respir. Med. 205, 107042. doi: 10.1016/j.rmed.2022.107042
Yin, Y., Zhu, P., Guo, Y., Li, Y., Chen, H., Liu, J., et al. (2024). Enhancing lower respiratory tract infection diagnosis: implementation and clinical assessment of multiplex PCR-based and hybrid capture-based targeted next-generation sequencing. EBioMedicine. 107, 105307. doi: 10.1016/j.ebiom.2024.105307
Yu, J., Xie, Z., Zhang, T., Lu, Y., Fan, H., Yang, D., et al. (2018). Comparison of the prevalence of respiratory viruses in patients with acute respiratory infections at different hospital settings in North China, 2012-2015. BMC Infect. Dis. 18, 72. doi: 10.1186/s12879-018-2982-3
Zhao, C., Zhang, T., Guo, L., Sun, S., Miao, Y., Yung, C. F., et al. (2025). Characterising the asynchronous resurgence of common respiratory viruses following the COVID-19 pandemic. Nat. Commun. 16, 1610. doi: 10.1038/s41467-025-56776-z
Zhao, X., Zhu, X., Wang, J., Ye, C., and Zhao, S. (2025). The epidemiological analysis of respiratory virus infections in Children in Hangzhou from 2019 to 2023. Virus Res. 355, 199558. doi: 10.1016/j.virusres.2025.199558
Keywords: influenza A virus, influenza B virus, respiratory syncytial virus, adenovirus, rhinovirus, Mycoplasma pneumoniae, respiratory tract infections, children
Citation: Liu C, Li J, Deng Y, Wang Q, Wang X, Yang S, He W and Liao Z (2025) Prevalence of six respiratory pathogens among children in Chengdu, China: a multiplex PCR-based detection study. Front. Cell. Infect. Microbiol. 15:1690701. doi: 10.3389/fcimb.2025.1690701
Received: 22 August 2025; Accepted: 10 November 2025; Revised: 04 November 2025;
Published: 01 December 2025.
Edited by:
Sónia Silva, University of Minho, PortugalReviewed by:
Daniela Araújo, National Institute for Agricultural and Veterinary Research (INIAV), PortugalJinbo Liu, The Affiliated Hospital of Southwest Medical University, China
Copyright © 2025 Liu, Li, Deng, Wang, Wang, Yang, He and Liao. This is an open-access article distributed under the terms of the Creative Commons Attribution License (CC BY). The use, distribution or reproduction in other forums is permitted, provided the original author(s) and the copyright owner(s) are credited and that the original publication in this journal is cited, in accordance with accepted academic practice. No use, distribution or reproduction is permitted which does not comply with these terms.
*Correspondence: Chenggui Liu, bGFibGNnQDEyNi5jb20=
†These authors have contributed equally to this work