 Hui An
 Tongtong Yu2,3
 Yongyu Wang
 Ming Li
- 1School of Basic Medical Science, Wenzhou Medical University, Wenzhou, Zhejiang, China
- 2Department of Anesthesia and Critical Care, The Second Affiliated Hospital and Yuying Children’s Hospital of Wenzhou Medical University, Wenzhou, Zhejiang, China
- 3Key Laboratory of Pediatric Anesthesiology, Ministry of Education, Wenzhou Medical University, Wenzhou, Zhejiang, China
Background: Long COVID manifests with heterogeneous clinical outcomes, potentially linked to immune dysfunction. However, the recovery of immune-cell subsets during convalescence remains incompletely understood.
Methods: In this longitudinal cohort, 279 unvaccinated patients with confirmed SARS-CoV-2 infection (13 mild, 218 moderate, 48 severe) were enrolled. Peripheral lymphocyte subsets were analyzed by flow cytometry at admission and at 50 days post-symptom onset (DPSO 50).
Results: Total T-cell counts normalized in 90–98% of patients in the moderate and severe groups by DPSO 50. Nevertheless, a subgroup exhibited persistent B-cell lymphopenia (<90 cells/µL) in 7.3% of moderate cases (median 77.1 cells/µL, IQR 51.9–83.8) and 12.5% of seltvere cases (median 54.5 cells/µL, IQR 28.4–79.3). Patients with B-cell deficiency also showed concurrent reductions in total T cells, CD4+ T cells, and CD4+CD25+CD127low/FOXP3+ regulatory T cells (Tregs). In moderate cases, CD4+ T cell and Treg counts correlated positively (r = 0.72, p < 0.001), independent of B-cell status, whereas this relationship was absent in severe cases, indicating severity-dependent immune dysregulation.
Conclusions: Approximately 7–12% of moderate-to-severe COVID-19 survivors displayed persistent lymphopenia affecting B cells, CD4+ T cells, and Tregs at ~50 days post-symptom onset. These findings highlight distinct recovery trajectories and provide insights into Long COVID pathogenesis that may inform therapeutic strategies.
Introduction
Post-COVID-19 conditions (PCC), affecting approximately 10–30% of individuals infected with SARS-CoV-2 (Altmann et al., 2023; Rudolph et al., 2025), are proposed to arise from unresolved immune system dysfunction. While acute-phase immune perturbations—including diminished cytotoxic CD8+ T and natural killer (NK) cells alongside compensatory expansions of double-negative T cells (DN T cells) and regulatory T cells (Tregs)—are extensively documented (Chen et al., 2020; Guan et al., 2020; Huang et al., 2020; Jin S. et al., 2021; Zahran et al., 2021; An et al., 2022), their resolution during convalescence remains contentious. Disease progression further complicates this trajectory: moderate-to-severe cases may initially elevate Treg concentrations as the body attempts to suppress hyperinflammation (Alsalman et al., 2022), yet critically ill patients often exhibit Treg depletion, exacerbating immune hyperactivation, inflammation, and clinical deterioration (Votto et al., 2023).
Immune abnormalities persist beyond acute illness: SARS-CoV-2-specific memory B and T cell responses remain detectable for up to 8 months post-infection (Sherina et al., 2021), though B-cell counts show conflicting trends—either increasing or decreasing at 2–8 months post-infection (Orologas-Stavrou et al., 2020; Kostopoulos et al., 2021; Ryan et al., 2022) —likely due to population heterogeneity (e.g., vaccination status) and variable follow-up intervals (Shuwa et al., 2021; Yang et al., 2021; Kudryavtsev et al., 2022).
To isolate SARS-CoV-2 intrinsic immunopathological effects, our study examines unvaccinated patients, excluding confounding vaccine-induced immune modulation. This cohort enables analysis of the virus impact on B/T cell dynamics, aiming to establish baseline recovery patterns critical for distinguishing virus-driven mechanisms from vaccine-modulated responses in future PCC research. Here, we provide a combined longitudinal analysis of B cells, CD4+ T cells, and Tregs up to 50 days post-symptom onset, a timepoint less commonly covered in existing literature. Many prior studies have focused on shorter follow-up periods or vaccinated cohorts, which may mask true virus-induced immune dysregulation. Our findings reveal a severity-dependent disruption in Treg coordination, which has not been extensively reported and may underlie heterogeneous Long COVID outcomes. Such insights are foundational for developing targeted therapeutic strategies to address persistent immune dysregulation in post-acute sequelae.
Methods
Ethics approval and consent to participate
This study was ethically approved by the Institutional Review Board (IRB) of Wenzhou Medical University (Approval Number: 2020002), and all research activities strictly complied with the ethical guidelines established in the 1975 Declaration of Helsinki. Prior to participation, written informed consent was obtained from all study subjects, ensuring transparency regarding sample collection procedures and data usage. The protocol adhered to international standards for human subject research, with ethical oversight maintained throughout the study duration.
Study design
This longitudinal cohort study enrolled 279 unvaccinated individuals who had recovered from SARS-CoV-2 infection, drawn from a larger cohort of 685 confirmed COVID-19 patients admitted to 12 hospitals across Wenzhou City, Zhejiang Province, China between January 17 and March 20, 2020. Upon admission, patients were initially categorized into four clinical severity groups based on symptomatology and imaging criteria: (1) mild cases (symptomatic but no chest CT abnormalities), (2) moderate cases (fever, respiratory symptoms, and CT-confirmed pneumonia), (3) severe cases (respiratory distress with SpO2 ≤93% at rest, respiratory rate ≥30/min, or PaO2/FiO2 ≤300 mmHg), and (4) critical cases (mechanical ventilation, shock, multi-organ failure, or ICU admission). Discharge criteria required resolution of fever and respiratory symptoms for ≥3 days, radiological improvement on CT scans, and two consecutive negative RT-qPCR assays for SARS-CoV-2 RNA.
For this follow-up analysis, participants were stratified into three severity-based groups at enrollment: mild (n=13), moderate (n=218), and severe (n=48) (Figure 1A). During convalescence, a subset of patients exhibited persistent B-cell lymphopenia (B-cell count <90 cells/µL), a threshold aligned with established immunological benchmarks (Kam et al., 1996; Apoil et al., 2017; Jin XH. et al., 2021). To further investigate this phenomenon, participants were subsequently divided into four combined severity-B-cell status cohorts: 1) moderate cases with normal B-cell counts (NMo), 2) moderate cases with B-cell lymphopenia (LMo, <90 cells/µl) (Kam et al., 1996; Apoil et al., 2017; Jin XH. et al., 2021), 3) severe cases with normal B-cell counts (NS), and 4) severe cases with B-cell lymphopenia (LS) (Figure 1B). This dual-stratification enabled evaluation of disease severity and immune recovery heterogeneity in post-acute SARS-CoV-2 infection.
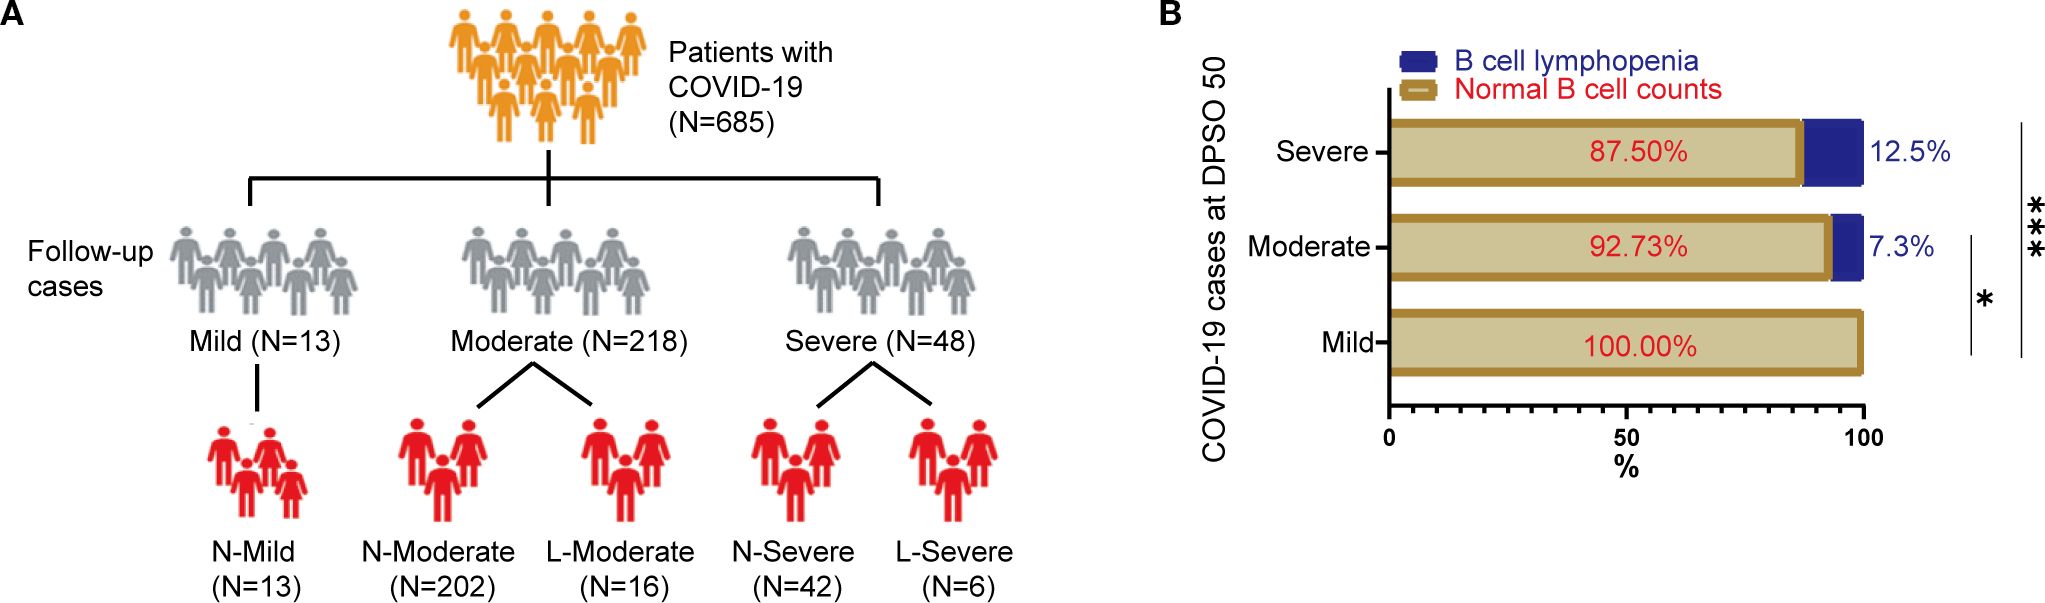
Figure 1. Study enrollment flowchart and immunophenotypic profiling of B-cell depletion in COVID-19 cohort. (A) Patient Enrollment and Stratification Process: This flowchart outlines the sequential inclusion of participants, highlighting eligibility criteria and allocation into severity-based subgroups (mild, moderate, severe) according to clinical manifestations and laboratory parameters. (B) B-Cell Lymphopenia Distribution by Disease Severity: This panel compares the prevalence of B-cell lymphopenia (<90 cells/μL) across disease severity subgroups. Patients were stratified as follows: N-Mild: Mild cases with normal B-cell counts (≥90 cells/μL). N-Moderate: Moderate cases with preserved B-cell levels. L-Moderate: Moderate cases exhibiting B-cell lymphopenia. N-Severe: Severe cases with normal B-cell counts. L-Severe: Severe cases with B-cell lymphopenia. Statistical analysis was performed using Chi-square test. Statistical significance is denoted by *p<0.05, ***p<0.001.
Data collection and laboratory procedures
Comprehensive clinical and demographic data were systematically gathered using a standardized form adapted from the WHO/International Severe Acute Respiratory and Emerging Infection Consortium (ISARIC) protocol for severe respiratory infections. This dataset included electronic medical records, epidemiological histories, demographic profiles, clinical symptoms, laboratory test results, treatment protocols, and patient outcomes. Peripheral blood samples collected in ethylenediaminetetraacetic acid (EDTA)-anticoagulant tubes were obtained from participants at two critical timepoints: (1) during hospitalization for acute SARS-CoV-2 infection and (2) at 30-day post-discharge follow-up. Routine hematological assessments were performed to evaluate complete blood counts (CBC), including detailed quantification of white blood cells (WBC), neutrophils, lymphocytes, T cells, B cells, and natural killer (NK) cells. These analyses provided critical immunophenotypic and inflammatory biomarker data for longitudinal immune trajectory evaluation.
Exclusion criteria were rigorously applied to ensure data integrity, as outlined in Figure 1A. Patients diagnosed with confirmed COVID-19 were excluded from the study cohort if written informed consent was not obtained, thereby maintaining adherence to ethical and methodological standards. This dual-phase sampling strategy enabled characterization of both acute-phase immune dysregulation and post-acute immune recovery patterns, with laboratory protocols standardized across all participating institutions to minimize inter-hospital variability.
Flow cytometric analysis
Peripheral blood samples (2 mL) were collected via venipuncture into ethylenediaminetetraacetic acid (EDTA)-anticoagulant tubes from confirmed SARS-CoV-2 patients at two timepoints: 1) during initial hospitalization prior to any therapeutic intervention, and 2) at the 30-day follow-up after hospital discharge. All samples were processed within 24 hours of collection. These samples were used to characterize lymphocyte phenotypes, including CD4+ T cells, CD8+ T cells, CD19+ B cells, natural killer (NK) cells, DN T cells (CD3+CD4−CD8−), and regulatory T cells (Tregs; CD4+CD25+CD127low/FOXP3+), following established protocols (Jiang et al., 2020). Phenotypic analysis was performed using a panel of fluorophore-conjugated monoclonal antibodies targeting key surface markers and intracellular transcription factors. Antibodies were sourced from BD Biosciences (San Jose, CA, USA) and BioLegend (San Diego, CA, USA), including: CD3+ T cell gating: PerCP-conjugated anti-CD3 (BD); CD4+ T cells: APC-conjugated anti-CD4 (BD); CD8+ T cells: APC/Cy7-conjugated anti-CD8 (BioLegend); Tregs: PE-Cy7 anti-CD25, FITC anti-CD127, and PE anti-FOXP3 (BD); B cells: APC-conjugated anti-CD19 (BD); and NK cells: APC anti-CD16 and BV510-conjugated anti-CD56 (BioLegend). The BD FACS Canto II flow cytometer (BD Biosciences) was employed for multicolor fluorescence detection. Lymphocyte subsets were identified using standardized gating strategies: CD4+ T cells: CD3+CD4+ population; CD8+ T cells: CD3+CD8+ population; DN T cells: CD3+CD4−CD8− subset; Tregs: CD4+CD25+CD127low/FOXP3+ cells; B cells: CD3−CD19+ population; and NK cells: CD3−CD16+/CD56+ cells. This dual-timepoint approach enabled longitudinal assessment of immune reconstitution dynamics, with rigorous standardization across all experimental procedures to ensure reproducibility.
Statistical analysis
Data are presented as medians with interquartile ranges (IQR) or frequencies with percentages, depending on variable distribution. The D’Agostino-Pearson omnibus normality test was applied to assess distribution normality. For parameters without available normal control data, reference ranges were derived from age- and sex-matched healthy individuals from our hospital’s clinical databases, and patient values were categorized as normal or abnormal relative to these thresholds.
Quantitative variables exhibiting non-normal distributions (e.g., lymphocyte counts, B cells, NK cells, CD4+/CD8+ T cells) were analyzed using non-parametric methods. A two-way non-parametric ANOVA (Scheirer-Ray-Hare test) was first applied to evaluate main effects and interactions, followed by post-hoc Kruskal-Wallis multiple comparisons with Dunn’s correction for pairwise contrasts. Categorical variables (e.g., sex, age group) were compared using Chi-square tests or Fisher’s exact test (when cell counts <5). Spearman’s rank correlation coefficients were calculated to assess associations between regulatory T cell (Treg) counts and B cell (CD19+) populations. Statistical significance was defined as p < 0.05, with all analyses performed using SPSS version 25.0 (IBM SPSS Statistics, Chicago, IL, USA).
Results
Clinical evaluation of patients
The study cohort comprised 279 patients (149 males, 130 females) with a median age of 48 years (interquartile range [IQR] 39–56). Age exhibited a significant association with disease severity (p<0.0001), with severe illness primarily observed in older adults (median age: 55 years). Comorbidity prevalence was notable in 41.2% of participants (n=115), dominated by hypertension (22.2%), followed by diabetes (7.5%) and chronic liver disease (5.4%). Of note, comorbidity profiles and treatment regimens were balanced across severity groups and did not differ significantly between patients with and without lymphopenia. Patients were stratified into mild, moderate, and severe severity groups and followed for a median of 50 days post-symptom onset (IQR 48 days; range 42–53 days). Full demographic and clinical details are summarized in Table 1.
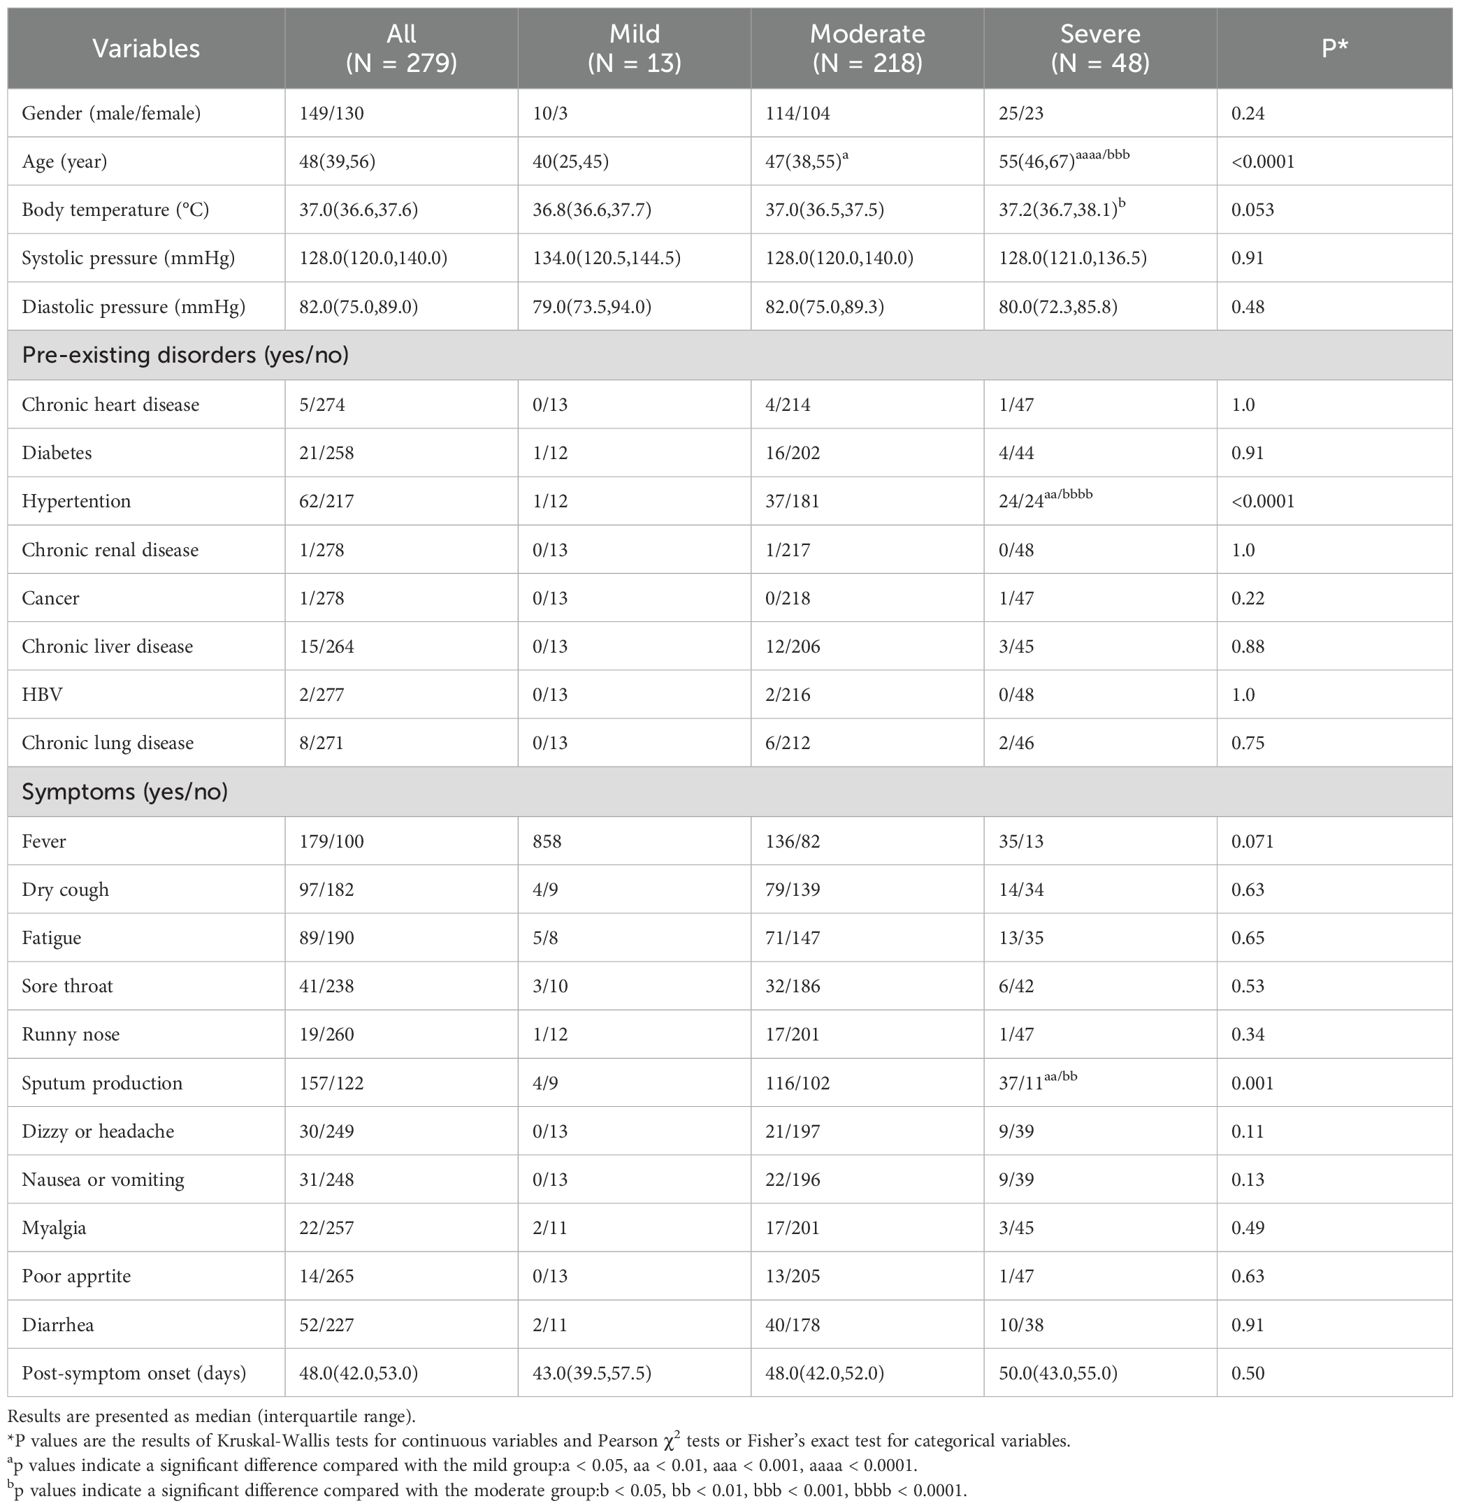
Table 1. Characteristics of enrolled patients at admission.
Restoration of inflammatory and immune parameters during SARS-CoV-2 convalescence
In mild cases, C-reactive protein (CRP) levels remained low throughout both the acute and convalescent phases (Figure 2A). However, moderate-to-severe cases exhibited elevated CRP concentrations during acute infection, which subsequently normalized during recovery. White blood cell (WBC) dynamics, composed of neutrophils and lymphocytes, revealed distinct recovery trajectories: while acute-phase inflammation suppressed total WBC and immune cell counts, these parameters recovered sufficiently by convalescence. Consequently, no statistically significant differences in WBC or neutrophil counts were observed across disease severity groups (mild, moderate, severe) in either acute or convalescent stages (Figures 2B, C).
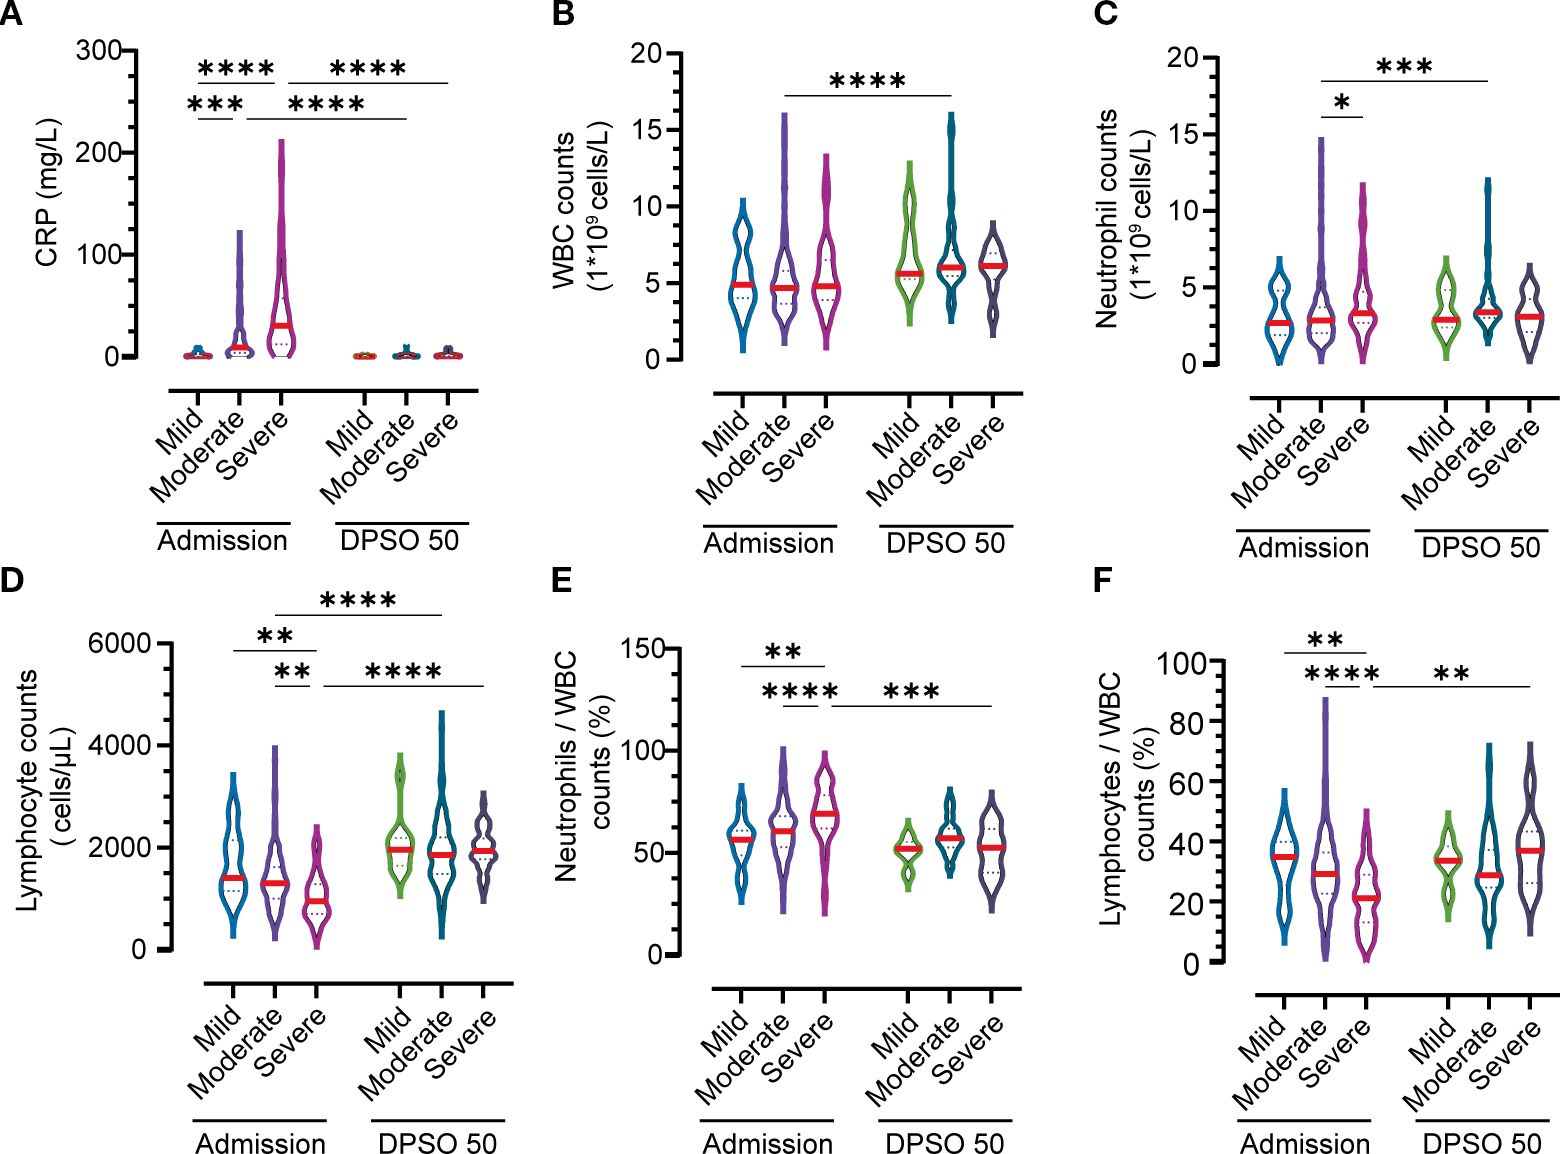
Figure 2. Temporal Immuno-inflammatory Dynamics Across Disease Severity Groups at Admission and 50 Days Post-Symptom Onset (DPSO50). (A) C-Reactive Protein (CRP) Kinetics. (B) White Blood Cell (WBC) Trajectories. (C) Neutrophil Dynamics. (D) Lymphocyte Recovery. (E, F) Neutrophil and lymphocyte subpopulation shifts in peripheral WBC composition. Comparisons employed two-way nonparametric ANOVA followed by Kruskal-Wallis post-hoc testing. Significant differences are indicated by *p<0.05, **p<0.01, ***p<0.001, and ****p<0.0001.
Lymphocytopenia, defined by reduced lymphocyte counts during acute illness, fully resolved in moderate and severe cases by convalescence (Figure 2D). Notably, severe cases displayed heightened neutrophil frequencies compared to both convalescent patients at 50 days post-symptom onset (DPSO 50) and mild cases during the acute phase (Figure 2E). Conversely, lymphocyte depletion was most pronounced in severe acute cases but gradually rebounded to supranormal levels during recovery, surpassing baseline ranges (Figure 2F). These findings underscore the dynamic immune reconstitution process, with severe cases exhibiting prolonged neutrophilic inflammation and delayed lymphoid recovery despite overall parameter normalization.
Recovery of lymphocyte subtypes during convalescence in moderate and severe cases
Table 2 highlights incomplete immunophenotypic recovery of lymphocyte subsets in moderate and severe COVID-19 patients during convalescence. While total lymphocyte counts returned to normal ranges during the recovery phase, significant heterogeneity was observed in the restoration of specific lymphocyte subpopulations. Persistent immunophenotypic deficits were identified in critical immune cell subsets of moderate and severe cases, with notable disparities across disease severity categories.
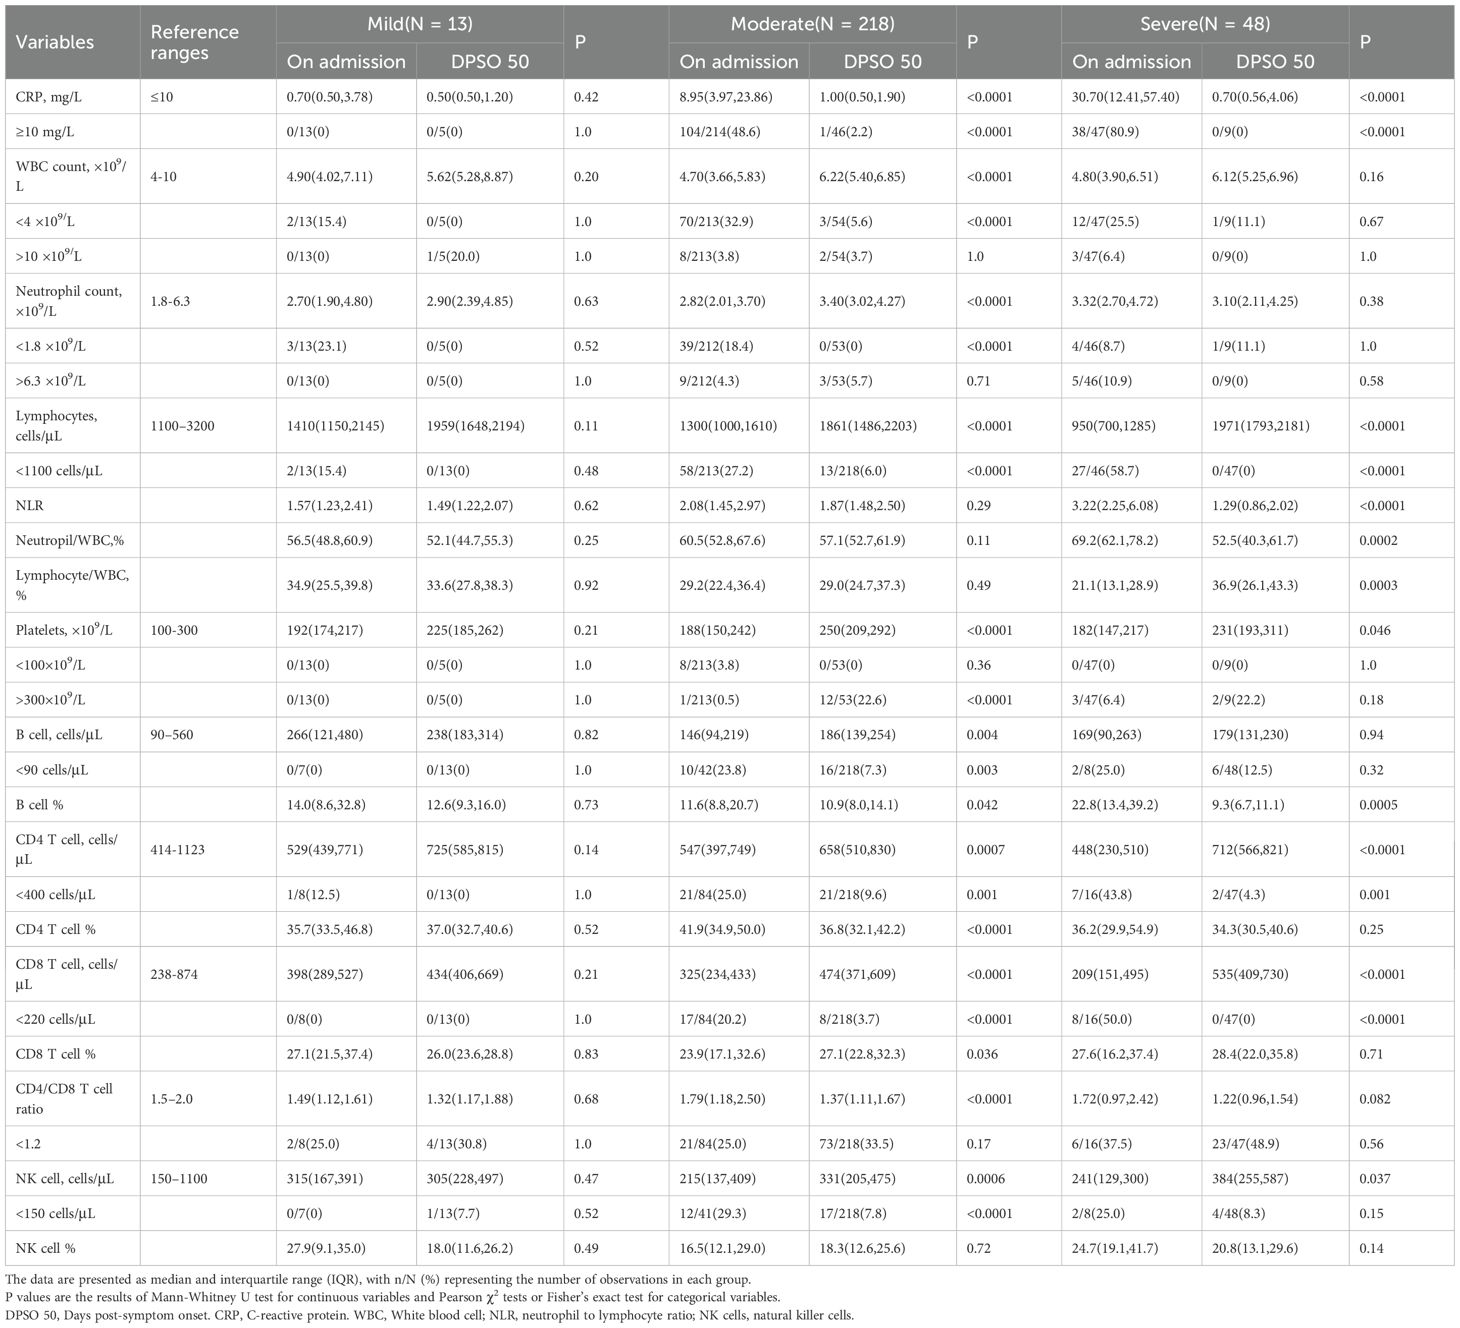
Table 2. Dynamic profiles of inflammatory, immune, and cellular indicators among different groups at admission and DPSO50.
First, B cells showed incomplete recovery in 7.3% of moderate cases and 12.5% of severe cases, remaining below the baseline threshold level (BTL; defined as ≥1.0×10⁹/L). CD4+ T cells exhibited deficits in 9.6% of moderate cases, yet only 4.3% of severe cases fell below BTL—a finding suggesting severity-dependent resilience in this subset. In contrast, CD8+ T cells demonstrated full recovery in severe cases, whereas moderate cases retained subthreshold levels in 3.7% of patients. NK cells, however, remained impaired in both groups, with 7.8% (moderate) and 8.3% (severe) of patients below BTL.
Notably, mild cases demonstrated full restoration of all lymphocyte subsets, exceeding BTL thresholds across all measured subtypes. These findings underscore severity-dependent immune reconstitution failure, particularly in B and NK cell recovery. This partial restoration may perpetuate prolonged immunocompromise in severe infections, increasing susceptibility to secondary infections or impaired long-term immune memory.
Total T lymphocyte and subpopulation dynamics in persistent B-cell lymphopenia during SARS-CoV-2 convalescence
During convalescence, around 90.4-97.9% of COVID-19 patients in moderate and severe cases respectively had their total T lymphocyte counts return to the normal range (Table 3). Moderate (LMo) and severe (LS) cases with BTL exhibited significantly reduced total T cell, CD4 T cell, and regulatory T cell (Treg) counts compared to non-BTL counterparts (NMo and NS groups at DPSO 50) (Figures 3B-D). Table 3 illustrates that the rates of lymphocyte subtype cell counts in cases with BTL were 50.0% and 16.7% for T-cell counts, 43.8% and 20.0% for CD4 T cell counts, 18.8% and 0% for CD8 T cell counts, and 18.8% and 16.7% for NK cells in the LMo and LS groups, respectively. There were no differences in CD8 T cell, NK cell, and DN T cell counts among the groups during convalescence (Figures 3E-G). The LMo group exhibited a lower CD4/CD8 T cell ratio compared to the NMo group, as shown in Figure 3H.
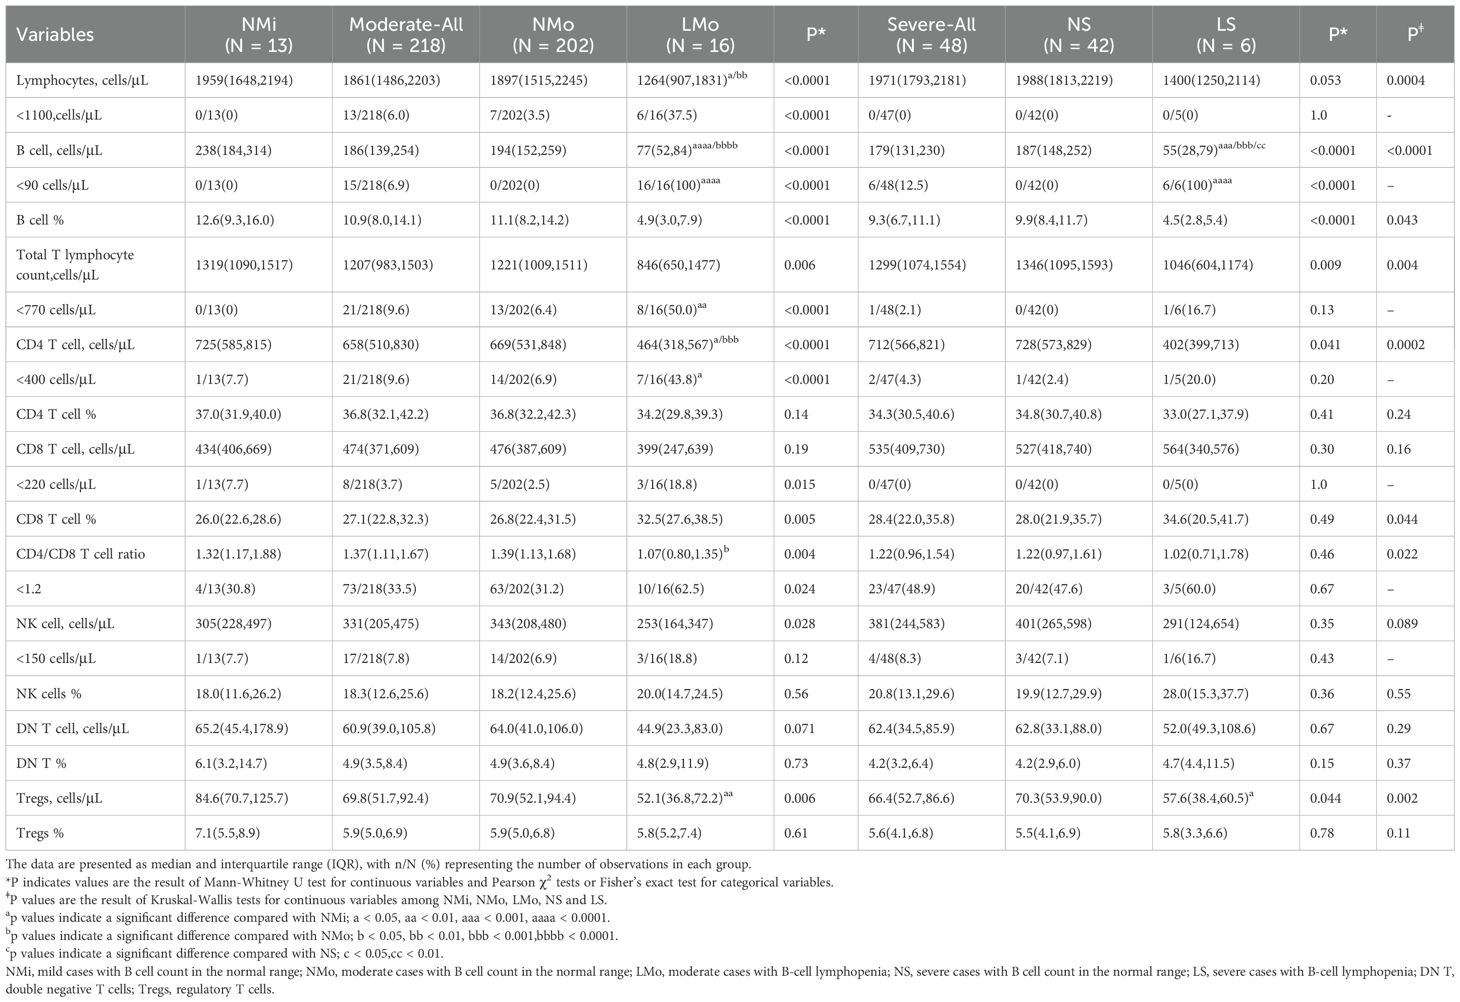
Table 3. Lymphocyte and its subtype cell profiles in convalescent patients with or without B cell lymphocytopenia in mild, moderate, and severe COVID-19.
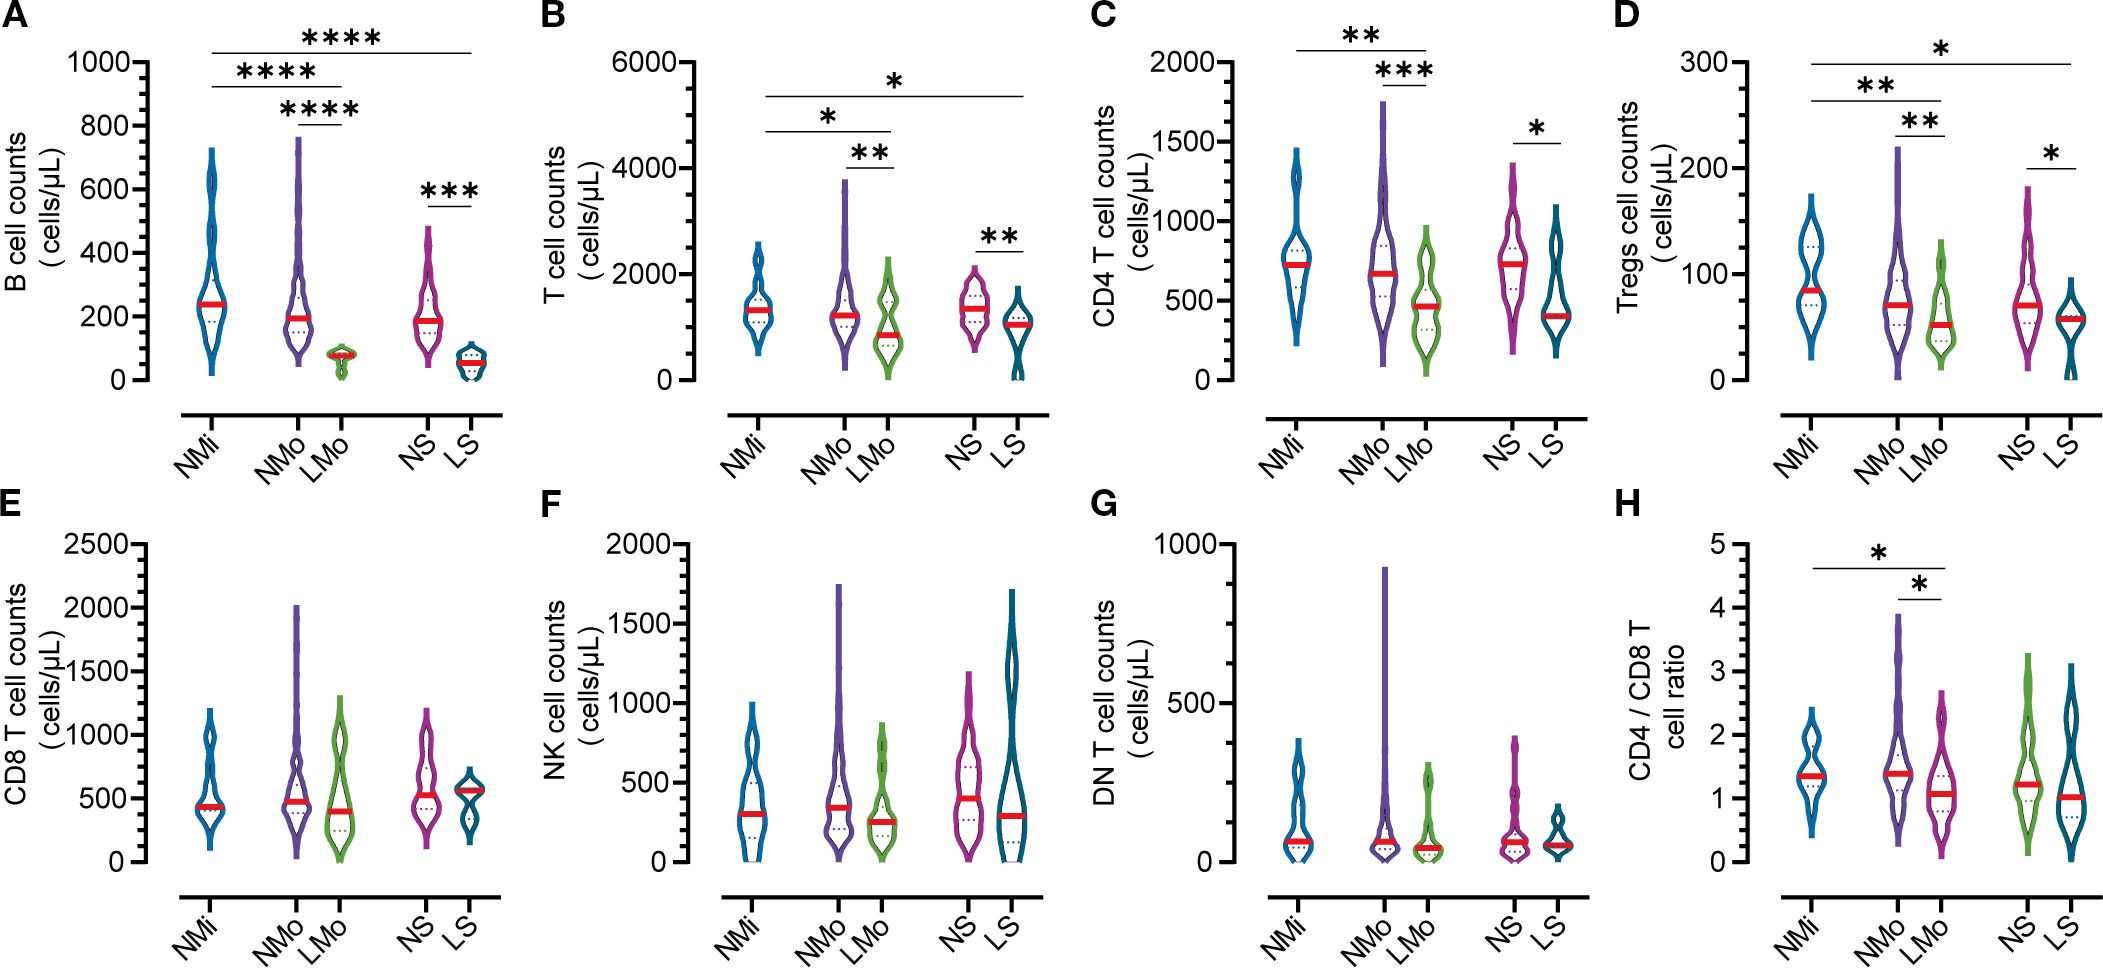
Figure 3. Counts of lymphocyte subtypes in groups with normal and low B cell counts on DPSO50. (A) B cell Lymphopenia: Moderate and severe groups exhibited B cell lymphopenia. (B) Total T Cell count. (C) CD4 T Cell count. (D) Tregs count: The counts of total T cells, CD4 T cells, and Tregs were decreased in the B cell lymphopenia group. (E) CD8 T Cell count. (F) NK cell count. (G) DN T Cell count: There were no significant differences in the counts of CD8 T cells, NK cells, and DN T cells among the five groups. (H) CD4/CD8 T Cell ratio: The CD4/CD8 T cell ratio in the low B cell count group (LMo) was lower than that in the normal B cell count group (NMo). NMi: Mild cases with normal B cell counts. NMo: Moderate cases with normal B cell counts. LMo: Moderate cases with B cell lymphopenia. NS: Severe cases with normal B cell counts. LS: Severe cases with B cell lymphopenia. Statistical analysis was performed using a two-way non-parametric ANOVA, followed by a non-parametric Kruskal-Wallis multiple comparisons test. Statistical significance is denoted by *p<0.05, **p<0.01, ***p<0.001, and ****p<0.0001.
Correlation analysis of Tregs counts with B cell and CD4+ T cell counts
In the NMi group, the counts of Tregs and B cells demonstrated a positive correlation; however, the correlation was not statistically significant (r=0.478, n=13, p > 0.05, Figure 4A), likely due to the smaller sample size. Conversely, in the NMo group, a significant positive correlation was found between the counts of Tregs and B cells (r=0.312, n=204, p<0.0001, Figure 4B). However, no significant correlations were observed between Tregs counts and B cell counts in the LMo and NS groups (r=0.079, n=16 and r=0.086, n=38, respectively, both p>0.05, Figures 4C, D).
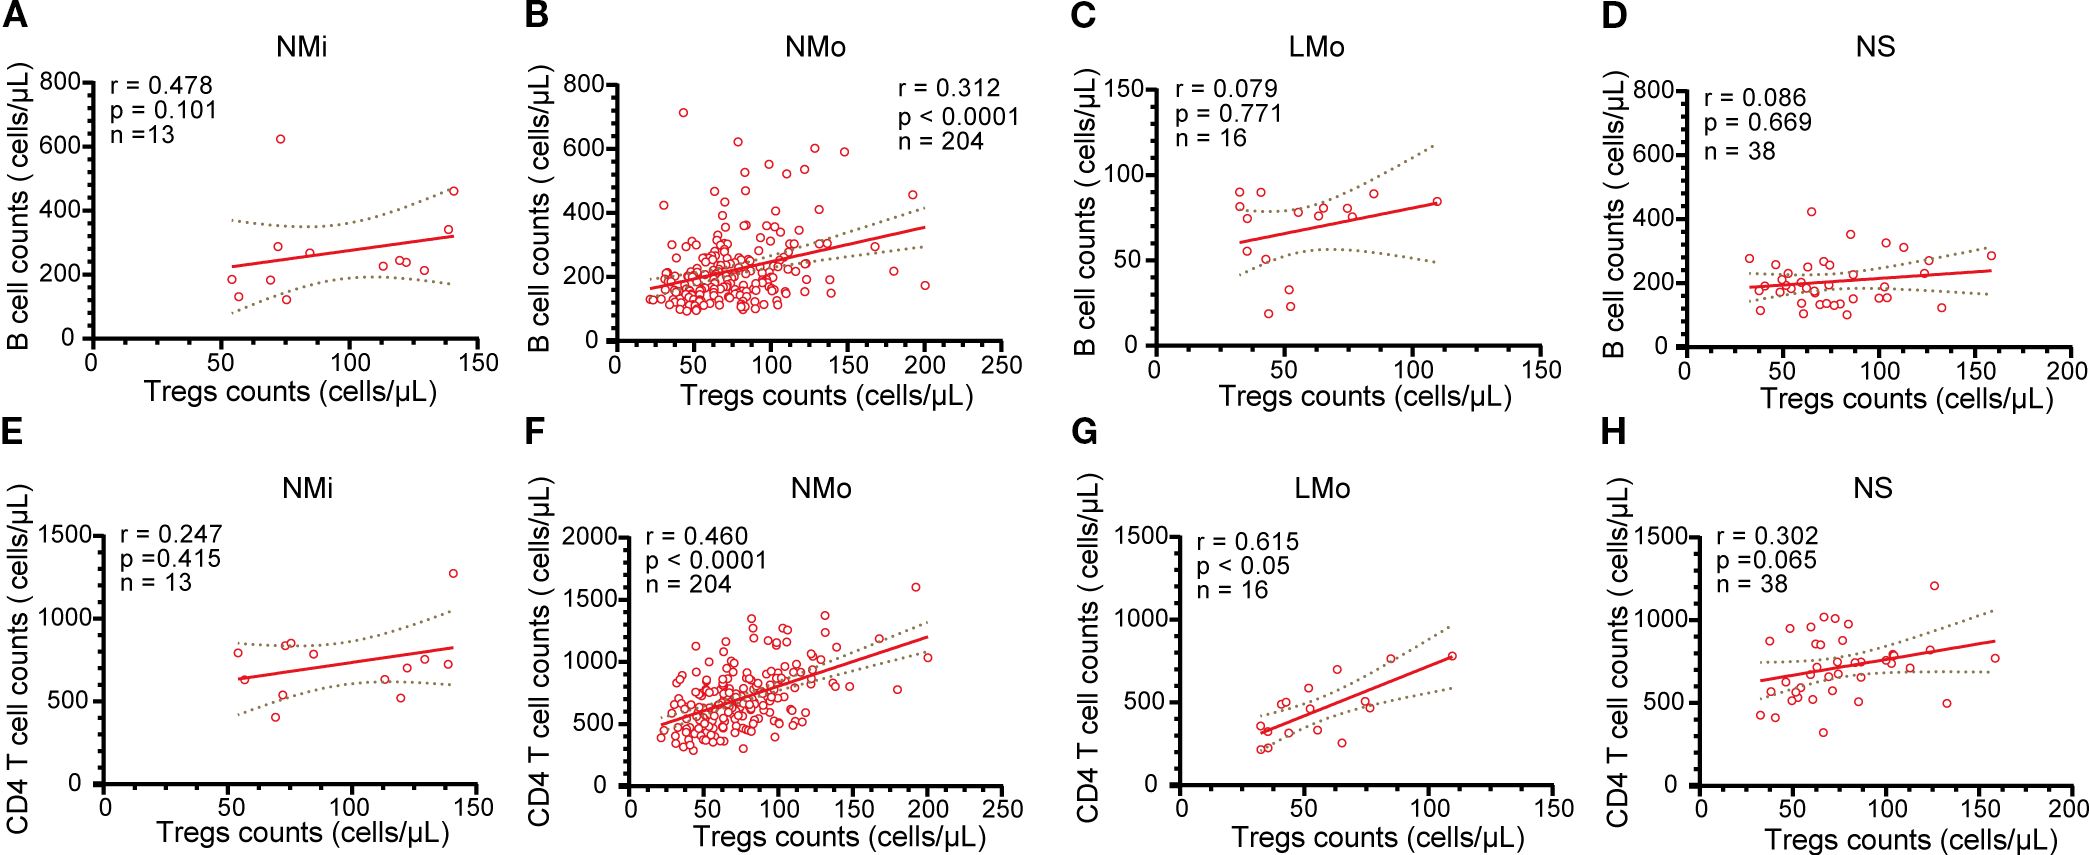
Figure 4. Analysis of the relationship between B cells and Tregs cells, as well as CD4 T cells and Tregs in NMi, NMo, LMo, and NS groups at DPSO50. (A-D) Correlation analysis between B cell counts and Tregs counts in NMi, NMo, LMo, and NS groups, respectively. (E-H) Correlation analysis between T cell counts and Tregs counts in NMi, NMo, LMo, and NS groups, respectively. Pearson correlation analysis was used to determine the correlations.
Both the NMo and LMo groups displayed positive correlations between the counts of Tregs and CD4 T cells (r=0.460, n=204, and r=0.615, n=16, p<0.0001 and p<0.05, respectively, Figures 4F, G). Conversely, no significant correlations were found between Tregs counts and CD4 T cell counts in the NMi and NS groups (r=0.247, n=13 and r=0.302, n=38, respectively, both p>0.05, Figures 4E, H).
Discussion
This study investigated immune response dynamics in unvaccinated individuals with mild, moderate, and severe SARS-CoV-2 infections, focusing on longitudinal immune cell profiling to elucidate immunopathological mechanisms underlying prolonged recovery. Key findings revealed persistent B cell lymphopenia (<90 cells/µL) at 50 days post-symptom onset (DPSO 50) in 7.3% of moderate and 12.5% of severe cases, despite clinical improvement, suggesting unresolved immune dysfunction. This deficiency correlated with reduced serum serotonin levels (Wong et al., 2023)—a critical mediator of B cell proliferation (Iken et al., 1995)—highlighting potential immune axis dysregulation in Long COVID pathogenesis.
Further analysis demonstrated that B cell lymphopenia coincided with significant reductions in total T cells, CD4 T cells, and regulatory T cells (Tregs) during convalescence, particularly in moderate cases (LMo), where CD4/CD8 T cell ratios fell below normal thresholds. While severe cases (LS) exhibited similar trends, sample size limitations precluded statistical significance. These observations align with serotonin’s role in T cell proliferation via 5-HT1A receptor activation (Aune et al., 1993; Iken et al., 1995; Abdouh et al., 2001), suggesting that serotonin depletion in Long COVID (Wong et al., 2023) may selectively impair CD4 T and Treg subsets while sparing CD8 T cells.
Notably, the strong positive correlation between CD4 T cells and Tregs in moderate cases (LMo) disappeared in severe convalescent patients (LS), potentially reflecting Treg migration to inflamed tissues, exhaustion, or reduced peripheral availability (Miedema et al., 2023). This loss of Treg/CD4 T cell coordination is clinically consequential, as Treg deficiency exacerbates inflammation and impairs Th17/Treg balance—a dysregulation linked to respiratory failure and poor Long COVID outcomes (Dhawan et al., 2023). Given Tregs’ role in immune homeostasis and autoimmunity prevention (Cheru et al., 2023), their depletion may perpetuate chronic inflammation and autoantibody production in post-acute sequelae.
The combined immunological profile—persistent B cell lymphopenia, CD4 T cell/Treg depletion, and disrupted CD4/CD8 ratios—defines a distinctive immunopathological signature in moderate-to-severe cases, resembling immunological patterns in HIV/EBV co-infections (Richard et al., 2010; Rosado-Sanchez et al., 2017). These biomarkers could aid in identifying patients at risk of prolonged immunocompromise, guiding targeted therapies such as Treg-boosting interventions or immune checkpoint modulation. However, study limitations—including small sample size and limited longitudinal follow-up—warrant validation through large-scale cohorts incorporating serotonin quantification and single-cell immune profiling (e.g., transcriptomic analysis of exhausted T cells).
Several limitations of this study should be acknowledged. First, the sample size in certain subgroups, particularly those with persistent B-cell lymphopenia (LMo: n = 16; LS: n = 6), was relatively small, which may limit the statistical power and generalizability of correlation analyses, such as those involving Treg subsets. Second, the follow-up period was limited to 50 days post-symptom onset, which may not fully capture long-term immune reconstitution trajectories or the complete spectrum of post-acute sequelae. Third, while this study focused on phenotypic immune profiling, it did not include functional assays, such as cytokine production or antigen-specific responses, leaving the functional competence of altered lymphocyte subsets unclear. Furthermore, although discussed in the context of emerging literature, the proposed link between immune dysregulation and serotonin deficiency remains speculative; serotonin levels were not measured in this study, and this hypothesis warrants further validation. Finally, correlation analyses were exploratory in nature and were not adjusted for multiple testing, a factor that should be considered when interpreting the results. Future studies involving larger cohorts, extended follow-up durations, functional validations, and integrated multi-omics approaches are needed to confirm and extend these findings.
In conclusion, this work identifies persistent defects in the B cell/T cell axis as a critical immunological hallmark of Long COVID. These alterations provide potential biomarkers for immunopathological stratification and therapeutic targeting, while also underscoring the heightened risk of infection among immunocompromised survivors, who may benefit from tailored preventive strategies.
Data availability statement
The original contributions presented in the study are included in the article/supplementary material. Further inquiries can be directed to the corresponding author.
Ethics statement
The studies involving humans were approved by the Institutional Review Board (IRB) of Wenzhou Medical University (Approval Number: 2020002), and all research activities strictly complied with the ethical guidelines established in the 1975 Declaration of Helsinki. Prior to participation, written informed consent was obtained from all study subjects, ensuring transparency regarding sample collection procedures and data usage. The studies were conducted in accordance with the local legislation and institutional requirements. Written informed consent for participation in this study was provided by the participants’ legal guardians/next of kin. Written informed consent was obtained from the individual(s) for the publication of any potentially identifiable images or data included in this article.
Author contributions
HA: Data curation, Formal Analysis, Investigation, Methodology, Validation, Writing – original draft, Writing – review & editing. TY: Data curation, Investigation, Methodology, Validation, Writing – review & editing. AW: Data curation, Investigation, Methodology, Validation, Writing – review & editing. HH: Data curation, Investigation, Methodology, Validation, Writing – review & editing. CZ: Data curation, Investigation, Validation, Writing – review & editing. YW: Investigation, Writing – review & editing. ML: Conceptualization, Data curation, Funding acquisition, Investigation, Project administration, Resources, Supervision, Validation, Writing – original draft, Writing – review & editing.
Funding
The author(s) declare financial support was received for the research and/or publication of this article. This work was supported by the National Natural Science Foundation of China (NSFC) under Grant Numbers 82070855. The authors acknowledge the contributions of this funding body in enabling the execution and dissemination of this research. All data generated during this study are available for sharing upon formal request to the corresponding author, subject to institutional review and ethical compliance protocols.
Acknowledgments
Clinical teams at participant recruitment centers. Technical support from Wenzhou Medical University Core Flow Cytometry Facility.
Conflict of interest
The authors declare that the research was conducted in the absence of any commercial or financial relationships that could be construed as a potential conflict of interest.
Generative AI statement
The author(s) declare that no Generative AI was used in the creation of this manuscript.
Any alternative text (alt text) provided alongside figures in this article has been generated by Frontiers with the support of artificial intelligence and reasonable efforts have been made to ensure accuracy, including review by the authors wherever possible. If you identify any issues, please contact us.
Publisher’s note
All claims expressed in this article are solely those of the authors and do not necessarily represent those of their affiliated organizations, or those of the publisher, the editors and the reviewers. Any product that may be evaluated in this article, or claim that may be made by its manufacturer, is not guaranteed or endorsed by the publisher.
References
Abdouh, M., Storring, J. M., Riad, M., Paquette, Y., Albert, P. R., Drobetsky, E., et al. (2001). Transcriptional mechanisms for induction of 5-HT1A receptor mRNA and protein in activated B and T lymphocytes. J. Biol. Chem. 276, 4382–4388. doi: 10.1074/jbc.M004559200
Alsalman, A., Al-Mterin, M. A., and Elkord, E. (2022). Role of T regulatory cells and myeloid-derived suppressor cells in COVID-19. J. Immunol. Res. 2022, 5545319. doi: 10.1155/2022/5545319
Altmann, D. M., Whettlock, E. M., Liu, S., Arachchillage, D. J., and Boyton, R. J. (2023). The immunology of long COVID. Nat. Rev. Immunol. 23, 618–634. doi: 10.1038/s41577-023-00904-7
An, H., Zhang, J., Li, T., Hu, Y., Wang, Q., Chen, C., et al. (2022). Inflammation/coagulopathy/immunology responsive index predicts poor COVID-19 prognosis. Front. In Cell. Infect. Microbiol. 12, 807332. doi: 10.3389/fcimb.2022.807332
Apoil, P. A., Puissant-Lubrano, B., Congy-Jolivet, N., Peres, M., Tkaczuk, J., Roubinet, F., et al. (2017). Reference values for T, B and NK human lymphocyte subpopulations in adults. Data Brief. 12, 400–404. doi: 10.1016/j.dib.2017.04.019
Aune, T. M., McGrath, K. M., Sarr, T., Bombara, M. P., and Kelley, K. A. (1993). Expression of 5HT1a receptors on activated human T cells. Regulation of cyclic AMP levels and T cell proliferation by 5-hydroxytryptamine. J. Immunol. 151, 1175–1183. doi: 10.4049/jimmunol.151.3.1175
Chen, G., Wu, D., Guo, W., Cao, Y., Huang, D., Wang, H., et al. (2020). Clinical and immunological features of severe and moderate coronavirus disease 2019. J. Clin. Invest. 130, 2620–2629. doi: 10.1172/JCI137244
Cheru, N., Hafler, D. A., and Sumida, T. S. (2023). Regulatory T cells in peripheral tissue tolerance and diseases. Front. Immunol. 14, 1154575. doi: 10.3389/fimmu.2023.1154575
Dhawan, M., Rabaan, A. A., Alwarthan, S., Alhajri, M., Halwani, M. A., Alshengeti, A., et al. (2023). Regulatory T cells (Tregs) and COVID-19: unveiling the mechanisms, and therapeutic potentialities with a special focus on long COVID. Vaccines (Basel) 11 (3), 699. doi: 10.3390/vaccines11030699
Guan, W.-J., Ni, Z.-Y., Hu, Y., Liang, W.-H., Ou, C.-Q., He, J.-X., et al. (2020). Clinical characteristics of coronavirus disease 2019 in China. New Engl. J. Med. 382, 1708–1720. doi: 10.1056/NEJMoa2002032
Huang, C., Wang, Y., Li, X., Ren, L., Zhao, J., Hu, Y., et al. (2020). Clinical features of patients infected with 2019 novel coronavirus in Wuhan, China. Lancet 395, 497–506. doi: 10.1016/S0140-6736(20)30183-5
Iken, K., Chheng, S., Fargin, A., Goulet, A. C., and Kouassi, E. (1995). Serotonin upregulates mitogen-stimulated B lymphocyte proliferation through 5-HT1A receptors. Cell Immunol. 163, 1–9. doi: 10.1006/cimm.1995.1092
Jiang, Y., Wei, X., Guan, J., Qin, S., Wang, Z., Lu, H., et al. (2020). COVID-19 pneumonia: CD8(+) T and NK cells are decreased in number but compensatory increased in cytotoxic potential. Clin. Immunol. 218, 108516. doi: 10.1016/j.clim.2020.108516
Jin, S., An, H., Zhou, T., Li, T., Xie, M., Chen, S., et al. (2021). Sex- and age-specific clinical and immunological features of coronavirus disease 2019. PloS Pathogens 17, e1009420. doi: 10.1371/journal.ppat.1009420
Jin, X. H., Zhou, H. L., Chen, L. L., Wang, G. F., Han, Q. Y., Zhang, J. G., et al. (2021). Peripheral immunological features of COVID-19 patients in Taizhou, China: A retrospective study. Clin. Immunol. 222, 108642. doi: 10.1016/j.clim.2020.108642
Kam, K. M., Leung, W. L., Kwok, M. Y., Hung, M. Y., Lee, S. S., and Mak, W. P. (1996). Lymphocyte subpopulation reference ranges for monitoring human immunodeficiency virus-infected Chinese adults. Clin. Diagn. Lab. Immunol. 3, 326–330. doi: 10.1128/cdli.3.3.326-330.1996
Kostopoulos, I. V., Orologas-Stavrou, N., Rousakis, P., Panteli, C., Ntanasis-Stathopoulos, I., Charitaki, I., et al. (2021). Recovery of innate immune cells and persisting alterations in adaptive immunity in the peripheral blood of convalescent plasma donors at eight months post SARS-CoV-2 infection. Microorganisms 9 (3), 546. doi: 10.3390/microorganisms9030546
Kudryavtsev, I. V., Arsentieva, N. A., Korobova, Z. R., Isakov, D. V., Rubinstein, A. A., Batsunov, O. K., et al. (2022). Heterogenous CD8+ T cell maturation and 'Polarization' in acute and convalescent COVID-19 patients. Viruses 14 (9), 1906. doi: 10.3390/v14091906
Miedema, J. R., de Jong, L. J., van Uden, D., Bergen, I. M., Kool, M., Broos, C. E., et al. (2023). Circulating T cells in sarcoidosis have an aberrantly activated phenotype that correlates with disease outcome. J. Autoimmun. 149, 103120. doi: 10.1016/j.jaut.2023.103120
Orologas-Stavrou, N., Politou, M., Rousakis, P., Kostopoulos, I. V., Ntanasis-Stathopoulos, I., Jahaj, E., et al. (2020). Peripheral blood immune profiling of convalescent plasma donors reveals alterations in specific immune subpopulations even at 2 months post SARS-CoV-2 infection. Viruses 13 (1), 26. doi: 10.3390/v13010026
Richard, Y., Amiel, C., Jeantils, V., Mestivier, D., Portier, A., Dhello, G., et al. (2010). Changes in blood B cell phenotypes and Epstein-Barr virus load in chronically human immunodeficiency virus-infected patients before and after antiretroviral therapy. J. Infect. Dis. 202, 1424–1434. doi: 10.1086/656479
Rosado-Sanchez, I., Herrero-Fernandez, I., Alvarez-Rios, A. I., Genebat, M., Abad-Carrillo, M. A., Ruiz-Mateos, E., et al. (2017). A lower baseline CD4/CD8 T-cell ratio is independently associated with immunodiscordant response to antiretroviral therapy in HIV-infected subjects. Antimicrob. Agents Chemother. 61 (8), e00605-17. doi: 10.1128/AAC.00605-17
Rudolph, A. E., Al Akoury, N., Bogdanenko, N., Markus, K., Whittle, I., Wright, O., et al. (2025). Factors affecting the impact of COVID-19 vaccination on post COVID-19 conditions among adults: A systematic literature review. Hum. Vaccin. Immunother. 21, 2474772. doi: 10.1080/21645515.2025.2474772
Ryan, F. J., Hope, C. M., Masavuli, M. G., Lynn, M. A., Mekonnen, Z. A., Yeow, A. E. L., et al. (2022). Long-term perturbation of the peripheral immune system months after SARS-CoV-2 infection. BMC Med. 20, 26. doi: 10.1186/s12916-021-02228-6
Sherina, N., Piralla, A., Du, L., Wan, H., Kumagai-Braesch, M., Andréll, J., et al. (2021). Persistence of SARS-CoV-2-specific B and T cell responses in convalescent COVID-19 patients 6–8 months after the infection. Med. (New York NY) 2, 281–295.e4. doi: 10.1016/j.medj.2021.02.001
Shuwa, H. A., Shaw, T. N., Knight, S. B., Wemyss, K., McClure, F. A., Pearmain, L., et al. (2021). Alterations in T and B cell function persist in convalescent COVID-19 patients. Med 2, 720–35 e4. doi: 10.1016/j.medj.2021.03.013
Votto, M., Castagnoli, R., Marseglia, G. L., Licari, A., and Brambilla, I. (2023). COVID-19 and autoimmune diseases: is there a connection? Curr. Opin. Allergy Clin. Immunol. 23, 185–192. doi: 10.1097/ACI.0000000000000888
Wong, A. C., Devason, A. S., Umana, I. C., Cox, T. O., Dohnalová, L., Litichevskiy, L., et al. (2023). Serotonin reduction in post-acute sequelae of viral infection. Cell 186 (22), 4851–4867.e20. doi: 10.1016/j.cell.2023.09.013
Yang, J., Zhong, M., Zhang, E., Hong, K., Yang, Q., Zhou, D., et al. (2021). Broad phenotypic alterations and potential dysfunction of lymphocytes in individuals clinically recovered from COVID-19. J. Mol. Cell Biol. 13, 197–209. doi: 10.1093/jmcb/mjab014
Keywords: COVID-19, convalescent patients, persistent lymphocytopenia, B cells, T cells, regulatory T cells
Citation: An H, Yu T, Wang A, Hu H, Zhang C, Wang Y and Li M (2025) Persistent lymphocytopenia in convalescent patients with COVID-19: dysregulated B cell, CD4+ T cell, and treg compartments in 7–12% of moderate-severe cases. Front. Cell. Infect. Microbiol. 15:1693743. doi: 10.3389/fcimb.2025.1693743
Received: 27 August 2025; Accepted: 22 September 2025;
Published: 09 October 2025.
Edited by:
Piyush Baindara, University of Missouri, United StatesReviewed by:
Jian Chen, Westlake University, ChinaVijay Radhakrishnan, University of Missouri, United States
Copyright © 2025 An, Yu, Wang, Hu, Zhang, Wang and Li. This is an open-access article distributed under the terms of the Creative Commons Attribution License (CC BY). The use, distribution or reproduction in other forums is permitted, provided the original author(s) and the copyright owner(s) are credited and that the original publication in this journal is cited, in accordance with accepted academic practice. No use, distribution or reproduction is permitted which does not comply with these terms.
*Correspondence: Ming Li, bWluZ2xpQHdtdS5lZHUuY24=