 Hejie Chen1
 Jiamin Jin
 Steven Sun
- 1School of Economics and Management, Beijing Institute of Graphic Communication, Beijing, China
- 2School of Film and Television Production, Zhejiang Hengdian College of Film & Television, Zhejiang, China
- 3Department of Management of Complex Systems, University of California Merced, Merced, CA, United States
Introduction: The convergence of information technology and the Internet has deeply embedded the media in social life. On different social media platforms, emotion contagion is combined with information dissemination, presenting weak information and strong emotion. In the process of information dissemination, emotion becomes the driving force. This study takes the case of biological parents searching for their abducted son to study the emotional evolution and information dissemination characteristics of hot events in four common social media platforms. Based on the Susceptible-Exposed-Infectious-Recovered (SEIR) model, the exposed is divided into potential positive emotion spreaders, potential negative emotion spreaders, and potential neutral emotion spreaders in this paper. Then, the S3EIR model is constructed based on the path of netizens’ emotional contagion. In order to verify the validity and applicability of the S3EIR model, this paper constructs a dynamical model.
Methods: It uses Python to crawl the comments of the family-seeking event on the four social platforms and uses simulation to simulate and verify the dynamic process of emotional contagion and information dissemination.
Results and discussion: The results show that the S3EIR model is feasible and effective in simulating emotional contagion and information flow in social media. The content posted by key opinion leaders on platforms and the emotional atmosphere created in their comment areas significantly impact on the emotional state of netizens. The change in netizens’ emotions is affected by factors such as the characteristics of social media platforms, their user groups, and the functions of the platforms. The model also simulates and verifies the dynamic process of emotion spreading and information diffusion.
1 Introduction
Propagation activities are both information and emotional communication, and emotional communication is better understanding and sharing information. In the past, propagation activities mostly referred to information dissemination; that is, information transmission was the main focus, supplemented by emotional contagion. With social media integration into people’s lives, propagation activities are characterized by weak information and strong emotions. Driven by some strong emotions, some emotional information is widely circulated. Especially when a particular emotion has a broad psychological resonance, it is easier to gain popularity (Yan and Yan, 2012; Zhu et al., 2019). Emotions continue to impact individuals and groups and participate in the construction of society (Le Bon, 2002). Studying the mechanism of emotion evolution and information dissemination in social media platforms can help promote information dissemination through emotions.
Social Media Platforms influence emotional expression contagion, and information adoption. Because the propagation activities based on these platforms are characterized by fast dissemination speed, wide influence range, and high interactivity, the dissemination speed and range of information have been greatly expanded. Emotions are not only a key carrier for human beings to convey emotions and exchange ideas but also a unique form of information that reflects various complex social relationships uniquely. Emotion sharing is independent of demographic characteristics such as gender and age, and both positive and negative emotions can trigger sharing behaviors (Curci and Bellelli, 2004). Emotional Contagion theory is used to explain the spread of emotions. Emotional contagion refers to the process by which people experience their own emotions from experiencing the emotions of others (Hatfield et al., 1993). Emotions are contagious, capable of rapid transmission and resonance among people; they are cumulative, and long-term emotional experience affects the psychological state and social behavior of individuals; at the same time, emotions are also instructive, capable of influencing people’s decision-making and direction of action; lastly, the social characteristics of emotions should not be ignored, which are deeply rooted in social interactions and cultural environments, shaping the interactions between people (Herrando and Constantinides, 2021). In 1970, Ekman et al. identified anger, sadness, surprise, fear, disgust, and happiness as the six basic categories of emotions (Curci and Bellelli, 2004), and most of the subsequent research on emotions has been based on his findings (Bandhakavi et al., 2017). Currently, most research on personal emotions focuses on emotional valence, dividing them into three categories, namely positive, neutral, and negative emotions (Kang et al., 2017; Fan et al., 2017; Featherstone et al., 2020).
Researchers have conducted in-depth studies on the emotional contagion of social media, where the emotions of social media users are influenced by the emotions of the content they read (Ferrara and Yang, 2015; Sciara et al., 2021). Research on Facebook has shown that when there are fewer positive expressions, people make fewer positive posts and more negative ones. When there are fewer negative expressions, people make fewer negative posts and more positive posts. It indicates that emotions expressed by others on social media influence users’ emotions (Kramer et al., 2014). Research on Twitter suggests that negative emotional stimuli produce negative emotions, positive emotions trigger positive emotions, and neutral emotions generate neutral ones (Ferrara and Yang, 2015). The keywords for negative emotions show such as anger and fear, while positive emotions show words for joy and happiness (Ferrara and Yang, 2015). Social emotions related to social hot events are generally divided into three categories: positive emotions mainly include liking and happiness; Negative emotions include sadness, anxiety, fear, anger, and resentment; the objective emotion is mainly sympathy (Xuehe et al., 2019). According to the existing research results, this study divides emotions into positive, negative, and neutral emotions (Ferrara and Yang, 2015).
Currently, many studies have applied the propagation dynamics model to social network information dissemination. Using data sets from Facebook and LastFM Asia, the S3IR model was used to study the influence of key opinion leaders on disseminating public opinion (Rong et al., 2023). SEI1I2R was used to study the prediction of negative emotions on netizens’ emotions (Shi et al., 2022). It studies the influence mechanism of individuals’ hesitation on information dissemination in heterogeneous networks (Cui and Zhu, 2024). In an evacuation situation, the SIR model can effectively improve emotional interaction and quickly evacuate the crowd (Xiang et al., 2018). This study introduces the S3EIR model to social network information dissemination.
This study addresses several critical research gaps in the literature on social media communication. First, unlike prior studies that focus on a single platform, this research examines communication patterns across four distinct social media platforms, offering a comparative analysis of the same event. Second, it integrates the concept of emotional contagion into the study of high-profile events, exploring the underlying mechanisms of information dissemination through propagation dynamics. Third, by accounting for platform-specific characteristics—such as user demographics, platform functionalities, and structural features—this study investigates the emotional contagion dynamics of the same event across different social media environments, providing a nuanced understanding of cross-platform variation.
The remainder of this paper is structured as follows. Firstly, the construction, formulation, and simulation of the S3EIR model are introduced. Following this, the S3EIR simulation process divides potential emotion spreaders into three categories: (1) One type of potential emotion spreader has the largest number of people, and the other two have an equal number. (2) The three types of potential emotion spreaders have different numbers of people. (3) One type of potential emotion spreader has the least number of people, and the other two have an equal number. The simulation found that the dominant emotions easily influence netizens’ emotions in hot events. In Chapter 3, the data of the research platforms (Bilibili,1 Toutiao,2 TikTok,3 and Weibo4) are obtained through Python for the case study of the S3EIR model. The main content includes (1) The basis for choosing the four platforms of Bilibili, Toutiao, TikTok, and Weibo. (2) Introduction of user comments acquisition and processing and visualized analysis of the data. (3) The different parameters of each platform are introduced into the S3EIR model to simulate the evolution law of emotional contagion on each platform. (4) The corresponding measures of public opinion governance are proposed through the simulation case study of each platform by the S3EIR model. In Chapter 4, we summarize and review this paper’s research background, theory, process, and results, explain some problems encountered in the research, and propose solutions. The limitations of current research and the implications for future research.
2 Review
Individuals frequently engage with digital media, exposing them to others’ emotional expressions. This exposure can lead to the alignment of their own emotional expressions with those observed, a phenomenon termed “digital emotion contagion” (Zhang et al., 2021). Research indicates that a single post expressing positive or negative emotion can prompt one to two additional posts of similar emotional valence from the poster’s connections (Coviello et al., 2014). Fan et al. (2018) found that anger, for instance, spreads preferentially through weak ties, with anger-dominated users exhibiting high activity and angry posts being rapidly retweeted, particularly during negative events. Kramer et al. (2014) provided experimental evidence of massive-scale emotional contagion on Facebook, demonstrating that emotions expressed by others significantly influence users’ own emotional states. Ferrara and Yang (2015) noted that positive emotions are generally more contagious, with highly susceptible users more likely to adopt positive emotional expressions.
Hatfield et al. (1993) argue that emotional contagion is a process by which people achieve emotional convergence by mimicking and synchronizing others’ movements, expressions, and other characteristics. Scholars have introduced the contagion model into information dissemination research, and the contagion model used in this study is the SEIR model developed from the SIR model. A Kermack-McKendrick SIR Model was proposed by Kermack and McKendrick (1927). Goffman and Newill (1964) innovatively combined the SIR model with information dissemination to explore the information diffusion mechanism in a population from the perspective of infectious disease dynamics. The mechanism of action of the SIR model can be summarized as follows: At the starting point, all dissemination nodes are in a susceptible state, which means that individuals have not yet been exposed to the information. Subsequently, some of the nodes are transformed from a susceptible state to an infectious state due to exposure to the information. These infected nodes, in turn, try to infect other nodes to promote wide information dissemination and emotional contagion.
The SEIR model was developed by Schwartz in 1983 based on the SIR model. In this model, S represents the susceptible who has not yet been exposed to certain information, and E represents a potential spreader who has been exposed to the information but has not yet disseminated it. The SEIR model was proposed by Aron and Schwartz (1984) expanding the SIR model with the addition of E.
Several studies have employed the SEIR model to investigate information propagation dynamics in social networks. Zhang et al. (2021) utilized the SEIR model to assess the impact of initial disseminators, finding that a greater number of disseminators and their strategic network positions amplify the severity of information spread. Nie et al. (2021) demonstrated the SEIR model’s efficacy, showing that a modified version effectively captures the interplay between social media dynamics and epidemic-like information spread. Zhao et al. (2018) developed two distinct SEIR-based models to analyze information propagation processes within networks. Xiao et al. (2019) integrated multi-dimensional user features and a dynamic evolution game mechanism into an SEIR model to predict public opinion evolution trends. Focusing on direct immunization, Liu et al. (2018) explored an SEIR-based rumor propagation model, rigorously proving the persistence of rumor spread in social networks.
Drawing on infectious disease frameworks, researchers have developed various information propagation models for social networks. Li et al. (2021) demonstrated that the HK-SEIR model more accurately reflects the work-rest patterns of public opinion dissemination compared to the SEIR and SIR models, identifying user interest as a primary driver of opinion spread once user opinion fusion reaches a critical threshold. Zhang et al. categorized infectious nodes into two groups within social networks and proposed the SE2IR model to characterize information propagation. They further quantified model parameters using network features, including users’ perceived values, social intervention intensity, and information timeliness (Zhang et al., 2021).
This study introduces three emotional valences—positive, negative, and neutral—and proposes the S3EIR model to analyze their impact on information propagation. Kai and Xin (2022) findings on the S3EIR model demonstrate that the emotional tone of government short video content and associated comment sections significantly influences netizens’ emotions, thereby altering the propagation dynamics.
3 The diffusion model based on S3EIR model
3.1 S3EIR model construction
This paper utilizes the S3EIR model to analyze the pathways of emotional contagion among netizens. The model introduces three emotional polarities: positive emotions, negative emotions, and neutral emotions. The potential emotion spreaders (E) are categorized into E1 (potential positive emotion spreaders), E2 (potential negative emotion spreaders), and E3 (potential neutral emotion spreaders). A user emotion contagion path model based on S3EIR is constructed accordingly. The following hypothesis is proposed based on the characteristics of the evolution of netizens’ emotional contagion and the principles of transmission dynamics:
Hypothesis 1: Consider the system to be closed, meaning the number of netizens exposed to user content remains fixed. Let the total number of netizens be N, where S represents those susceptible to emotions, E1 represents potential positive emotion spreaders, E2 represents potential negative emotion spreaders, E3 represents potential neutral emotion spreaders, I represents the infected, and R represents the recovered. Thus, the relationship is given by S + E1 + E2 + E3 + I + R = N (see Figure 1 for more details).
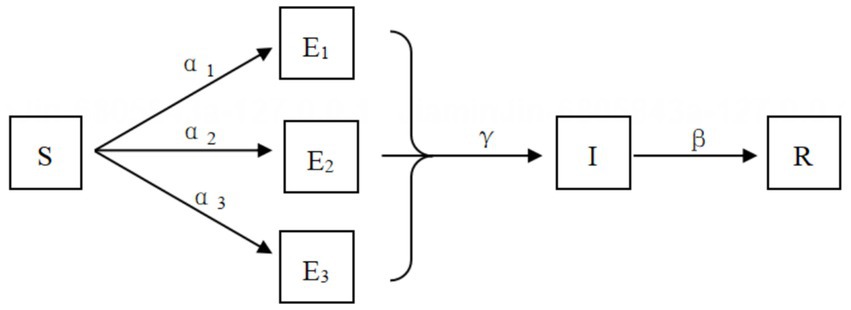
Figure 1. Model graph of netizens emotion contagion path based on S3EIR.
Hypothesis 2: Let α1, α2, and α3 represent the spreading rates, γ the infection rate, and β the immunity rate, with all coefficients ranging between [0,1]. Figure 1 illustrates the model graph of the netizen emotion contagion path based on these hypothesis. Each parameter is set with reference to existing research findings.
At each time step, each spreader node tries to disseminate public opinion information to the neighboring susceptible node S. A value of k is customized (k is greater than or equal to the average degree of the social network). The nodes with a degree greater than or equal to k are considered the key nodes, the opinion leaders in reality. When a susceptible node S comes into contact with neighboring nodes, if the number of nodes of opinion leaders with positive attitudes exceeds those with negative attitudes, the susceptible node S transforms into a potential positive emotion spreader node E1 with probability α1. Suppose the number of nodes with negative attitudes exceeds those with positive attitudes. In that case, the susceptible node S transforms into a potential negative emotion spreader node E2 with probability α2. Suppose the number of nodes of opinion leaders with negative attitudes is equal to that of opinion leaders with positive attitudes. In that case, the susceptible node S transforms to a potential neutral emotion spreader node E3 with a probability of α3. Over time, the spreader begins to lose interest in the public opinion message, and the potential emotion spreader nodes E1, E2, and E3 transform into the emotionally infected person I with probability γ, and the emotionally infected person transforms into the recovered R with probability β.
3.2 S3EIR propagation dynamics analysis
Social networks have a high clustering coefficient. The degree of social networks usually presents a power-law distribution, and information disseminates quickly in social networks. Therefore, this paper does not consider the dynamic changes in network structure and uses the mean-field theory to perform dynamic analysis on the S3EIR model. At time t, let the susceptible node S, the potential positive emotion spreader node E1, the potential negative emotion spreader node E2, the potential neutral emotion spreader node E3, and the density of the recovered node R be Sk(t), E1k(t), E2k(t), E3k(t), Ik(t), and Rk(t), respectively. The above model parameters explain the density of this model and its normalization conditions, namely the Equation 1 can be listed.
Combined with the idea of infectious disease dynamics modeling, the S3EIR model for analyzing information dissemination is constructed, and the mean-field equations of the model are obtained as follows: Equations 2–7:
In the above mean-field equation, k is the degree of the node in the network and Equation 8 is presented in below:
Equation 8 is the probability of connection between the susceptible node S and the three potential emotion spreaders nodes when the degree is k at time t. P(k′/k) is the conditional probability that a node with degree k is connected to a node with degree k′.
Information dissemination grows from the beginning to the outbreak and then stops disseminating in the end. Only the susceptible group S and the recovered group remain in the system. When the system reaches a stable state, in order to obtain the final information dissemination scale R∞ and the model propagation threshold, it is necessary to obtain S∞, that is, S∞ = 1−R∞. Assume that there is only one initial spreader node of information dissemination in the entire dissemination network, then the susceptible node S at the initial moment Sk(0) = (N−1)/N ≈ 1, the potential emotion spreader node at the initial moment E1k (0) + E2k (0) + E3k (0) = 1 / N ≈ 0, and the recovered node R at the initial moment Rk(0) = 0. N is the total number of users in the dissemination network. To obtain the expression of Sk(t), three auxiliary functions are constructed:
Where q(k) = p(k′/k). However, Equation 12 is derived,
Combining Equations 2, 9, 10, and 11 and integrating Equation 2, Sk(t) = e−k(ψ(t) + φ t) + ξ(t)) can be obtained.
Let get Equation 13
that is Equation 14:
Next, multiply both sides of Equation 3 by q(k), sum over k, and integrate the entire Equations 15, 16:
⇒
Similarly, we can get Equations 17, 18:
When t → ∞, dψ(t)dt = dξ(t) dt = dφ(t) dt = 0. So we can get:
Simplifying both sides of Equations 19–21 and adding them together, from δ(t) = φ(t) + ξ(t) + ψ(t), we can obtain Equation 22:
When t → ∞, δ(∞) = 0.
Expand exponentially and simplify Equation 21 to obtain:
It is obvious from Equation 23 that δ∞ has zero solution. To obtain a nonzero solution, we can simplify Equation 23 and move the terms to obtain:
The following Equation 25 can be obtained.
To simplify the calculation, let , k = k2/ k, k2 = k3/k, and finally simplify Equation 24. We can know the nonzero solution of δ∞ in Equation 26:
That is:
Substituting η into Equation 27, we can obtain the dissemination thresholds α’pc, α’oc, α’nc of the three types of dissemination groups, respectively. Finally, when t → ∞, R(∞) = 1−Sk(∞), so the final information dissemination scale is shown in Equation 28:
3.3 S3EIR simulation and discussion
The simulation experiment was conducted according to the three situations: positive emotions dominate, negative emotions dominate, and neutral emotions dominate in the comment section. According to the research results of Fan et al. (2017), the probability of a susceptible individual turning into a potential emotion spreader is set to be 0.8 for α1, α2, and α3, 0.25 for γ, and 0.25 for β. Assuming that the total number of netizens N is 2000, the number of the infected I is 100, and the number of positive, neutral, and negative emotion spreaders is 300 each, i.e., E1 = 300, E2 = 300, E3 = 300. The number of the susceptible is S = 1,000, i.e., N = 2000, α1 = 0.8, α2 = 0.8, α3 = 0.8, γ = 0.25, β = 0.25, S = 1,000, E1 = 300, E2 = 300, E3 = 300, I = 100, and R = 0. In order to verify the effectiveness of the model, Python was used to conduct an in-depth analysis of the S3EIR model using numerical simulation technology, and various parameters were regulated to explore how different factors affect the contagion process of negative emotions (see Figure 2 for more details).
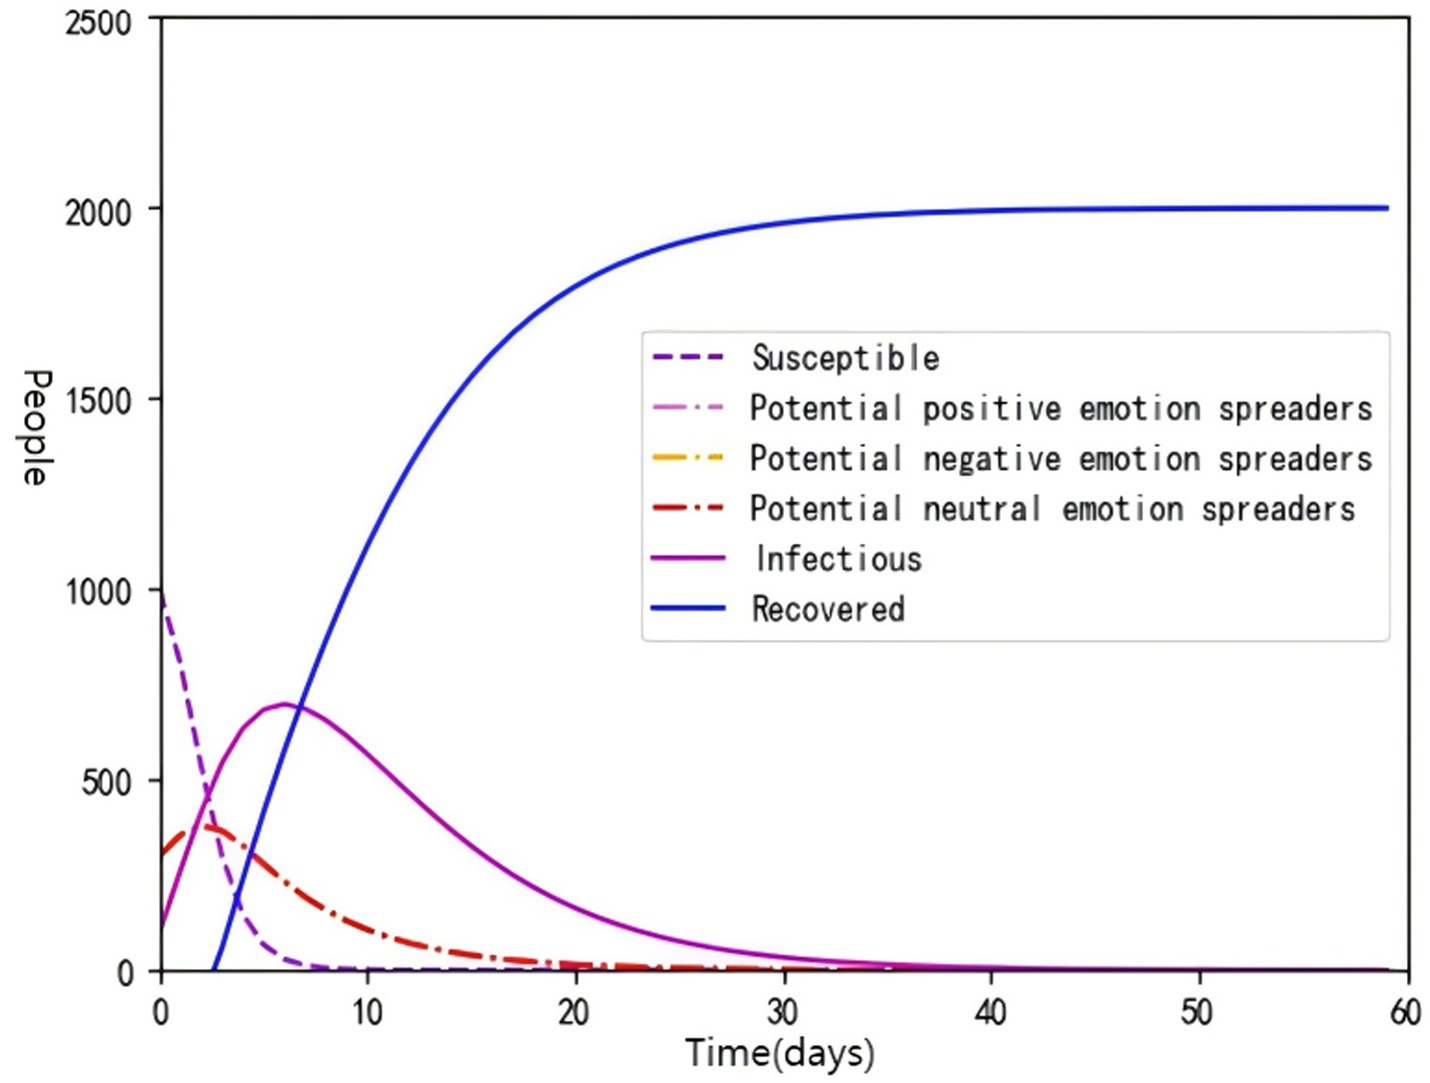
Figure 2. S3EIR model simulation graph.
According to Figure 2, on the same time axis, the three groups of potential positive emotion spreaders, potential negative emotion spreaders, and potential neutral emotion spreaders have similar change trends, all of which show an increase and then a decrease over time and the deceleration slows down gradually. The proportion of the susceptible individual to emotions shows a monotonically decreasing trend over time, initially decreasing faster and then gradually slowing down until the proportion eventually reaches zero. Meanwhile, emotionally infected individuals experience a process of rising and then falling, with the rate of increase gradually accelerating before reaching the peak, and then gradually decreasing after reaching the peak, and eventually also tending to zero. The proportion of emotionally immune individuals shows the opposite single-increasing curve, with the proportion also experiencing a rapid increase over time, followed by a gradual decline in the rate of growth until it stabilizes and eventually occupies almost the entire proportion of the total population.
In Figure 2, potential positive emotion spreaders, potential negative emotion spreaders, and potential neutral emotion spreaders are concentrated on the same curve because their starting numbers are equal and their infection rates are equal. At the same time, since the rate of transfer of the susceptible individuals turning into potential emotion spreaders is faster than that of potential emotion spreaders into the infected individuals, and the total number of the group is determined, the number of potential emotion spreaders first rises and then declines. However, in hot events, the initial number of infected individuals and potential emotion spreaders is often not zero but will vary according to factors such as the nature, influence, and dissemination channels of an event.
After adjusting the proportion of potential positive emotion spreaders, potential negative emotion spreaders, and potential neutral emotion spreaders, this paper simulated the model and found that the model would appear in the following three situations.
1. One type of potential emotion spreader has the largest number of people, and the other two have an equal number (set N = 2000, α1 = 0.8, α2 = 0.8, α3 = 0.8, γ = 0.25, β = 0.25, S = 1,000, E1 = 500, E2 = 200, E3 = 200, I = 100, R = 0) (see Figure 3).
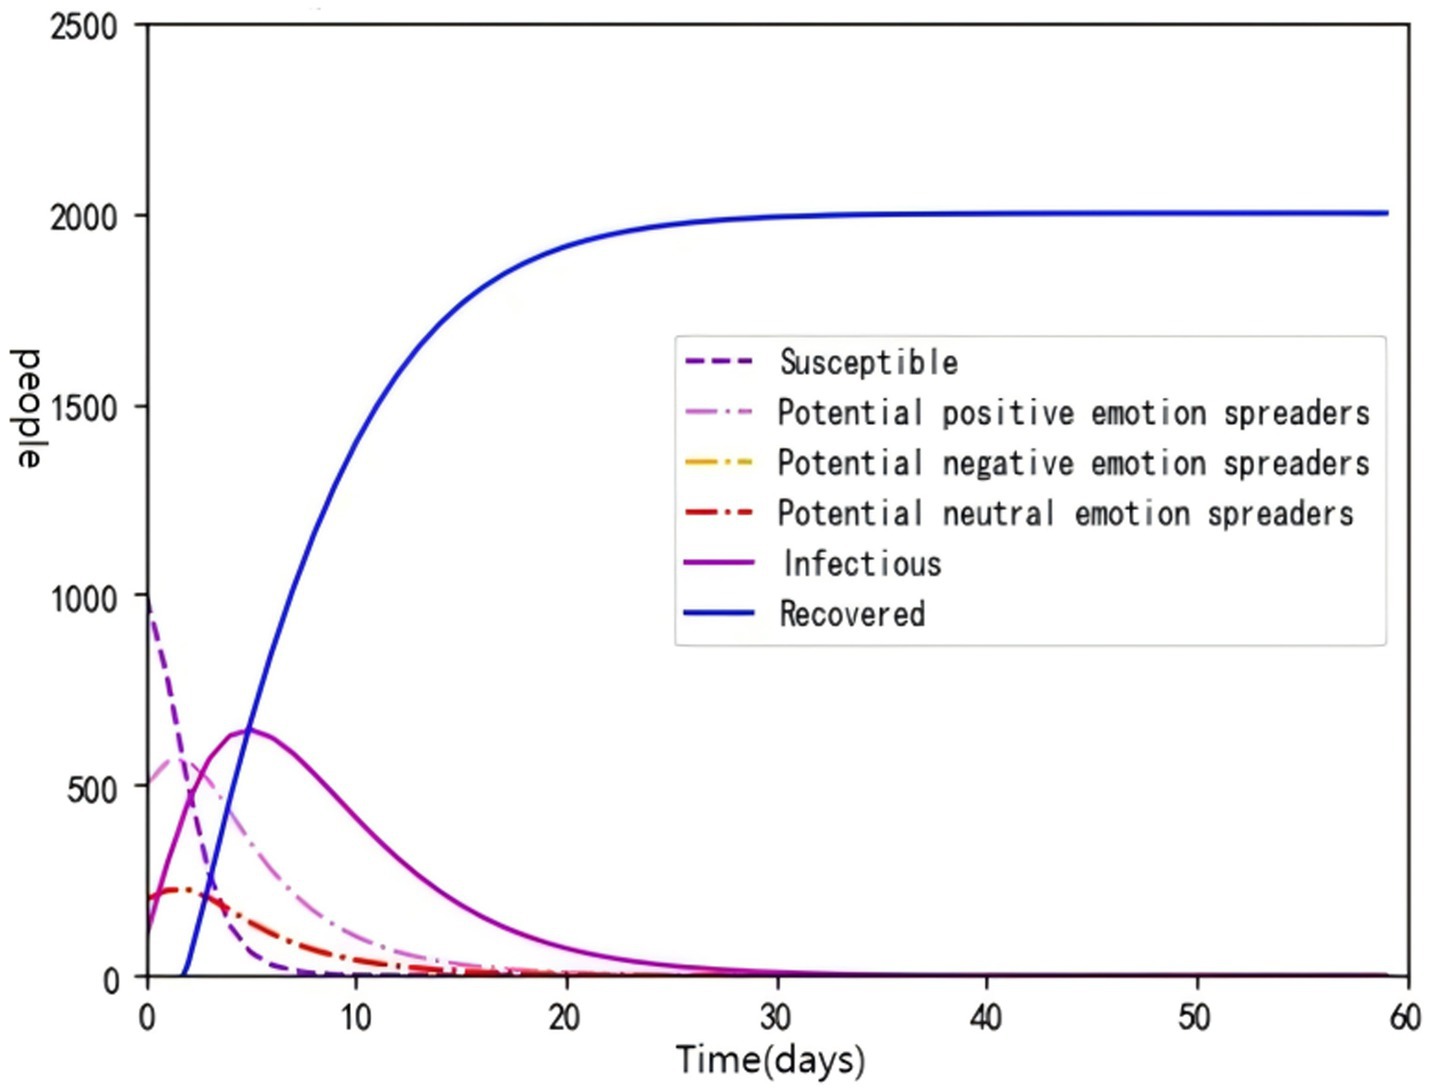
Figure 3. Simulation diagram of the maximum number of potential emotional spreaders with only one type.
When the number of one type of potential emotion spreader is the largest, the number of potential positive emotion spreaders, potential negative emotion spreaders, and potential neutral emotion spreaders all show a trend of first increasing and then decreasing over time. The peak value of the number of potential emotion spreaders with the largest initial value is the highest.
2. The number of three types of potential emotion spreaders is not equal (set N = 2000, α1 = 0.8, α2 = 0.8, α3 = 0.8, γ = 0.25, β = 0.25, S = 1,000, E1 = 400, E2 = 300, E3 = 200, I = 100, R = 0) (see Figure 4).
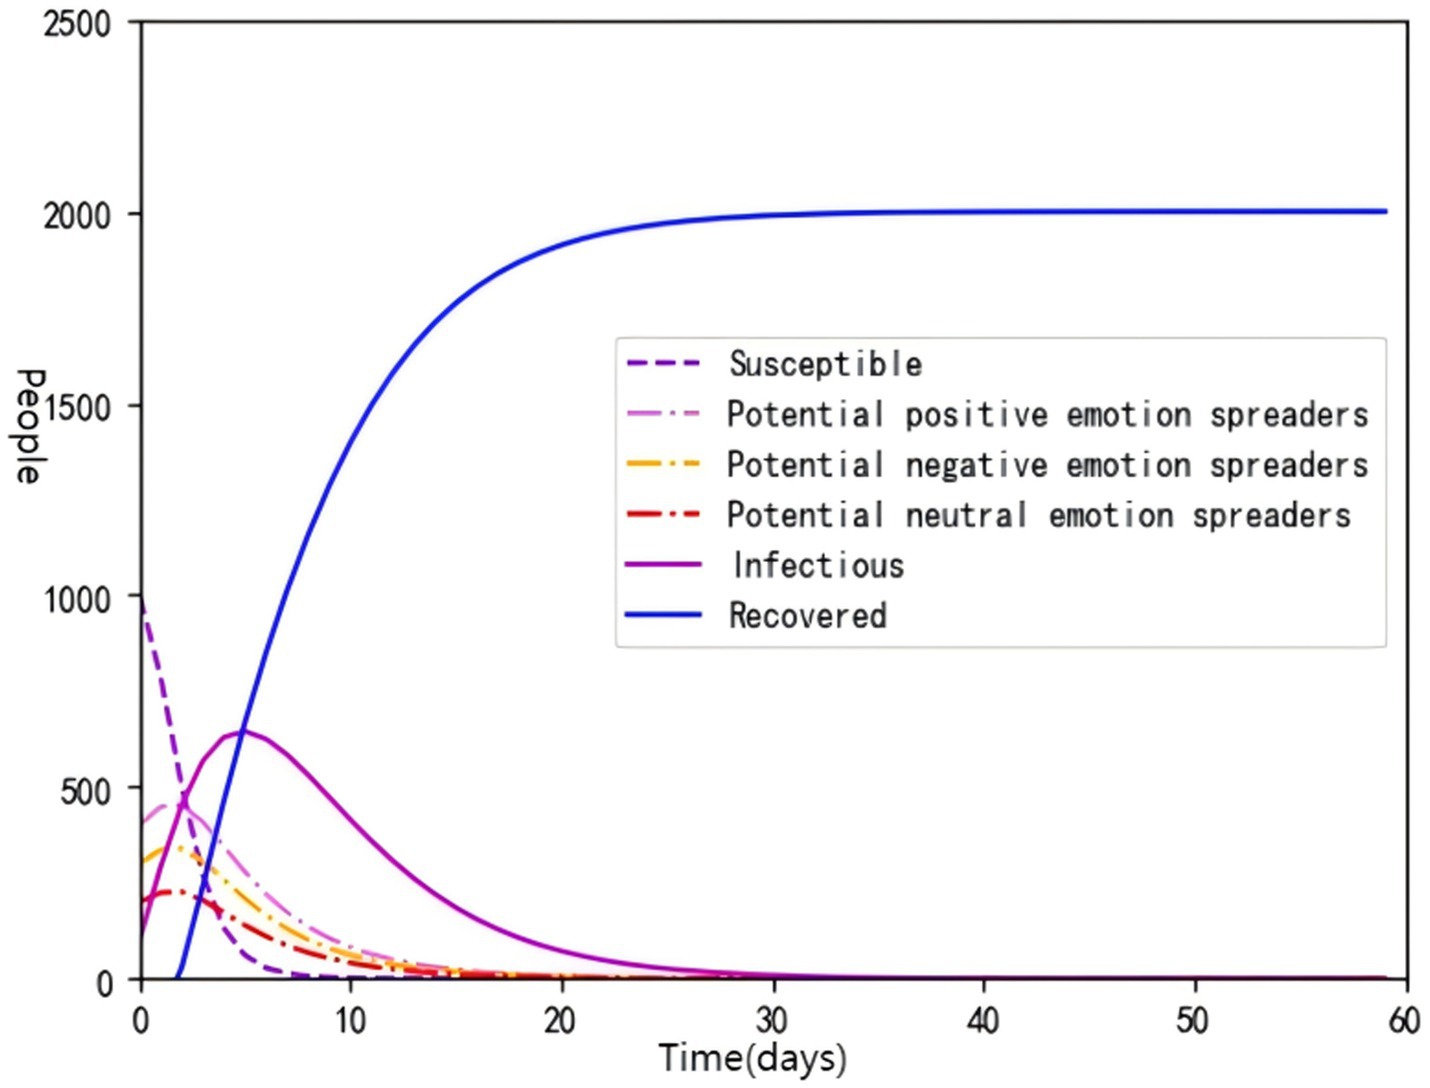
Figure 4. Simulation diagram when three potential emotion spreaders are not equal.
When the number of three potential emotion spreaders is not equal the number of potential positive emotion spreaders, potential negative emotion spreaders, and potential neutral emotion spreaders all show an increasing and then decreasing trend over time, and their peak values also increase with the initial value.
3. One of the potential emotion spreaders has the fewest number of people, while the other two potential emotion spreaders have an equal number of people (set N = 2000, α1 = 0.8, α2 = 0.8, α3 = 0.8, γ = 0.25, β = 0.25, S = 1,000, E1 = 350, E2 = 350, E3 = 200, I = 100, R = 0) (see Figure 5).

Figure 5. Simulation diagram of the minimum number of potential emotional spreaders with only one type.
This study performed 500 Monte Carlo simulations using the S3EIR model and SIER model, with results summarized in Table 1. The standard deviation of 0 for E1 indicates a single transmission peak across all simulations, suggesting that positive emotion contagion exhibits a unimodal characteristic without secondary outbreaks or sustained fluctuations. This is attributed to the rapid depletion of susceptible individuals (S) or swift decay of transmission dynamics, consistent with findings in Figures 2–5. For E2, the standard deviation of 0.14 days (approximately 3.36 h) demonstrates the model’s low sensitivity to initial condition variations, implying that the duration of negative emotion subsidence is primarily governed by model parameters. These results validate the effectiveness of intervention strategies implemented through parameter adjustments.
When only one type of potential emotion spreader has the fewest people, the number of potential positive emotion spreaders, potential negative emotion spreaders, and potential neutral emotion spreaders shows a trend of first increasing and then decreasing over time, and the peak value of the number of potential emotion spreaders with the smallest initial value is the lowest.
This study quantifies five key metrics in the S3EIR model: Peak Number of Infected Individuals, Time to Peak, Final Proportion of Recovered Individuals, Area Under the Curve (AUC), and Rate of Decline of Negative Emotions, as presented in Table 2. These results align closely with the trends observed in Figures 2–5. Collectively, the findings indicate that netizens’ emotions are highly susceptible to dominant emotional cues. Consequently, during significant events, increasing the use of positive emotion-oriented text or content, tailored to the event’s context, can guide public opinion, foster positive emotional responses among netizens, and mitigate the risk of online public opinion crises.
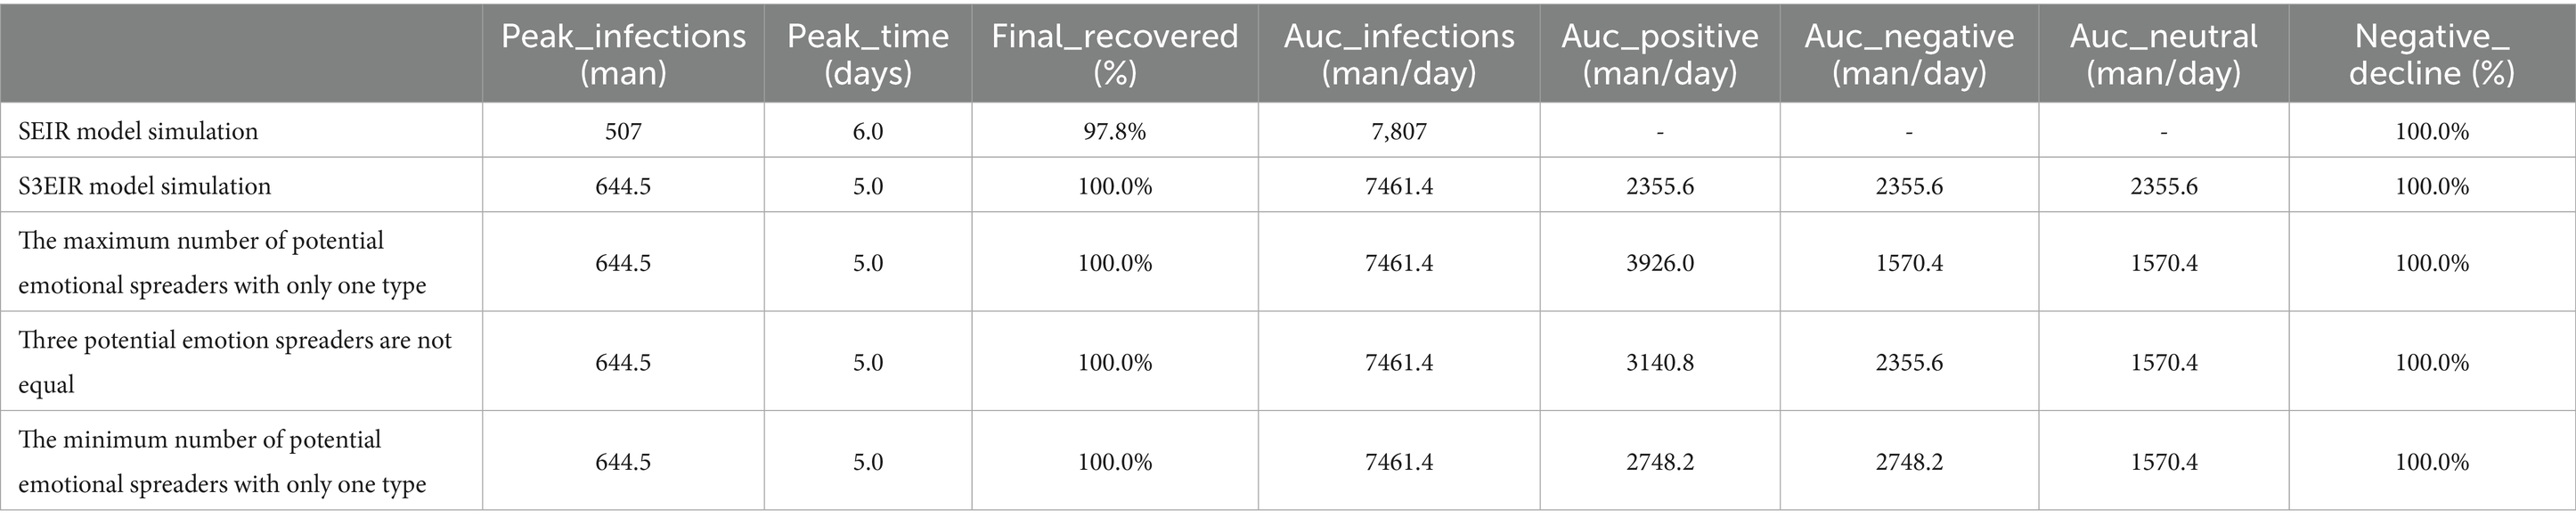
Table 2. S3EIR and SEIR simulation.
The SEIR simulation was conducted using the parameters S = 1,000, N = 2000, α = 0.8, γ = 0.25, β = 0.25, E = 300, I = 100, and R = 0, with results presented in Table 1. Compared to the S3EIR model, the SEIR model exhibited a higher number of peak_infections, faster progression to peak_ infections, and a higher final_recovery rate. Additionally, Monte Carlo simulations were performed to analyze the E_peak and E_zero_day nodes of the potential emotional spreader E in the SEIR model. The results showed minimal differences in E_peak, the number of E_peak, and E_zero_day between the SEIR and S3EIR models. Tssshese findings indicate that the S3EIR model offers significant advantages in dynamically characterizing communication and informing intervention strategies through refined emotional classification.
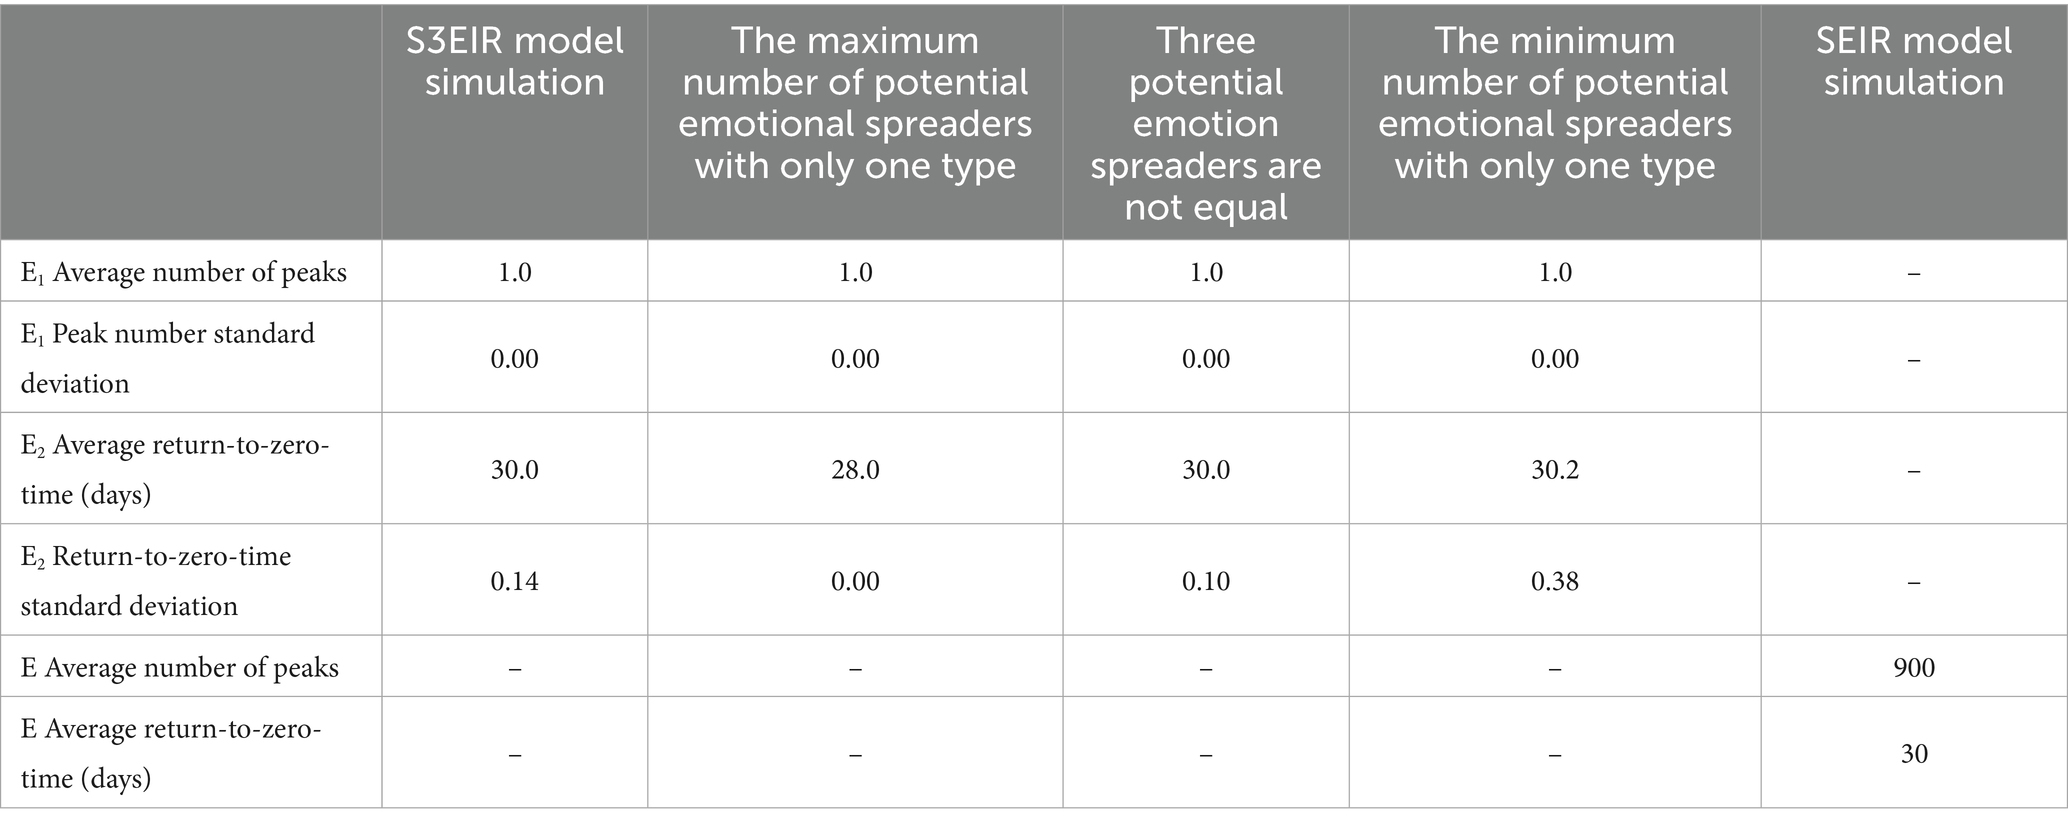
Table 1. S3EIR Monte Carlo simulation results (500 runs).
4 Multi-platform emotion propagation analysis based on S3EIR model
4.1 Data collection and procession
This paper selects this incident, uses “Zhiwei data”,5 and combines it with the discussion on various platforms to select the more popular content and comments to crawl. The filtering conditions are based on the number of online comments on content published on the four platforms (see Table 3 for detailed user characteristics of the four platforms and the reasons for choosing each platform): more than 1,000 comments on Weibo, more than 10,000 comments on TikTok, more than 300 comments on Toutiao, and more than 100 comments on BiliBili. This paper uses Python to write code for crawling. The crawling time is from December 6, 2021, to April 21, 2022. After removing erroneous duplications and data that are obviously irrelevant to the topic, the total amount of effective comment data is as follows: 15,221 comments on Weibo, 52,624 on BiliBili, 30,339 on Toutiao, and 86,723 on TikTok.
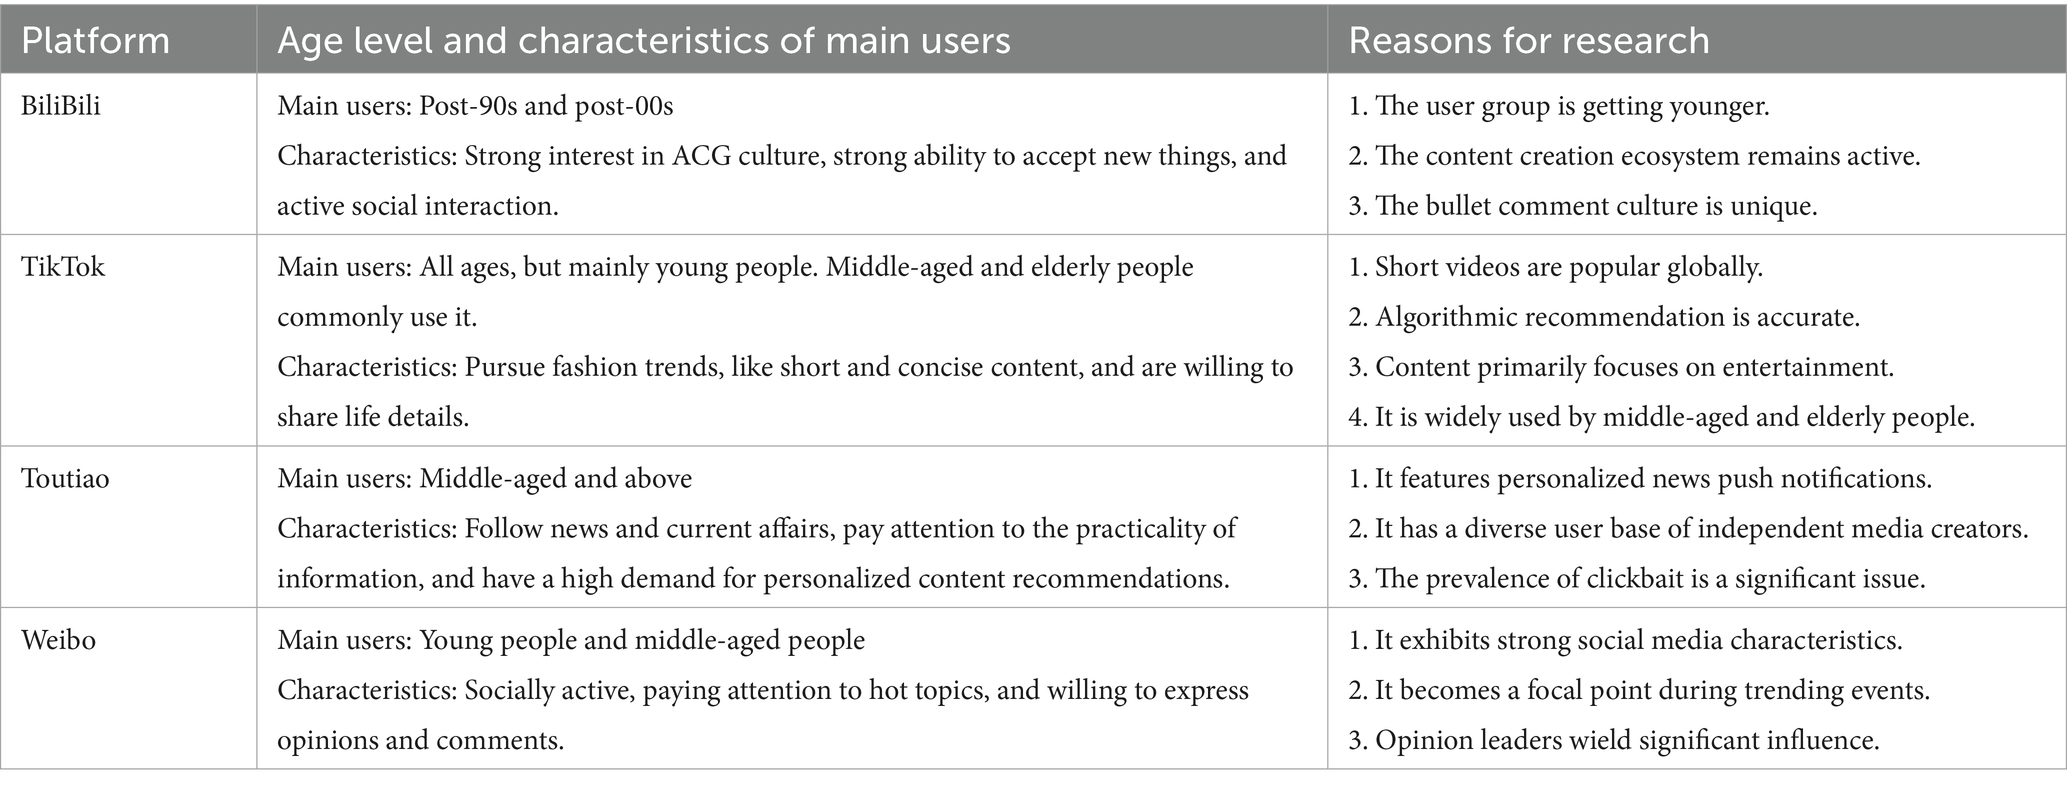
Table 3. Four platform selection criteria (Zeng and Wang, 2023; Qing, 2021; Hong and Chang, 2023; Zhu, 2021; Tan, 2021).
First, Python is used to crawl the data. After the text preprocessing, jieba (Wang et al., 2020; Xue and Xue, 2023) is used to segment the collected text data accurately. Then, it uses the Chinese emotional vocabulary question bank of Dalian University of Technology (Xu et al., 2008) to calculate the emotional value of the segmented text and visually presents the emotional value to understand the development dynamics and evolution trends of information dissemination.
4.2 Multi-platform emotional contagion
In this study, emotional communication is defined as the expression, transmission, and sharing of emotions by individuals or groups and their associated behaviors. This paper focuses on online reviews across various platforms, where language containing emotional content reflects individual cognitive concepts. According to Emotional Contagion Theory (Curci and Bellelli, 2004; Hatfield et al., 1993) individual emotions can influence other members, leading to a convergence of emotions and cognitive states within the group.
The data were analyzed to determine positive, negative, and neutral emotional valences in chronological order, using these emotional categories as key points of analysis (see Figure 6 for more details. In Figure 6, the X-axis represents time, while the Y-axis shows the cumulative counts of the three emotional valences in the comments.
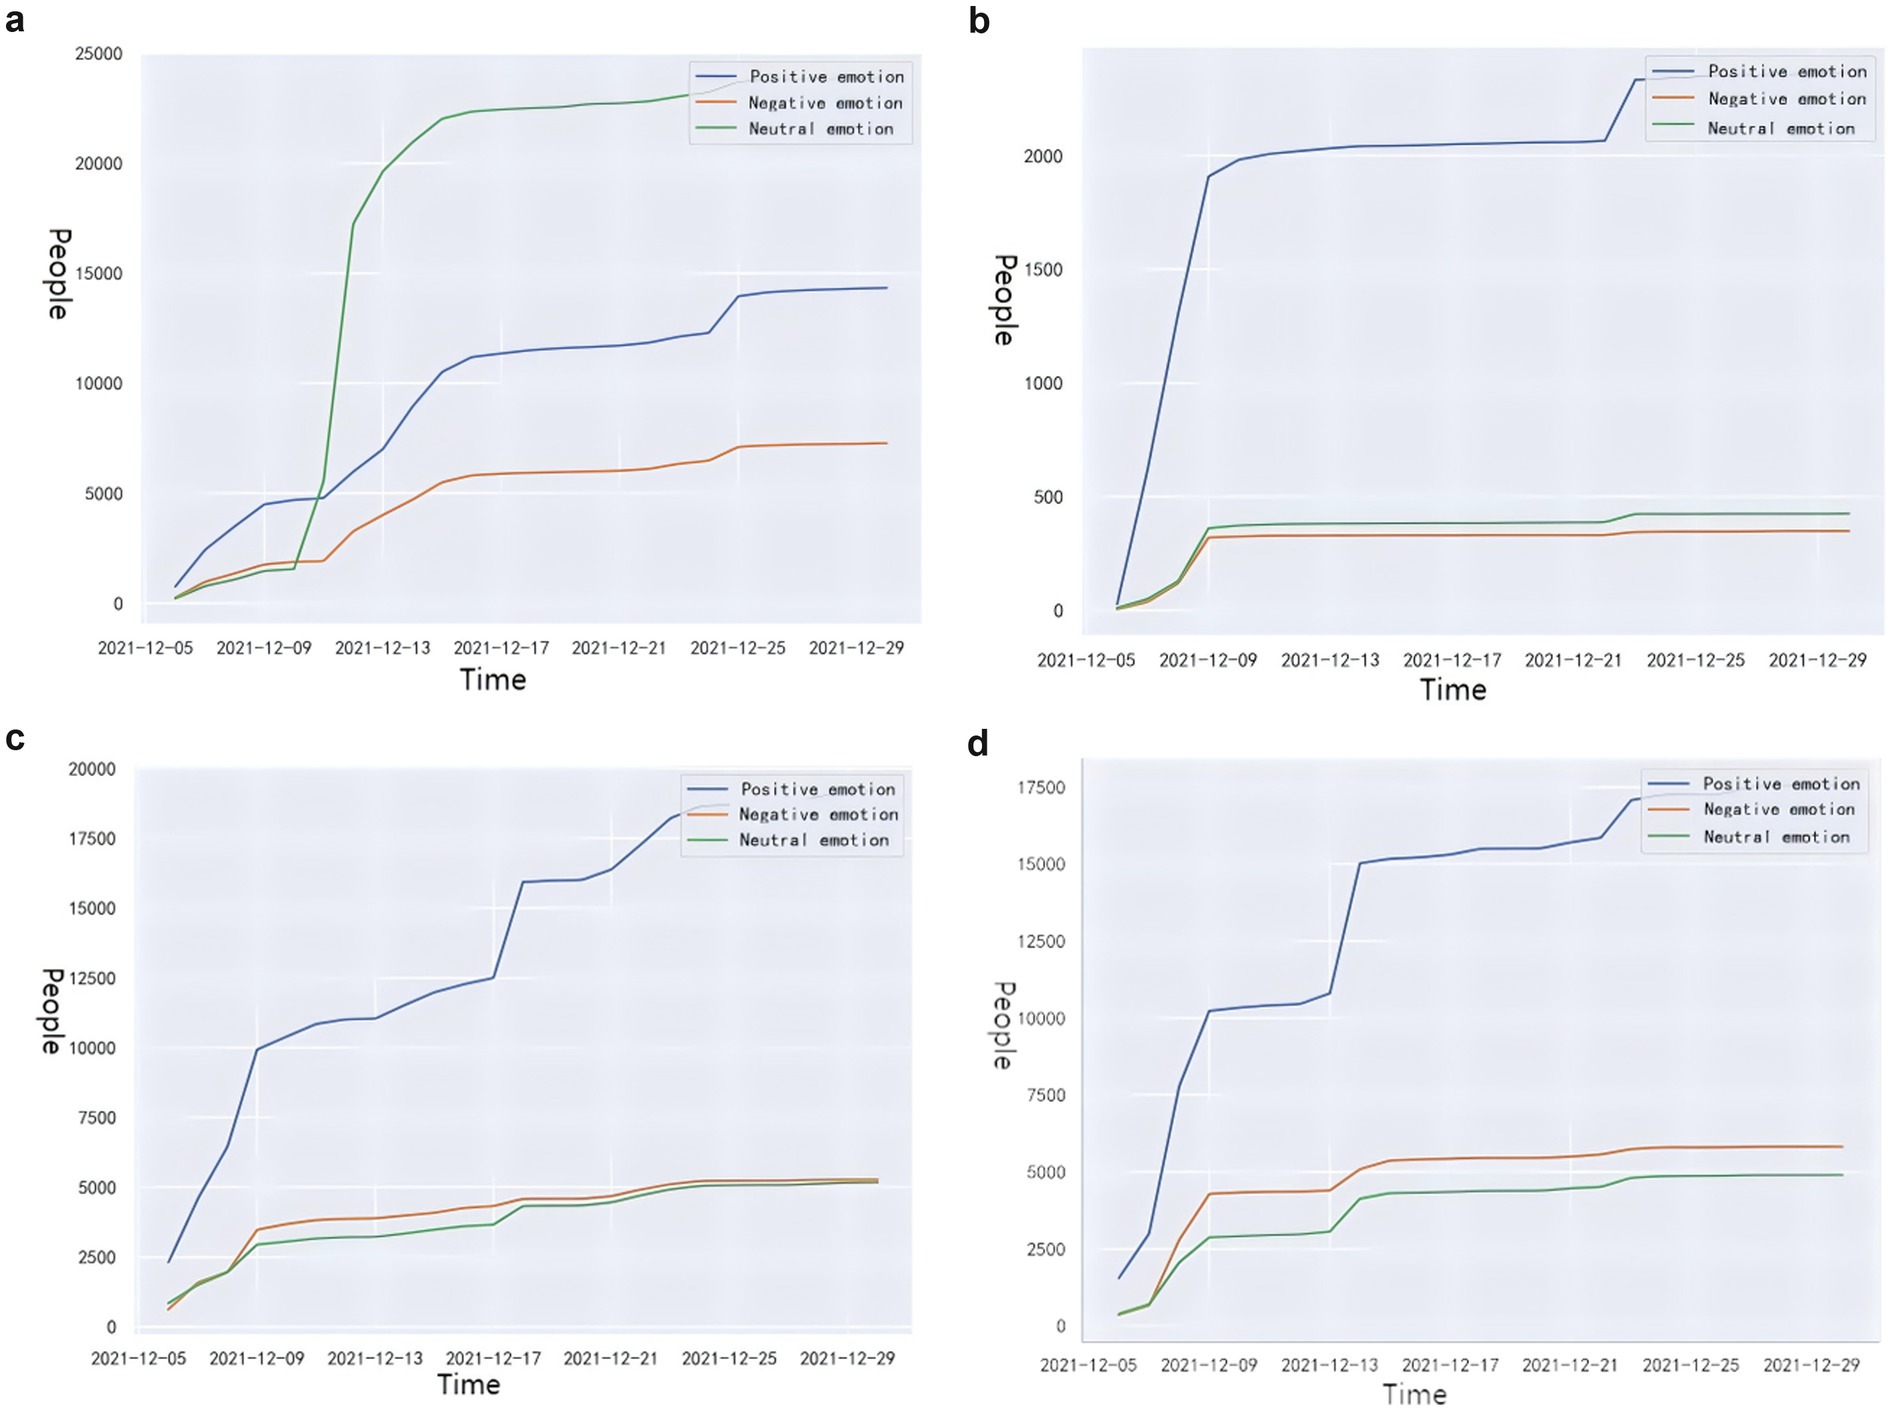
Figure 6. Emotional valence analysis at (a) BiliBili (b) TikTok (c) Toutiao (d) Weibo.
The emotional trends on TikTok, Toutiao, and Weibo exhibit similarities. December 9th marks a crucial point in the information dissemination period (December 8–14). From December 6–9, the slope of the emotional valence line is steeper compared to the period after December 9th, with positive emotions experiencing several rapid surges. Both Toutiao and Weibo have higher levels of negative emotions compared to neutral emotions. In contrast, neutral emotions of TikTok are more prevalent than negative emotions, with both lines stabilizing post-December 9th. Positive emotions significantly outweigh negative emotions and continue to rise even after December 9th. User attention to the event decreased noticeably after December 10th and did not pick up again until December 22nd. This pattern indicates that TikTok users exhibit a more neutral and positive communication atmosphere compared to users on other platforms, suggesting that positive emotions more effectively engage TikTok users.
BiliBili displays a distinct pattern compared to the other three platforms. From the outbreak of the hot event, positive emotions are initially the most dominant, followed by negative emotions, with neutral emotions being the least. On December 10th, neutral emotions surpassed negative emotions, and by December 11th, they became the dominant emotional valence. All three emotional valences increased steadily thereafter. However, unlike the other platforms, the difference between the positive emotions and negative emotions is more pronounced on BiliBili. This trend indicates that following the initial emotional mobilization, BiliBili users adopted a more objective stance towards the incident, resulting in less significant individual emotional contagion.
One reason for the difference between BiliBili and the other platforms is that the videos released on BiliBili often have a certain lag. The video content is not transmitted strictly according to the chronological order of news events. Instead, it focuses more on interpreting the news event content, which often appears after the initial news release. Once these interpretative videos are released, they can significantly impact the emotions of platform users.
4.3 Multi-platform simulation experiment and discussion
Based on the research results on Facebook and Twitter, it is pointed out that when negative emotions decrease, positive emotions increase, and negative emotions decrease (Featherstone et al., 2020; Sciara et al., 2021). In order to verify whether this conclusion applies to other social media, this paper reduces negative emotions based on collected data and predicts future emotional contagion trends through the unique functions provided by each social media platform.
The initial parameter setting method for each platform is uniform, following these steps: First, code the number of comments on December 6 for positive, negative, and neutral emotions to determine the number of potential spreaders of these emotions. Assume that, without external interference, the total number of captured comments represents the total number of individuals (parameter N). This paper calculates the spreading rates α1, α2, and α3 for the three emotions by dividing the number of potential spreaders for each emotion by the number of comments on December 6. The daily incidence rate for potential emotion spreaders is set to 1, and the daily recovery rate is 0.25. The number of emotionally infected individuals is 50, while all other individuals are susceptible to emotions, and the number of recovered individuals is 0.
4.3.1 Research on BiliBili simulation
4.3.1.1 Parameter settings and simulation results
On December 6, BiliBili received 1,230 comments from 764 users expressing positive emotions, 248 users expressing negative emotions, and 218 users expressing neutral emotions. The total number of people, denoted as parameter N, is 52,625. After calculation, the parameters are as follows: N = 52,625, α1 = 0.62, α2 = 0.20, α3 = 0.18, γ = 0.25, β = 0.25, S = 51,345, E1 = 764, E2 = 248, E3 = 218, I = 50, and R = 0.
As illustrated in Figure 7, the number of susceptible individuals decreases monotonically and then levels off, but does not approach zero. The number of emotionally infected individuals follows a parabolic trend, initially rising and then falling. Emotionally immune individuals begin to appear around day 9, increasing monotonically until stabilizing, but not encompassing everyone. The number of potential positive emotion spreaders increases monotonically and then decreases until it reaches zero. Conversely, potential negative and neutral emotion spreaders tend toward zero throughout the entire communication process.
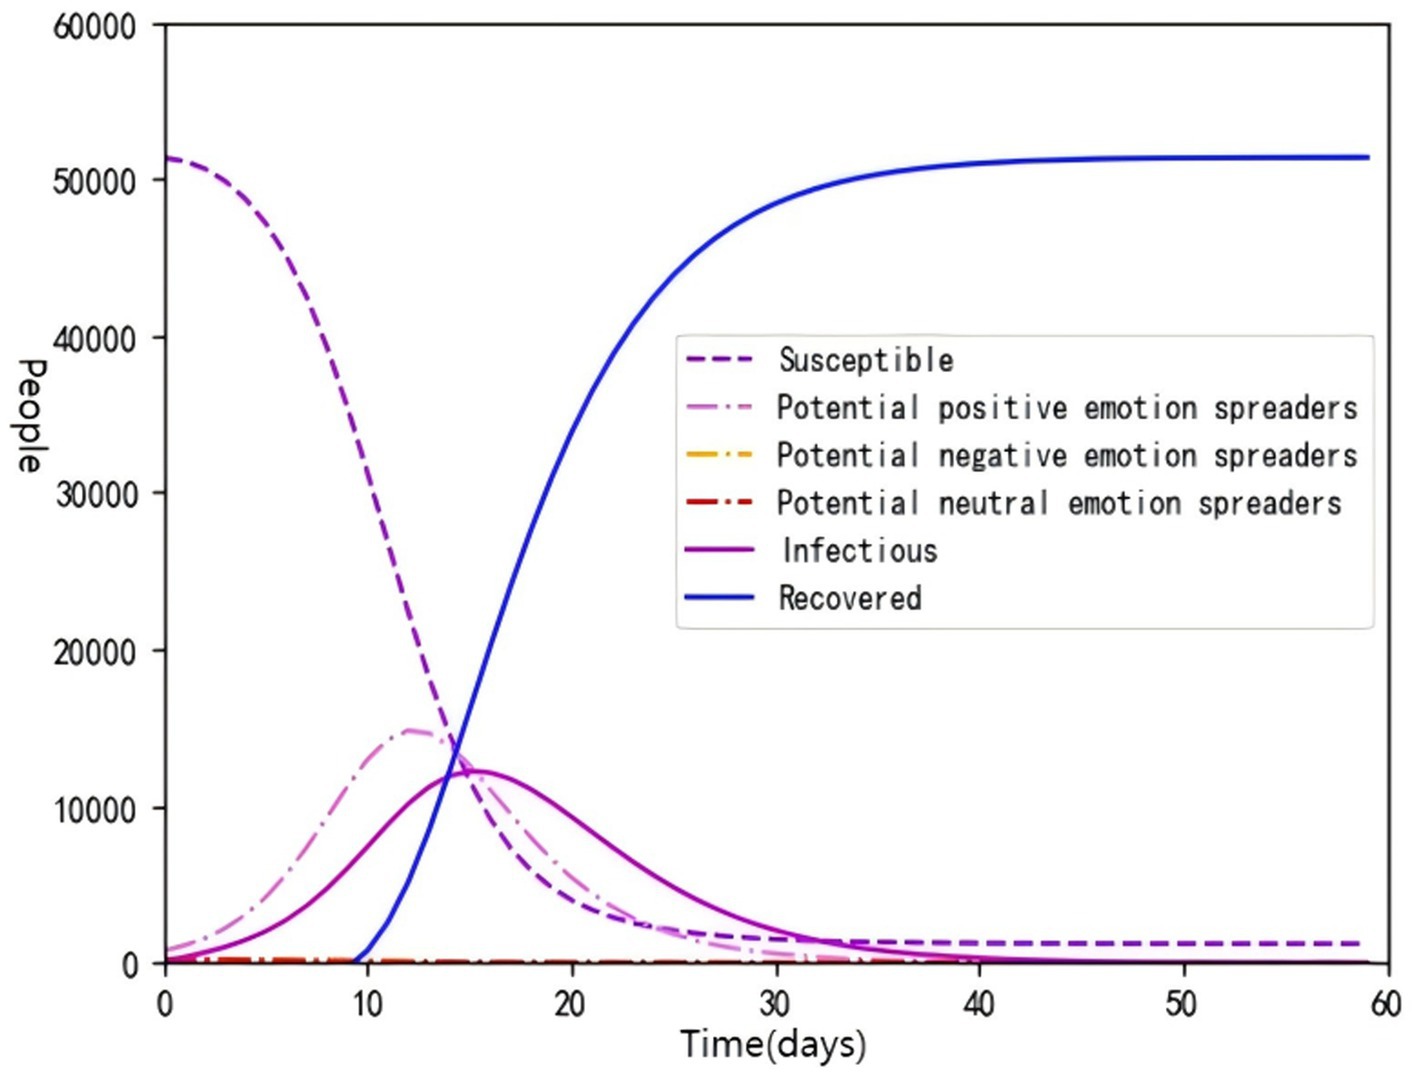
Figure 7. S3EIR simulation diagram of Bilibili.
4.3.1.2 Intervention strategies to increase the number of people with positive emotions
The BiliBili user group places significant importance on expert opinions. Given that neutral emotions dominate on BiliBili, the strategy is added positive viewpoints. It is assumed that the number of potential positive and negative emotion spreaders, i.e., the number of E1 and E3, increases. Concurrently, the transmission rates of potential negative and neutral emotion spreaders are reduced to facilitate the rapid spread of positive emotions. For a population N = 52,625, the effective daily contact rate between potential spreaders and the susceptible population is set at 0.25. The daily incidence rate for potential emotion spreaders is 0.25, and the daily recovery rate is also 0.25. The number of infectious individuals is 50, while the number of recovered individuals is 0. Specifically, the parameters are: N = 52,625, α1 = 0.62, α2 = 0.10, α3 = 0.10, γ = 0.25, β = 0.25, S = 50,609, E1 = 1,500, E2 = 248, E3 = 218, I = 50, and R = 0.
By increasing the number of potential positive emotion spreaders and decelerating the transformation rate of potential negative and neutral emotion spreaders, the appearance of recovered individuals is delayed. Concurrently, there is an increase in the number of potential positive emotion spreaders and individuals infected with positive emotions (see Figure 8).
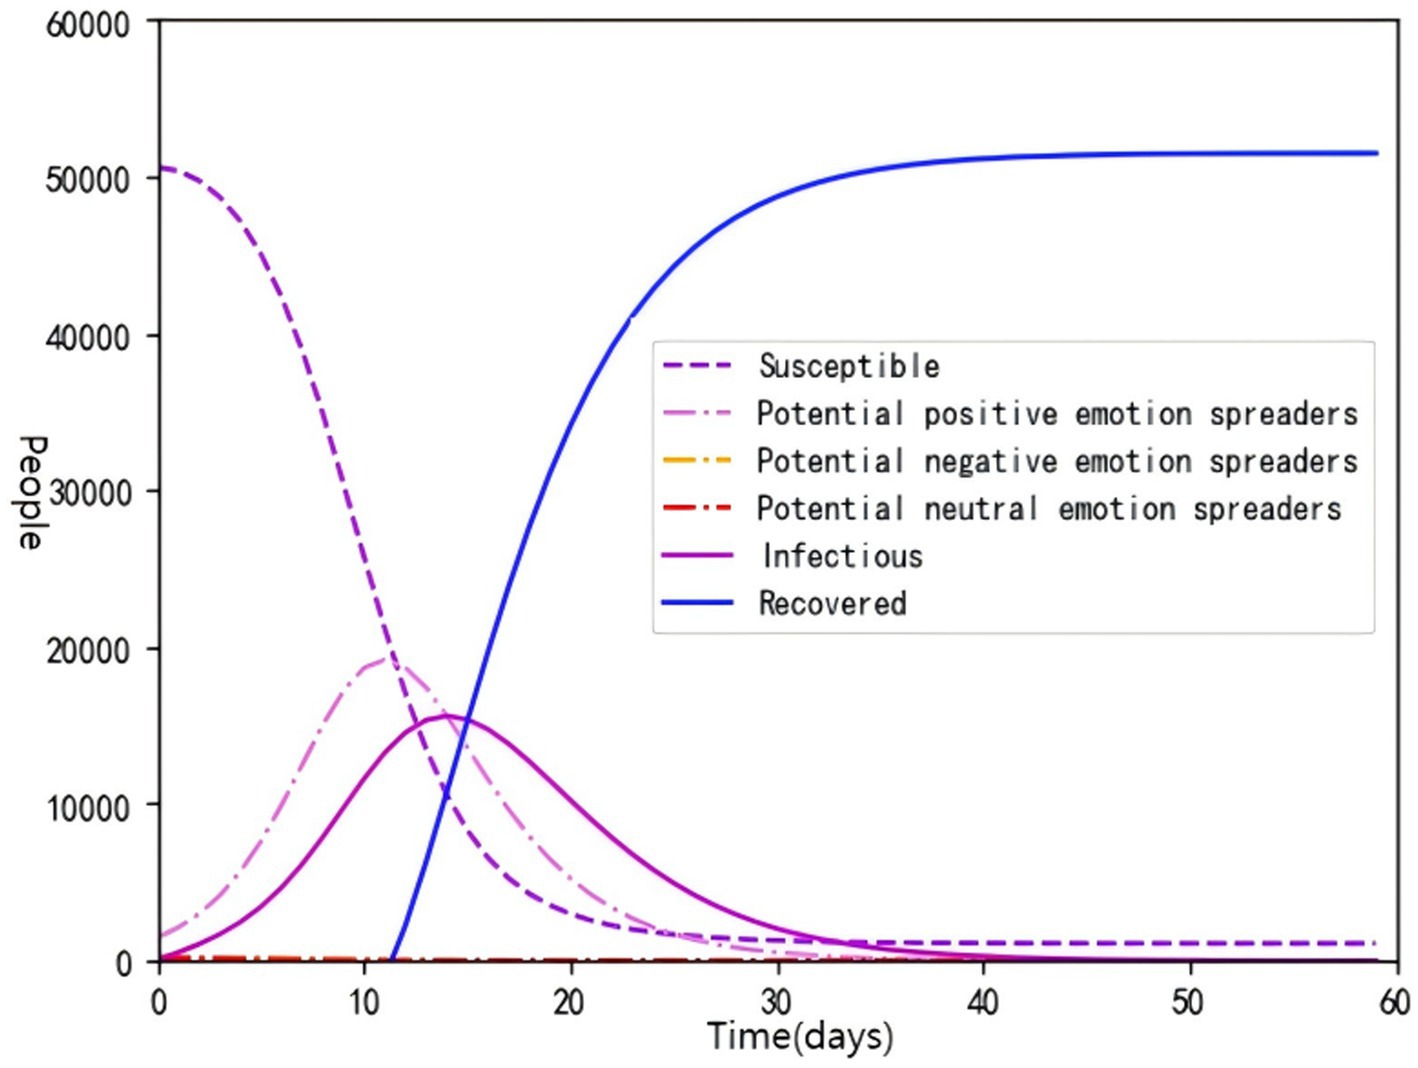
Figure 8. Emotion prediction diagram after increasing the number of people with positive emotions at BiliBili.
Tables 4, 5 illustrate that increasing the number of potential positive emotion spreaders amplifies the peak number of infected individuals. The rate of emotional contagion among these spreaders accelerates, reducing the time to reach the infection peak. The Area Under the Curve (AUC) for potential positive emotion spreaders rises significantly, while the AUCs for potential negative and neutral emotion spreaders decline sharply. Additionally, the conversion rate of potential negative emotion spreaders to the recovered state slows, and the duration for their complete subsidence shortens. These findings suggest that increasing the number of potential positive emotion spreaders fosters a positive dissemination environment and shortens the overall duration of emotional contagion.
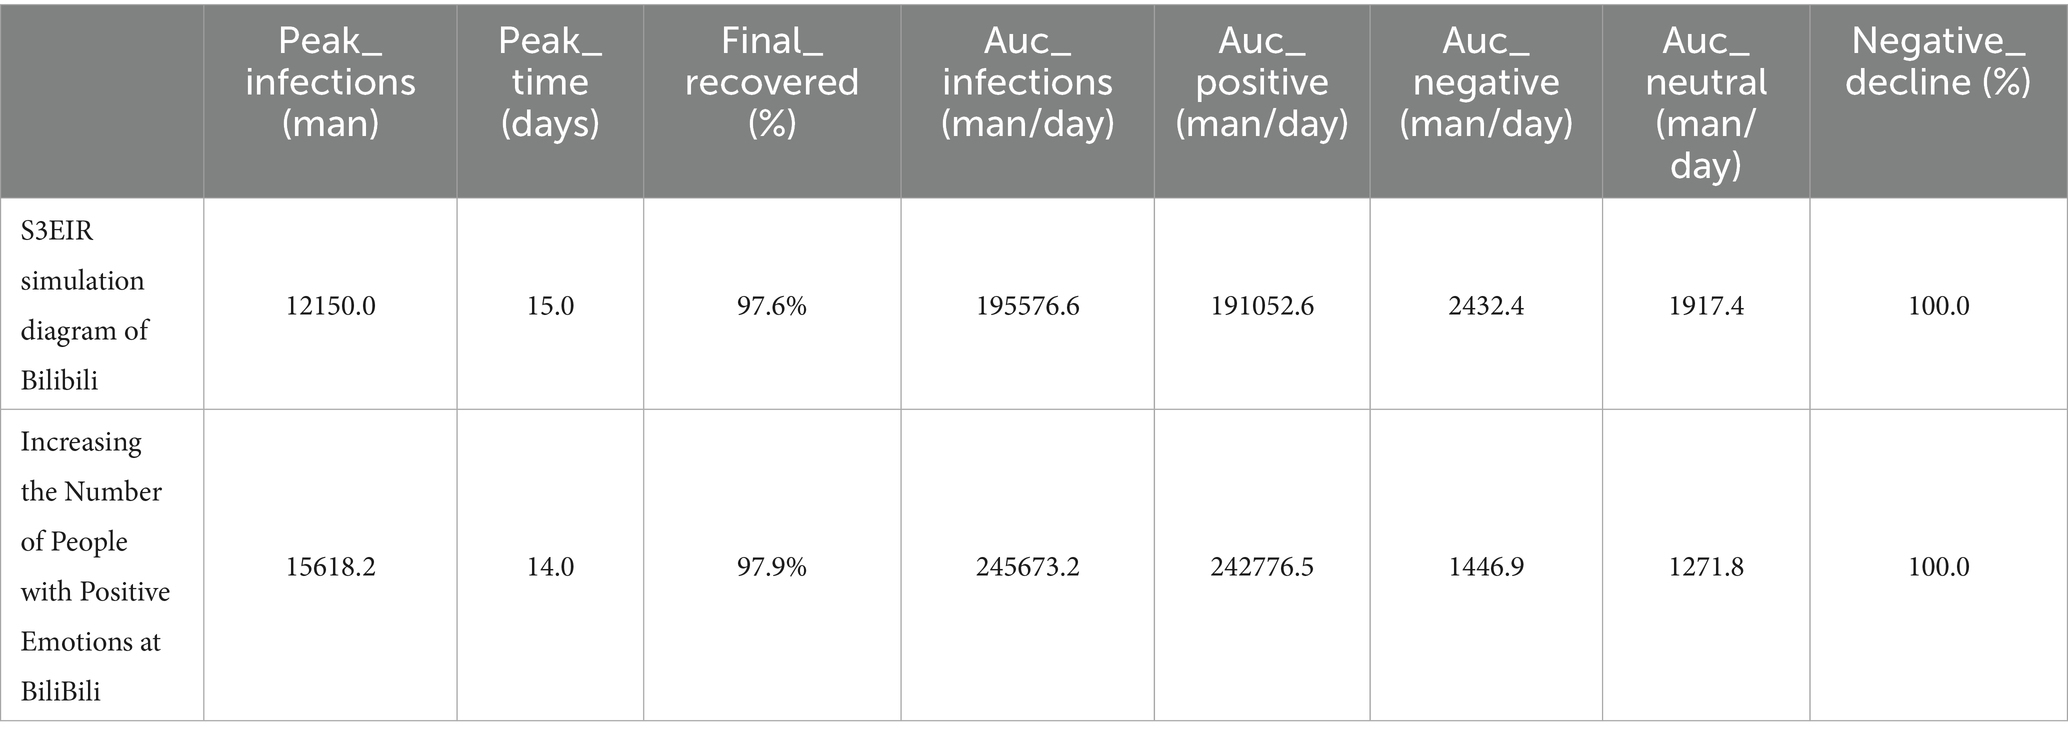
Table 4. BiliBili S3EIR simulation.
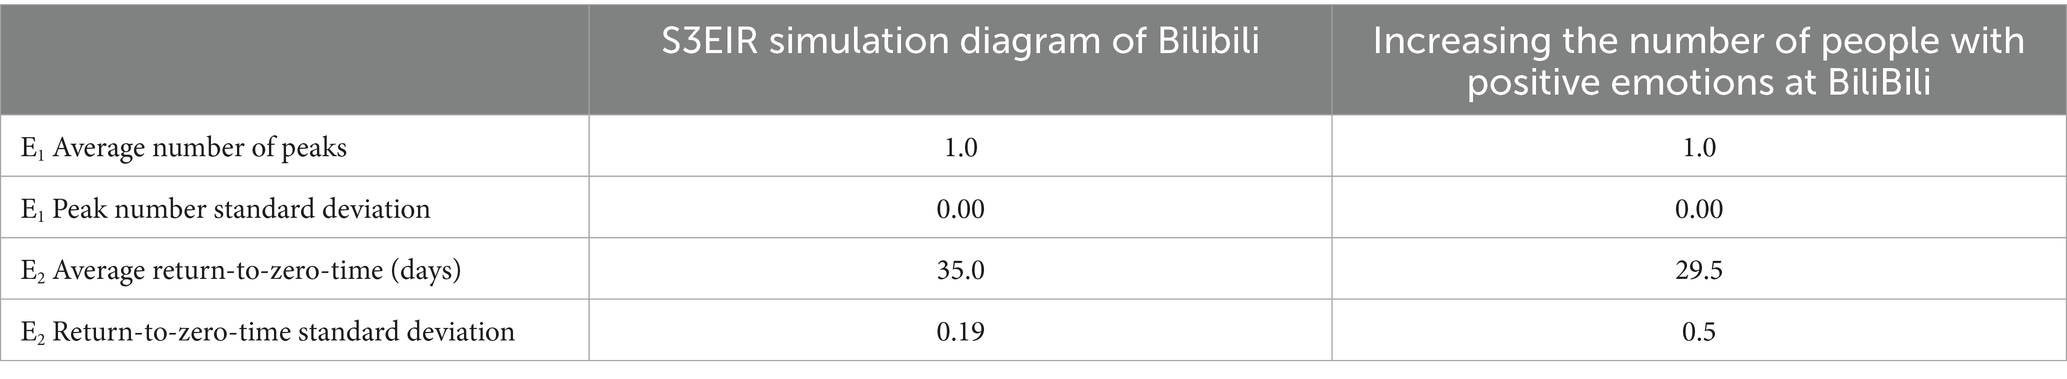
Table 5. Monte Carlo simulation results (500 runs) of BiliBili.
4.3.2 Research on TikTok simulation
4.3.2.1 Parameter settings and simulation results
TikTok received 10,713 comments on December 6, 7,102 people with positive emotions, 1,388 with negative emotions, and 2,223 with neutral emotions. The total number of people, N, was 86,723. After calculation, the parameters are N = 86,723, α1 = 0.66, α2 = 0.13, α3 = 0.21, γ = 0.25, β = 0.25, S = 76,010, E1 = 7,102, E2 = 1,388, E3 = 2,223, I = 50, R = 0.
As illustrated in Figure 9, within 60 days of the dissemination of public opinion, a subset of netizens demonstrated susceptibility to emotional influence. These individuals were neither affected by the video content nor by the emotions expressed in the comment section, maintaining a demeanor of relative calmness and rationality. Observational data reveal that by approximately the eighth day, a noticeable number of recovered individuals emerged. Over time, the population of recovered netizens increased progressively and eventually stabilized after reaching a certain point (see Figure 9).
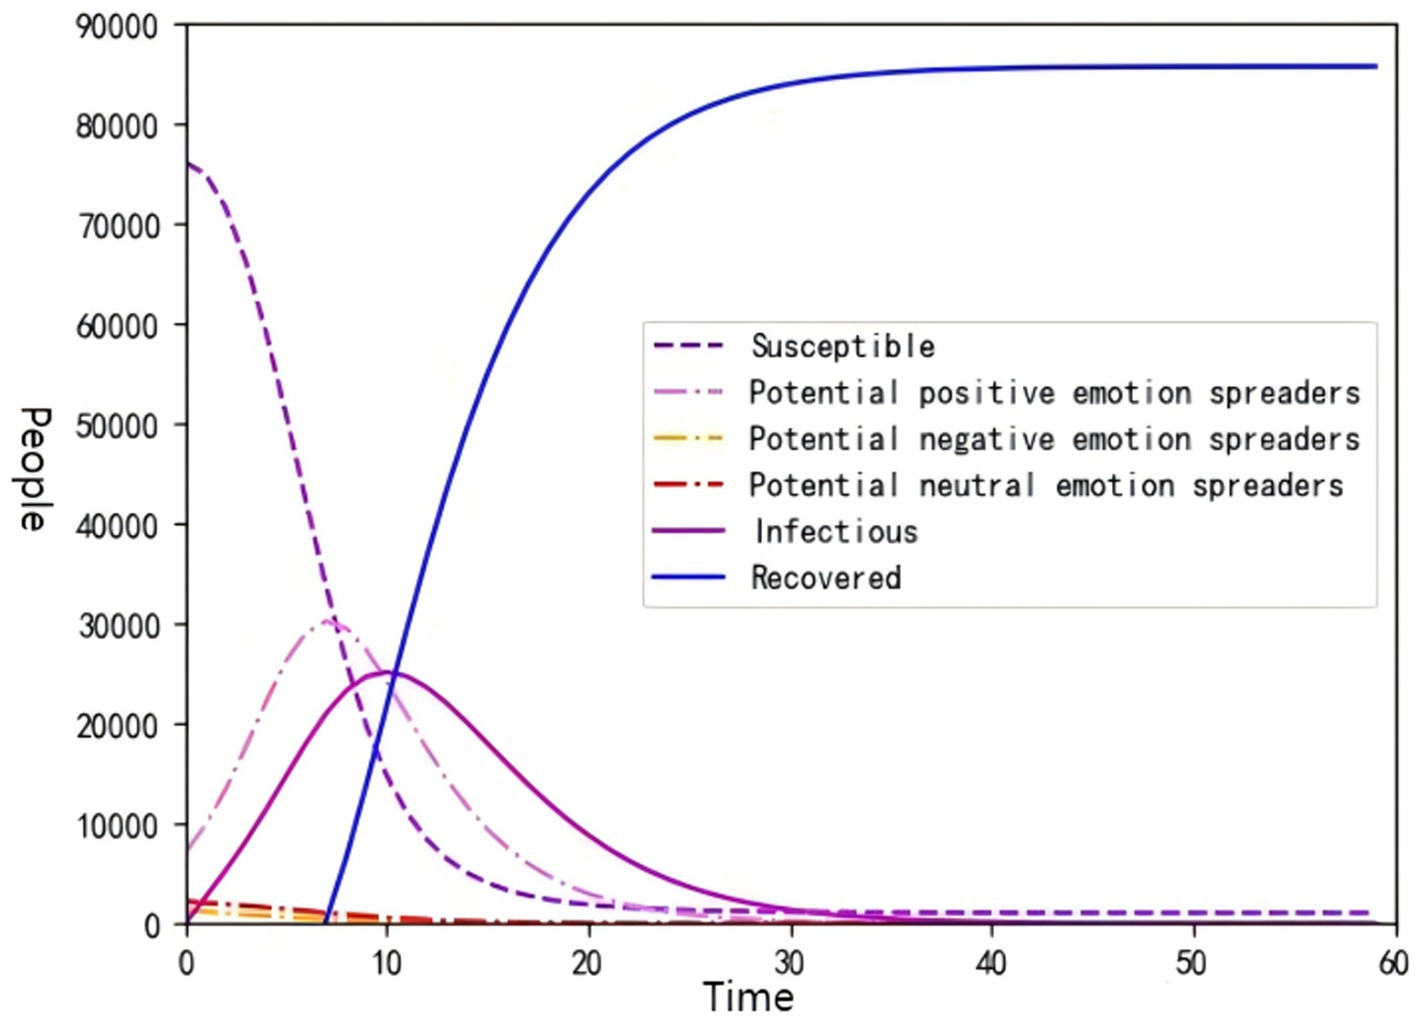
Figure 9. S3EIR simulation diagram of TikTok.
4.3.2.2 Mitigation of negative content propagation by recommendation algorithms
TikTok’s algorithmic recommendations put users in an information cocoon, making it difficult for users to access content outside of their interests. The platform can use this feature to isolate negative information, thereby reducing the dissemination of negative content and slowing the rate at which potential negative emotion spreaders become emotionally infected individuals. By promptly cutting off users’ access to negative information during the initial emergence of negative emotions, the exposure of users to such content can be minimized. Consequently, this approach reduces the initial number of individuals with negative emotions and decreases the rate at which potential negative emotion spreaders transition into emotionally infected individuals. Assume: N = 86,723, α1 = 0.66, α2 = 0.03, α3 = 0.21, γ = 0.25, β = 0.25, S = 77,010, E1 = 7,102, E2 = 388, E3 = 2,223, I = 50, R = 0.
Figure 10 and Table 6 demonstrate that the emergence time of recovered individuals in Figure 8 exhibits a delayed trend. Additionally, there is a noticeable increase in the peak number of potential positive emotion spreaders and infectious individuals, fostering a more positive communication atmosphere. Furthermore, the initial number of potential negative emotion spreaders has been reduced. This allows the platform to mitigate negative emotions efficiently. However, using algorithms to reduce the spread of negative emotions will ultimately cause more people to be infected by negative emotions (as shown in Table 7). In the Monte Carlo Simulation results of TikTok, the return-to-zero-time standard deviation for E2 is zero, and the parameter adjustment causes the system to enter a super-stable state.
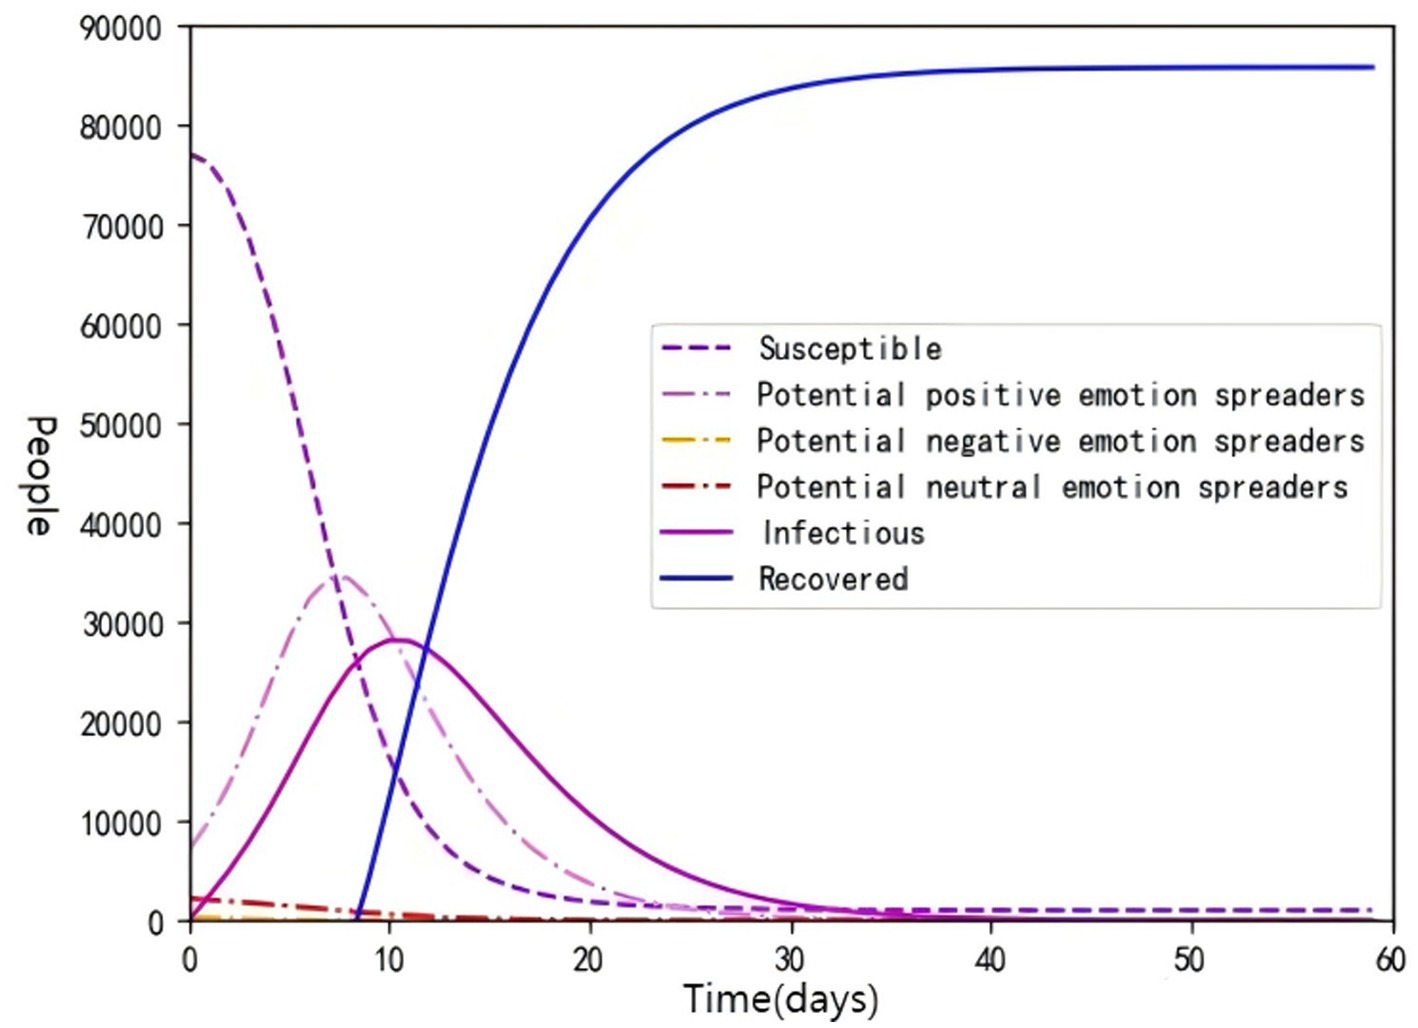
Figure 10. Emotion prediction diagram of negative content after TikTok reduces the algorithm.
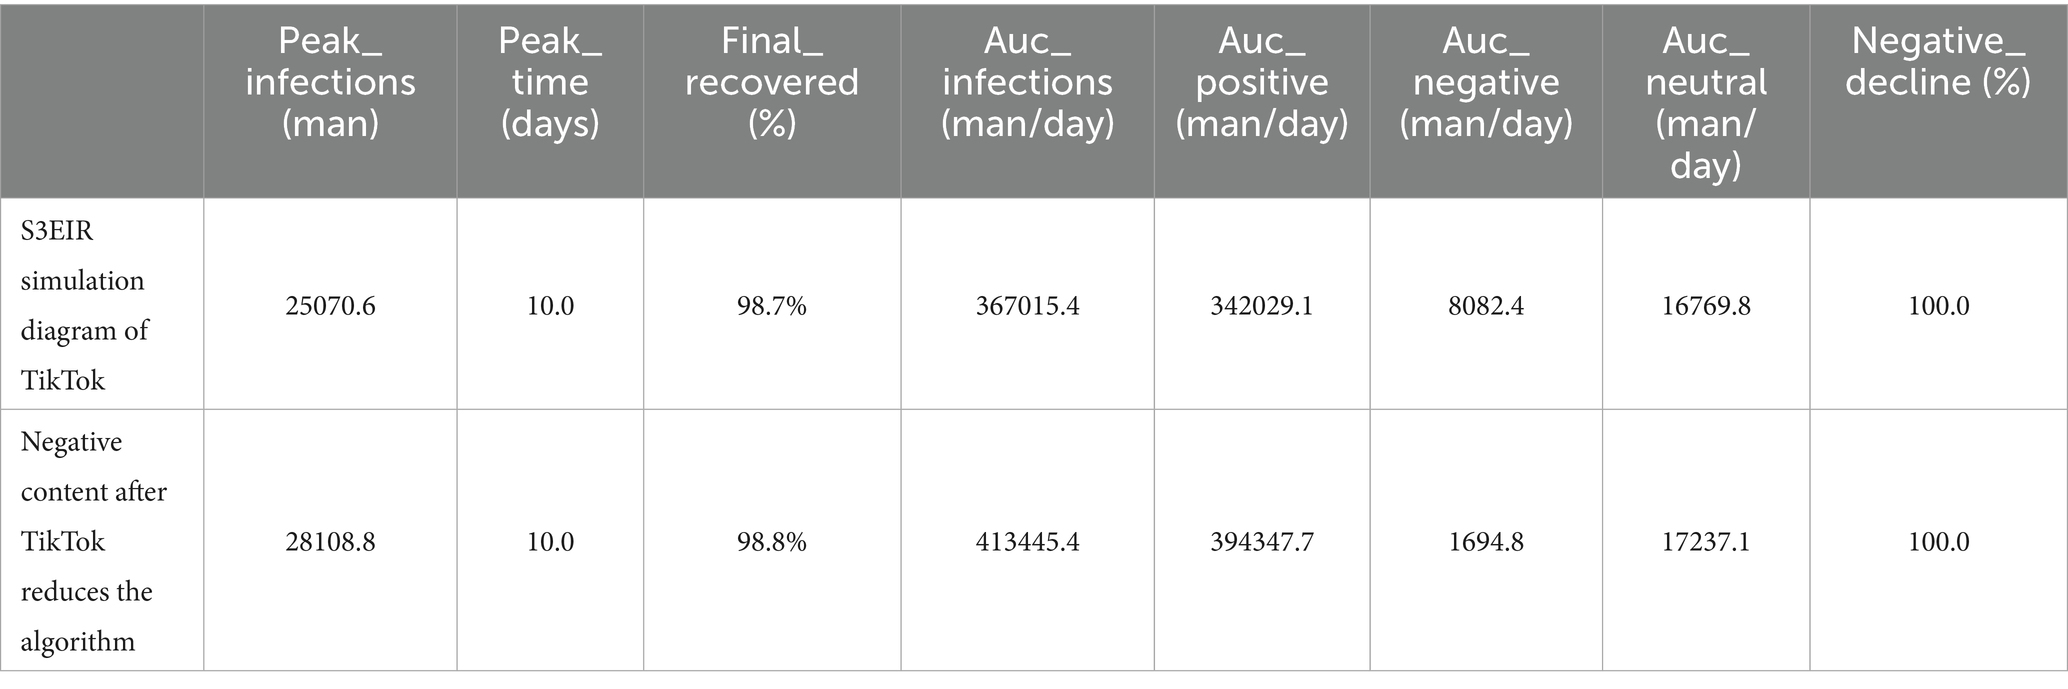
Table 6. TikTok S3EIR simulation.
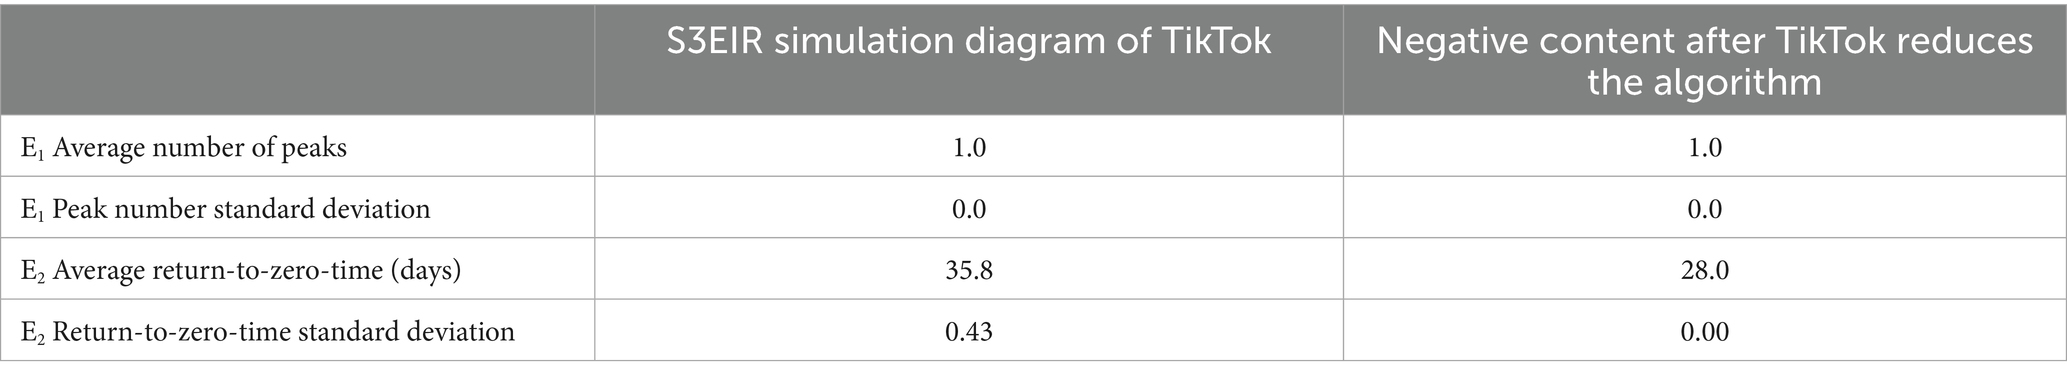
Table 7. Monte Carlo simulation results (500 runs) of TikTok.
4.3.3 Research on Toutiao simulation
4.3.3.1 Parameter settings and simulation results
On December 6, Toutiao received 3,793 comments, consisting of 2,317 positive, 629 negative, and 847 neutral emotional responses. The total population, N, was 30,340. Based on calculations, the parameters are as follows: N = 30,340, α1 = 0.61, α2 = 0.16, α3 = 0.22, γ = 0.25, β = 0.25, S = 26,497, E1 = 2,317, E2 = 629, E3 = 847, I = 50, R = 0. The number of potential negative and neutral emotion spreaders observed in this simulation deviates slightly from previous simulations. Unlike previous results, these two categories do not exhibit a peak but rather show a monotonous decreasing trend until reaching zero. Emotionally immune individuals on Toutiao emerged around the sixth day, earlier than observed on Bilibili and Douyin. While the number of emotionally immune individuals increased monotonically, it did not encompass the entire population (see Figure 11).
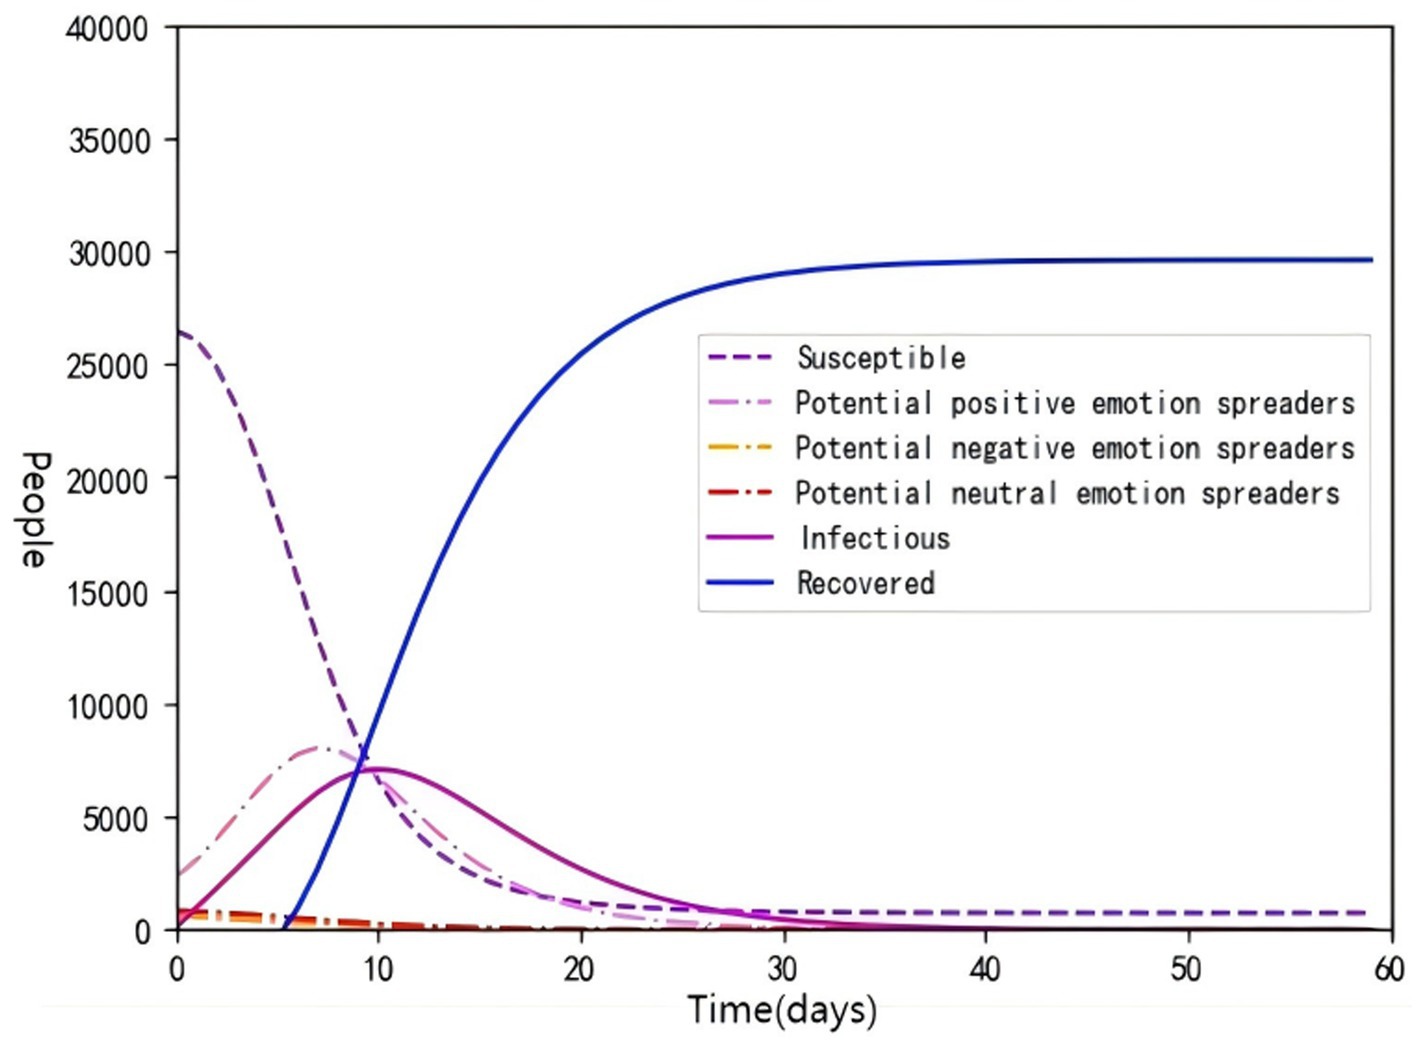
Figure 11. S3EIR simulation diagram of Toutiao.
4.3.3.2 Reduce the content of negative emotions published by self-media
The content on Toutiao primarily comprises User-Generated Content (UGC) and Professionally User-Generated Content (PUGC). The material produced by self-media creators exerts a significant influence on emotional guidance. Therefore, this study reduces the number of potential negative emotion spreaders. Assume: N = 30,340, α1 = 0.61, α2 = 0.16, α3 = 0.22, γ = 0.25, β = 0.25, S = 26,897, E1 = 2,317, E2 = 629, E3 = 447, I = 50, R = 0.
Individuals with negative emotions have been significantly reduced at an early stage. Within 10 days of continuous observation, these users have completely disappeared, and this disappearance occurred more rapidly than depicted in Figure 11. This demonstrates that platforms can effectively control the spread of negative emotion on social media by reducing the number of potential negative emotion spreaders (see Figure 12). Meanwhile, Tables 8, 9 show that the AUCs of potential positive emotion spreaders and potential negative emotion spreaders have increased. It can be seen that the cumulative spread intensity of negative emotions has become faster and negative emotions will remain longer.
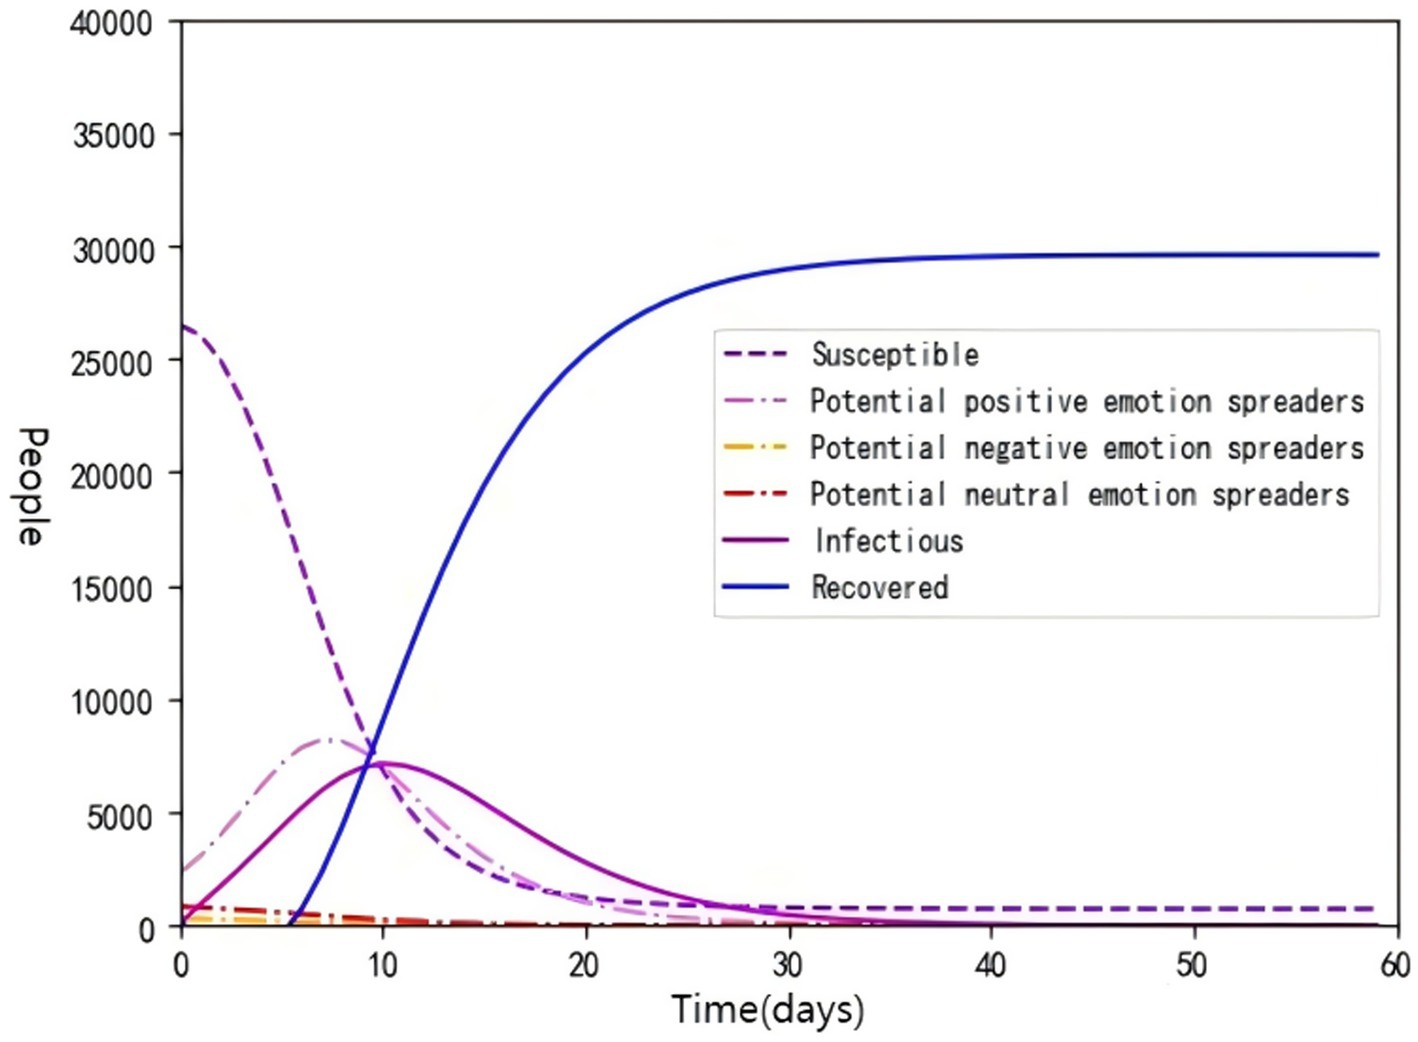
Figure 12. Emotion prediction diagram after Toutiao strengthens content review.
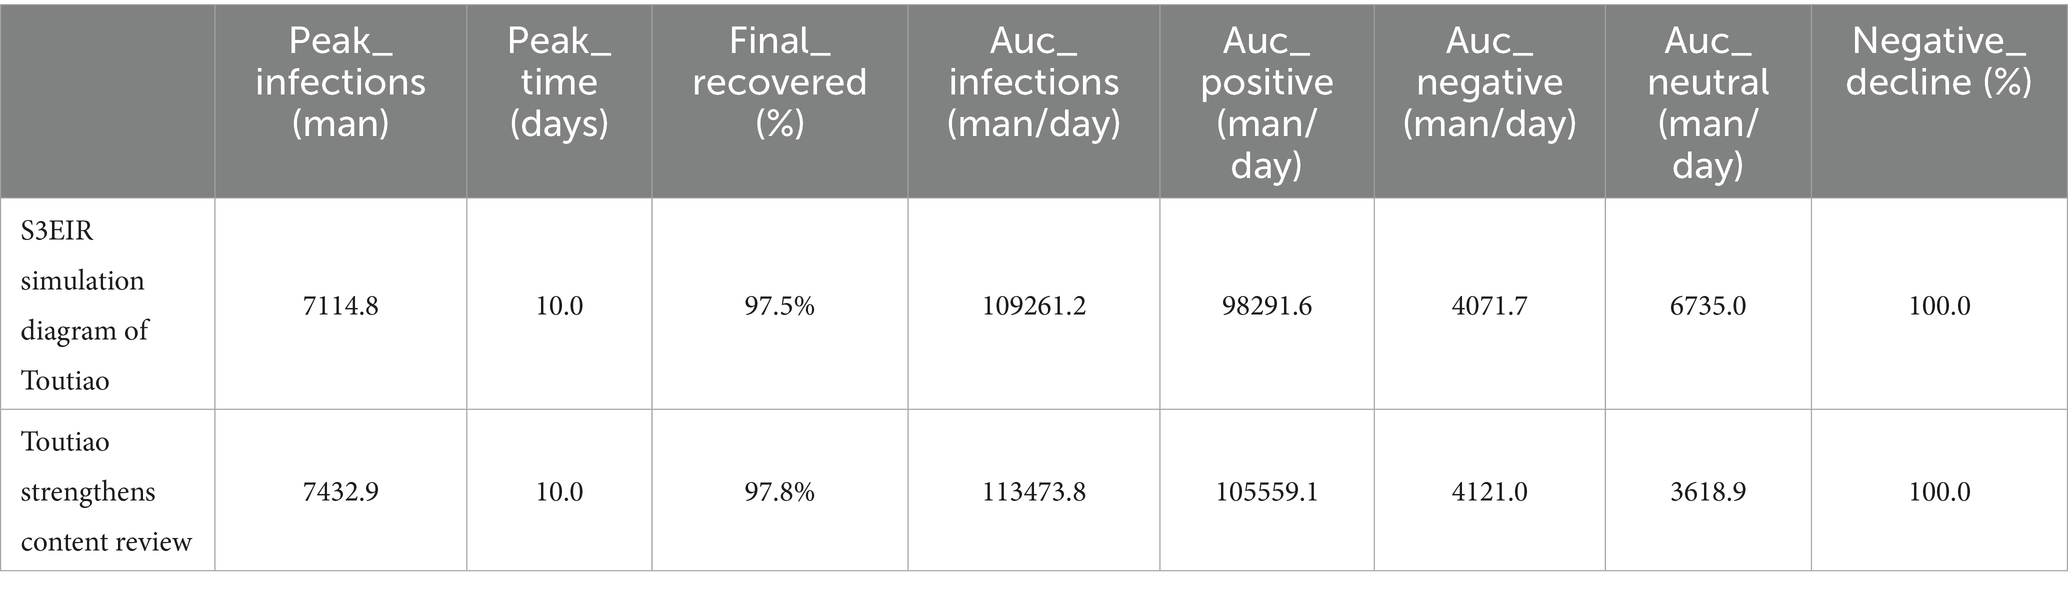
Table 8. Toutiao S3EIR simulation.
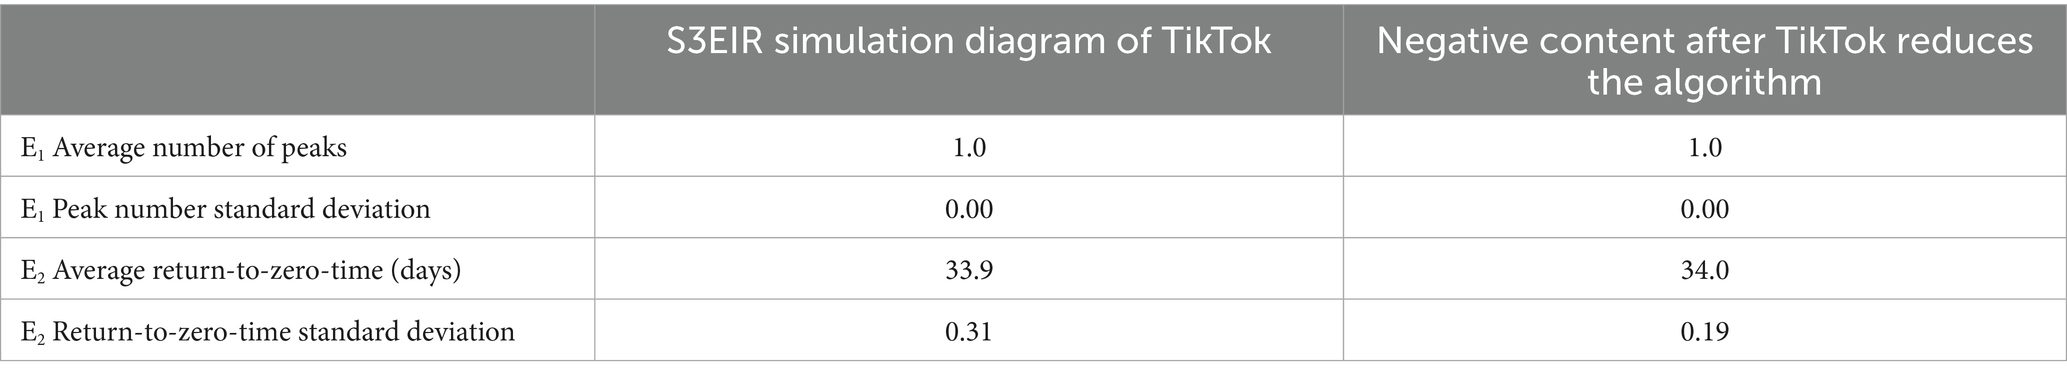
Table 9. Monte Carlo simulation results (500 runs) of Toutiao.
4.3.4 Research on Weibo simulation
4.3.4.1 Parameter settings and simulation results
On December 6, Weibo received 1,969 comments, which included 1,264 positive, 330 negative, and 375 neutral emotional responses. The total population, N was 15,220. Based on calculations, the parameters are as follows: N = 15,220, α1 = 0.64, α2 = 0.17, α3 = 0.19, γ = 0.25, β = 0.25, S = 13,201, E1 = 1,264, E2 = 330, E3 = 375, I = 50, R = 0 (see Figure 13).
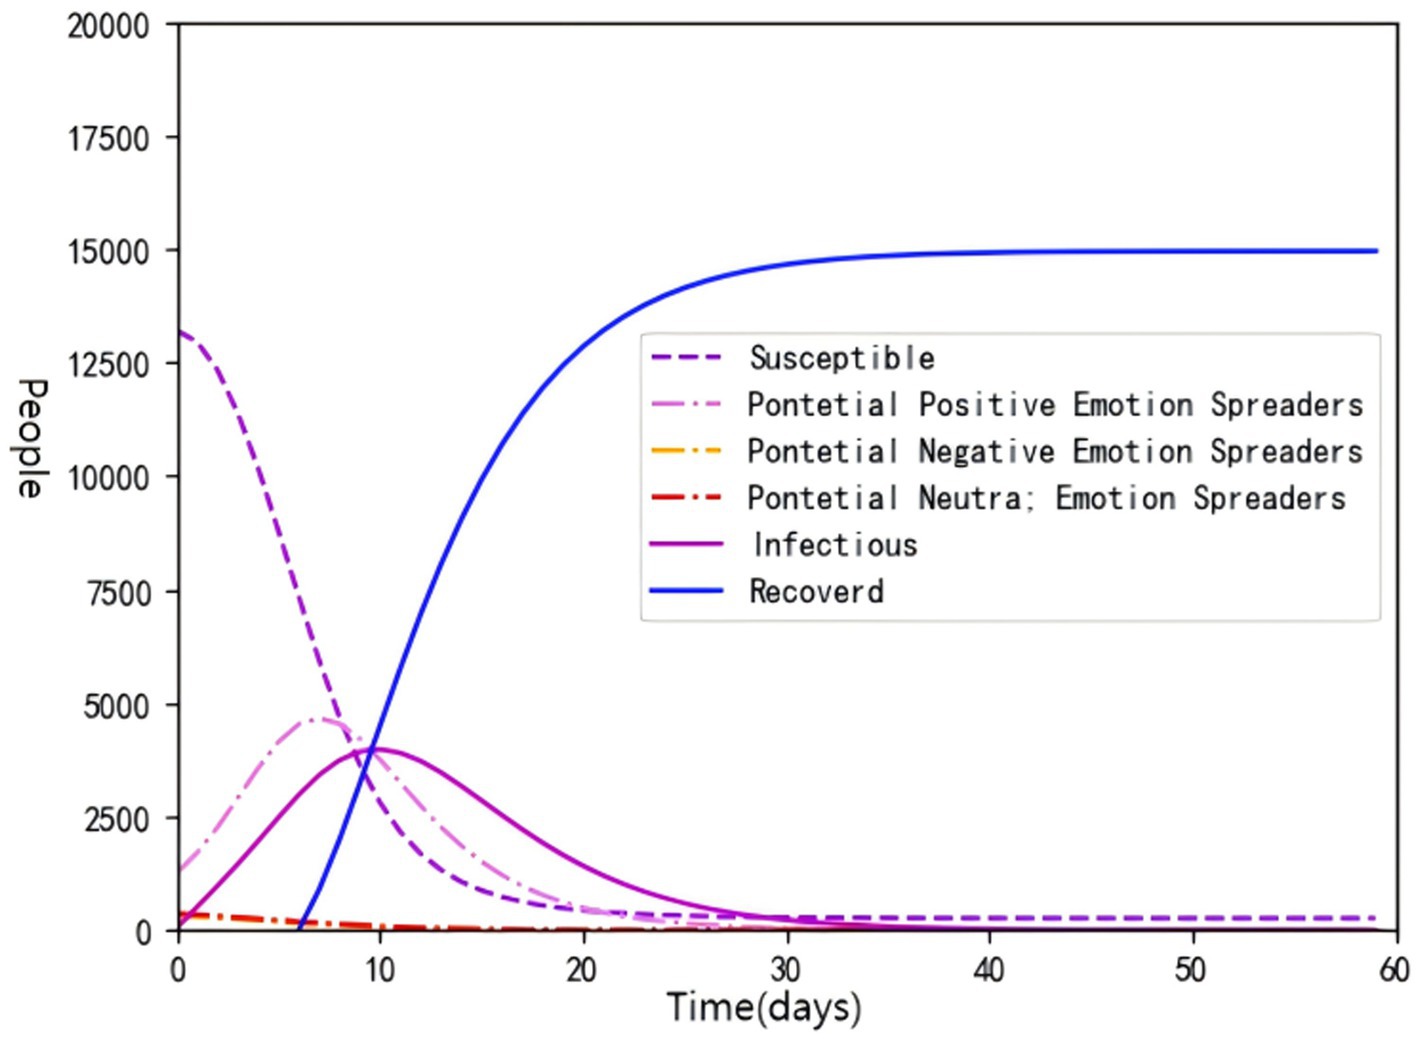
Figure 13. S3EIR simulation diagram of Weibo.
4.3.4.2 Deletion of negative comments
Weibo offers a comment selection feature, allowing bloggers to make comments public according to their preferences. Additionally, bloggers can manage comments by deleting negative ones or not publicizing negative comments. This measure effectively reduces the presence and spread of negative emotions in news events. As illustrated in Figure 14, this approach decreases the initial number of negative emotions and slows the rate at which potential negative emotion spreaders become emotionally infected individuals. Assume: N = 15,220, α1 = 0.64, α2 = 0.1, α3 = 0.19, γ = 0.25, β = 0.25, S = 13,431, E1 = 1,264, E2 = 100, E3 = 375, I = 50, R = 0 (see Figure 14).
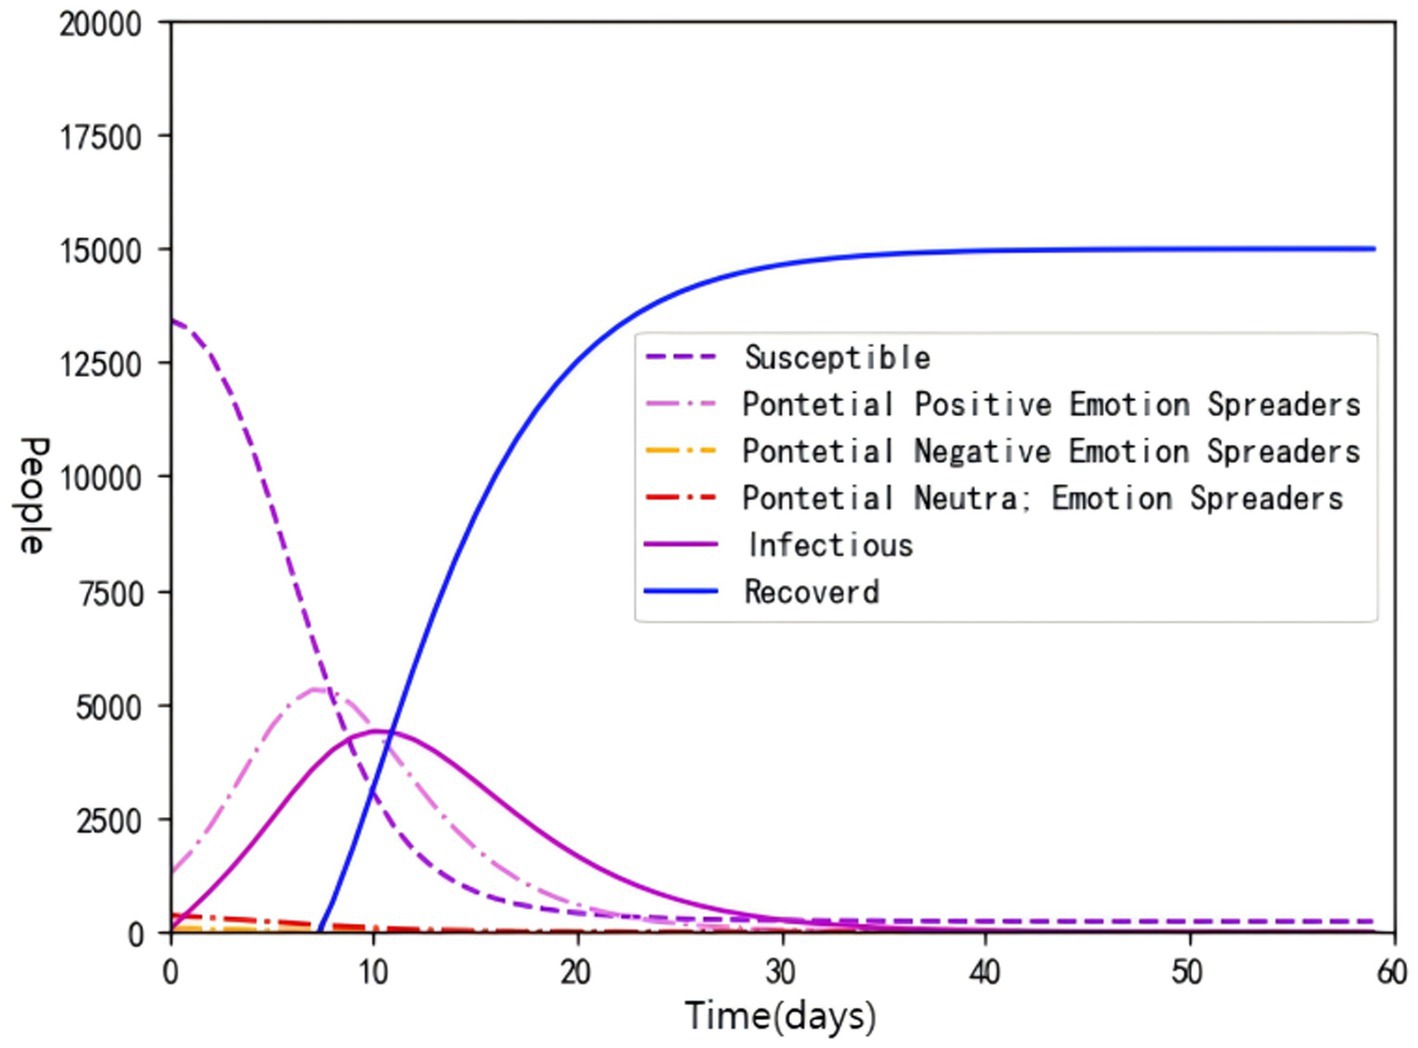
Figure 14. Emotion prediction diagram after Weibo opens comment selection.
Compared to Figure 12, the curve representing potential negative emotion spreaders in Figure 14 is markedly lower than that of potential neutral emotion spreaders. Notably, the negative emotion spreaders curve approaches zero more rapidly than the neutral emotion spreaders curve. This phenomenon can also be clearly seen in Table 10. The AUC of potential negative emotion spreaders drops significantly. The cumulative spread intensity of negative emotions has become lower, and negative emotions have quickly dissipated. The data suggest that the emotional judgments of netizens regarding news events are significantly influenced by pre-existing comments and opinions. Consequently, the strategic selection of comment content by bloggers can effectively mitigate negative emotions within the comment section, thereby reducing users’ exposure to negative sentiments and diminishing the overall prevalence of negative emotions among netizens. However, Table 11 shows that for E2, return-to-zero-time standard deviation increased from 0.00 to 0.41. It indicates that after the introduction of the algorithm for adjustment, the sensitivity of the results to initial conditions or random factors increased, reflecting the increased uncertainty of the effects of intervention measures in the real world.
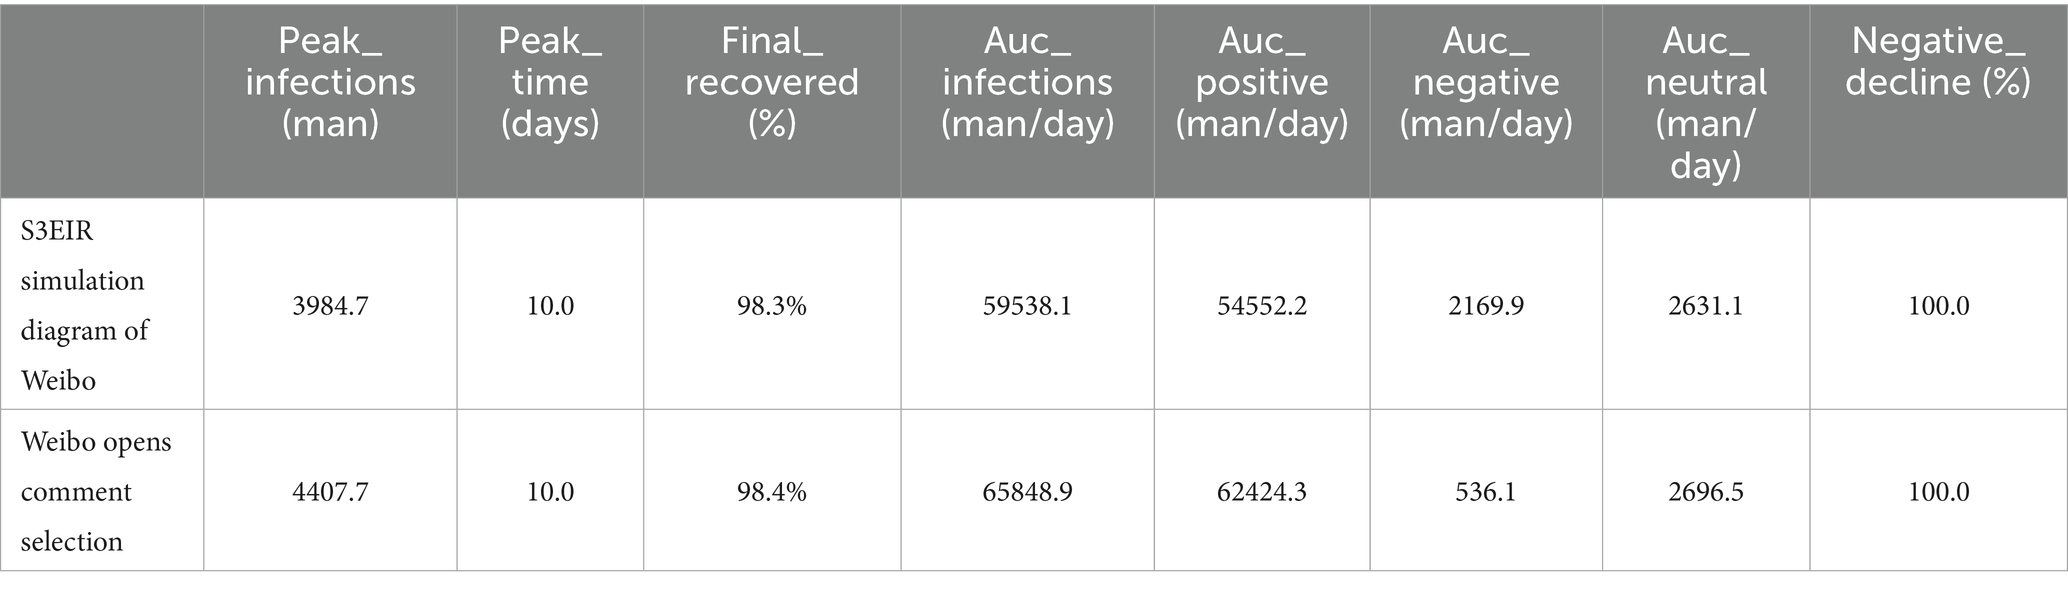
Table 10. Weibo S3EIR simulation.
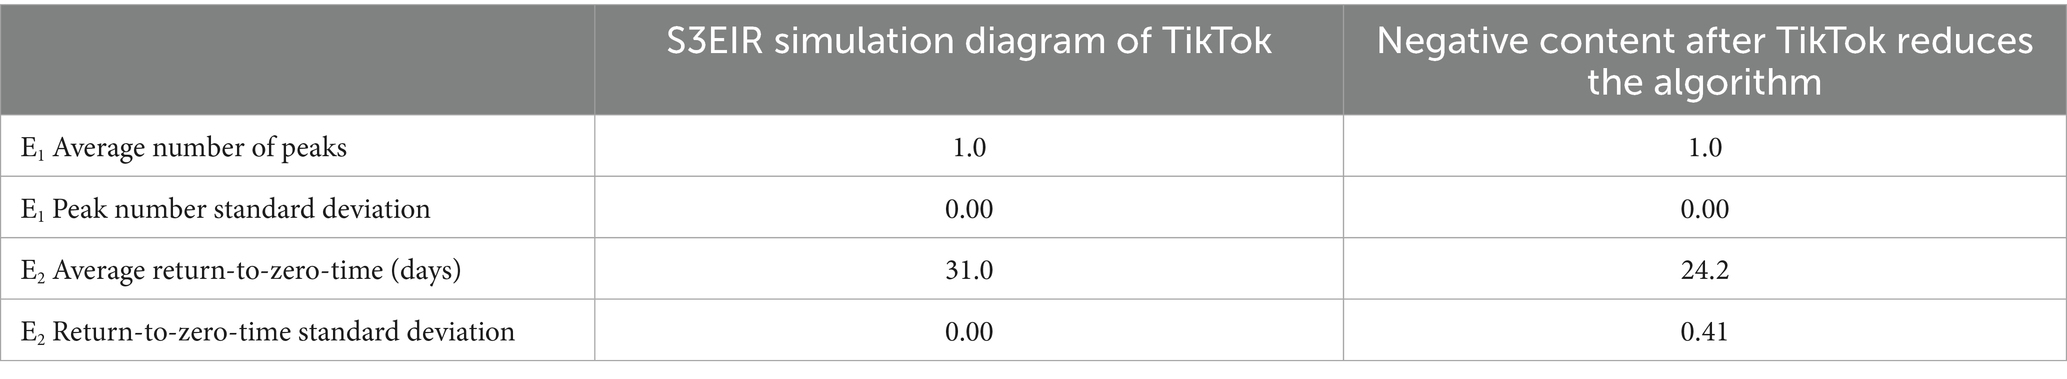
Table 11. Monte Carlo simulation results (500 runs) of Weibo.
5 Conclusion
After a hot event occurs on social media, individuals will have corresponding emotions. Individuals write online comments to reflect their emotions, and others generate their own emotions by reading these comments. Through continuous emotional contagion, individual emotions form group emotions. First, this study introduces40 the infectious disease model to construct the S3EIR model and studies the evolution law of information dissemination after introducing emotions. Second, this study verifies the feasibility of the S3EIR model. Currently, many social media platforms provide functions and conveniences to their respective user groups. This paper selects actual data from four social media platforms to verify the feasibility of the S3EIR model. Third, this paper verifies that in news, short video, and text social media platforms, the emotional contagion mechanism is caused by multiple factors, and at the same time, platforms can use these factors to control the direction of public opinion in the process of public opinion governance. In information dissemination, a certain emotion stimulates the generation of the same emotion, the same as the existing research results. However, this paper has limitations. On the one hand, cases need to be added to verify this model. This paper chooses to study a human trafficking event. The world continues to crack down on human trafficking, so the public emotions on this event are more similar than on other events. Future research will select cases with more diverse emotional expressions. On the other hand, more factors need to be introduced to improve the model. Future studies will consider the impact of AI technology on emotional contagion and information dissemination.
Data availability statement
The original contributions presented in the study are included in the article/Supplementary material, further inquiries can be directed to the corresponding authors.
Ethics statement
In accordance with local laws and institutional requirements, the data for this research is sourced from open data sources on social media and does not involve human privacy data, thus no ethical approval is required. Written informed consent was not required, for either participation in the study or for the publication of potentially/indirectly identifying information, in accordance with the local legislation and institutional requirements. The social media data was accessed and analyzed in accordance with the platform’s terms of use and all relevant institutional/national regulations.
Author contributions
HC: Writing – original draft, Writing – review & editing. JJ: Writing – original draft, Writing – review & editing. SS: Writing – review & editing. CZ: Writing – review & editing. MY: Writing – review & editing.
Funding
The author(s) declare that financial support was received for the research and/or publication of this article. The research was funded by Project of Beijing Cultural Industry and Publishing Media Research Base (Grant Number JD2022003), and the Opening Foundation of Center for Capital Commercial Industry (Grant Number JD-KFKT-2020-006). This research was a phased research outcome of Beijing Academy of Cultural Industry Development (Grant Number KYCPT202502).
Acknowledgments
We express our gratitude to the reviewers for their insightful and valuable feedback, which definitely enhanced the quality of this manuscript.
Conflict of interest
The authors declare that the research was conducted in the absence of any commercial or financial relationships that could be construed as a potential conflict of interest.
Generative AI statement
The author(s) declare that no Gen AI was used in the creation of this manuscript.
Publisher’s note
All claims expressed in this article are solely those of the authors and do not necessarily represent those of their affiliated organizations, or those of the publisher, the editors and the reviewers. Any product that may be evaluated in this article, or claim that may be made by its manufacturer, is not guaranteed or endorsed by the publisher.
Supplementary material
The Supplementary material for this article can be found online at: https://www.frontiersin.org/articles/10.3389/fcomm.2025.1582974/full#supplementary-material
Footnotes
2. ^https://www.toutiao.com/?wid=1725086316320
3. ^https://www.douyin.com/?recommend=1
4. ^https://weibo.com/newlogin?tabtype=weibo&gid=102803&openLoginLayer=0&url=https%3A%2F%2Fweibo.com%2F
References
Aron, J. L., and Schwartz, I. B. (1984). Seasonality and period-doubling bifurcations in an epidemic model. J. Theor. Biol. 110, 665–679. doi: 10.1016/s0022-5193(84)80150-2
Bandhakavi, A., Wiratunga, N., Padmanabhan, D., and Massie, S. (2017). Lexicon based feature extraction for emotion text classification. Pattern Recogn. Lett. 93, 133–142. doi: 10.1016/j.patrec.2016.12.009
Coviello, L., Fowler, J. H., and Franceschetti, M. (2014). Words on the web: noninvasive detection of emotional contagion in online social networks. Proc. IEEE 102, 1911–1921. doi: 10.1109/JPROC.2014.2366052
Cui, S., and Zhu, X. (2024). The information propagation mechanism of individual heterogeneous adoption behavior under the heterogeneous network. Front. Phys. 12:1404464. doi: 10.3389/fphy.2024.1404464
Curci, A., and Bellelli, G. (2004). Cognitive and social consequences of exposure to emotional narratives: two studies on secondary social sharing of emotions. Cogn. Emot. 18, 881–900. doi: 10.1080/02699930341000347
Fan, C., Song, H., and Ding, G. (2017). Research on an improved SEIR network rumor propagation model. J. Intell. 36, 86–91. doi: 10.3969/j.issn.1002-1965.2017.03.015
Fan, R., Xu, K., and Zhao, J. (2018). An agent-based model for emotion contagion and competition in online social media. Physica A Stat. Mech. Appl. 495, 245–259. doi: 10.1016/j.physa.2017.12.086
Featherstone, J. D., Ruiz, J. B., Barnett, G. A., and Millam, B. J. (2020). Exploring childhood vaccination themes and public opinions on twitter: a semantic network analysis. Telematics Inform. 54:101474:101474. doi: 10.1016/j.tele.2020.101474
Ferrara, E., and Yang, Z. (2015). Measuring emotional contagion in social media. PloS One 10:e0142390. doi: 10.1371/journal.pone.0142390
Goffman, W., and Newill, V. (1964). Generalization of epidemic theory: an application to the transmission of ideas. Nature 204, 225–228. doi: 10.1038/204225a0
Hatfield, E., Cacioppo, J. T., and Rapson, R. L. (1993). Emotional contagion. Curr. Dir. Psychol. Sci. 2, 96–100. doi: 10.1017/cbo9781139174138
Herrando, C., and Constantinides, E. (2021). Emotional contagion: a brief overview and future directions. Front. Psychol. 12:712606. doi: 10.3389/fpsyg.2021.712606
Hong, J., and Chang, J. (2023). Between intention and Unintention: a study on the algorithmic identity construction of Bilibili youth. Shanghai Journalism Rev. 12, 39–52. doi: 10.16057/j.cnki.31-1171/g2.2023.12.003
Kai, Q., and Xin, L. (2022). Research on propagation path about netizens’ emotions of government affairs short video based on S3EIR model. Inf. Stud. Theory Appl. 45, 164–168. doi: 10.16353/j.cnki.1000-7490.2022.10.021
Kang, Y., Wang, Y., Zhang, D., and Zhou, L. (2017). The public’s opinions on a new school meals policy for childhood obesity prevention in the U.S.: a social media analytics approach. Int. J. Med. Inform. 103, 83–88. doi: 10.1016/j.ijmedinf.2017.04.013
Kermack, W. O., and McKendrick, A. G. (1927). A contribution to the mathematical theory of epidemics. Proc. R. Soc. Lond. A Math. Phys. Sci. 115, 700–721. doi: 10.1098/rspa.1927.0118
Kramer, A. D., Guillory, J. E., and Hancock, J. T. (2014). Experimental evidence of massive-scale emotional contagion through social networks. Proc. Natl. Acad. Sci. USA 111, 8788–8790. doi: 10.1073/pnas.1320040111
Li, Q., Du, Y., Li, Z., Hu, J., Hu, R., Lv, B., et al. (2021). HK–SEIR model of public opinion evolution based on communication factors. Eng. Appl. Artif. Intell. 100:104192. doi: 10.1016/j.engappai.2021.104192
Liu, X., Li, T., and Tian, M. (2018). Rumor spreading of a SEIR model in complex social networks with hesitating mechanism. Adv. Differ. Equations 2018, 1–24. doi: 10.1186/s13662-018-1852-z
Nie, Q., Liu, Y., Zhang, D., and Jiang, H. (2021). Dynamical SEIR model with information entropy using COVID-19 as a case study. IEEE Trans. Comput. Soc. Syst. 8, 946–954. doi: 10.1109/TCSS.2020.3046712
Qing, H. (2021). The disintegration and reconstruction of news seriousness in the era of short videos. News Tribune 1, 37–40. doi: 10.19425/j.cnki.cn15-1019/g2.2021.01.010
Rong, Q., Junming, Z., and Xuefei, X. (2023). Research on the influence of opinion leaders on the dynamics of public opinion communication. J. BJ Elect. Sci. Tech. Ins. 4, 42–52. doi: 10.3969/j.issn.1672-464X.2023.04.006
Sciara, S., Villani, D., Di Natale, A. F., and Regalia, C. (2021). Gratitude and social media: a pilot experiment on the benefits of exposure to others’ grateful interactions on Facebook. Front. Psychol. 12:1402. doi: 10.3389/fpsyg.2021.667052
Shi, R., Hou, X., and Liu, C. (2022). Model of negative emotional information communication among netizens under corporate negative events. Math. Probl. Eng. 2022, 1–10. doi: 10.1155/2022/3527980
Tan, Y. (2021). On the operating mechanism and improvement path of Weibo hot search. Media 24, 51–53. doi: 10.3969/j.issn.1009-9263.2021.24.018
Wang, Y., Xu, S., Li, C., Ai, S., Zhang, W., Zhen, L., et al. (2020). Classification model based on support vector machine for Chinese extremely short text. Appl. Res. Comput. 37, 347–350. doi: 10.19734/j.issn.1001-3695.2018.06.0514
Xiang, N., Zhou, Z., and Pan, Z. (2018). Using SIR model to simulate emotion contagion in dynamic crowd aggregation process. Int. J. Perform. Eng. 14:134. doi: 10.23940/ijpe.18.01.p14.134143
Xiao, Y., Wang, Z., Li, Q., and Li, T. (2019). Dynamic model of information diffusion based on multidimensional complex network space and social game. Physica A Stat. Mech. Appl. 521, 578–590. doi: 10.1016/j.physa.2019.01.117
Xu, L., Lin, H., and Zhao, J. (2008). Construction and analysis of emotional corpus. J. Chin. Inform. Process. 22, 116–122. doi: 10.3969/j.issn.1003-0077.2008.01.019
Xue, R., and Xue, C. (2023). Research on automatic classification model of Chinese classics based on support vector machine. In 2023 IEEE 6th international conference on knowledge innovation and invention (ICKII) 2023: 551–554. IEEE. doi: 10.1109/ickii58656.2023.10332755
Xuehe, W., Shasha, S., and Jianchi, D. (2019). Social emotion analysis model and method of hot events based on big text data. Plateau Sci. Res. 2, 80–87. doi: 10.16249/j.cnki.2096-4617.2019.02.012
Yan, S., and Yan, L. (2012). On the social communication of personal emotions in the era of group communication. Modern Commun. (J. Univ. China) 12, 10–15. doi: 10.3969/j.issn.1007-8770.2012.12.004
Zeng, J., and Wang, Y. (2023). Research on the behavior of young user groups on Xinhua news agency Bilibili. Youth Journalist 22, 67–70. doi: 10.15997/j.cnki.qnjz.2023.22.008
Zhang, Z., Li, X., and Gan, C. (2021). Identifying influential nodes in social networks via community structure and influence distribution difference. Digit Commun Netw 7, 131–139. doi: 10.1016/j.dcan.2020.04.011
Zhang, M., Qin, S., and Zhu, X. (2021). Information diffusion under public crisis in BA scale-free network based on SEIR model—taking COVID-19 as an example. Physica A Stat. Mech. Appl. 571:125848:125848. doi: 10.1016/j.physa.2021.125848
Zhao, D., Sun, J., Tan, Y., Wu, J., and Dou, Y. (2018). An extended SEIR model considering homepage effect for the information propagation of online social networks. Physica A Stat. Mech. Appl. 512, 1019–1031. doi: 10.1016/j.physa.2018.08.006
Zhu, H. (2021). Audience and market analysis of news and information apps——taking 'Toutiao' as an example. West China Broadcasting TV 19, 36–38. doi: 10.3969/j.issn.1006-5628.2021.19.012
Keywords: S3EIR model, emotional contagion, propagation dynamics, information dissemination, social media platform, sentiment analysis
Citation: Chen H, Jin J, Sun S, Zhang C and Yu M (2025) Research on propagation dynamics of emotional contagion using S3EIR model based on multiple social media platforms. Front. Commun. 10:1582974. doi: 10.3389/fcomm.2025.1582974
Edited by:
Marcos César da Rocha Seruffo, Federal University of Pará, BrazilReviewed by:
Adriano Madureira Dos Santos, Federal University of Pará, BrazilDouglas Almeida Vidal, Federal University of Pará, Brazil
Copyright © 2025 Chen, Jin, Sun, Zhang and Yu. This is an open-access article distributed under the terms of the Creative Commons Attribution License (CC BY). The use, distribution or reproduction in other forums is permitted, provided the original author(s) and the copyright owner(s) are credited and that the original publication in this journal is cited, in accordance with accepted academic practice. No use, distribution or reproduction is permitted which does not comply with these terms.
*Correspondence: Jiamin Jin, cGVhbnV0NDU2QHllYWgubmV0; Steven Sun, c3N1bjQ3QHVjbWVyY2VkLmVkdQ==