 Tian Zhifu
 Abdelhamid Jebbouri
- College of Tourism Management, Inner Mongolia University of Finance and Economics, Hohhot, China
Introduction: Limited research has examined how government policies, technology integration, and perceived value simultaneously influence destination loyalty through experiential pathways. This study investigates their integrated effects on international tourists’ revisit intentions to China, with satisfaction and experience as mediators.
Methods: Data were collected from 508 international tourists at three Beijing heritage attractions using systematic sampling through a self-administered questionnaire. Structural equation modeling was used to test the hypothesized relationships.
Results: All hypotheses received strong empirical support, with the model explaining substantial variance in tourist outcomes. Technology integration emerged as the primary driver of revisit intentions, while government policies and perceived value provided significant complementary effects. Tourist satisfaction and experience fully mediated the relationships between all antecedents and revisit intentions.
Discussion/conclusions: Findings offer actionable insights for destination managers, policymakers, and technology developers. Organizations should prioritize digital infrastructure investments while fostering collaborative policy frameworks that enhance tourist experiences. The mediating role of satisfaction and experience highlights the importance of holistic service delivery across multiple touchpoints. This research bridges tourism studies, public policy, and technology management by providing the first integrated framework examining macro-level drivers of destination loyalty through experiential pathways, with applications extending beyond tourism to other experience-driven industries and emerging market destinations.
1 Introduction
In today’s competitive tourism market, fostering tourist loyalty and encouraging repeat visitation are key priorities for destination managers and policymakers (Morrison, 2022). Revisit intention (RI) signifies destination success in delivering memorable experiences and underpins long-term economic sustainability by reducing marketing costs and leveraging positive word-of-mouth (Kozak and Rimmington, 2000; Rahman et al., 2023). Understanding the mechanisms that drive tourists’ return decisions has become increasingly critical as destinations compete for market share in an evolving global landscape, particularly within culturally rich environments such as World Heritage Sites.
While extensive research has explored various antecedents of revisit intention, including destination image, service quality, and motivation (Baloglu and McCleary, 1999; Davras and Özperçin, 2023; Maghrifani et al., 2022), the existing literature reveals several critical gaps in understanding how macro-level factors comprehensively influence tourist behavior. The literature acknowledges the profound impact of governmental policies (Hall, 2008; Jamal and Budke, 2020) and technological advancements (Buhalis and Law, 2008; Gretzel et al., 2020) on tourism, but there is a significant lack of integrated empirical frameworks. Research often examines dyadic relationships but rarely investigates how perceived government policies (PGP), perceived technology integration (PTI), and perceived value (PV) collectively operate as distinct yet interconnected drivers of tourist satisfaction (TS), experience (TE), and ultimately, revisit intentions (RI). Systematic reviews reveal that smart tourism studies are dominated by technology-behavior perspectives, with government policy remaining an understudied dimension (Ye et al., 2024). Moreover, empirical studies examining technology effects often use domestic samples, limiting generalizability to international visitors (Pai et al., 2021).
Drawing from the Stimulus-Organism-Response (S-O-R) framework (Mehrabian and Russell, 1974), which recognizes that external stimuli influence internal evaluative processes that ultimately drive behavioral responses, we conceptualize PGP, PTI, and PV as environmental stimuli (S). These stimuli shape tourists’ cognitive and affective evaluations (O - TS and TE), which in turn determine their behavioral response (R - RI). Government policies encompassing visa regulations, infrastructure development, safety protocols, and promotional campaigns directly impact destination accessibility, cost, quality, and perceived security at heritage sites and beyond (Khan et al., 2020; Tang, 2017; Zhang and Ju, 2021). Simultaneously, digital technology integration, including mobile payment systems, smart tourism infrastructure, and comprehensive digital platforms, fundamentally reshapes how tourists plan, navigate, experience, and evaluate destinations, including their engagement with heritage attractions (Pencarelli, 2020; Xiang and Fesenmaier, 2017). These macro-level factors operate through tourists’ PV assessments, defined as consumers’ overall evaluation of utility based on perceptions of benefits received versus costs incurred (Tanrikulu, 2021; Zeithaml, 1988).
China presents a compelling case study for this integrated examination, given its distinctive policy-technology environment that international tourists must navigate, especially when visiting its numerous and diverse World Heritage Sites. The country’s pronounced government influence on tourism development, combined with exceptionally high technological adoption, particularly in mobile services and digital payment systems, creates conditions unlike any other major destination (Leung et al., 2019). The country has recently issued payment and smart tourism directives requiring key attractions and hotels to accept foreign bank cards and retain cash windows, while implementing multi-ministry plans to accelerate smart-tourism deployment (Chen et al., 2024). This unique context provides an ideal setting to examine how integrated macro-level enablers influence international tourist behavior, particularly in shaping the unique experiential aspects of heritage tourism.
Therefore, this study aims to develop and empirically test an integrated model investigating the interconnected roles of PGP, PTI, and PV in driving international tourist RI to China’s World Heritage Sites. This research contributes by: (1) providing empirical evidence for direct and mediated pathways from macro-level enablers to behavioral intentions in heritage tourism, (2) demonstrating the differential roles of TS and TE as mediating mechanisms, and (3) offering practical insights for destination management in technologically advanced, policy-influenced tourism environments.
Based on the identified research gaps and theoretical framework, this study seeks to answer the following research questions:
RQ1: How do PGP, PTI, and PV directly influence international tourists’ RI to China’s World Heritage Sites?
RQ2: How do PGP, PTI, and PV indirectly influence international tourists’ RI through TS and TE?
RQ3: What are the differential mediating roles of TS and TE in the relationships between PGP, PTI, PV, and international tourists’ RI?
2 Review of literature
2.1 Tourist revisit intention
The intention of tourists to revisit a destination is a critical indicator of its success and long-term viability (Baghirov et al., 2023; Rasoolimanesh et al., 2025). Representing a deeper form of destination loyalty than first-time visits (Oppermann, 2000), revisit intention translates into significant economic benefits through reduced marketing expenditure and powerful word-of-mouth endorsements (Foroudi et al., 2021; Kozak and Rimmington, 2000). The drivers of this intention are manifold, but converge significantly on positive prior evaluations of the trip (Chi and Qu, 2008). Research conducted in Asian contexts, including studies focusing on or including China, consistently validates the pivotal role of favorable past experiences and satisfaction in cultivating the desire among international tourists to return (Jebbouri et al., 2021; Liu et al., 2017; Nguyen-Viet et al., 2025; Rasoolimanesh et al., 2022), setting the stage for understanding the factors that build these positive evaluations.
2.2 The roles of satisfaction and experience
TS is an organismic post-consumption appraisal of the visit, integrating cognitive and affective evaluations formed during the experience, and is consistently associated with favorable behavioral intentions (Krey et al., 2023; Thanikkad and Kumar, 2022). Satisfaction arises from the match between anticipated and delivered experiences (Parasuraman et al., 1988). It serves as a crucial psychological outcome, mediating the effects of service quality and perceived value on behavioral intentions (Ghorbanzadeh et al., 2021; Saut and Bie, 2024). In China, factors like service quality, cultural experiences, and perceived safety significantly determine international tourists’ satisfaction levels (Chi and Qu, 2009; Chi et al., 2020; Sparks and Browning, 2011; Xie et al., 2021). High tourist satisfaction directly fosters revisit intentions. The tourist experience encompasses the holistic, multi-dimensional engagement during travel, involving cognitive, affective, sensory, and behavioral dimensions that create memorable moments (de Freitas Coelho et al., 2018; Godovykh and Tasci, 2020). Elements like novelty, authenticity, and local interaction significantly shape experience quality (Jebbouri et al., 2022; Yang et al., 2023), Technology (Neuhofer et al., 2014). For China, with its blend of historical sites and modern cityscapes, cultural and environmental experience quality is paramount (Vaccaro and Beltran, 2007). Positive experiences contribute to satisfaction and influence destination recommendations and revisit intentions (Chen et al., 2020).
2.3 Perceived value
PV is the traveler’s overall cognitive/affective assessment of the benefits–costs trade-off of the visit, i.e., an internal evaluation rather than an external condition (Shih et al., 2024). It represents tourists’ overall assessment of net utility derived from their trip, based on cognitive trade-offs between perceived benefits and sacrifices (Zeithaml, 1988). In tourism, benefits are multifaceted, spanning functional quality (efficient transport, comfortable lodging), emotional rewards (enjoyment, relaxation), social gains (connection, prestige), and intellectual enrichment (learning, cultural understanding) (Carvache-Franco et al., 2022; Oriade and Schofield, 2019; Petrick, 2002). Sacrifices encompass monetary costs, time investments, physical and mental effort, and perceived risks (Gallarza-Granizo et al., 2020). International tourists evaluating China trips engage in this calculus, weighing unique cultural offerings and modern conveniences against travel complexity, communication barriers, costs, and navigation challenges (Tian et al., 2021). Research consistently affirms PV’s multi-dimensional nature and its role as an antecedent to satisfaction and behavioral intentions (Leckie et al., 2018; Lee, 2020).
2.4 Perceived technology integration
China’s advanced technological landscape significantly impacts international visitors’ tourism experiences (Buhalis and Sinarta, 2019; Zhou and Sotiriadis, 2021). Several key technologies shape the tourist journey: ubiquitous mobile payment systems streamline transactions but create barriers for unfamiliar visitors, affecting perceived effort and convenience (Zhao and Bacao, 2021); China’s extensive high-speed rail network and ride-hailing apps enhance accessibility and efficiency, reducing time costs and boosting perceived functional value (Li et al., 2022). Integrated super-apps like WeChat consolidate services but require adaptation from users accustomed to different digital ecosystems (Harwit, 2017). Furthermore, Smart tourism initiatives using AI, big data, and IoT personalize services and manage crowds, though perceived effectiveness varies (Rane et al., 2023; Wang et al., 2022). Additionally, the dense online information environment and visible surveillance technology influence pre-trip expectations, navigation, and perceptions of safety and privacy (Majeed et al., 2020; Martins et al., 2025). From a user acceptance perspective (Venkatesh et al., 2012), tourists’ perceptions of these technologies’ utility, ease of use, and facilitating conditions directly influence their perceived value and overall experience quality assessment.
2.5 Perceived government policies
Government policies play a prominent role in structuring China’s tourism industry and influencing international visitor experiences (Gao et al., 2022; Yan et al., 2022). Through the Stimulus-Organism-Response (S-O-R) framework, various policies act as formal mechanisms shaping the tourism environment. Visa regulations, including recent facilitation measures and visa-free transit, directly impact perceived accessibility and initial effort costs (Gu, 2024). State-led infrastructure investments in transport, accommodation, and communication networks enhance functional quality and reach of tourism offerings (Arlt, 2006; Liu, 2020). Government-directed nation branding and destination marketing campaigns cultivate China’s international image and influence tourist expectations (Zhang and Hitchcock, 2017). Safety, security, and public health policies directly shape perceptions of risk and well-being, with visible enforcement potentially enhancing security feelings, particularly important post-pandemic (Cui et al., 2016; Godovykh et al., 2021). Regional development strategies promoting areas like Hainan or the Greater Bay Area create concentrated tourism zones with unique service levels (Yu, 2024; Zhang and Ju, 2021). Cultural heritage and environmental protection policies influence perceived quality, authenticity, and sustainability of tourism assets (Ye et al., 2024; Zhao et al., 2024). International tourists’ perceptions of these policies, whether enabling and quality-enhancing or restrictive and detrimental, significantly influence their overall perceived value and satisfaction levels (Chi et al., 2020; Regalado-Pezúa et al., 2023).
The proposed research model (Figure 1) provides a comprehensive framework for analyzing the drivers of international tourist RI. Accordingly, the model specifies PV, PGP, and PTI as stimuli influencing organismic states (TS, TE), which in turn shape the response (RI), yielding both organism→response links and indirect stimulus→organism→response paths. These factors are hypothesized to influence tourist outcomes through both direct and indirect pathways. The model examines how these initial perceptions impact RI directly through cognitive and evaluative shortcuts and indirectly through their influence on TS and overall TE, which serve as mediating variables. By empirically testing these comprehensive direct and indirect relationships simultaneously, this research aims to provide a nuanced understanding of contemporary destination loyalty determinants. This framework is particularly relevant for dynamic tourism contexts like China, characterized by significant governmental influence on the operational environment and rapidly advancing technological integration. The study anticipates yielding valuable theoretical contributions by illuminating the complex interplay between external perceptions (policies, technology, value), internal evaluations (satisfaction, experience), and future travel behavior within a unified model. Furthermore, the research seeks to provide practical insights for tourism stakeholders, particularly those operating within or targeting the Chinese international tourism market. The findings will inform strategies for fostering sustained visitation by effectively managing policy impacts, technology integration, perceived value, and the resulting tourist experiences and satisfaction.
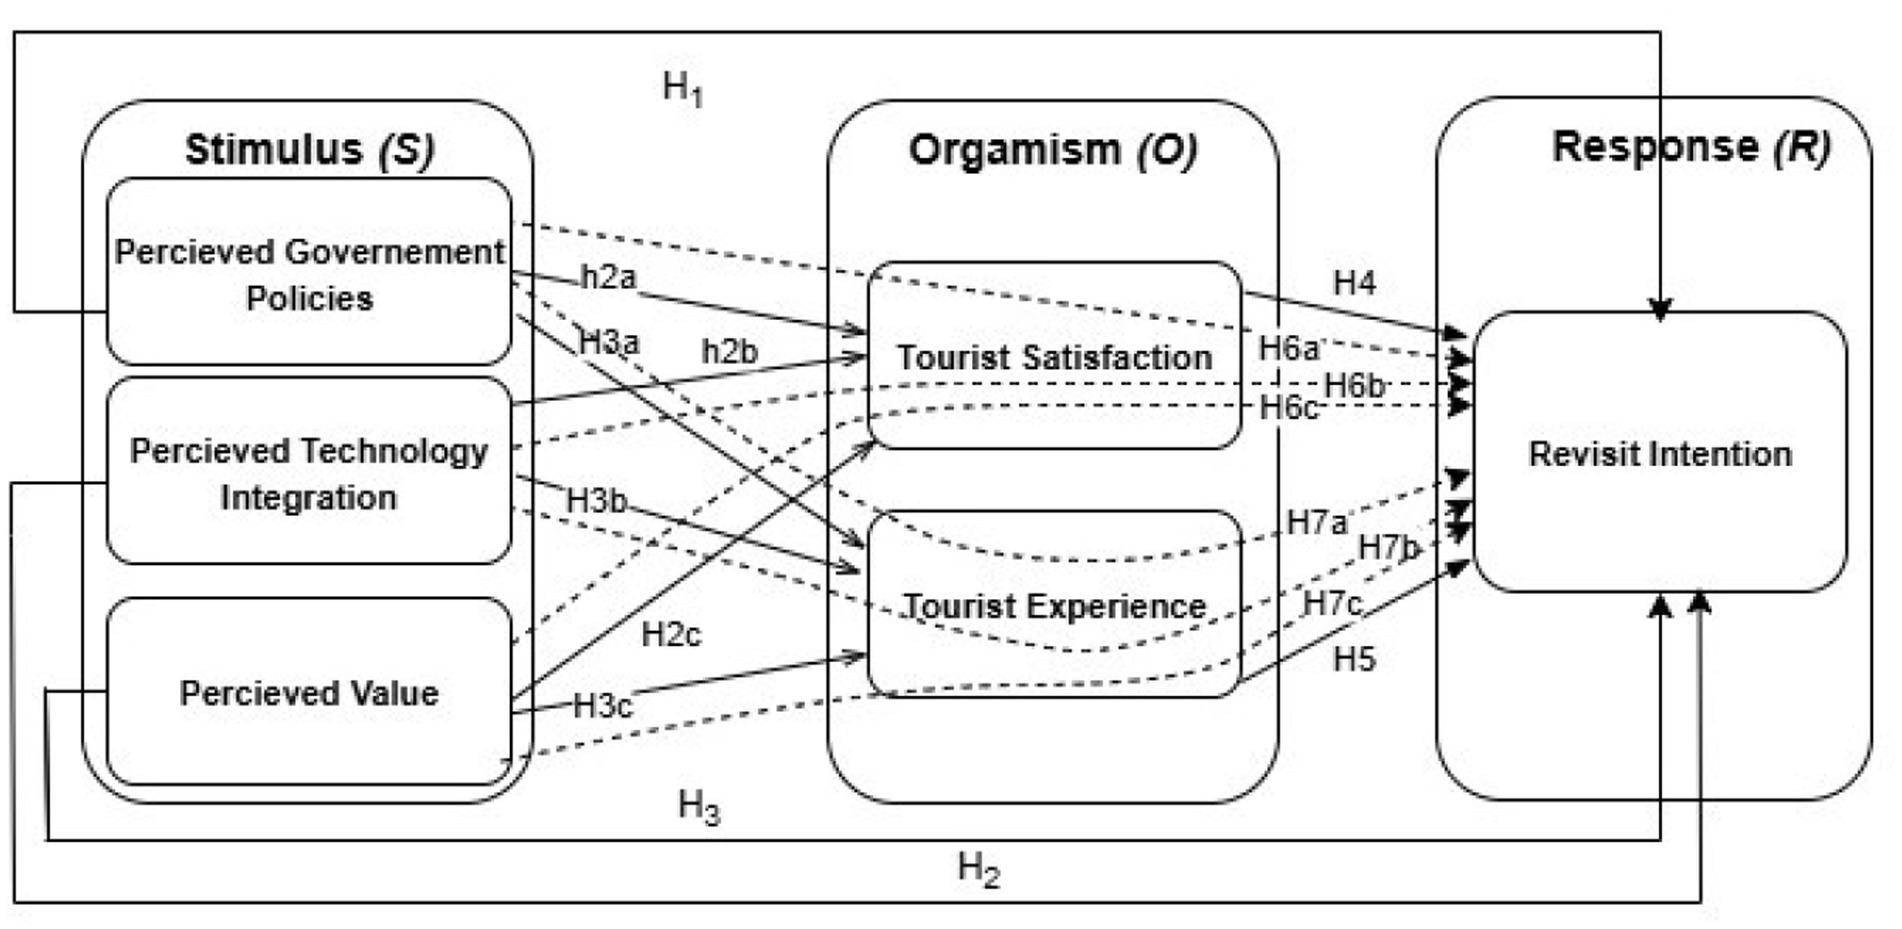
Figure 1. Conceptual framework.
3 Hypothesis development
3.1 Perceived tourism enablers vs. revisit intention
Within the S-O-R framework, while organismic states such as satisfaction and experience are crucial mediators, it is also theoretically plausible that certain powerful and salient environmental stimuli can exert a direct influence on behavioral responses without necessarily requiring full cognitive or affective processing through internal states. This aligns with the S-O-R model’s accommodation of “nontrace” stimulus–response events (Bigne et al., 2020; Jacoby, 2002), where immediate or foundational stimuli can trigger direct behavioral predispositions. Such direct pathways are particularly relevant for fundamental attributes that address core tourist needs or significantly streamline the travel process. PGP, particularly those related to safety, security, and accessibility, directly impacts tourists’ foundational perceptions of destination reliability and appeal. Positive perceptions of these policies establish a strong initial impression, acting as a direct stimulus that may immediately foster confidence and willingness to return. This direct response is theorized to occur because these policies address fundamental preconditions for travel, thereby directly shaping revisit decisions by creating a secure and accessible environment (Nguyen Viet et al., 2020; Prayag et al., 2013; Seetanah et al., 2020). High PTI can directly enhance the practicality and desirability of a destination visit. When technology offers notable utility and convenience, such as seamless payments or efficient navigation, it reduces friction and effort, creating an immediate positive impact on tourists’ assessment of destination travel-friendliness. This direct functional value is expected to facilitate positive behavioral responses in the form of revisit intention, as tourists are often drawn to efficient and effortless travel experiences (Chen et al., 2024; Pai et al., 2021). PV, conceptualized as a cognitive assessment of benefits relative to sacrifices, functions as a direct rational stimulus influencing future behavior. When tourists perceive excellent value for their investment, this positive assessment acts as a compelling, unmediated driver for revisit intention. This direct link is theorized to arise from rational utility calculations, providing immediate justification for repeating a positive experience without necessarily requiring full processing through satisfaction or holistic experience evaluation (Ahn and Kwon, 2020; Calza et al., 2020; Cronin et al., 2000). Examining these direct paths is crucial for determining full or partial mediation and understanding how foundational destination attributes directly shape tourists’ future intentions. Therefore:
H1: PGP positively influences RI.
H2: PTI positively influences RI.
H3: PV positively influences RI.
3.2 Perceived tourism enablers vs. mediators
PGP represents a fundamental environmental stimulus within the S-O-R framework, influencing tourists’ internal organismic states across several dimensions. Favorable government policies concerning safety, infrastructure, and services provide a foundation of reliability and quality, contributing to smoother, safer, and more predictable trips. When positively perceived, these policies enhance tourist satisfaction by meeting fundamental expectations for well-managed destinations (Chen and Tsai, 2007; Duan et al., 2020; Kim and Jeong, 2024). Beyond satisfaction, policies promoting cultural preservation, environmental protection, and event organization create richer, more structured environments that facilitate deeper engagement and immersion, thereby enhancing the overall tourist experience (Akhshik et al., 2023; Suhartanto et al., 2021). Simultaneously, technology offering interactive content, real-time information, and immersive digital elements fosters deeper engagement and discovery, leading to more memorable and enriching tourist experiences (Morosan and DeFranco, 2016; Shariffuddin et al., 2023). PV operates as a significant stimulus impacting internal evaluative states through tourists’ cognitive assessment of net utility derived from comparing benefits to costs. High perceived value acts as a positive stimulus driving favorable cognitive and affective appraisals, fundamentally enhancing satisfaction through the feeling of receiving good value for investment (Chen and Chen, 2010; Jeong and Kim, 2020). This value perception extends beyond functional benefits to include emotional rewards, intrinsically enhancing the psychological richness of the trip and contributing to more positive and enriching overall experiences (Oliver, 1980; Yang et al., 2023). These stimulus-organism relationships demonstrate how external destination attributes are processed through tourists’ internal evaluative mechanisms, establishing the theoretical foundation for examining their ultimate influence on behavioral responses.
H2a: PGP positively influences TS.
H2b: PTI positively influences TS.
H2c: PV positively influences TS.
H3a: PGP positively influences TE.
H3b: PTI positively influences TE.
H3c: PV positively influences TE.
3.3 Mediators vs. revisit intention
Within the S–O–R framework, TS and TE function as organismic states through which destination stimuli are appraised and translated into behavioral responses. PGP, PTI, and PV serve as stimuli that shape visitors’ cognitive and affective evaluations during and after their visit, which in turn determine their response through RI. TS serves as a fundamental driver of post-consumption behavioral intentions. When tourists develop positive internal appraisals of their trip, this satisfied state fosters favorable attitudes toward the destination, directly predicting stronger intentions to revisit. Extensive empirical evidence consistently demonstrates that satisfied tourists translate their positive evaluations into significantly higher revisit intentions (Chi et al., 2020; Godovykh and Tasci, 2020; Xie et al., 2021; Yang et al., 2023; Yoon and Uysal, 2005). Beyond satisfaction, TE represents a more encompassing organismic state characterized by the full spectrum of emotional, sensory, and psychological engagement with a destination. These multidimensional experiential encounters create deeper psychological connections and stronger affective bonds with places. This holistic internal processing is theorized to generate more robust behavioral dispositions for revisit intention compared to satisfaction alone, as tourists seek to re-engage with destinations that have provided deeply meaningful and transformative experiences (Amissah et al., 2021; Prayag et al., 2017).
H4: TS positively influences RI.
H5: TE positively influences RI.
3.4 Mediation effects of satisfaction and experience
Building on the Stimulus-Organism-Response (S-O-R) model (Bagozzi, 1986; Mehrabian and Russell, 1974), we examine how destination-level stimuli—PGP, PTI, and PV—shape organismic states (TS; TE) that drive the response (RI). Following Jacoby (2002)’s reconceptualization of S-O-R, which accommodates automatic processing and allows “nontrace” stimulus–response events, we estimate both indirect (S → O → R) and direct (S → R) paths (Bigne et al., 2020). This specification acknowledges that destination stimuli may also activate immediate or feasibility-based behavioral tendencies that are not fully captured by measured organismic states. The mediation effects are crucial to test empirically, as they reveal the underlying mechanisms and relative importance of different pathways within this integrated framework and specific cultural context. TE also serves as a mediating mechanism between external stimuli and behavioral responses. Effective PGP creates structured and supportive environments that enable richer, more engaging tourist experiences, which create deeper psychological connections and foster stronger revisit intentions (Pai et al., 2020; Tran, 2025). Advanced PTI provides interactive and immersive opportunities that significantly enrich the overall tourist experience, with these heightened and memorable experiences becoming powerful drivers of revisit intention through stronger affective bonds (Akhshik et al., 2023; Suhartanto et al., 2021). Additionally, the perception of receiving good value extends beyond cognitive assessment to evoke positive emotions that intrinsically enrich the overall tourist experience, fostering stronger desires to return (Rasoolimanesh et al., 2022; Torabi et al., 2022). These mediation pathways demonstrate how external destination stimuli operate through tourists’ internal evaluative and experiential processes to influence behavioral intentions, establishing multiple S → O → R pathways within the theoretical framework.
H6a: TS mediates the effect of PGP on RI.
H6b: TS mediates the effect of PTI on RI.
H6c: TS mediates the effect of PV on RI.
H7a: TE mediates the effect of PGP on RI.
H7b: TE mediates the effect of PTI on RI.
H7c: TE mediates the effect of PV on RI.
4 Methodology
4.1 Research design
This study employed a quantitative, cross-sectional survey design to investigate the relationships among PGP, PTI, PV, TS, TE, and RI among international tourists visiting China. The cross-sectional approach captured real-time tourist perceptions during active engagement with the tourism experience, providing immediate access to fresh evaluations while minimizing recall bias (Bryman, 2016); Operating within a positivist paradigm, the research employs validated measurement principles to test theoretically derived hypotheses through a deductive approach. Face-to-face surveys were selected over online alternatives to achieve higher response rates, enable immediate clarification of questions, and reduce measurement error through trained interviewer oversight (Fowler Jr, 2013; Groves et al., 2011). Beijing was selected as the research context due to its status as China’s premier international tourist destination, ensuring high volume and diversity of international visitors while providing a setting where tourists directly encounter government policies and technology integration initiatives. Data collection occurred at three major UNESCO World Heritage Sites: The Forbidden City, Summer Palace, and Temple of Heaven. These sites were chosen because they represent internationally recognized cultural landmarks offering distinct but complementary experiential aspects of Chinese heritage tourism. The Forbidden City, a vast imperial palace, provides an immersive historical journey through ancient architecture, art, and imperial history. The Summer Palace, an exquisite imperial garden, offers scenic beauty, traditional Chinese landscape design, and a blend of natural and cultural elements. The Temple of Heaven, a complex of imperial temples, provides insights into ancient religious rituals and architectural symbolism. Collectively, these sites offer a rich tapestry of historical, cultural, architectural, and natural heritage experiences, where tourists encounter Chinese government policies related to heritage management and technology integration while forming comprehensive satisfaction and experience evaluations (Su and Wall, 2014; Timothy and Boyd, 2003).
4.2 Population and sample size
The target population was comprised of international tourists (non-Chinese nationals holding foreign passports, aged 18+) who were completing leisure visits to mainland China. Given the absence of comprehensive sampling frames for international tourists, systematic convenience sampling was employed as the most viable method for accessing this mobile population. The systematic protocol required approaching every fifth potential participant during designated peak times across different days, incorporating systematic elements to reduce selection bias while enhancing sample diversity. Peak time sampling captured temporal diversity in tourist populations with different travel patterns and cultural backgrounds. While this non-probability sampling method limits statistical generalization to the entire population of international tourists visiting China, the systematic elements and large sample size (n = 508) provide sufficient analytical power for examining construct relationships and developing theoretical insights applicable to similar tourism contexts. This approach aligns with established tourism research practices where probability sampling is often impractical due to mobile tourist populations (Allaberganov and Preko, 2022; Masroor and Shiva, 2024; Patwary et al., 2022; Zheng et al., 2024).
4.3 Data collection procedure
Data were collected using a structured questionnaire incorporating validated measurement scales with seven-point Likert scales. The English-language questionnaire commenced with screening questions, followed by construct measurements, and concluded with demographic information. Data collection occurred over 2 weeks (April 15–29, 2025) during typical spring tourist patterns. Data collectors received comprehensive training on study objectives, sampling procedures, ethical guidelines, and questionnaire administration. A systematic convenience sampling approach was employed by trained data collectors following a pre-defined schedule to ensure systematic selection. “Peak times” were defined based on typical visitor flow data for each site, generally between 10:00 a.m.–1:00 p.m. and 2:00 p.m.–5:00 p.m. These times represent the highest concentrations of international visitors, increasing the likelihood of encountering the target population. Tourists were approached while they were still present within the heritage site, typically during breaks in their exploration (e.g., resting, having a snack, or between major attractions), ensuring their perceptions were fresh from their ongoing experience, but not interrupting their core engagement with the sites. Ethical approval was obtained from the Inner Mongolia University of Finance and Economics Ethics Committee, with procedures aligned to Declaration of Helsinki principles. Participants were informed about the study’s academic purpose, assured of anonymity and confidentiality, and provided verbal informed consent. Tourists completed questionnaires independently, with data collectors available for clarification. Quality control measures included daily questionnaire reviews and systematic response pattern monitoring.
4.4 Measures
All constructs were measured using multi-item scales, primarily adapted from previously validated instruments to ensure content validity. Unless otherwise specified, all scales employed a seven-point Likert format (1 = Strongly Disagree, 7 = Strongly Agree), consistent with common practice in tourism and marketing research (Cronin et al., 2000; Petrick, 2002). Table 1 provides a detailed overview of the scales used, including item wording and source citations. For constructs where context-specific measurement was required, namely PGP and PTI, careful adaptation or development of items was undertaken. As no universally validated scale exists for tourist perceptions of destination-specific policies, items for PGP were developed based on a review of relevant literature on policy impacts on international tourism (Weng et al., 2023; Xie et al., 2021). These items were designed to capture tourist perceptions across key policy areas relevant to the international visitor experience in China, including aspects of visa/entry processes, safety/security measures, and infrastructure quality. PTI items were adapted from established technology acceptance models, primarily UTAUT2 (Venkatesh et al., 2012) and the SOR model (Kim et al., 2020), focusing on Performance Expectancy (utilitarian effectiveness of technological offerings), Effort Expectancy (ease of use and interaction with technological infrastructure), and Hedonic Motivation (intrinsic enjoyment derived from technology engagement). These dimensions were selected for their robust ability to predict user attitudes and behavioral intentions toward technology in China’s distinctive digital environment. Scales for other constructs were adapted from well-established sources in tourism and marketing literature: PV was measured using items from the multi-dimensional SERV-PERVAL scale (Petrick, 2002; Sweeney and Soutar, 2001), covering quality, emotional, and monetary dimensions; Overall TS was assessed using widely used tourism satisfaction scales (Chi and Qu, 2008; Cronin et al., 2000), Overall Quality of TE was captured using items drawing from engaging travel experience literature (Kim et al., 2012), and RI were measured using standard behavioral intention items (Um et al., 2006; Yoon and Uysal, 2005).
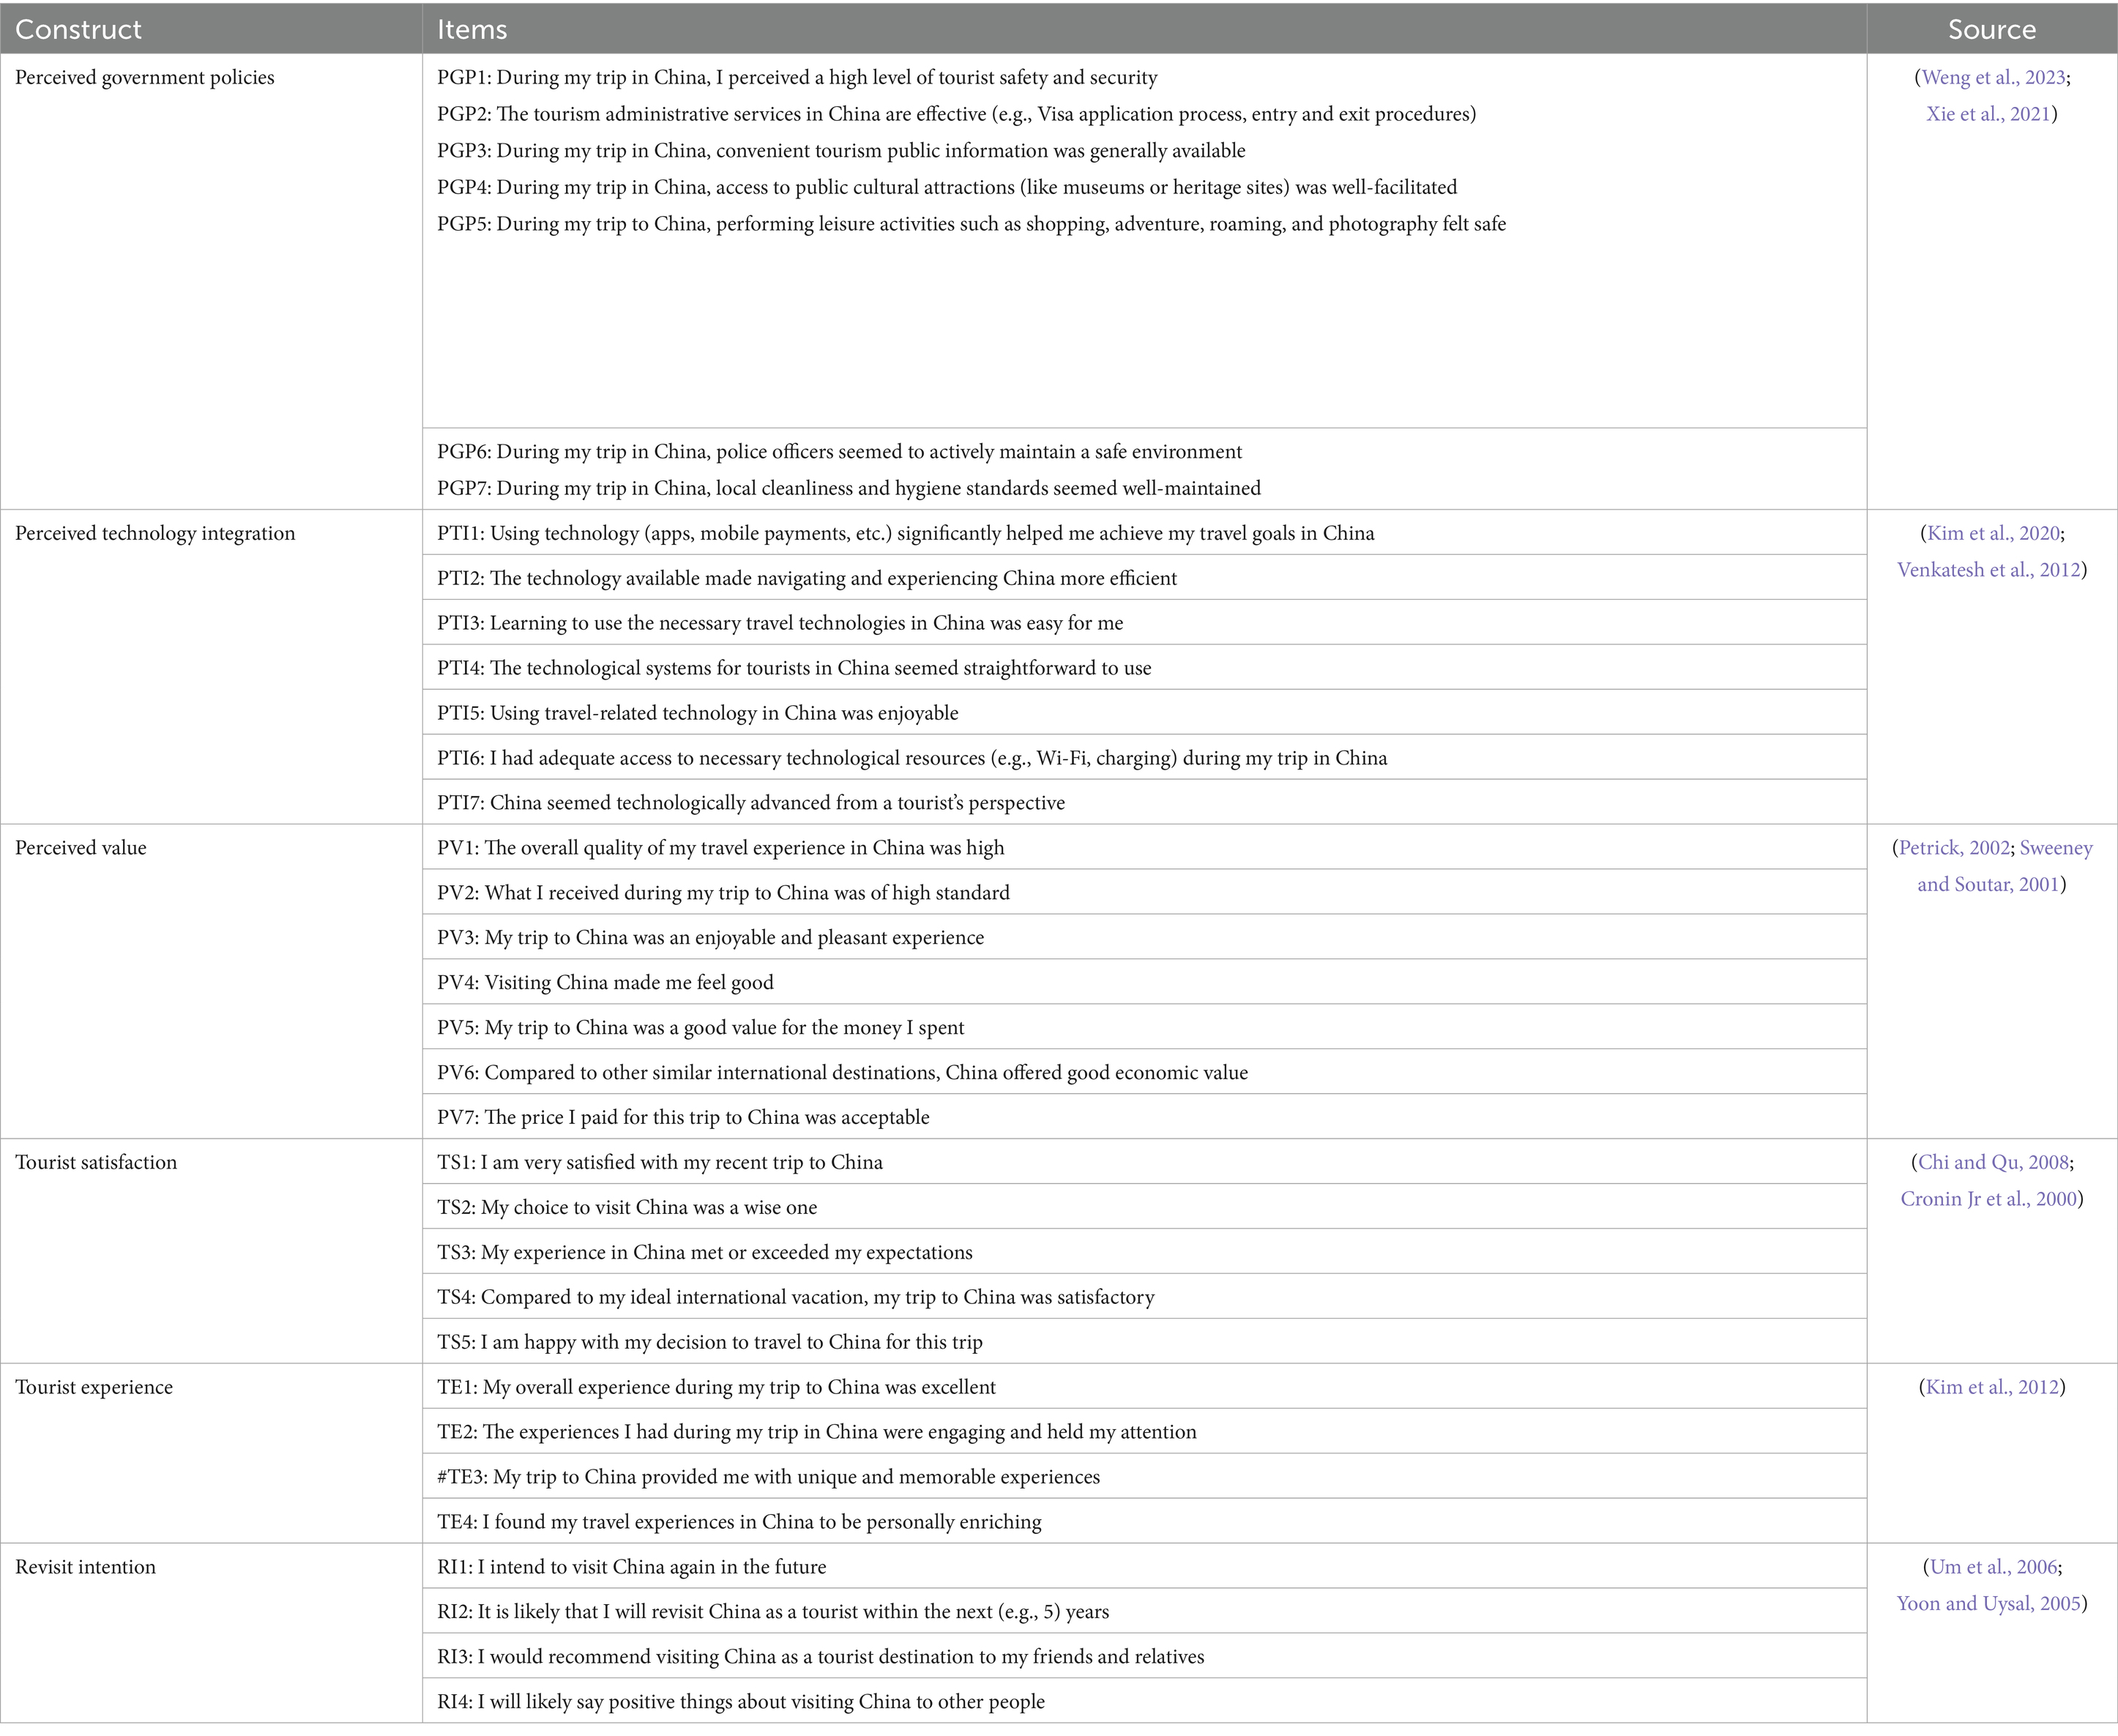
Table 1. Constructs and scales items.
4.5 Data analysis
Data analysis proceeded in two stages. First, preliminary data exploration, including descriptive statistics and initial reliability tests, was conducted using IBM SPSS Statistics 28.0. For the central part of our analysis, we employed PLS-SEM using SmartPLS 4.0 software. PLS-SEM is a robust, variance-based multivariate technique, fundamentally different from simple correlational analysis, and was chosen for its suitability in analyzing complex causal relationships involving latent variables, estimating both direct and indirect effects, and its predictive orientation which aligns with our theory development aims. It is particularly effective for examining models like our S-O-R framework and is appropriate for our data due to its less stringent distributional assumptions (Hair et al., 2017). Throughout the process, we carefully evaluated both the measurement and structural models, as well as the mediating and moderating effects, following the established protocols for PLS-SEM outlined by Hair and Alamer (2022).
4.6 Sample profile
The sample comprised 508 individuals represented in Table 2, with a gender distribution of 52.6% male, 34.8% female, 1.6% non-binary, and 11.0% preferring not to disclose. Age distribution was relatively balanced across middle-aged categories, with the largest cohorts in the 35–44 (19.9%), 45–54 (19.3%), and 25–34 (18.7%) age brackets. Geographically, participants represented 11 countries, with the UK (10.02%), India (9.8%), Brazil (8.1%), and Canada (8.9%) comprising the largest segments. The sample demonstrated high educational attainment: 26.2% reported some university/college education. Annual household income varied considerably, with the largest group earning $20,000–$49,999 (20.3%). Travel companion preferences were diverse: family including children (20.3%), friends (15.7%), business colleagues/clients (15.0%), and partner/spouse (14.8%) represented the primary categories. Leisure/vacation was the predominant purpose of visits (46.9%), followed by business (16.9%) and education/study (11.2%). Regarding visit frequency to China, 36.4% were first-time visitors, while 63.6% visited China twice or more, suggesting substantial repeat visitation patterns.
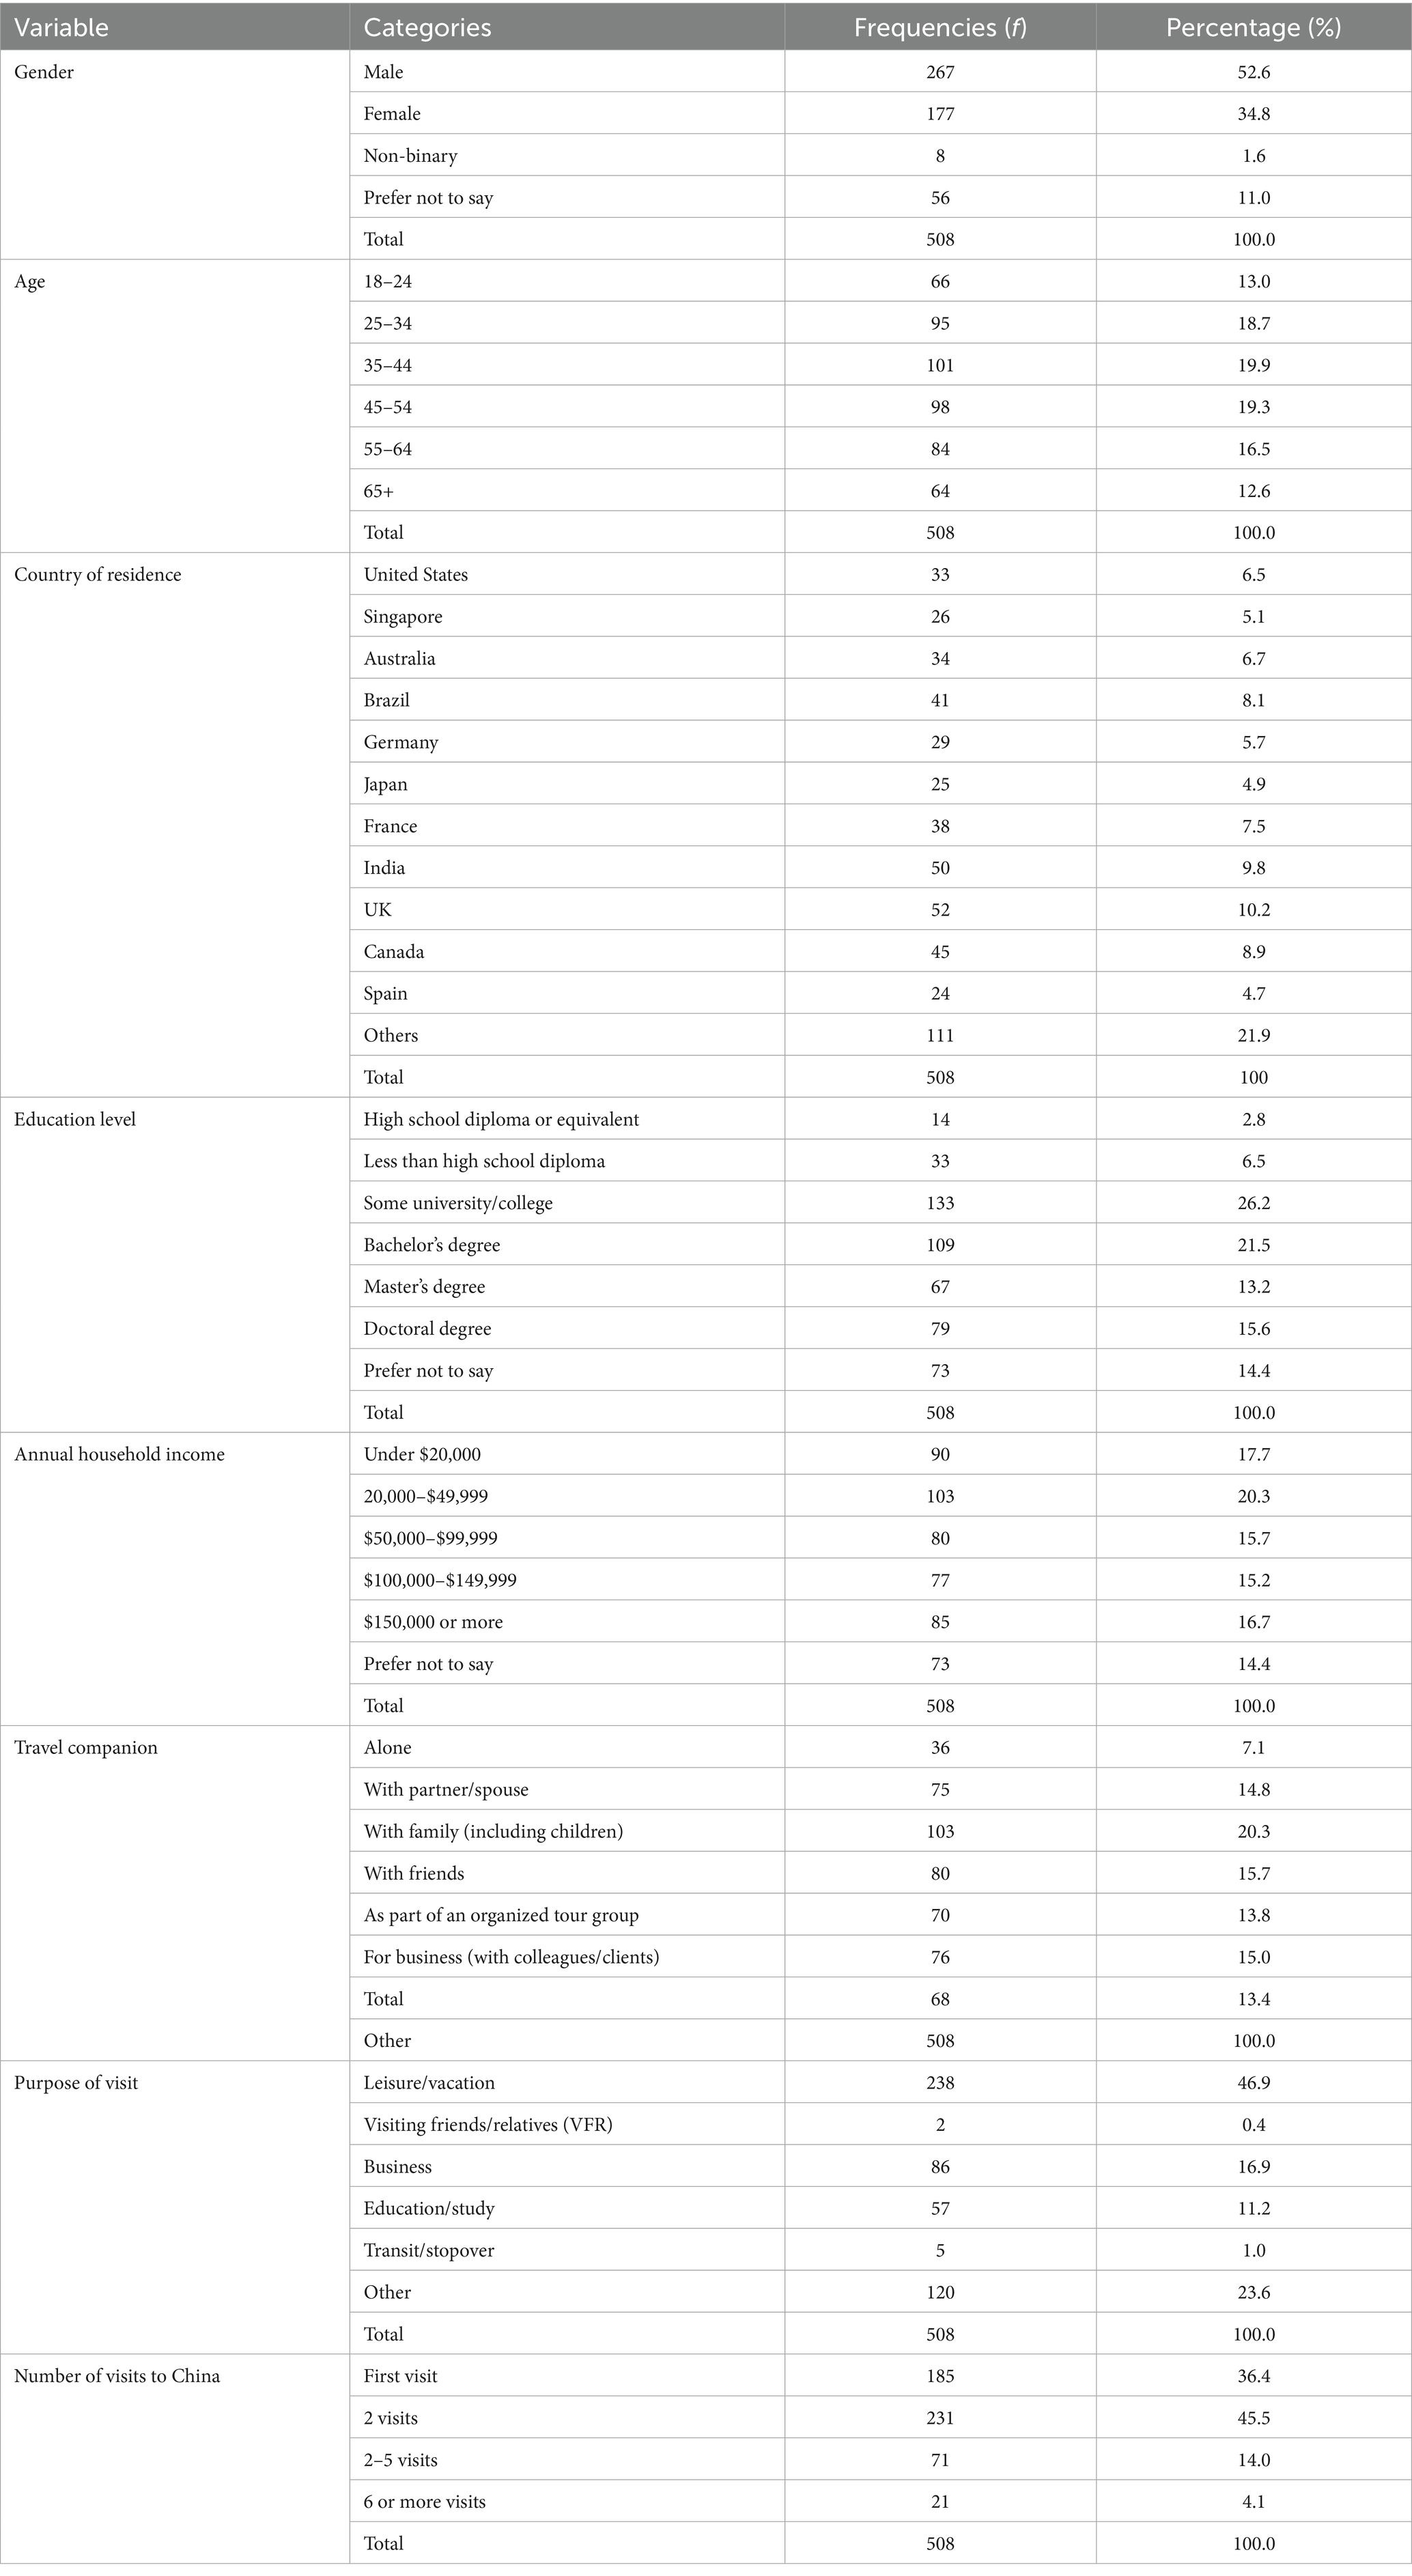
Table 2. Sample characteristics (N = 508).
4.7 Data reliability
Prior to the main data collection, the initial pool of items, including newly developed ones, underwent a two-stage refinement process. First, items were reviewed by a panel of 5 academics with expertise in tourism/marketing and/or China studies for clarity, relevance to the context, and content coverage. Based on their feedback, item wording and structure were refined. Second, a pilot test was conducted with a sample of 20 international visitors fitting the target population criteria. The pilot aimed to assess the scales’ clarity, comprehensibility, and initial reliability. Based on pilot feedback, minor adjustments were made to the final questionnaire. These adjustments primarily involved rephrasing a few ambiguous item wordings for improved clarity for international respondents and simplifying some sentence structures to enhance comprehensibility. Preliminary reliability analysis from the pilot also confirmed the internal consistency of the scales, leading to confidence in their suitability for the main study. The factor loadings for individual items on their respective constructs ranged from 0.735 to 0.874, with most items exceeding the commonly accepted threshold of 0.70, indicating strong item reliability (Henseler et al., 2015). Specifically, all retained items loaded significantly onto their intended constructs. One item from the Tourist Experience scale (TE3) was removed due to a factor loading below the 0.70 criterion (0.656), enhancing the scale’s psychometric soundness (Khan et al., 2023). Construct reliability was evaluated using Composite Reliability (CR). As shown in Table 3, the CR values for all constructs, PGP (0.924), PTI (0.933), PV (0.941), TE (0.893), TS (0.892), and RI (0.913) exceeded the recommended threshold of 0.70 (Fornell and Larcker, 1981), with most values well above 0.90, demonstrating high internal consistency. Convergent validity was assessed using the Average Variance Extracted (AVE). The AVE values for all constructs ranged between 0.624 and 0.724 and were all above the 0.50 threshold (Fornell and Larcker, 1981), providing robust support for the convergent validity of the scales.
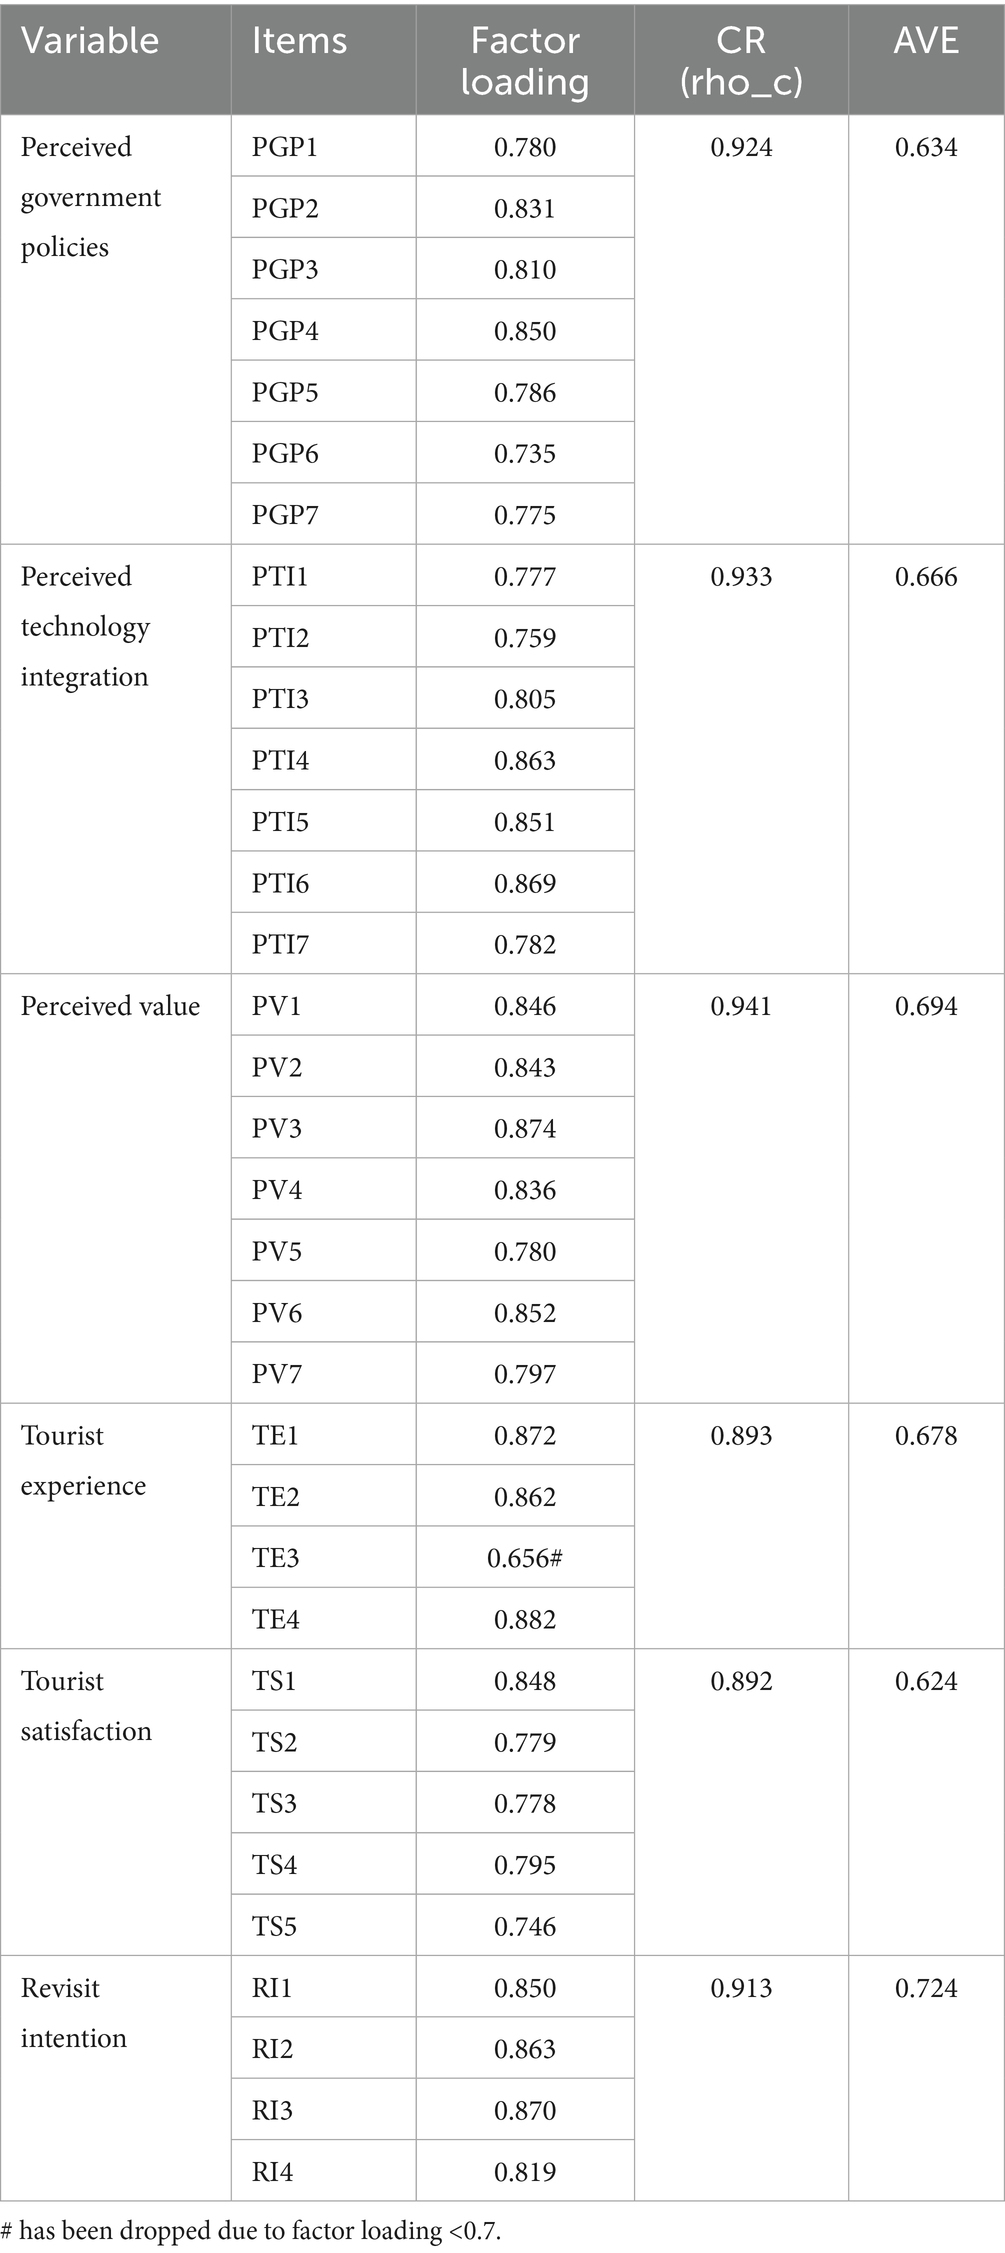
Table 3. Reliability and convergent validity.
4.8 Discriminant validity
Discriminant validity was assessed using the Heterotrait-Monotrait Ratio of Correlations (HTMT) to confirm that the constructs were empirically distinct from one another (Henseler et al., 2015). Table 4 presents the HTMT values for all pairs of constructs. All HTMT values were below the conservative threshold of 0.90, ranging from 0.777 to 0.884. While some values were slightly above the more stringent 0.85 threshold, they remained below 0.90, which is widely considered acceptable, providing sufficient evidence that the constructs are distinct in this research context (Kline, 2023). The measurement model demonstrated robust reliability and validity, confirming the appropriateness of the scales and constructs for testing the hypothesized structural relationships.
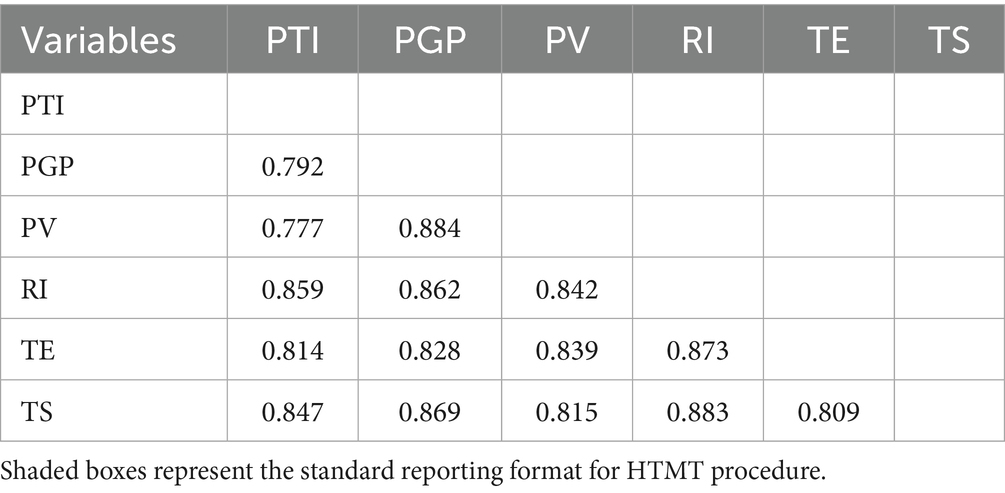
Table 4. Discriminant validity (HTMT).
5 Results
This section presents the empirical findings from the Partial Least Squares Structural Equation Modeling (PLS-SEM) analysis, structured to first confirm the robustness of the measurement model and then evaluate the hypothesized relationships within the structural model.
5.1 Measurement model
The structural model demonstrated strong explanatory power (R2), accounting for 76.0% of variance in RI, 68.4% in TS, and 65.0% in TE. Variance Inflation Factors ranged from 2.361 to 4.823, indicating no multicollinearity concerns. All hypothesized relationships were supported (Table 3; Figure 2). Consistent with our theoretical propositions, all three tourism enablers demonstrated significant direct positive influences on RI. PTI emerged as the strongest direct predictor (β = 0.226, p < 0.001), indicating its potent role in directly shaping tourists’ desire to return. This was closely followed by PGP (β = 0.125, p = 0.026) and PV (β = 0.120, p = 0.018). These findings provide robust empirical support for H1, H2, and H3, respectively, confirming the presence of direct S → R pathways in our S-O-R model. All three external enablers were found to be significant positive predictors of Tourist Satisfaction (TS), reaffirming their role in shaping tourists’ cognitive and affective evaluations. PTI demonstrated the strongest influence on TS (β = 0.408, p < 0.001), followed by PGP (β = 0.354, p < 0.001), and PV (β = 0.134, p = 0.017). These results provide strong support for H2a, H2b, and H2c. Similarly, TE was significantly and positively influenced by all proposed enablers. PTI again showed a substantial impact (β = 0.339, p < 0.001), with PV also exhibiting a strong effect (β = 0.314, p < 0.001), and PGP contributing significantly (β = 0.223, p = 0.002). This provides clear evidence in support of H3a, H3b, and H3c. Both organismic states, TS and TE, were found to be significant positive predictors of Revisit Intention (RI). Notably, TS exhibited a stronger direct influence on RI (β = 0.306, p < 0.001) compared to TE (β = 0.196, p < 0.001). These findings confirm H4 and H5, respectively, highlighting the critical role of internal evaluations in driving future travel behavior. Significant indirect effects were observed for all three enablers through TS. PTI exerted a significant indirect effect (β = 0.125, p = 0.014), as did PGP (β = 0.108, p = 0.014), and PV (β = 0.041, p = 0.025). These results collectively support H6a, H6b, and H6c. Similarly, all enablers demonstrated significant indirect effects through TE. PTI showed a notable indirect effect (β = 0.066, p = 0.001), alongside PV (β = 0.061, p = 0.004), and PGP (β = 0.044, p = 0.002). These findings provide strong support for H7a, H7b, and H7c. Given the concurrent presence of significant direct effects (S → R) and significant indirect effects (S → O → R) for all pathways from tourism enablers to RI, partial mediation was confirmed for every relationship, underscoring the complex and multifaceted nature of how these factors influence revisit intentions (Table 5; Figure 2).
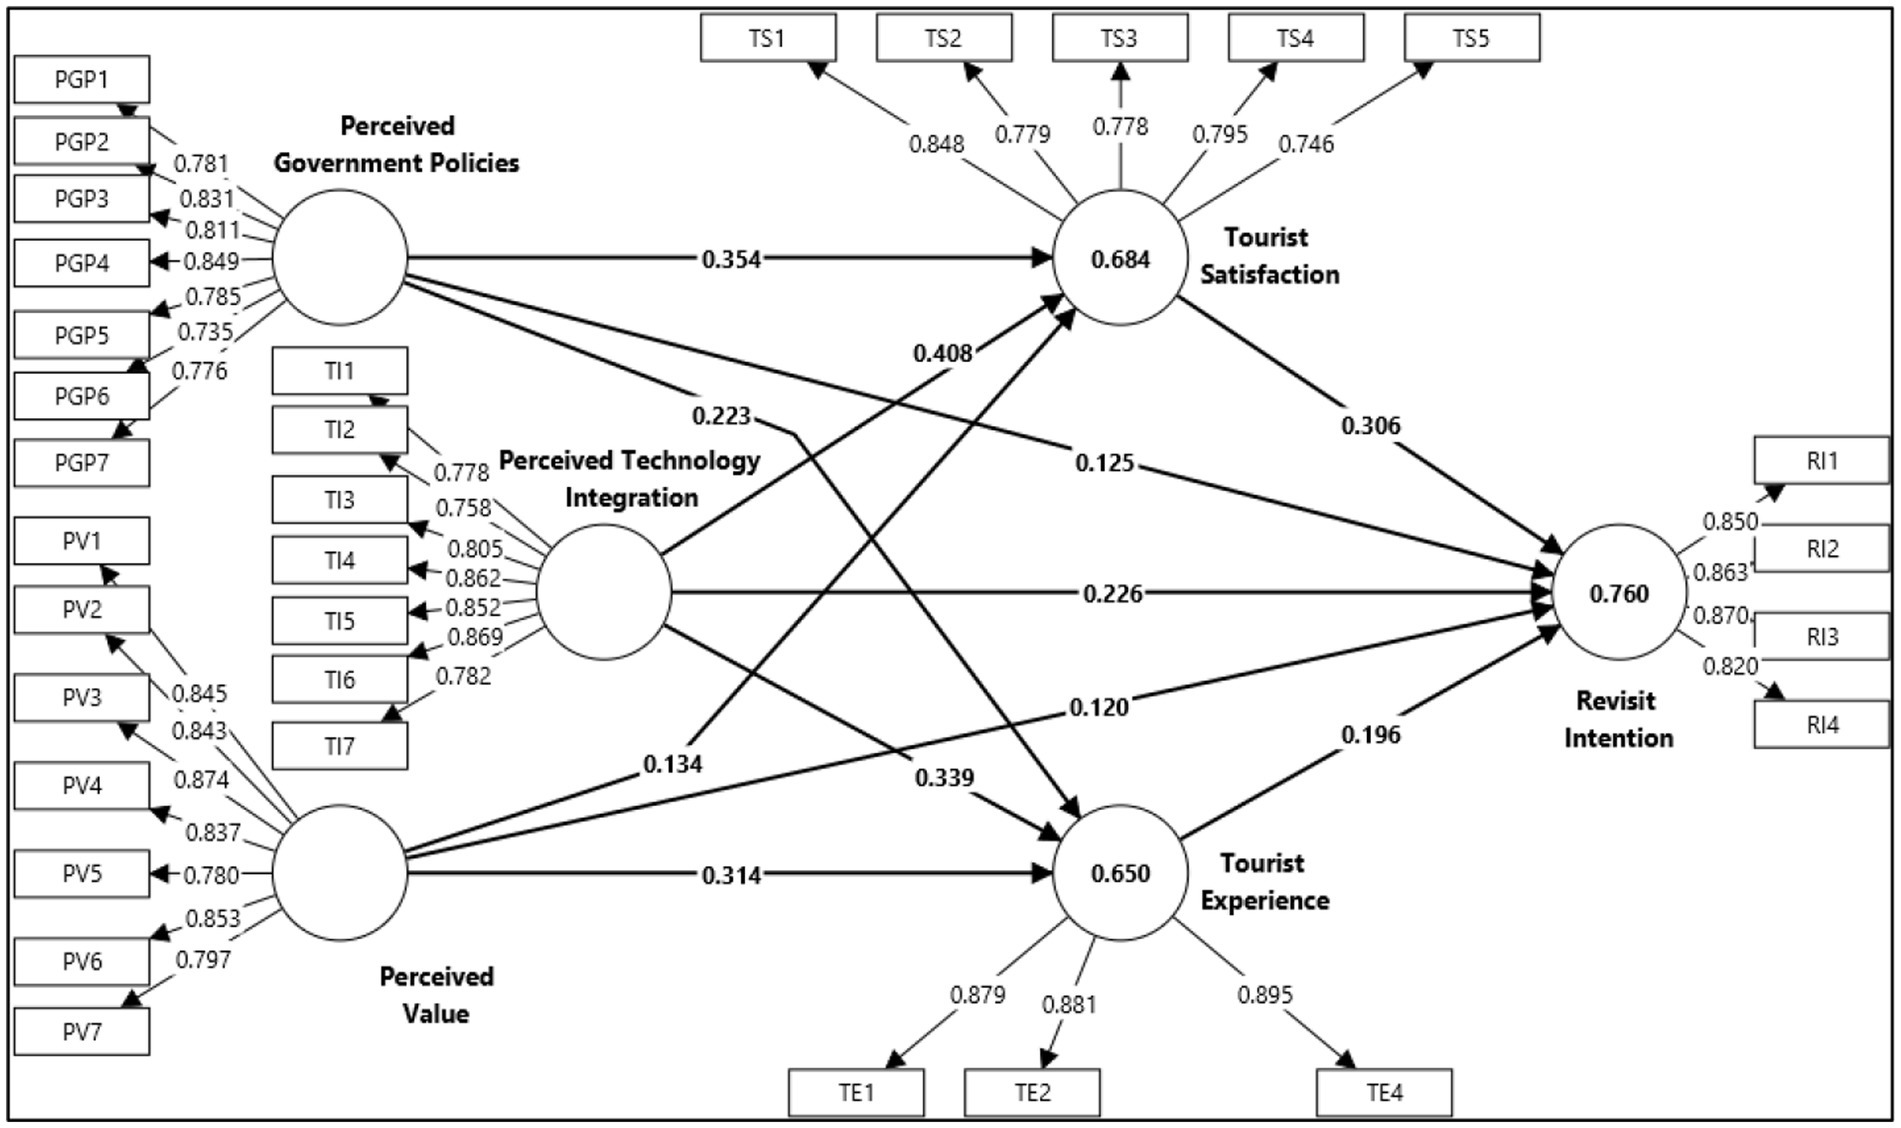
Figure 2. Structural modal.
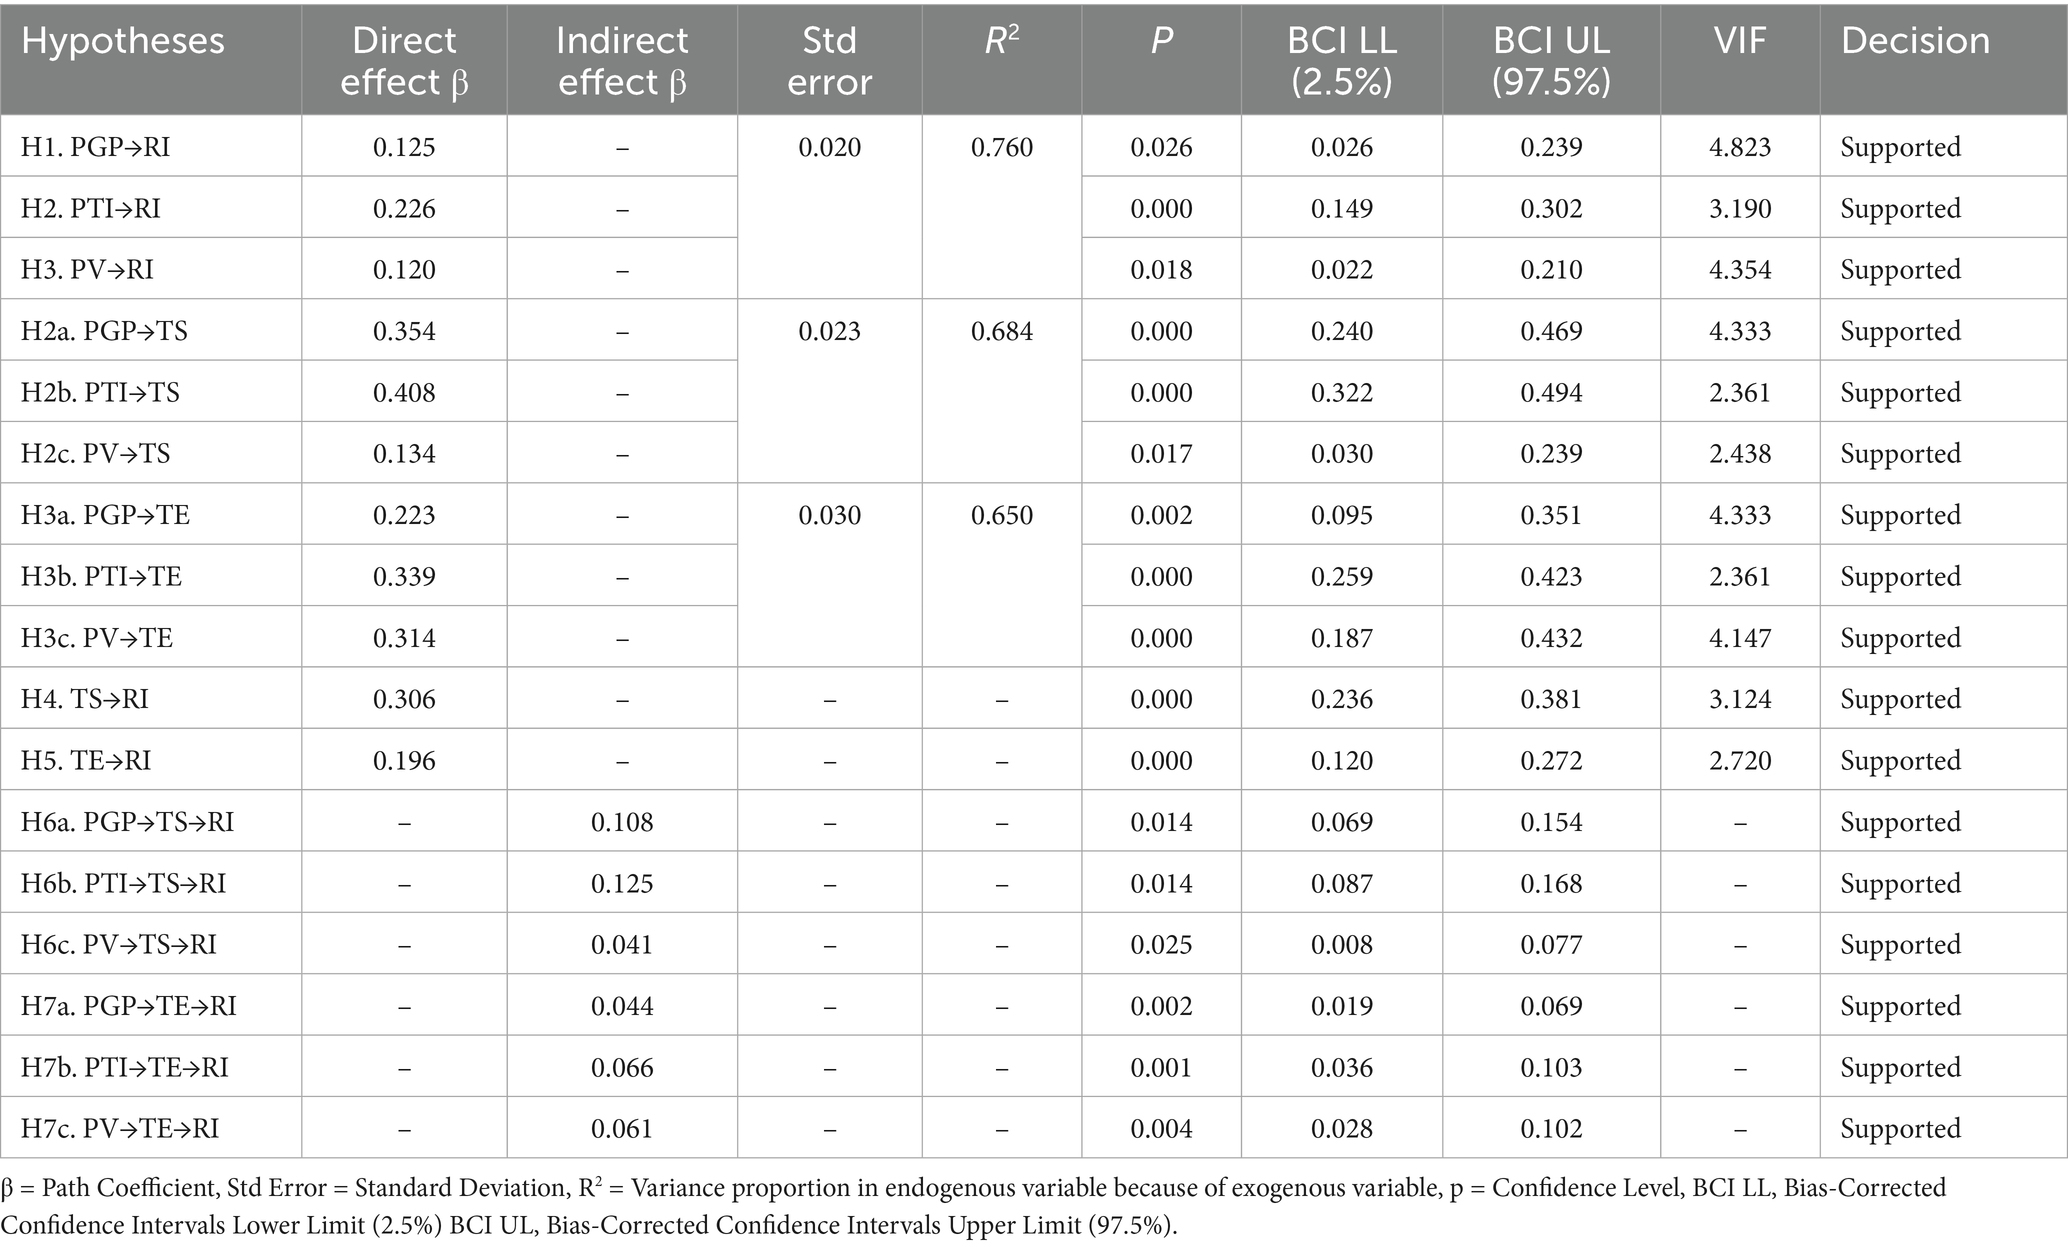
Table 5. Structural model—hypothesis testing.
6 Discussion
The comprehensive support for all hypothesized relationships provides strong empirical validation. Consistent with the S–O–R framework, the effects of PGP, PTI, and PV on RI operate in part indirectly through the organismic states of TS and TE. Importantly, all three enablers also demonstrated significant direct effects on RI, with PTI showing the strongest direct influence. This challenges more traditional, purely linear models of consumer behavior (e.g., a simple satisfaction-loyalty chain), which often posit that external factors only influence behavioral intentions through fully mediated pathways via internal evaluations. Instead, our findings align with the reconceptualization of the S-O-R model that accommodates “nontrace” stimulus–response events (Bigne et al., 2020; Jacoby, 2002), revealing that prominent external enablers can bypass immediate satisfaction or experience processing and directly trigger RI (Cronin et al., 2000; Seetanah et al., 2020; Tran, 2025). In China’s context, this direct influence pathway is particularly evident. Tourists encountering China’s unique digital ecosystem, featuring integrated super apps for diverse services, may immediately perceive an exciting opportunity for future engagement, leading to a direct “I want to return to explore more of this technology” thought before fully processing their overall trip satisfaction. Similarly, visible government investments in high-speed rail, modern infrastructure, and efficient tourism policies can create immediate “future opportunity” or “ease of return” perceptions that directly motivate revisit intentions, especially for those drawn to the country’s rich World Heritage Sites.
Addressing the profound role of technology, PTI emerged as the strongest predictor of both TS and TE. This finding strongly supports recent calls to recognize technology’s central and transformative role in modern tourism experiences (Buhalis and Sinarta, 2019; Neuhofer et al., 2014; Pai et al., 2020; Shariffuddin et al., 2023; Zhou and Sotiriadis, 2021). and indeed, significantly extends existing literature that often positions technology as merely a supporting tool or an environmental antecedent rather than a dominant force. In contrast, some studies highlight cultural or natural attractions as primary drivers (An et al., 2024; Cranmer et al., 2020; Dang and Nguyen, 2023; Tussyadiah and Wang, 2016). Our results from a technologically advanced context like China suggest a fundamental shift. Here, the integrated digital ecosystem creates a unique tourism experience where technology is not just an enabler, but becomes an intrinsic part of the cultural encounter itself. Tourists can seamlessly navigate using mobile payments for everything from street food to luxury hotels, access comprehensive services through super apps combining messaging, payments, bookings, translation, and navigation, and engage with smart tourism features like digital tickets and AI recommendations at attractions. This digital infrastructure does not merely solve travel problems; it fundamentally transforms the tourism experience by enabling instant social sharing, augmented reality features, and location-based discoveries.
Beyond tourist facilitation, the profound integration of technology also carries significant implications for heritage sites themselves. Digital ticketing and real-time visitor monitoring systems, for instance, are crucial tools for crowd management and physical preservation at sensitive historical landmarks. Augmented reality (AR) and virtual reality (VR) applications at sites like the Forbidden City or Temple of Heaven enhance the interpretive experience by bringing history to life, offering reconstruction views, or providing multilingual narratives, thereby enriching the cultural appreciation without requiring physical alterations to the heritage structure. Furthermore, digital platforms can support sustainable tourism by enabling dynamic pricing, managing visitor flow to reduce ecological footprints, and facilitating digital engagement that extends the site’s reach globally, potentially reducing physical visitor pressure on fragile sites while expanding educational access. The profound statistical impact suggests that digital infrastructure has become as crucial to destination competitiveness as traditional attractions, thereby contributing to destination theory by demonstrating an expanded competitive landscape. Countries now compete not just on monuments and scenery, but on how digitally enabled and seamless their tourism experience is, with tourists potentially remembering destinations as much for their technological sophistication as for their cultural offerings, even when the primary draw is a historical or cultural heritage site.
The confirmed partial mediation reveals that tourism enablers influence revisit intention through multiple concurrent pathways. Notably, the mediation patterns differ across enablers: PGP and PTI exerted stronger indirect effects through TS. This pattern is theoretically consistent with Expectation-Confirmation Theory (ECT) (Oliver, 1980), which posits that satisfaction largely stems from a cognitive comparison between pre-trip expectations and post-consumption performance. PGP primarily influences the utilitarian and functional aspects of travel (e.g., ease of entry, safety, infrastructure efficiency), while PTI facilitates practical convenience and efficiency (e.g., seamless payments, navigation). These factors are inherently tied to tangible benefits and the reduction of perceived sacrifices, forming a rational basis for evaluating whether a trip “met expectations.” Thus, their stronger mediation through TS suggests these stimuli are predominantly processed via a cognitive-evaluative organismic state, contributing to a sense of utility and contentment, which then drives revisit intention.
Interestingly, our findings indicate that TS demonstrated a stronger direct effect on RI than TE in this specific context, suggesting that cognitive evaluation processes may carry more weight than purely emotional or sensory dimensions in driving return decisions for tourists visiting China. This finding warrants careful consideration. While TS represents rational comparisons (“Did this trip meet my expectations?” “Was the value worth what I paid?”), TE captures emotional and memorable moments (“How engaging were the activities?” “How unique was this journey?”). This result contributes to the ongoing scholarly debate on the relative importance of satisfaction versus experience in driving loyalty, in contrast to Amissah et al. (2021) and Prayag et al. (2017), who found TE might be stronger if relevant. It suggests that for the tourists in our sample and within the distinct environment of China, including its heritage destinations, even in an era emphasizing experiential tourism and “wow moments,” inherent in visiting historical palaces and imperial gardens, the fundamental mechanism driving tourist behavior for revisit decisions appears to be strongly tied to how destination-level stimuli are processed through organismic states to confirm expectations and deliver perceived value. A tourist might indeed have Instagram-worthy experiences at iconic attractions. However, suppose they perceive poor value, inadequate organization, or unmet promises during the broader trip. In that case, they may be less likely to return than someone with a “good enough” experience who feels expectations were consistently met. This supports the emphasis of ECTs on expectation-performance comparisons for behavioral intentions (Chi et al., 2020; Godovykh and Tasci, 2020; Torabi et al., 2022; Xie et al., 2021). While the literature on loyalty determinants is complex and recognizes various potential moderators and boundary conditions that can shift the relative importance of cognitive versus affective factors, our study provides specific empirical evidence for the salience of reliability and value delivery over potentially inconsistent spectacular experiences for repeat visitation in this setting. For destination managers, this highlights the critical importance of balancing experiential innovation with fundamental service reliability and meticulous expectation management (Chen et al., 2020; Jebbouri et al., 2021; Prayag et al., 2017; Ratih and Noer, 2024).
7 Conclusion
In conclusion, this study offers a comprehensive empirical understanding of the factors driving international tourists’ revisit intentions to China’s world heritage sites, integrating the roles of perceived government policies, perceived technology integration, and perceived value within a model that highlights the mediating influence of tourist satisfaction and tourist experience. By demonstrating that all hypothesized direct and indirect pathways are significant, the research underscores the complex and multifaceted nature of tourist loyalty in this unique destination. The findings highlight that while favorable perceptions of external enablers directly contribute to the desire to return, their most substantial impact is often realized indirectly by fostering higher levels of satisfaction and more positive, memorable experiences. The study provides valuable theoretical validation for applying comprehensive behavioral models in tourism. It offers clear, actionable insights for policymakers, DMOs, and industry practitioners seeking to enhance the appeal and sustainability of China’s heritage tourism and cultivate lasting tourist relationships in a competitive global market. Ultimately, encouraging revisitations hinges on effectively managing the tourist’s perception of the enabling environment in a way that consistently culminates in exceptional value, high satisfaction, and enriching experiences at these culturally significant sites.
7.1 Theoretical implications
Firstly, this study provides robust empirical support for advancing and refining the application of the S-O-R framework in complex international tourism contexts. By encompassing institutional factors (PGP), technological infrastructure (PTI), and the perceived benefit-sacrifice trade-off (PV) as novel and multifaceted Stimuli (S), we extend the traditional conceptualization of environmental cues in destination choice models. Furthermore, the observed significant direct effects of all three stimuli on revisit intention (R), alongside the partial mediation through organismic states (O - satisfaction and experience), refines the S-O-R model by empirically validating the concept of “nontrace” stimulus–response events (Bigne et al., 2020; Jacoby, 2002) within a tourism context. This challenges purely linear S-O-R interpretations that assume all external influences are fully processed through internal cognitive and affective states, demonstrating that certain salient stimuli can immediately shape behavioral intentions.
Secondly, the research advances the understanding of organismic pathways within S-O-R by specifying how technology and policy-related stimuli are transmitted to revisit intention through distinct mediations. Our findings reveal that PGP and PTI primarily operate through TS, aligning with Expectation-Confirmation Theory by emphasizing cognitive evaluations of functional benefits and efficiency. Conversely, PV’s stronger mediation through TE highlights its role in shaping the more holistic and affective dimensions of the travel journey, consistent with insights from the Experience Economy paradigm. This differential mediation refines existing theories on destination competitiveness and tourism experience, particularly highlighting technology’s shift from a mere background support tool to a fundamental determinant that significantly shapes tourists’ internal evaluations (TS and TE), going beyond traditional emphases on service quality or product attributes alone. This nuanced understanding enriches the S-O-R model by illustrating that the nature of the stimulus influences the specific organismic processing pathway.
Thirdly, the study refines the theoretical understanding of PV by demonstrating its significant influence on both TS and TE, and by highlighting its relatively stronger indirect pathway to revisit intention via the cultivation of a positive overall tourist experience. This finding challenges the notion that value is predominantly a cognitive input for satisfaction, instead suggesting that PV is also integral to shaping the travel journey’s richer, more affective, and holistic dimensions, consistent with multi-dimensional consumption value theories. It shows that the ‘worth’ of a trip profoundly impacts the depth of engagement and emotional connection, not just rational assessment.
Finally, this research advances theories on destination governance and tourist behavior by empirically demonstrating that tourists’ perceptions of governmental structures and processes (PGP) have tangible effects on their evaluations (TS, TE) and future intentions (RI). This explicitly bridges a theoretical gap between macro-level governance and micro-level tourist behavior, showing how abstract policies translate into concrete impacts on how tourists perceive and decide about a destination. It suggests that governmental efforts in areas like safety, infrastructure, and visa policies are not just operational necessities but direct stimuli that significantly shape the S-O-R sequence, thereby meriting greater integration into theoretical models of destination image and competitiveness.
7.2 Practical implications
The study’s findings provide valuable and actionable insights for stakeholders involved in promoting China as an international tourism destination. The comprehensive support for the model underscores the necessity of an integrated strategy that simultaneously addresses PGP, PTI, and PV, as focusing on any single factor in isolation may not be sufficient to optimize RI.
The significant influence of PGP highlights that the efficacy of policy initiatives depends critically on how international tourists perceive them, not just their administrative implementation. Policymakers should actively solicit feedback from international tourists regarding visa processes, border control efficiency, safety regulations, and public infrastructure quality. Policies should be designed with an explicit tourist-centric lens, aiming for tangible benefits such as simplified visa applications, streamlined entry procedures, robust multilingual safety information systems, and investment in modern, accessible transportation networks. Furthermore, proactive and clear communication about these favorable policies through international media, tourism boards, and diplomatic channels is essential to shape positive perceptions and build trust, directly enhancing both TS and TE.
Furthermore, the findings underscore the need for a dynamic and dual-focused marketing and development strategy. DMOs must focus efforts on enhancing the overall PV proposition of visiting China, emphasizing both its unique cultural heritage and its distinctive technological modernity. Given PTI’s emergence as the strongest predictor of TS and TE, DMOs should actively promote the seamlessness and benefits of China’s digital ecosystem in marketing campaigns, perhaps by showcasing how integrated super apps simplify travel and how technology enhances the interpretive value and accessibility of heritage sites. They should also develop and widely disseminate practical resources and guidance (e.g., pre-arrival digital guides, dedicated WeChat mini-programs, English-language tutorials) to help international tourists effectively navigate this environment, addressing potential initial friction. Marketing campaigns should leverage digital storytelling to showcase authentic, positive, and technologically-enabled tourist experiences that highlight China’s rich history alongside its modern advancements.
The study reinforces the fundamental importance of operational excellence and strategic technological adoption. Service providers must prioritize delivering high levels of service quality that contribute directly to TS, ensuring that basic expectations regarding accommodation, transport, and hospitality are consistently met or exceeded. Beyond this, they should actively contribute to positive TE through engaging interactions, facilitating access to digital tools, and showcasing unique cultural elements in ways that align with the PV. This includes investing in staff training to enhance digital literacy among frontline employees, equipping them to assist international visitors with technology-related issues (e.g., mobile payments, app usage) and language barriers. Crucially, for heritage site managers, implementing smart tourism technologies (e.g., digital ticketing for crowd control, interactive exhibits using AR/VR for enhanced interpretation, and AI-powered multilingual guides) is vital for both enriching the visitor experience and supporting sustainable preservation efforts. These technologies at the service level can significantly enhance both TS and the overall TE, fostering memorable and convenient visits while ensuring the long-term integrity of the heritage assets.
8 Limitations and future research
While this study offers valuable insights into the drivers of international tourist revisit intentions to China’s World Heritage Sites, it is important to acknowledge certain limitations that also pave the way for future research.
Firstly, the cross-sectional design of this study captures perceptions at a single point in time. This approach, while effective for assessing current relationships, cannot fully capture the dynamic and evolving nature of tourist perceptions and intentions over a longer period. Future research could employ a longitudinal design to observe changes in perceived policies, technology, value, satisfaction, and experience, and their long-term effects on revisit intentions.
Secondly, the use of systematic convenience sampling, while pragmatic for accessing a mobile international tourist population, inherently limits the statistical generalizability of our findings to all international tourists visiting China or other heritage sites globally. While our large sample size and diverse demographic profile enhance internal validity, future studies could aim for broader geographic representation (e.g., other regions in China, other heritage destinations worldwide) or employ more robust sampling techniques if feasible, to enhance external validity.
Thirdly, our study focused on three specific World Heritage Sites in Beijing. While these sites are highly significant, the unique characteristics and management contexts of other heritage sites (e.g., natural heritage sites, smaller cultural sites, sites with different levels of technological integration) might lead to different outcomes. Future research could explore the model’s applicability across a wider variety of heritage site types and contexts to identify potential boundary conditions or moderating effects.
Fourthly, the reliance on self-reported survey data is subject to common method bias. While we employed rigorous scale validation and statistical checks (e.g., HTMT ratios), future studies could consider incorporating objective measures where possible (e.g., actual visitor numbers, duration of stay, spending data) or utilize mixed-methods approaches (e.g., observational data, interviews) to triangulate findings and provide deeper qualitative insights.
Finally, the current model focused on PGP, PTI, and PV as key stimuli. Future research could expand this framework to include other relevant macro-level factors (e.g., geopolitical relations, global economic conditions, environmental sustainability initiatives perceived by tourists) or micro-level variables (e.g., specific cultural motivations, novelty seeking, personal values) to offer an even more comprehensive understanding of revisit intentions in complex tourism environments. Additionally, investigating potential moderating roles of tourist demographics (e.g., age, nationality, prior travel experience) could reveal further nuances in how different tourist segments respond to these stimuli.
Data availability statement
The datasets presented in this study can be found in online repositories. The names of the repository/repositories and accession number(s) can be found below: https://doi.org/10.5281/zenodo.17355489.
Ethics statement
The study received ethical approval for a survey from the Institutional Ethical Review Boards (IRB) of Inner Mongolia University of Finance and Economics (Approval No. IERB-SED/2303/2025), approved on March 03, 2025. The studies were conducted in accordance with the local legislation and institutional requirements. The participants provided their written informed consent to participate in this study. Written informed consent was obtained from the individual(s) for the publication of any potentially identifiable images or data included in this article.
Author contributions
TZ: Conceptualization, Data curation, Formal analysis, Funding acquisition, Investigation, Methodology, Project administration, Resources, Software, Supervision, Validation, Visualization, Writing – original draft, Writing – review & editing. AJ: Conceptualization, Data curation, Formal analysis, Funding acquisition, Investigation, Methodology, Project administration, Resources, Software, Supervision, Validation, Visualization, Writing – original draft, Writing – review & editing.
Funding
The author(s) declare that financial support was received for the research and/or publication of this article. This research was supported by the Inner Mongolia Autonomous Region University Scientific Research General Project “Research on the Construction and Quality Evaluation of the Tourism Public Service System in Inner Mongolia (NJSY23033)” and the Inner Mongolia Industrial Development Base Project “Spatial Process and Enhancement Strategies of Collaborative Evolution of Public Cultural Services in the Hohhot-Baotou-Ordos-Ulanqab Region (2023YB006)”.
Conflict of interest
The authors declare that the research was conducted in the absence of any commercial or financial relationships that could be construed as a potential conflict of interest.
Generative AI statement
The authors declare that no Gen AI was used in the creation of this manuscript.
Any alternative text (alt text) provided alongside figures in this article has been generated by Frontiers with the support of artificial intelligence and reasonable efforts have been made to ensure accuracy, including review by the authors wherever possible. If you identify any issues, please contact us.
Publisher’s note
All claims expressed in this article are solely those of the authors and do not necessarily represent those of their affiliated organizations, or those of the publisher, the editors and the reviewers. Any product that may be evaluated in this article, or claim that may be made by its manufacturer, is not guaranteed or endorsed by the publisher.
References
Ahn, J., and Kwon, J. (2020). Green hotel brands in Malaysia: perceived value, cost, anticipated emotion, and revisit intention. Curr. Issues Tour. 23, 1559–1574. doi: 10.1080/13683500.2019.1646715
Akhshik, A., Rezapouraghdam, H., Ozturen, A., and Ramkissoon, H. (2023). Memorable tourism experiences and critical outcomes among nature-based visitors: a fuzzy-set qualitative comparative analysis approach. Curr. Issues Tour. 26, 2981–3003. doi: 10.1080/13683500.2022.2106196
Allaberganov, A., and Preko, A. (2022). Inbound international tourists' demographics and travel motives: views from Uzbekistan. J. Hosp. Tour. Insights 5, 99–115. doi: 10.1108/JHTI-09-2020-0181
Amissah, E. F., Addison-Akotoye, E., and Blankson-Stiles-Ocran, S. (2021). “Service quality, tourist satisfaction, and destination loyalty in emerging economies” in Marketing tourist destinations in emerging economies: Towards competitive and sustainable emerging tourist destinations. (Cham, Switzerland: Springer), 121–147.
An, L. T., Hung, P. X., Dung, T. Q., Dinh, N. C., Kien, N. D., Tri, T. M., et al. (2024). Exploring relationships between nature-based destination attractiveness, satisfaction, perceived COVID-19 risk, and revisit intention in Bach ma National Park, Vietnam. SAGE Open 14:21582440241289989. doi: 10.1177/21582440241289989
Baghirov, F., Bozbay, Z., and Zhang, Y. (2023). Individual factors impacting tourist satisfaction and revisit intention in slow tourism cities: an extended model. Int. J. Tourism Cities. doi: 10.1108/IJTC-05-2023-0094
Bagozzi, R. P. (1986). Attitude formation under the theory of reasoned action and a purposeful behaviour reformulation. Br. J. Soc. Psychol. 25, 95–107. doi: 10.1111/j.2044-8309.1986.tb00708.x
Baloglu, S., and McCleary, K. W. (1999). A model of destination image formation. Ann. Tour. Res. 26, 868–897. doi: 10.1016/S0160-7383(99)00030-4
Bigne, E., Chatzipanagiotou, K., and Ruiz, C. (2020). Pictorial content, sequence of conflicting online reviews and consumer decision-making: the stimulus-organism-response model revisited. J. Bus. Res. 115, 403–416. doi: 10.1016/j.jbusres.2019.11.031
Buhalis, D., and Law, R. (2008). Progress in information technology and tourism management: 20 years on and 10 years after the Internet—The state of eTourism research. Tour. Manag. 29, 609–623. doi: 10.1016/j.tourman.2008.01.005
Buhalis, D., and Sinarta, Y. (2019). Real-time co-creation and nowness service: lessons from tourism and hospitality. J. Travel Tourism Mark. 36, 563–582. doi: 10.1080/10548408.2019.1592059
Calza, F., Pagliuca, M., Risitano, M., and Sorrentino, A. (2020). Testing moderating effects on the relationships among on-board cruise environment, satisfaction, perceived value and behavioral intentions. Int. J. Contemp. Hospit. Manag. 32, 934–952. doi: 10.1108/IJCHM-09-2019-0773
Carvache-Franco, M., Alvarez-Risco, A., Carvache-Franco, O., Carvache-Franco, W., Estrada-Merino, A., and Villalobos-Alvarez, D. (2022). Perceived value and its influence on satisfaction and loyalty in a coastal city: a study from Lima, Peru. J. Policy Res. Tour. Leis. Events 14, 115–130. doi: 10.1080/19407963.2021.1883634
Chen, C.-F., and Chen, F.-S. (2010). Experience quality, perceived value, satisfaction and behavioral intentions for heritage tourists. Tour. Manag. 31, 29–35. doi: 10.1016/j.tourman.2009.02.008
Chen, X., Cheng, Z.-f., and Kim, G.-B. (2020). Make it memorable: tourism experience, fun, recommendation and revisit intentions of Chinese outbound tourists. Sustainability 12:1904. doi: 10.3390/su12051904
Chen, S., Tian, Y., and Pei, S. (2024). Technological use from the perspective of cultural heritage environment: augmented reality technology and formation mechanism of heritage-responsibility behaviors of tourists. Sustainability 16:8261. doi: 10.3390/su16188261
Chen, C.-F., and Tsai, D. (2007). How destination image and evaluative factors affect behavioral intentions? Tour. Manag. 28, 1115–1122. doi: 10.1016/j.tourman.2006.07.007
Chi, X., Lee, S. K., Ahn, Y.-j., and Kiatkawsin, K. (2020). Tourist-perceived quality and loyalty intentions towards rural tourism in China. Sustainability 12:3614. doi: 10.3390/su12093614
Chi, C. G.-Q., and Qu, H. (2008). Examining the structural relationships of destination image, tourist satisfaction and destination loyalty: an integrated approach. Tour. Manag. 29, 624–636. doi: 10.1016/j.tourman.2007.06.007
Chi, C. G.-Q., and Qu, H. (2009). Examining the relationship between tourists’ attribute satisfaction and overall satisfaction. J. Hosp. Mark. Manag. 18, 4–25. doi: 10.1080/19368620801988891
Cranmer, E. E., tom Dieck, M. C., and Fountoulaki, P. (2020). Exploring the value of augmented reality for tourism. Tour. Manag. Perspect. 35:100672. doi: 10.1016/j.tmp.2020.100672
Cronin, J. J. Jr., Brady, M. K., and Hult, G. T. M. (2000). Assessing the effects of quality, value, and customer satisfaction on consumer behavioral intentions in service environments. J. Retail. 76, 193–218. doi: 10.1016/S0022-4359(00)00028-2
Cui, F., Liu, Y., Chang, Y., Duan, J., and Li, J. (2016). An overview of tourism risk perception. Nat. Hazards 82, 643–658. doi: 10.1007/s11069-016-2208-1
Dang, T., and Nguyen, M. (2023). Systematic review and research agenda for the tourism and hospitality sector: co-creation of customer value in the digital age. Future Bus. J. 9:94. doi: 10.1186/s43093-023-00274-5
Davras, Ö., and Özperçin, İ. (2023). The relationships of motivation, service quality, and behavioral intentions for gastronomy festival: the mediating role of destination image. J. Policy Res. Tour. Leis. Events 15, 451–464. doi: 10.1080/19407963.2021.1968881
de Freitas Coelho, M., de Sevilha Gosling, M., and de Almeida, A. S. A. (2018). Tourism experiences: Core processes of memorable trips. J. Hosp. Tour. Manag. 37, 11–22. doi: 10.1016/j.jhtm.2018.08.004
Duan, T., Jiang, H., Deng, X., Zhang, Q., and Wang, F. (2020). Government intervention, risk perception, and the adoption of protective action recommendations: evidence from the COVID-19 prevention and control experience of China. Int. J. Environ. Res. Public Health 17:3387. doi: 10.3390/ijerph17103387
Fornell, C., and Larcker, D. F. (1981). Evaluating structural equation models with unobservable variables and measurement error. J. Mark. Res. 18, 39–50. doi: 10.1177/002224378101800104
Foroudi, P., Palazzo, M., and Sultana, A. (2021). Linking brand attitude to word-of-mouth and revisit intentions in the restaurant sector. Br. Food J. 123, 221–240. doi: 10.1108/BFJ-11-2020-1008
Gallarza-Granizo, M. G., Ruiz-Molina, M.-E., and Schlosser, C. (2020). Customer value in quick-service restaurants: a cross-cultural study. Int. J. Hospit. Manag. 85:102351. doi: 10.1016/j.ijhm.2019.102351
Gao, J., Ryan, C., Zhang, C., and Cui, J. (2022). The evolution of Chinese border tourism policies: an intergovernmental perspective on border tourism in Xishuangbanna. Asia Pac. J. Tourism Res. 27, 157–172. doi: 10.1080/10941665.2021.2020313
Ghorbanzadeh, D., Shabbir, M. S., Mahmood, A., and Kazemi, E. (2021). Investigating the role of experience quality in predicting destination image, perceived value, satisfaction, and behavioural intentions: a case of war tourism. Curr. Issues Tour. 24, 3090–3106. doi: 10.1080/13683500.2020.1863924
Godovykh, M., Pizam, A., and Bahja, F. (2021). Antecedents and outcomes of health risk perceptions in tourism, following the COVID-19 pandemic. Tour. Rev. 76, 737–748. doi: 10.1108/TR-06-2020-0257
Godovykh, M., and Tasci, A. D. (2020). Customer experience in tourism: a review of definitions, components, and measurements. Tour. Manag. Perspect. 35:100694. doi: 10.1016/j.tmp.2020.100694
Gretzel, U., Fuchs, M., Baggio, R., Hoepken, W., Law, R., Neidhardt, J., et al. (2020). E-tourism beyond COVID-19: a call for transformative research. Inf. Technol. Tourism 22, 187–203. doi: 10.1007/s40558-020-00181-3
Groves, R. M., Fowler, F. J. Jr., Couper, M. P., Lepkowski, J. M., Singer, E., and Tourangeau, R. (2011). Survey methodology (2nd ed.). Hoboken, NJ: John Wiley & Sons.
Gu, J. (2024). Does the visa-free policy promote inbound tourism? Evidence from China. SAGE Open 14:21582440241261676. doi: 10.1177/21582440241261676
Hair, J., and Alamer, A. (2022). Partial least squares structural equation modeling (PLS-SEM) in second language and education research: guidelines using an applied example. Res. Methods Appl. Linguist. 1:100027. doi: 10.1016/j.rmal.2022.100027
Hair, J. F. Jr., Babin, B. J., and Krey, N. (2017). Covariance-based structural equation modeling in the Journal of advertising: review and recommendations. J. Advert. 46, 163–177. doi: 10.1080/00913367.2017.1281777
Hall, C. M. (2008). Tourism planning: Policies, processes and relationships (2nd ed.). London, UK: Pearson education.
Harwit, E. (2017). Wechat: social and political development of China’s dominant messaging app. Chin. J. Commun. 10, 312–327. doi: 10.1080/17544750.2016.1213757
Henseler, J., Ringle, C. M., and Sarstedt, M. (2015). A new criterion for assessing discriminant validity in variance-based structural equation modeling. J. Acad. Mark. Sci. 43, 115–135. doi: 10.1007/s11747-014-0403-8
Jacoby, J. (2002). Stimulus-organism-response reconsidered: an evolutionary step in modeling (consumer) behavior. J. Consum. Psychol. 12, 51–57. doi: 10.1207/S15327663JCP1201_05
Jamal, T., and Budke, C. (2020). Tourism in a world with pandemics: local-global responsibility and action. J. Tourism Futures 6, 181–188. doi: 10.1108/JTF-02-2020-0014
Jebbouri, A., Zhang, H., Imran, Z., Iqbal, J., and Bouchiba, N. (2022). Impact of destination image formation on tourist trust: mediating role of tourist satisfaction. Front. Psychol. 13:845538. doi: 10.3389/fpsyg.2022.845538
Jebbouri, A., Zhang, H., Wang, L., and Bouchiba, N. (2021). Exploring the relationship of image formation on tourist satisfaction and loyalty: evidence from China. Front. Psychol. 12:748534. doi: 10.3389/fpsyg.2021.748534
Jeong, Y., and Kim, S. (2020). A study of event quality, destination image, perceived value, tourist satisfaction, and destination loyalty among sport tourists. Asia Pac. J. Mark. Logist. 32, 940–960. doi: 10.1108/APJML-02-2019-0101
Khan, N., Hassan, A. U., Fahad, S., and Naushad, M. (2020). Factors affecting tourism industry and its impacts on global economy of the world. SSRN Elect. J. doi: 10.2139/ssrn.3559353
Khan, M. N., Shahzad, K., Ahmad, I., and Bartels, J. (2023). Boss, look at me: how and when supervisor’s phubbing behavior affects employees’ supervisor identification. Curr. Psychol. 42, 31064–31078. doi: 10.1007/s12144-022-04120-9
Kim, D. H., and Jeong, Y. (2024). Examining the moderating effect of perceived risk from particulate matter on outdoor sports participants: a theory of planned behavior perspective. Front. Public Health 12:1340502. doi: 10.3389/fpubh.2024.1340502
Kim, M. J., Lee, C.-K., and Jung, T. (2020). Exploring consumer behavior in virtual reality tourism using an extended stimulus-organism-response model. J. Travel Res. 59, 69–89. doi: 10.1177/0047287518818915
Kim, J.-H., Ritchie, J. B., and McCormick, B. (2012). Development of a scale to measure memorable tourism experiences. J. Travel Res. 51, 12–25. doi: 10.1177/0047287510385467
Kline, R. B. (2023). Principles and practice of structural equation modeling (5th ed.). New York, NY: Guilford Publications.
Kozak, M., and Rimmington, M. (2000). Tourist satisfaction with Mallorca, Spain, as an off-season holiday destination. J. Travel Res. 38, 260–269. doi: 10.1177/004728750003800308
Krey, N., tom Dieck, M. C., Wu, S., and Fountoulaki, P. (2023). Exploring the influence of touch points on tourist experiences at crisis impacted destinations. J. Travel Res. 62, 39–54. doi: 10.1177/00472875211053657
Leckie, C., Nyadzayo, M. W., and Johnson, L. W. (2018). Promoting brand engagement behaviors and loyalty through perceived service value and innovativeness. J. Serv. Mark. 32, 70–82. doi: 10.1108/JSM-01-2017-0035
Lee, D. H. (2020). The impact of exhibition service quality on general attendees’ satisfaction through distinct mediating roles of perceived value. Asia Pac. J. Mark. Logist. 32, 793–816. doi: 10.1108/APJML-09-2018-0373
Leung, X. Y., Sun, J., and Bai, B. (2019). Thematic framework of social media research: state of the art. Tour. Rev. 74, 517–531. doi: 10.1108/TR-05-2018-0058
Li, X., Du, M., Zhang, Y., and Yang, J. (2022). Identifying the factors influencing the choice of different ride-hailing services in Shenzhen, China. Travel Behav. Soc. 29, 53–64. doi: 10.1016/j.tbs.2022.05.006
Liu, R. (2020). The state-led tourism development in Beijing's ecologically fragile periphery: peasants' response and challenges. Habitat Int. 96:102119. doi: 10.1016/j.habitatint.2020.102119
Liu, X., Li, J., and Kim, W. G. (2017). The role of travel experience in the structural relationships among tourists’ perceived image, satisfaction, and behavioral intentions. Tour. Hospit. Res. 17, 135–146. doi: 10.1177/1467358415610371
Maghrifani, D., Liu, F., and Sneddon, J. (2022). Understanding potential and repeat visitors’ travel intentions: the roles of travel motivations, destination image, and visitor image congruity. J. Travel Res. 61, 1121–1137. doi: 10.1177/00472875211018508
Majeed, S., Zhou, Z., Lu, C., and Ramkissoon, H. (2020). Online tourism information and tourist behavior: a structural equation modeling analysis based on a self-administered survey. Front. Psychol. 11:599. doi: 10.3389/fpsyg.2020.00599
Martins, W. S., Martins, M., and Morais, E. P. (2025). Exploring the influence of social media on tourist decision-making: insights from Cape Verde. Tour. Hosp. 6:45. doi: 10.3390/tourhosp6010045
Masroor, Z., and Shiva, A. (2024). Too crowded to fall in love? The destination image trident versus social crowding. Asia Pac. J. Tourism Res. 29, 65–78. doi: 10.1080/10941665.2024.2308849
Mehrabian, A., and Russell, J. A. (1974). An approach to environmental psychology. Cambridge, MA: MIT Press.
Morosan, C., and DeFranco, A. (2016). It's about time: revisiting UTAUT2 to examine consumers’ intentions to use NFC mobile payments in hotels. Int. J. Hosp. Manag. 53, 17–29. doi: 10.1016/j.ijhm.2015.11.003
Neuhofer, B., Buhalis, D., and Ladkin, A. (2014). A typology of technology-enhanced tourism experiences. Int. J. Tourism Res. 16, 340–350. doi: 10.1002/jtr.1958
Nguyen Viet, B., Dang, H. P., and Nguyen, H. H. (2020). Revisit intention and satisfaction: the role of destination image, perceived risk, and cultural contact. Cogent Bus Manag 7:1796249. doi: 10.1080/23311975.2020.1796249
Nguyen-Viet, B., Nguyen My, P., and Dang-Van, T. (2025). Enhance domestic tourists’ revisit intention in spiritual destinations originating in patriotism and religious orientation. J. Hosp. Tour. Insights 8, 1687–1703. doi: 10.1108/JHTI-09-2024-0905
Oliver, R. L. (1980). A cognitive model of the antecedents and consequences of satisfaction decisions. J. Mark. Res. 17, 460–469. doi: 10.1177/002224378001700405
Oppermann, M. (2000). Tourism destination loyalty. J. Travel Res. 39, 78–84. doi: 10.1177/004728750003900110
Oriade, A., and Schofield, P. (2019). An examination of the role of service quality and perceived value in visitor attraction experience. J. Destin. Mark. Manag. 11, 1–9. doi: 10.1016/j.jdmm.2018.10.002
Pai, C., Kang, S., Liu, Y., and Zheng, Y. (2021). An examination of revisit intention based on perceived smart tourism technology experience. Sustainability 13:1007. doi: 10.3390/su13021007
Pai, C.-K., Liu, Y., Kang, S., and Dai, A. (2020). The role of perceived smart tourism technology experience for tourist satisfaction, happiness and revisit intention. Sustainability 12:6592. doi: 10.3390/su12166592
Parasuraman, A., Zeithaml, V. A., and Berry, L. L. (1988). Servqual: a multiple-item scale for measuring consumer perc. J. Retail. 64:12.
Patwary, A. K., Mohamed, M., Rabiul, M. K., Mehmood, W., Ashraf, M. U., and Adamu, A. A. (2022). Green purchasing behaviour of international tourists in Malaysia using green marketing tools: theory of planned behaviour perspective. Nankai Bus. Rev. Int. 13, 246–265. doi: 10.1108/NBRI-06-2021-0044
Pencarelli, T. (2020). The digital revolution in the travel and tourism industry. Inf. Technol. Tourism 22, 455–476. doi: 10.1007/s40558-019-00160-3
Petrick, J. F. (2002). Development of a multi-dimensional scale for measuring the perceived value of a service. J. Leis. Res. 34, 119–134. doi: 10.1080/00222216.2002.11949965
Prayag, G., Hosany, S., Muskat, B., and Del Chiappa, G. (2017). Understanding the relationships between tourists’ emotional experiences, perceived overall image, satisfaction, and intention to recommend. J. Travel Res. 56, 41–54. doi: 10.1177/0047287515620567
Prayag, G., Hosany, S., and Odeh, K. (2013). The role of tourists' emotional experiences and satisfaction in understanding behavioral intentions. J. Destin. Mark. Manag. 2, 118–127. doi: 10.1016/j.jdmm.2013.05.001
Rahman, A., Farooq, N., Haleem, M., Shah, S. M. A., and El-Gohary, H. (2023). Exploring the pathways to tourist loyalty in Pakistani tourism industry: the role of destination image, service quality, E-WOM, and social media. Sustainability 15:16601. doi: 10.3390/su152416601
Rane, N., Choudhary, S., and Rane, J. (2023). Sustainable tourism development using leading-edge artificial intelligence (AI), blockchain, internet of things (IoT), augmented reality (AR) and virtual reality (VR) technologies. doi: 10.2139/ssrn.4642605
Rasoolimanesh, S. M., Chee, S. Y., and Ari Ragavan, N. (2025). Tourists’ perceptions of the sustainability of destination, satisfaction, and revisit intention. Tour. Recreat. Res. 50, 106–125. doi: 10.1080/02508281.2023.2230762
Rasoolimanesh, S. M., Seyfi, S., Rather, R. A., and Hall, C. M. (2022). Investigating the mediating role of visitor satisfaction in the relationship between memorable tourism experiences and behavioral intentions in heritage tourism context. Tour. Rev. 77, 687–709. doi: 10.1108/TR-02-2021-0086
Ratih, I., and Noer, L. (2024). Impact of tourist experience on satisfaction and revisit intention: a bibliometric review and content analysis. J. Econ. Bus. Account. 7, 602–613. doi: 10.31539/costing.v7i5.11263
Regalado-Pezúa, O., Carvache-Franco, M., Carvache-Franco, O., and Carvache-Franco, W. (2023). Perceived value and its relationship to satisfaction and loyalty in cultural coastal destinations: a study in Huanchaco, Peru. PLoS One 18:e0286923. doi: 10.1371/journal.pone.0286923
Saut, M., and Bie, S. (2024). Impact of service expectation, experiential quality, and perceived value on hotel customer satisfaction. J. Qual. Assur. Hosp. Tour. 25, 781–809. doi: 10.1080/1528008X.2022.2141414
Seetanah, B., Teeroovengadum, V., and Nunkoo, R. (2020). Destination satisfaction and revisit intention of tourists: does the quality of airport services matter? J. Hosp. Tour. Res. 44, 134–148. doi: 10.1177/1096348018798446
Shariffuddin, N. S. M., Azinuddin, M., Yahya, N. E., and Hanafiah, M. H. (2023). Navigating the tourism digital landscape: the interrelationship of online travel sites' affordances, technology readiness, online purchase intentions, trust, and E-loyalty. Heliyon 9:e19135. doi: 10.1016/j.heliyon.2023.e19135
Shih, I.-T., Silalahi, A. D. K., Baljir, K., and Jargalsaikhan, S. (2024). Exploring the impact of perceived sustainability on customer satisfaction and the mediating role of perceived value. Cogent Bus Manag 11:2431647. doi: 10.1080/23311975.2024.2431647
Sparks, B. A., and Browning, V. (2011). The impact of online reviews on hotel booking intentions and perception of trust. Tour. Manag. 32, 1310–1323. doi: 10.1016/j.tourman.2010.12.011
Su, M. M., and Wall, G. (2014). Community participation in tourism at a world heritage site: Mutianyu Great Wall, Beijing, China. Int. J. Tour. Res. 16, 146–156. doi: 10.1002/jtr.1909
Suhartanto, D., Dean, D., Wibisono, N., Astor, Y., Muflih, M., Kartikasari, A., et al. (2021). Tourist experience in halal tourism: what leads to loyalty? Curr. Issues Tour. 24, 1976–1990. doi: 10.1080/13683500.2020.1813092
Sweeney, J. C., and Soutar, G. N. (2001). Consumer perceived value: the development of a multiple item scale. J. Retail. 77, 203–220. doi: 10.1016/S0022-4359(01)00041-0
Tang, X. (2017). The historical evolution of China's tourism development policies (1949–2013)–a quantitative research approach. Tour. Manag. 58, 259–269. doi: 10.1016/j.tourman.2016.03.010
Tanrikulu, C. (2021). Theory of consumption values in consumer behaviour research: a review and future research agenda. Int. J. Consum. Stud. 45, 1176–1197. doi: 10.1111/ijcs.12687
Thanikkad, J., and Kumar, S. (2022). The perceptions turned chaff at the destination–experience effect on cultural tourists' satisfaction. Int. J. Leis. Tour. Mark. 7, 215–234. doi: 10.1504/IJLTM.2022.122453
Tian, M., Cànoves, G., Chu, Y., Font-Garolera, J., and Prat Forga, J. M. (2021). Influence of cultural background on visitor segments’ tourist destination image: a case study of Barcelona and Chinese tourists. Land 10:626. doi: 10.3390/land10060626
Torabi, Z.-A., Shalbafian, A. A., Allam, Z., Ghaderi, Z., Murgante, B., and Khavarian-Garmsir, A. R. (2022). Enhancing memorable experiences, tourist satisfaction, and revisit intention through smart tourism technologies. Sustainability 14:2721. doi: 10.3390/su14052721
Tran, C. Q. (2025). Evaluating the impact of government policies on tourist satisfaction in Vietnam: a GSCA approach. Ho Chi Minh City Open Univ. J. Sci. Econ. Bus. Admin. 15, 136–149. doi: 10.46223/HCMCOUJS.econ.en.15.4.3633.2025
Tussyadiah, I. P., and Wang, D. (2016). Tourists’ attitudes toward proactive smartphone systems. J. Travel Res. 55, 493–508. doi: 10.1177/0047287514563168
Um, S., Chon, K., and Ro, Y. (2006). Antecedents of revisit intention. Ann. Tour. Res. 33, 1141–1158. doi: 10.1016/j.annals.2006.06.003
Vaccaro, I., and Beltran, O. (2007). Consuming space, nature and culture: patrimonial discussions in the hyper-modern era. Tour. Geogr. 9, 254–274. doi: 10.1080/14616680701422715
Venkatesh, V., Thong, J. Y., and Xu, X. (2012). Consumer acceptance and use of information technology: extending the unified theory of acceptance and use of technology. MIS Q. 36, 157–178. doi: 10.2307/41410412
Wang, X., Zhen, F., Tang, J., Shen, L., and Liu, D. (2022). Applications, experiences, and challenges of smart tourism development in China. J. Urban Technol. 29, 101–126. doi: 10.1080/10630732.2021.1879605
Weng, L., Tan, L., and Yu, Y. (2023). The effects of perceived cultural and tourism public services on visitor satisfaction and quality of life: a multiple mediation model. Land 12:2033. doi: 10.3390/land12112033
Xiang, Z., and Fesenmaier, D. R. (2017). “Big data analytics, tourism design and smart tourism” in Analytics in smart tourism design: Concepts and methods. (Cham, Switzerland: Springer) 299–307.
Xie, C., Zhang, J., and Morrison, A. M. (2021). Developing a scale to measure tourist perceived safety. J. Travel Res. 60, 1232–1251. doi: 10.1177/0047287520946103
Yan, G., Zou, L., Liu, Y., and Ji, R. (2022). How does new infrastructure impact the competitiveness of the tourism industry?——evidence from China. PLoS One 17:e0278274. doi: 10.1371/journal.pone.0278274
Yang, W., Zhang, Y., and Wang, Y.-C. (2023). Would travel experiences or possessions make people happier? J. Travel Res. 62, 412–431. doi: 10.1177/00472875211064631
Yang, Y., Zhou, X., Fan, L., Yin, H., and Qu, H. (2023). Effects of perceived placeness on tourists’ authenticity experience via the mediating role of flow experience. J. Hosp. Tour. Res. 47, 1091–1114. doi: 10.1177/10963480211070039
Ye, J., Qin, Y., and Wu, H. (2024). Cultural heritage and sustainable tourism: unveiling the positive correlations and economic impacts. Curr. Psychol. 43, 36393–36415. doi: 10.1007/s12144-024-07070-6
Yoon, Y., and Uysal, M. (2005). An examination of the effects of motivation and satisfaction on destination loyalty: a structural model. Tour. Manag. 26, 45–56. doi: 10.1016/j.tourman.2003.08.016
Yu, H. (2024). Regional development in China under the “dual-circulation” strategy: the case of Guangdong-Hong Kong-Macau Greater Bay Area. J. Contemp. China 33, 683–703. doi: 10.1080/10670564.2023.2214077
Zeithaml, V. A. (1988). Consumer perceptions of price, quality, and value: a means-end model and synthesis of evidence. J. Mark. 52, 2–22. doi: 10.1177/002224298805200302
Zhang, Y., and Hitchcock, M. J. (2017). The Chinese female tourist gaze: a netnography of young women's blogs on Macao. Curr. Issues Tour. 20, 315–330. doi: 10.1080/13683500.2014.904845
Zhang, S., and Ju, H. (2021). The regional differences and influencing factors of tourism development on Hainan Island, China. PLoS One 16:e0258407. doi: 10.1371/journal.pone.0258407
Zhao, Y., and Bacao, F. (2021). How does the pandemic facilitate mobile payment? An investigation on users’ perspective under the COVID-19 pandemic. Int. J. Environ. Res. Public Health 18:1016. doi: 10.3390/ijerph18031016
Zhao, X., Elahi, E., Wang, F., Xing, H., and Khalid, Z. (2024). Sustainable tourism development for traditional Chinese drama's intangible cultural heritage. Heliyon 10:e25483. doi: 10.1016/j.heliyon.2024.e25483
Zheng, Y., Zhang, Y., Mou, N., Makkonen, T., Li, M., and Liu, Y. (2024). Selection biases in crowdsourced big data applied to tourism research: an interpretive framework. Tour. Manag. 102:104874. doi: 10.1016/j.tourman.2023.104874
Keywords: revisit intention, perceived value, government policies, technology integration, tourist satisfaction, tourist experience, international tourism
Citation: Zhifu T and Jebbouri A (2025) Driving tourist revisit intentions to China’s heritage sites: an examination of government policies, perceived value, and technology, through the lens of satisfaction and experience. Front. Commun. 10:1659776. doi: 10.3389/fcomm.2025.1659776
Edited by:
Rahul Pratap Singh Kaurav, Fore School of Management, IndiaReviewed by:
Alkiviadis Panagopoulos, University of Patras, GreeceBarış Armutcu, Iğdır Üniversitesi, Türkiye
Ardiwansyah Nanggong, University of Gorontalo Ichsan, Indonesia
Copyright © 2025 Zhifu and Jebbouri. This is an open-access article distributed under the terms of the Creative Commons Attribution License (CC BY). The use, distribution or reproduction in other forums is permitted, provided the original author(s) and the copyright owner(s) are credited and that the original publication in this journal is cited, in accordance with accepted academic practice. No use, distribution or reproduction is permitted which does not comply with these terms.
*Correspondence: Tian Zhifu, bm1nY2pkeHR6ZkBpbXVmZS5lZHUuY24=; Abdelhamid Jebbouri, YWIuamViYm91cmlAaW11ZmUuZWR1LmNu