 Dongshi Sun
 Mingyue Xue
 Yadan Zhao
- 1School of Information and Business Management, Dalian Neusoft University of Information, Dalian, China
- 2Institute of Supply Chain Analytics, Dongbei University of Finance and Economics, Dalian, China
- 3College of Marxism, Dalian University of Foreign Languages, Dalian, China
The rapid expansion of the global exhibition economy has prompted an increasing number of enterprises to leverage exhibitions for gathering industry intelligence, expanding sales channels, and establishing brand presence. Achieving effective outcomes from these exhibitions necessitates carefully coordinating and planning numerous factors influencing exhibition success. To address persistent challenges in evaluating and enhancing exhibition outcomes, this paper introduces an integrated methodological framework that aligns the specific dynamics of the exhibition industry with a closed-loop key factor control mechanism. The framework synthesizes the Best–Worst Method (BWM) with multiple regression modeling to ensure both methodological robustness and practical applicability. BWM has been demonstrated as a reliable tool for prioritizing critical factors under conditions of limited or subjective data, thereby enabling the systematic identification of determinants that most significantly influence exhibition effectiveness. Complementarily, multiple regression analysis provides a well-established means of assessing the causal relationships between independent variables and outcome variables, allowing for empirical validation of hypothesized effects. This mechanism, comprising the stages of identification, testing, adjustment, and optimization, was empirically tested using a case study of an aquatic products exhibition. The study identified eight initial key factors, including post-exhibition services (E4), in-exhibition management (E3), exhibition sustainability (B5), and the economic conditions of the exhibition venue (B3). Subsequently, through the application of goodness-of-fit and significance testing within the multiple regression model, factors with lower correlations to exhibition effect, specifically post-exhibition services (E4), economic conditions of the exhibition venue (B3), and exhibition investment (D1), were excluded, thereby confirming the rationality of the optimized key factors. Ultimately, systematic control of these factors was implemented based on the concept of supply chain integration. The findings of this research represent an innovative contribution to system evaluation and factor management theory, specifically tailored to the exhibition industry. The model’s convenience and scientific rigor provide enterprises with an effective tool for enhancing exhibition effect.
1 Introduction
The exhibition industry, a product of urban economic development, is pivotal in fostering regional economic growth. By providing a platform for enterprises to showcase their products, the exhibition industry enhances brand value, expands sales channels, and increases financing opportunities, thereby facilitating the aggregation, complementarity, and integration of resource elements. Exhibitions have thus emerged as crucial platforms for establishing modern market economies and open economic systems. The strong correlation between the exhibition industry and economic development is well-documented in numerous theoretical frameworks (Yang, 2022). Empirical evidence from countries with advanced exhibition sectors, such as Germany, the United States, and Singapore, indicates that the exhibition industry can contribute approximately 0.2% of their GDP (Kirchgeorg et al., 2010). In developing countries, the exhibition economy is undergoing significant expansion, with an average annual growth rate of nearly 20% and a steadily increasing scale of specialized industries (Raghutla and Chittedi, 2021). The exhibition sector generates substantial economic benefits as a burgeoning industry with a global annual output value in the hundreds of billions of dollars. It yields social advantages, including optimizing industrial structures and stimulating emerging employment opportunities (Kim and Chon, 2009).
An increasing number of companies are participating in exhibitions, aiming to achieve effective exhibition effect. Exhibition effect encompass a range of achievements stimulated, pursued, and ultimately realized during and after the exhibition process, such as gathering industry information, establishing customer relationships, and enhancing corporate image (Kim et al., 2020). For exhibitors, identifying and understanding the factors that influence these outcomes and the mechanisms and degrees of their impact is crucial for optimizing exhibition strategies. The exhibition industry is inherently interdisciplinary, with exhibition effect influenced by factors such as innovative themes, the business environment of the exhibition venue, and the ability to accurately attract potential customers (Lai and Wong, 2021). Additionally, the effectiveness is linked to the marketing strategies employed by exhibiting companies and the integration of advanced technologies such as artificial intelligence, virtual reality, and augmented reality. In summary, while numerous factors shape the effectiveness of an exhibition, their relative impact differs substantially across contexts. Accurately identifying the key determinants of success in relation to the specific characteristics of each exhibition is therefore essential. Equally important is the coordinated management of these factors, particularly under conditions of constrained financial and organizational resources. Such an approach not only enhances the likelihood of successful exhibition outcomes but also reflects broader principles of strategic communication and systems thinking, wherein effectiveness emerges from the balanced alignment of interdependent elements rather than isolated improvements in individual domains.
Scholars have recognized the practical significance of identifying key factors affecting exhibition effect and have conducted targeted research in this area. Evaluating these key factors predominantly employs multi-criteria decision-making (MCDM) methods such as AHP, DEMATEL, and TOPSIS (Alqahtani and Makki, 2023). Despite the growing body of research on exhibition evaluation, three critical limitations remain. First, exhibitions are inherently dynamic events in which objects, products, scale, and expected outcomes continually evolve. The application of static, universal indicators provide only limited explanatory and predictive power, particularly when attempting to guide diverse exhibitions across specialized sectors. Second, the factors influencing exhibition performance are highly interdisciplinary, encompassing elements of communication, marketing, organizational behavior, and cultural studies. Existing methods of factor identification—primarily reliant on survey questionnaires or expert judgment—introduce considerable subjectivity and measurement bias, thereby reducing the reliability of evaluation outcomes (De Groote, 2005). Third, optimization strategies are typically developed for each factor in isolation following their identification. However, enterprises often operate under resource constraints, making simultaneous investment across multiple key factors impractical. Moreover, potential correlations and interdependencies between factors are frequently neglected. In cases where contradictory relationships exist, unilateral optimization may even undermine overall effectiveness; improvements in one domain can inadvertently diminish outcomes in another, a phenomenon consistent with systems theory’s emphasis on interrelatedness and trade-offs within complex environments (Pan et al., 2009).
In response to these limitations, this study develops a cross-domain framework for systematically identifying and managing the determinants of exhibition effectiveness. Specifically, it constructs a quantifiable evaluation index system that integrates interdisciplinary factors relevant to exhibition performance. To operationalize this framework, a closed-loop mechanism is designed that combines the BWM with multiple regression analysis. By doing so, the mechanism not only strengthens the objectivity and robustness of factor identification but also addresses the complexity of interdependencies among variables. This integrative approach reduces the risk of conflicting optimization strategies, thereby enabling exhibitors to allocate scarce resources more strategically and to enhance exhibition outcomes through evidence-based decision-making. Beyond its managerial implications, the framework advances scholarly discussions by linking quantitative modeling with communication-centered perspectives on effectiveness evaluation, thereby contributing to the development of a more comprehensive theory of exhibition performance. Compared to existing research, this approach offers several innovative improvements: (i) The selection of quantifiable indicators is prioritized, minimizing data collection requirements and allowing for the rapid acquisition of data aligned with exhibition characteristics, thus meeting the demands of modern decision-making processes for convenient and specialized exhibitions; (ii) Statistical methods are employed to conduct goodness-of-fit and significance analyses on the relationships between key factors and exhibition effect, enabling the verification and iterative optimization of the accuracy and weighting of key factor identification; (iii) The logical relationships between key factors are clarified, and strategies for improving exhibition effect are designed under the concept of “supply chain integration.”
The structural framework of the remaining sections of this paper is organized as follows: The second section provides a literature review, which synthesizes existing research findings across three key areas: the urban exhibition industry, evaluation of exhibition effect, and the key factors influencing these outcomes. Based on the literature, an indicator system influencing exhibition effect is developed. The third section outlines the methodology, detailing the design of a framework for identifying and validating key factors impacting exhibition effect using the Best-Worst Method (BWM) and multiple regression models. The fourth section presents an empirical analysis through a case study of an aquatic products exhibition. The fifth section offers a discussion of the findings along with practical recommendations. The final section concludes the paper by summarizing key insights and implications.
2 Literature review
2.1 Urban exhibition industry
The theoretical exploration of the exhibition industry began in the 1990s, with Braun being one of the first to investigate its economic contributions (Braun, 1992). Subsequent research primarily focused on elucidating the relationship between the urban exhibition industry and urban economic development. For instance, Kim and Chon utilized modeling techniques to assess the multiplier effect of exhibition revenue on the South Korean economy (Kim et al., 2003). Dwyer et al. highlighted the overlooked adverse effects of the exhibition industry, noting a lack of interaction with other sectors, which exacerbated the positive impacts on employment and the economy (Dwyer et al., 2006). Bermejo and Cuadrado systematically examined the role of the exhibition industry in enhancing urban competitiveness (Bermejo and Cuadrado, 1995). Humphrey and Gereffi introduced various governance models for the exhibition sector (Gereffi et al., 2005). Scholars had primarily established the correlation between the exhibition industry and urban economic development at this juncture. The research focus then shifted, with scholars such as Li and Liu advancing the measurement of this relationship through methods like cointegration and Granger causality analysis. They developed a vector error correction model to quantify the impact of the exhibition industry on the local economy and its interaction with industrial structure (Lu, 2022).
Additionally, recent studies have begun to explore the exhibition industry chain, investigating its formation mechanisms and operational rules. For example, Li analyzed the effects of exhibition industry development on regional industrial structures from an industrial chain perspective, examining manifestation, mechanisms, and constraint factors (Fang et al., 2017). More recently, as the exhibition industry has rapidly evolved, increasing scholarly attention has been directed toward understanding how it shapes industry competitiveness and achieves desired exhibition effect.
2.2 Evaluation of exhibition effect
Research on exhibition evaluation has attracted considerable attention, mainly due to the need to measure return on investment and to verify the effectiveness of enterprises’ participation. Lee and Ryan evaluated exhibition effectiveness using indicators such as booth visitor numbers, cost per visitor, willingness to transact, and unit costs associated with transaction willingness (Lee and Ryan, 2024). Rosson et al. employed segmented indicators, including sales ratios, sales periods, new customer acquisition, and the number of audience members involved in decision-making (Rosson et al., 1955). Hansen developed a comprehensive evaluation system for exhibition benefits by constructing a conceptual model that includes multiple dimensions: information collection, sales performance, image enhancement, and personnel incentives. The effectiveness and reliability of this model were subsequently verified through empirical analysis (Hansen, 2004). Mitchell et al. proposed a model that categorizes exhibition features into inputs, processes, outputs, and results. The model highlights the importance of incorporating non-economic values, such as brand awareness and professional engagement, which are essential for a comprehensive evaluation of exhibition performance (Mitchell et al., 2023). Seringhaus and Rosson proposed an exhibition performance evaluation model from the exhibitors’ perspective. The model incorporates five primary indicators—revenue, business, promotion, information, and organization—along with 31 secondary indicators (Seringhaus and Rosson, 2004). Despite the quantity of existing research, academic studies on exhibition effect remain relatively scarce, although there has been a notable increase in research activity over the past 2 years. Current research often involves macro-level evaluations of the exhibition industry. However, the increasing specialization and customization of exhibitions limit the practicality of such studies. As a result, they provide insufficient guidance for developing effective exhibition organization and participation strategies.
The evaluation of exhibition effect has traditionally needed more innovative methodologies. Initial assessments primarily employed the DELPHI method, survey questionnaires, and quantitative analysis grounded in exhibition data. Over time, more sophisticated multi-criteria evaluation methods, such as AHP, DEMATEL, and TOPSIS, have become prevalent (Kim et al., 2022). Recently, deep learning techniques’ advent and increasing popularity have introduced new approaches to evaluating exhibition effect (Mitchell et al., 2023). However, given the multifaceted nature of the factors influencing exhibition effect, most existing evaluation studies rely on expert ratings or qualitative analyses, resulting in potentially subjective conclusions. Furthermore, the few studies utilizing objective data have yet to rigorously test their evaluation index systems’ scientific validity and effectiveness.
2.3 Key factors affecting exhibition effect
Assessing exhibitions’ outcomes necessitates identifying key determinants influencing their success. Existing research has developed indicator systems encompassing various dimensions. This paper categorizes the critical factors into three distinct aspects: exhibition, exhibitor, and external factors.
Firstly, exhibition-related factors encompass several dimensions. These include the supporting services provided by the organizer, the number and quality of participating customers, the exhibitor’s situation, the location and layout of booths, and the scale and type of the exhibition. Data collection methods for these key factors are derived from various literature sources. The supporting services offered by the organizer are evaluated based on several aspects, including the organizer’s reputation and brand, pre-exhibition services, on-site services, post-exhibition activities, and past hosting experiences (Aditya, 2019). The total number of visitors is a key factor influencing both the number and quality of participating customers. It also affects the proportion of purchasing decision-makers among professional visitors, the share of professional visitors from the target market, the number of booth visitors, and recent trends in visitor scale (Lee et al., 2016). The exhibitor situation is assessed through the overall quantity and quality of exhibitors, the presence of competitors, and the involvement of leading industry firms and the company’s customers (Lin and Lin, 2013). The booth arrangement considers the exhibition’s overall layout and configuration, the location’s proximity to prominent enterprises or major intersections, the size of the booth area, and related factors (Moon et al., 2013).
Secondly, factors about the exhibitor’s attributes include the exhibitor’s business situation, behavior, individual network, and investment in the exhibition. (i) The exhibitor’s business situation reflects factors such as the company’s marketing mix, market conditions, and profitability. Particular emphasis is placed on whether the company has established a strategic exhibition plan (Holovnia, 2022). (ii) Exhibitor behavior is segmented into three phases: pre-exhibition promotional planning, sales activities during the exhibition, and post-exhibition follow-up. Effective management of these phases includes assessing the impact of pre-exhibition marketing efforts and ensuring proper personnel training, selection of appropriate exhibition projects, and follow-up to achieve desired outcomes (Bazilevich, 2023). Different perspectives exist on the impact of exhibition behavior. Interaction frequency between exhibitors and attendees only significantly affects value co-creation and relationship-building performance. However, it positively influences product sales and information collection, negatively impacting image display (Zhang et al., 2020). (iii) The individual network of exhibitors comprises social connections with other exhibitors, exhibition organizers, visitors, media, and government entities. Audience and exhibitor connections notably impact exhibition effect, whereas organizer connections have a less pronounced effect (Sasri and Kusumastuti, 2024). (iv) Exhibition investment is a crucial factor influencing exhibition effect. Research indicates that investment in human resources directly affects both sales and non-sales dimensions of exhibition performance, whereas financial investment impacts sales performance exclusively (Lei and Wu, 2024).
Thirdly, external factors affecting exhibition effect include macroeconomic conditions, transportation at the exhibition venue, and the economic conditions of the venue (Hang, 2022). Research indicates that exhibitor motivation significantly impacts exhibition effect. A comparative study by Dekimpe et al., based on data from 221 American and 135 British companies, revealed significant differences in participation motivations between local and non-local enterprises. These findings suggest that marketing strategies should be tailored to account for such differences (Dekimpe et al., 1997). Additionally, Herbig et al. investigated exhibition motivations across different sectors, finding that manufacturers primarily participate to source suppliers and compete with peers, whereas service providers have different motivations (Herbig et al., 1998).
This paper employs stakeholder theory and the “three-stage theory” of exhibition participation (Dekimpe et al., 1997) as its theoretical framework. By reviewing relevant literature and longitudinal studies on exhibition effectiveness, this study identifies five primary and 23 secondary factors that influence exhibition outcomes. These factors are detailed in Table 1.
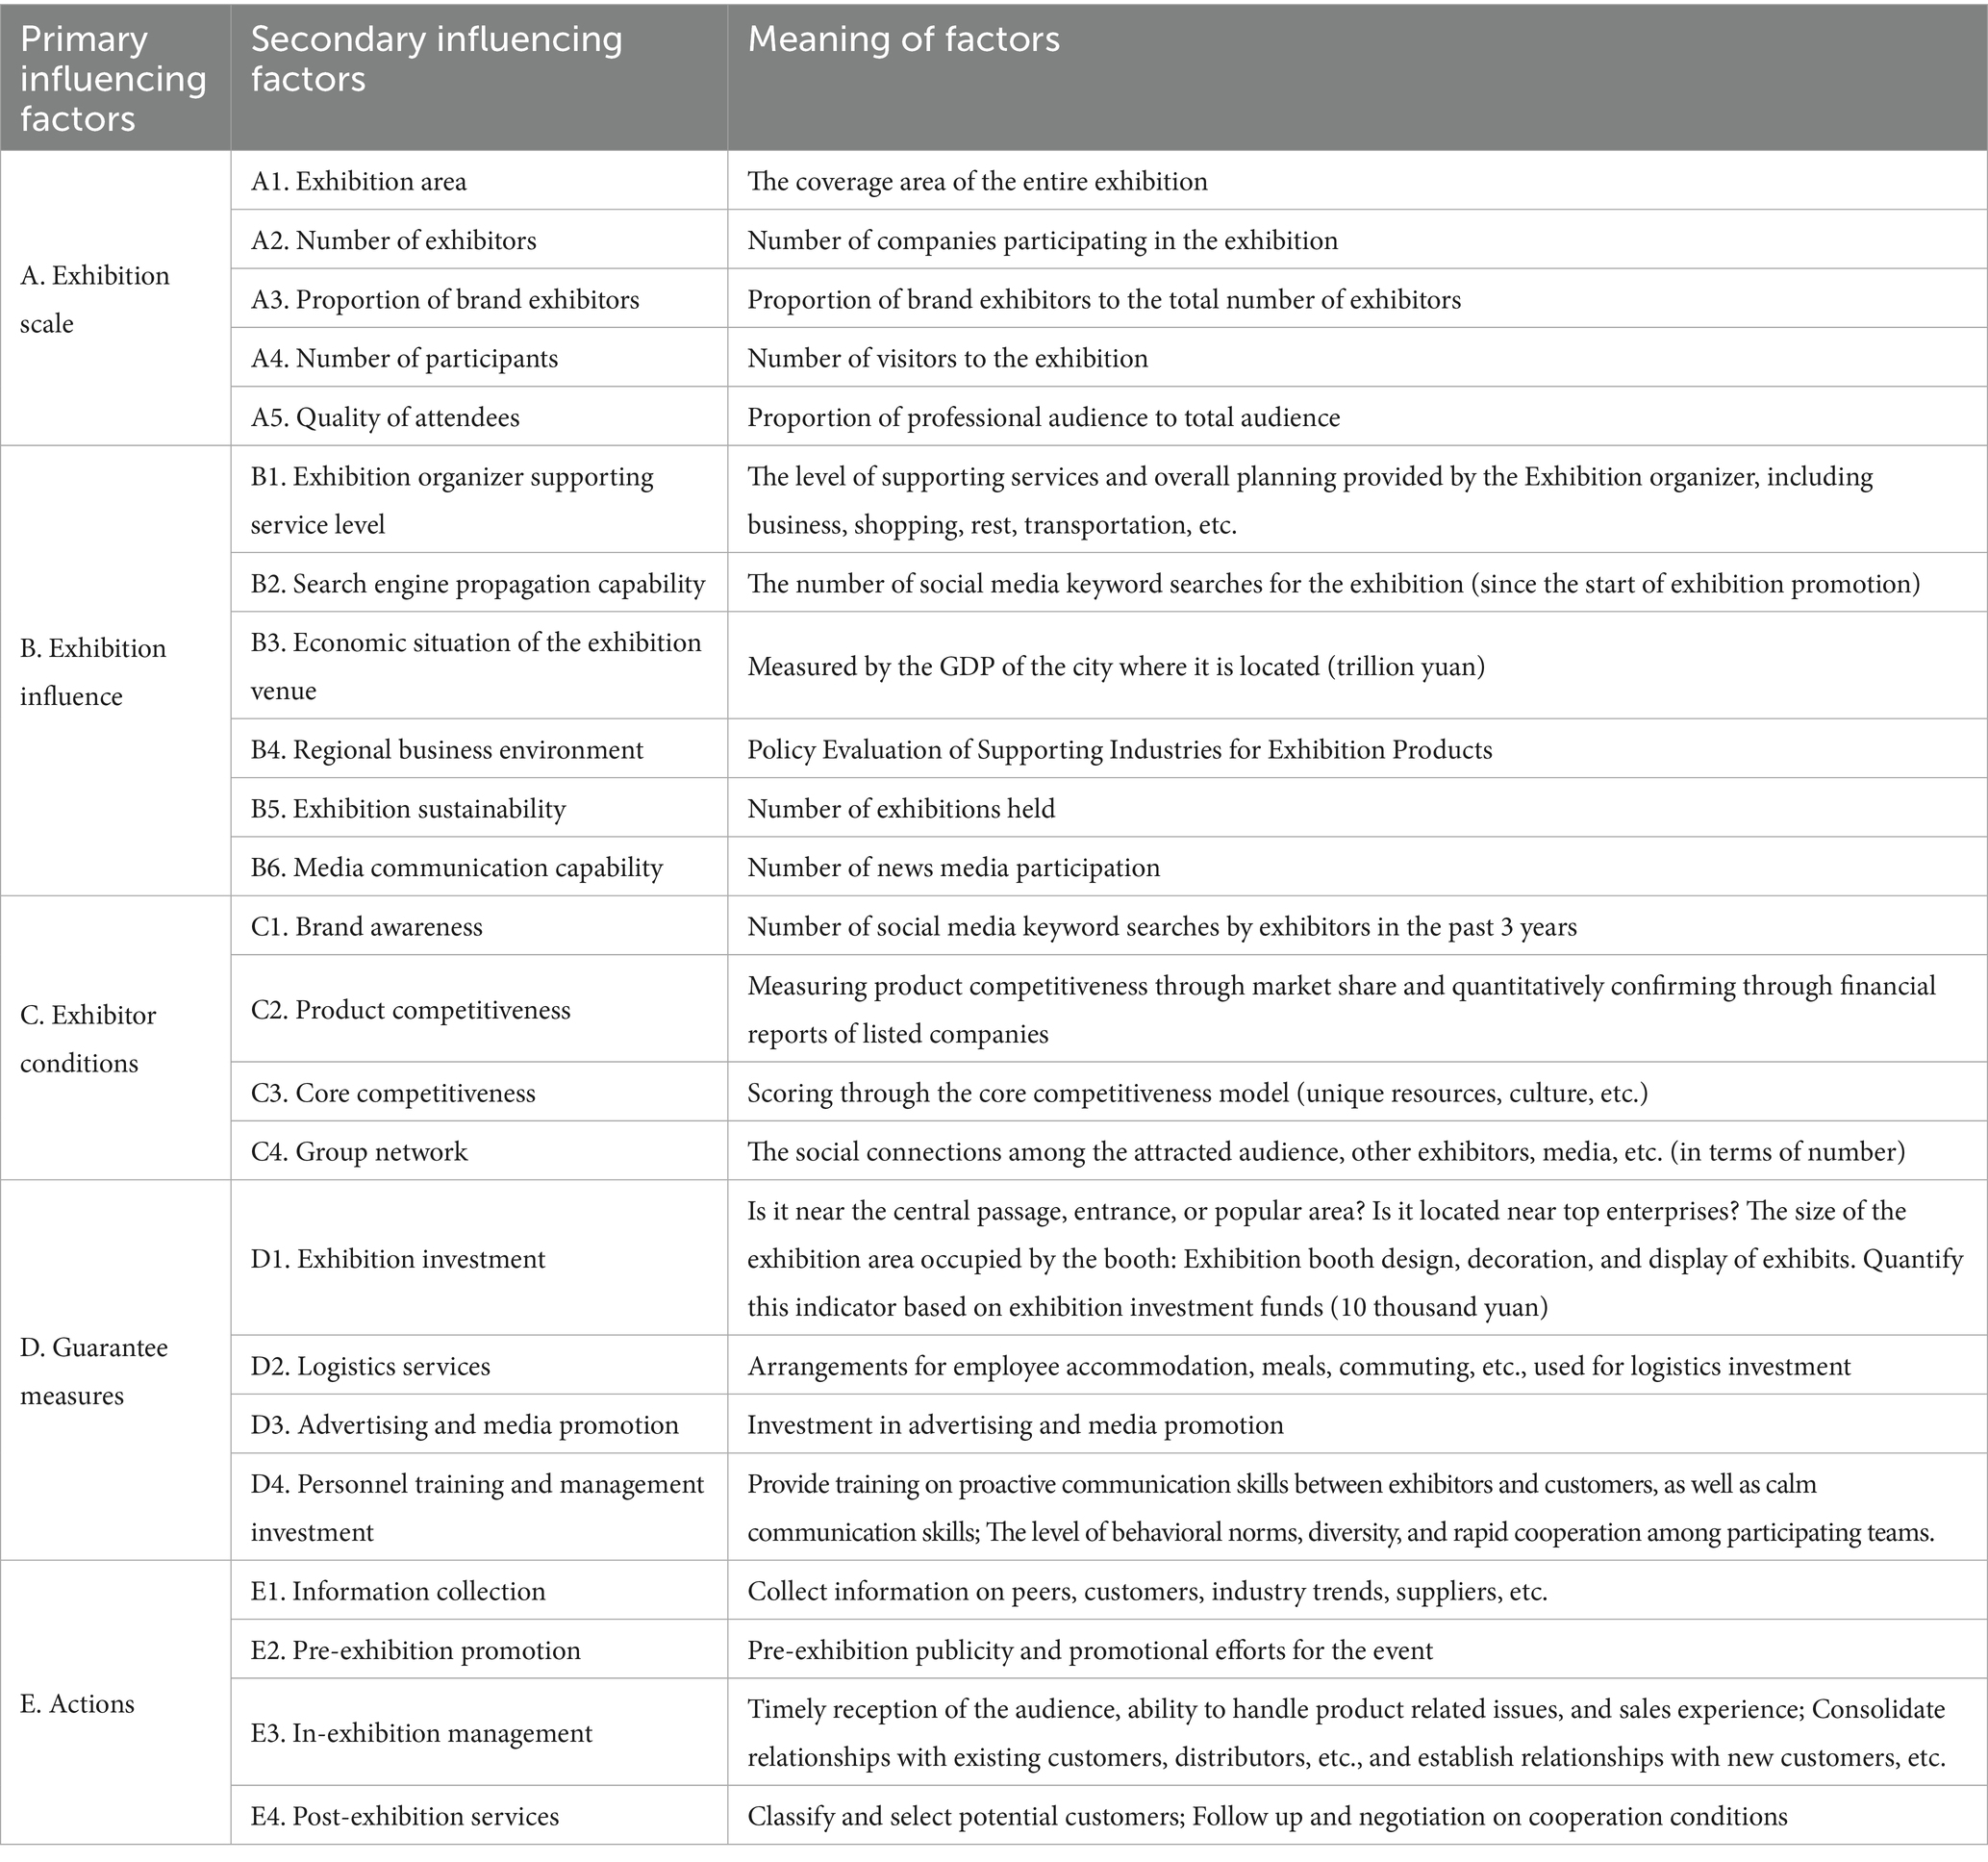
Table 1. Factors affecting the exhibition effect.
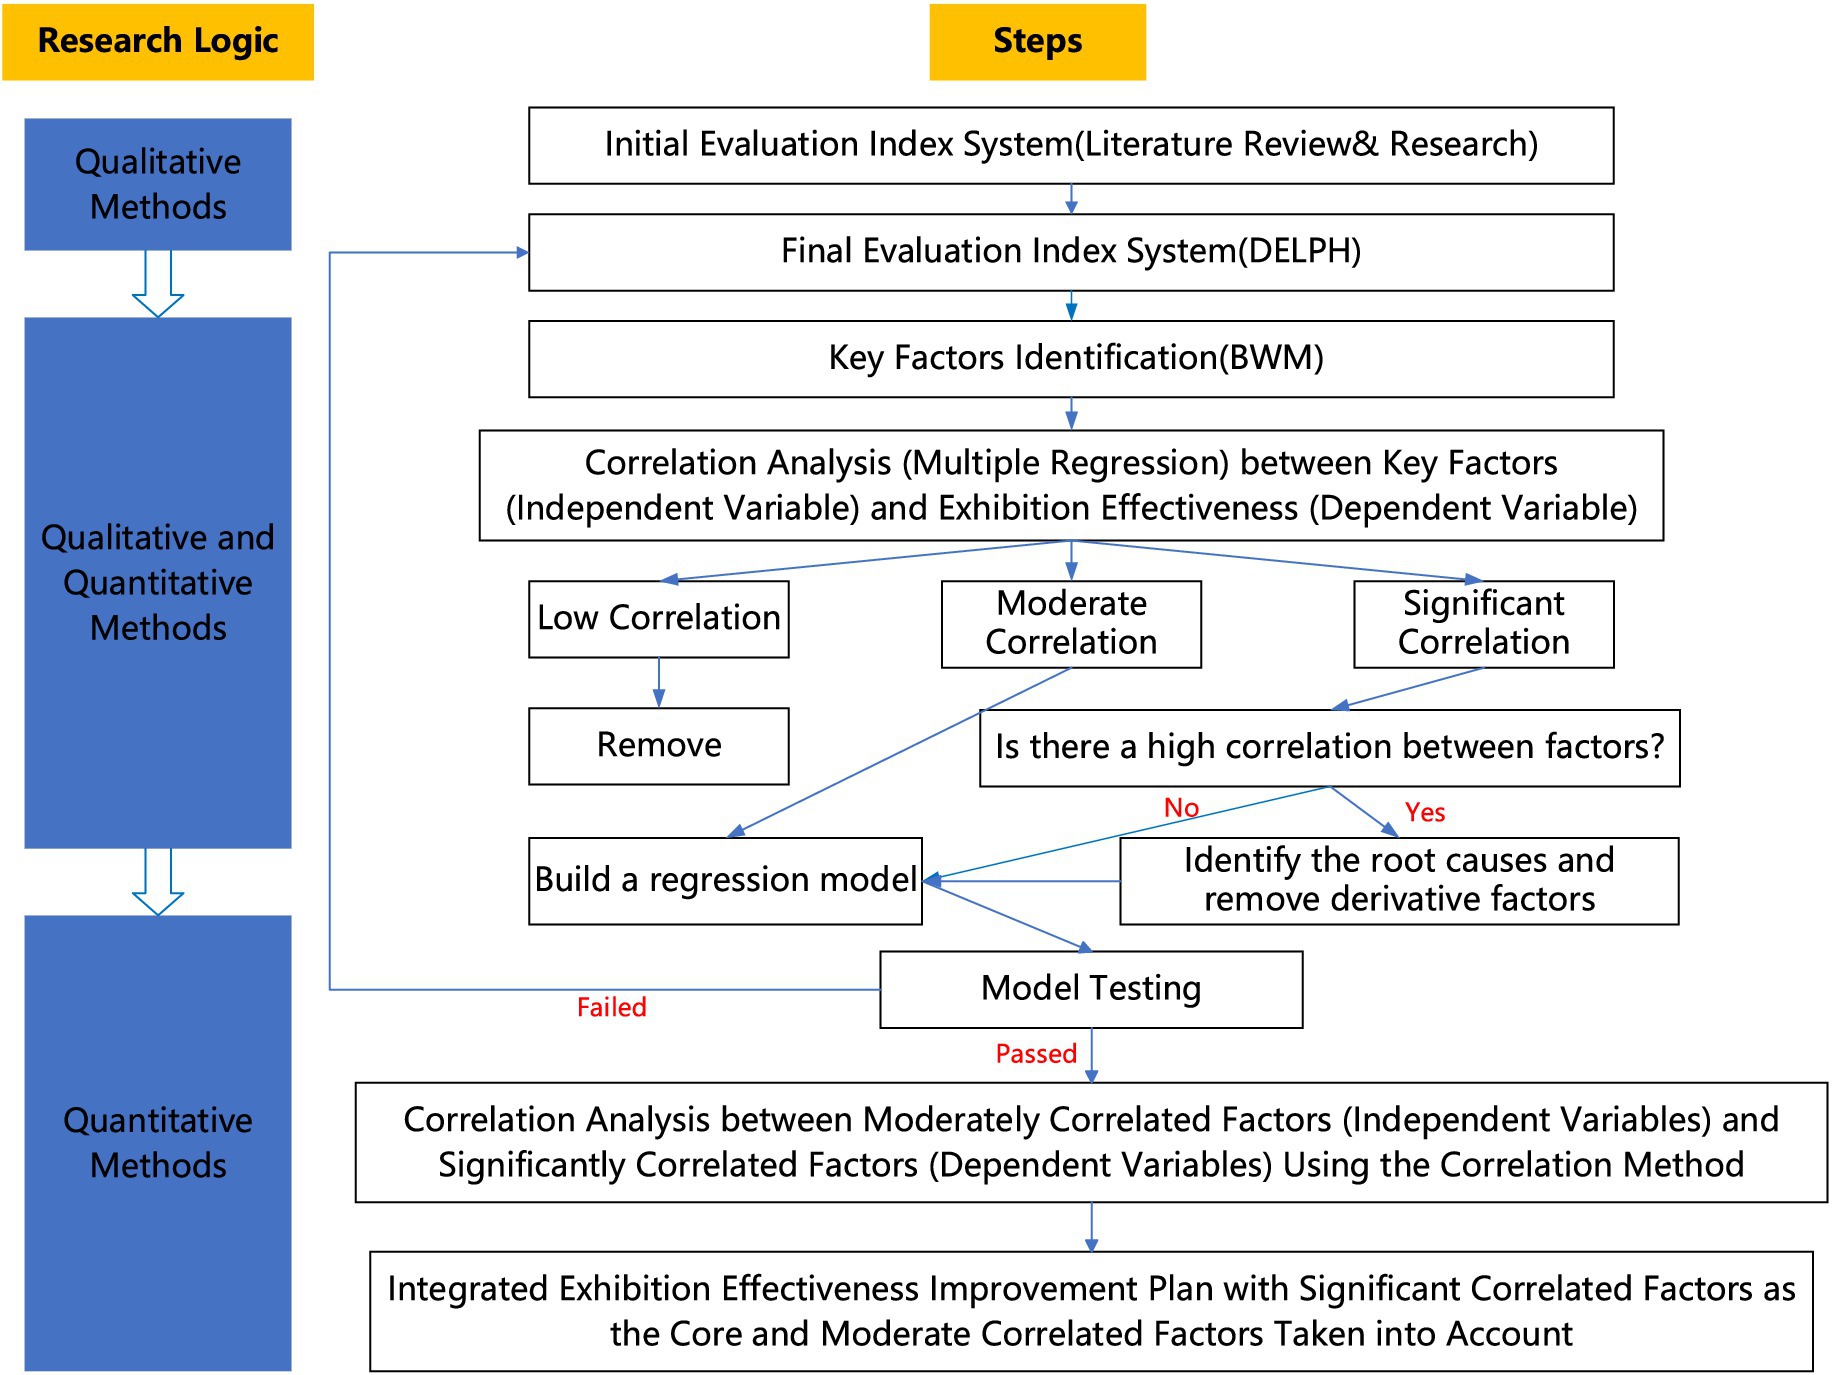
Figure 1. Step diagram of exhibition effect evaluation and key factor management methods.
3 Methodology
Existing performance evaluation methods that rely on indicator systems employ Multi-Criteria Decision-Making (MCDM) models, such as AHP, DEMATEL, and TOPSIS (Tucker et al., 2011). However, these methods encounter several issues. Firstly, collecting and evaluating indicator data involves subjective elements, which can bias the evaluation results. Secondly, these models impose specific requirements on indicator selection. For instance, AHP necessitates the independence of indicators; however, identifying such independence during indicator system construction can be challenging, often requiring iterative modifications to the system. Thirdly, the weight assignments in these models may not adequately reflect the criticality of indicators, and the relationships between indicators and evaluation outcomes are only sometimes quantifiable, which undermines their ability to provide precise decision-making support for exhibitions. This paper proposes a novel evaluation and key factor control methodology based on the Best-Worst Method (BWM) and multiple regression models to address these issues. This approach encompasses the stages of “identification, testing, adjustment, and optimization.”
3.1 BWM
The Best-Worst Method (BWM) is a Multi-Criteria Decision-Making (MCDM) technique designed to aid decision-making when multiple factors are involved. Compared with other multi-criteria decision-making (MCDM) methods, the AHP requires n(n − 1)/2 pairwise comparisons, whereas the BWM relies only on comparisons between the best factor and all other factors, as well as between the worst factor and all other factors. This significant reduction in the number of comparisons minimizes the likelihood of logical inconsistencies in decision-makers’ judgments and thereby enhances the overall consistency and reliability of the results (Rezaei, 2015). In contrast, the Technique for Order of Preference by Similarity to Ideal Solution (TOPSIS) requires fully quantitative data, yet the indicator system developed in this study incorporates a proportion of qualitative factors. As a result, the direct application of TOPSIS is limited in this context (Anisseh et al., 2012). By comparison, BWM provides a structured and efficient approach for evaluating and prioritizing factors, even under conditions of constrained or incomplete data, making it particularly suitable for the complex, interdisciplinary nature of exhibition effect evaluation. BWM effectively provides a structured approach to evaluate and prioritize factors, even with constrained or incomplete data.
Steps for Applying the BWM:
• Step 1: Criteria Identification
Develop a comprehensive list of relevant factors that are crucial for decision-making. This involves identifying the key elements that significantly influence the decision outcome.
• Step 2: Form an expert panel
To mitigate the risk of groupthink and enhance the validity of the evaluation process, the expert panel should be composed of individuals representing diverse professional backgrounds within the exhibition industry, including organizers, management practitioners, and academic specialists. Establishing clear selection criteria—such as years of professional experience, level of project involvement, domain-specific expertise, and organizational position—ensures that the panel reflects both practical and theoretical perspectives. Prior to the evaluation, it is essential that experts are adequately trained in the structure of the exhibition effectiveness indicator system and the application of the BWM scoring procedure. This preparatory step not only improves the accuracy and consistency of expert judgments but also aligns with best practices in decision-making research, which emphasize panel heterogeneity and methodological transparency as safeguards against bias.
• Step 3: Selection of Best and Worst Criteria
Select the most important (best) and least important (worst) factors from the identified criteria. This selection is made without comparing the criteria at this stage.
• Step 4: Evaluation of the Best Criterion
Assess the relative importance of the best criterion compared to all other criteria using a scale from 1 to 9. Construct a Best-to-Others (BO) vector , where each value represents how much more important the best criterion (B) is compared to each other criterion (j). This scale reflects the preference for the best criterion over the others.
• Step 5: Evaluation of the Worst Criterion
Evaluate how each criterion compares to the worst using the same 1–9 scale, which generates an Others-to-Worst (OW) vector , indicating how much better each criterion (j) is compared to the worst criterion (W). This scale measures the relative advantage of each criterion over the worst one.
• Step 6: Optimization of Criteria Weights
Determine the optimal weights for each criterion by minimizing the maximum inconsistencies between the BO and OW assessments through a direct programming model. This optimization process ensures consistency and reliability in the weighting procedure. The optimal relative weights can be computed using the following min-max model.
We transferred Model (1) into the linear programming model (2) as follows:
Assessing model reliability through consistency proportion (CP):
The Random Index (RI) is determined with reference to the standard parameter table (see Table 2) corresponding to the number of criteria under consideration. When the CP is less than or equal to 0.1, the result is considered acceptable. If this threshold is exceeded, the evaluation process should be repeated, requiring experts to reassess and provide revised scores until the consistency standard is satisfied.
• Step 7: Composite Weight Calculation

Table 2. BWM RI reference.
Calculate the composite weight for each criterion by integrating its relative importance with its significance in the decision-making process. This step quantifies the overall impact of each factor on the final decision.
Where refers to the composite weight of criterion i, refers to the weight of criterion i relative to the corresponding aspect j, and is its relative weight.
3.2 Multiple regression
To further mitigate the potential subjectivity inherent in expert-based judgments within the BWM, this study integrates practical data to empirically assess the relationships between key factors and exhibition outcomes. Following the calculation of factor weights using BWM, preliminary screening is conducted by applying cumulative weight thresholds or the elbow method to identify the most influential factors. These screened factors are then incorporated into a multiple regression model, which allows for the quantitative estimation of their impact on exhibition effectiveness. This combined approach not only refines the accuracy of factor selection but also provides a more rigorous basis for evaluating the relative importance of key factors, thereby strengthening both the reliability and validity of the overall exhibition effect evaluation framework.
A multiple regression model describes the relationship between a dependent variable and multiple independent variables, extending and deepening the concept of univariate regression (Wan et al., 2025). In economic contexts, changes in a particular indicator are often influenced by various factors, making it challenging to discern the primary and secondary relationships among these factors. In such scenarios, employing multiple regression analysis provides more accurate and insightful predictions by accounting for the simultaneous effects of multiple variables.
The multiple regression model is expressed as follows:
Among them, represents a constant term; represents the partial regression coefficient of the sample; ε is the residual. The model coefficients are usually confirmed using the least squares method. The following tests are usually conducted to ensure the effectiveness of the model.
Where Y represents the dependent variable. is the intercept term. are the coefficients of the independent variables respectively. is the residual, which denotes the error term, accounting for the variability in Y not explained by the independent variables.
1. Goodness of Fit Test
The goodness of fit test evaluates how well the observed values align with the sample regression line. Typically, this is assessed using the coefficient of determination, denoted as R2.
In the context of regression analysis, SSR is the sum of squared regression, , SSE is the sum of squared residuals, , represents the sample mean, and represents the estimated value.
The coefficient of determination (R2) ranges from 0 to 1. A typical R2 value greater than 0.8 generally indicates a good fit of the regression model, suggesting that the model explains more than 80% of the variability in the dependent variable. Thus, the regression equation exhibits high accuracy. Conversely, an R2 value less than 0.6 implies that the model explains less than 60% of the variability, indicating that the independent variables may require adjustment or reevaluation in the regression analysis. An R2 value between 0.6 and 0.8 reflects an acceptable fit of the model, although further refinement may be necessary to improve the model’s explanatory power.
1. Durbin-Watson (D-W) Test
To validate the applicability of a prediction model, it is essential to test the assumption of linear independence of the regression residuals. The Durbin-Watson (D-W) test is commonly employed for this purpose. This test assesses the first-order autocorrelation of the residuals in a regression model.
If the auto-correlation coefficient of the regression residual sequence is ρ, the hypotheses of the test are as follows:
The test statistic, d, is used to determine the presence of auto-correlation in the residuals:
Based on the significance level α, the sample size n, and the number of independent variables k, consult the Durbin-Watson (D-W) table to obtain the critical lower limit and upper limit values for the test statistic. By comparing the calculated Durbin-Watson statistic d with and , one can determine whether to reject the null hypothesis of no auto-correlation. It is generally accepted that if the D-W statistic falls within the range [1.5, 2.5], there is no significant autocorrelation in the regression residuals. A value closer to 2 indicates a weaker degree of auto-correlation.
The regression model should be considered acceptable after passing both the goodness of fit test and the Durbin-Watson test. Additional tests should be conducted to validate the regression model’s significance further.
1. F-test
The F-test is used to assess the significance of the overall regression model, specifically to evaluate the degree of significance of the linear relationship between the independent and dependent variables. The test involves the following hypotheses:
H0: , indicating that the linear relationship between the independent and dependent variables is not significant.
H1: , At least one of the regression coefficients is not equal to zero, suggesting that the linear relationship is significant.
Under the null hypothesis, the t-test statistic for evaluating the significance of a regression coefficient is calculated using the following formula:
Based on the chosen significance level α, compare the calculated F-test statistic with the critical value from the F-distribution table, if , the null hypothesis is rejected; otherwise, the null hypothesis cannot be rejected.
1. t-test
T-test, also known as the significance test for regression coefficients, evaluates the degree of influence of an individual independent variable on the dependent variable. The hypotheses for this test are defined as follows:
H0: , indicating that there is no linear relationship between the independent variable and the dependent variable.
H1: , suggesting that there is a significant linear relationship between the independent variable and the dependent variable.
Under the null hypothesis, the t-test statistic for evaluating the significance of a regression coefficient is calculated using the following formula:
In the formula, b is the statistical estimate of (i = 1, 2, …, n); S is the standard deviation of parameter β estimation, , and is the regression standard deviation.
On the basis of determining the significance level α, if , the null hypothesis is rejected; otherwise, the null hypothesis cannot be rejected.
3.3 Identification and management methods of key factors in exhibitions
This paper presents a comprehensive methodology for evaluating exhibition effect and managing key factors, utilizing the Best-Worst Method (BWM) and multiple regression models. The detailed steps of this methodology are illustrated in the following figure:
• Step 1: Establish the initial indicator system through a comprehensive literature review and expert consultations. This step involves gathering relevant indicators from existing research and expert opinions to form a preliminary list of factors affecting exhibition effect.
• Step 2: Refine and validate the initial indicator system using the DELPHI method. This iterative process involves soliciting feedback from a panel of experts to reach a consensus on the final set of indicators that will be used in the evaluation.
• Step 3: Employ the Best-Worst Method (BWM) to identify and prioritize the key factors. This method involves evaluating and ranking each factor’s importance to determine which has the most significant impact on exhibition effect.
• Step 4: Perform a secondary screening of key factors. Utilize correlation analysis to evaluate the pairwise correlations between the key factors and exhibition effect based on collected data. The interpretation of correlation coefficients (r) is as follows:
• : Indicates a significant correlation between two variables.
• : Indicates a moderate correlation between the two variables.
• : Indicates a low correlation between the two variables.
• : Indicates an extremely weak correlation between the two variables.
Eliminate factors that exhibit low or extremely weak correlations with the exhibition effect. For factors showing significant correlations, if the number of such factors exceeds one, further analysis is needed to determine if there are significant correlations among them. If significant correlations are found among the key factors, it indicates potential redundancy or multicollinearity (Habes et al., 2024). In such cases, refine the key factors by removing causally related ones to ensure a more accurate and practical model.
• Step 5: Develop a multiple regression model using the selected key factors and their impact on exhibition effect. After constructing the model, assess its goodness of fit and perform the Durbin-Watson (D-W) test to check for auto-correlation in the residuals. If the model passes these tests and the key factors are confirmed, proceed to Step 6. If the model does not meet the required standards, return to Step 2 to re-evaluate the final indicator system for its validity and appropriateness.
• Step 6: Construct a multiple regression model with the significant factors as dependent variables and other key factors as independent variables. Analyze the coefficients of the independent variables to determine their relationships with the significant factors. Based on these relationships, design a comprehensive optimization strategy for enhancing exhibition effect, incorporating the “supply chain integration” concept to address and improve relevant aspects of the exhibition process.
It is essential that the proposed hybrid method, which integrates the BWM with regression analysis, undergo comprehensive validity testing prior to practical application. First, methodological soundness must be confirmed by ensuring that BWM passes its internal consistency test and that the regression models satisfy statistical diagnostics, including goodness-of-fit and Durbin–Watson (D–W) tests. Importantly, parameter adjustments or score modifications should not be made in isolation within either the BWM or regression models; instead, their impact on the integrity of the overall process must be considered holistically. Second, the robustness of the method should be examined through application to classic historical cases and datasets, allowing comparison between the proposed results and those validated by authoritative institutions. Any discrepancies must be accompanied by reasoned explanations or systematic parameter refinements until the error is reduced to an acceptable range. Third, purposeful validation should be conducted in practice by comparing the advantages and limitations of the proposed method against traditional approaches in the context of actual exhibition organization. Such iterative, real-world testing provides the basis for dynamic refinement of the method, thereby ensuring both its practical applicability and its contribution to advancing evaluation practices in exhibition studies.
4 Results
4.1 Identification of key factors
• Step 1: Section 2 of this paper establishes the prototype decision-making framework, which, together with the “three-stage theory” of participation, forms the basis for a comprehensive literature review on factors influencing exhibition effect (see Table 1).
• Step 2: To finalize the indicator system, a panel of experts was convened, and the DELPHI method was employed to ensure a consensus-driven outcome, as reflected in Table 1. Due to space limitations, the detailed implementation process of the DELPHI method is not included in this paper.
• Step 3: Identification of Key Factors. Given the temporal and theoretical variations in the literature and the diverse research perspectives, five experts were engaged to identify the key factors for this case study (see Table 3). To minimize the potential subjectivity of expert scoring, strict eligibility criteria were established for expert selection. Specifically, experts were required to meet the following conditions: (i) possess more than 10 years of professional experience in the exhibition industry; (ii) have participated in no fewer than 20 international trade fairs in the capacity of organizer or core team member; (iii) represent institutions of different types in order to mitigate institutional bias and ensure panel heterogeneity; and (iv) demonstrate recognized academic or professional authority, evidenced through the publication of high-quality academic papers or monographs, or the possession of significant intellectual property, such as patents. These criteria collectively ensure that the expert panel reflects both depth of experience and diversity of perspective, thereby enhancing the reliability and validity of the evaluation process.
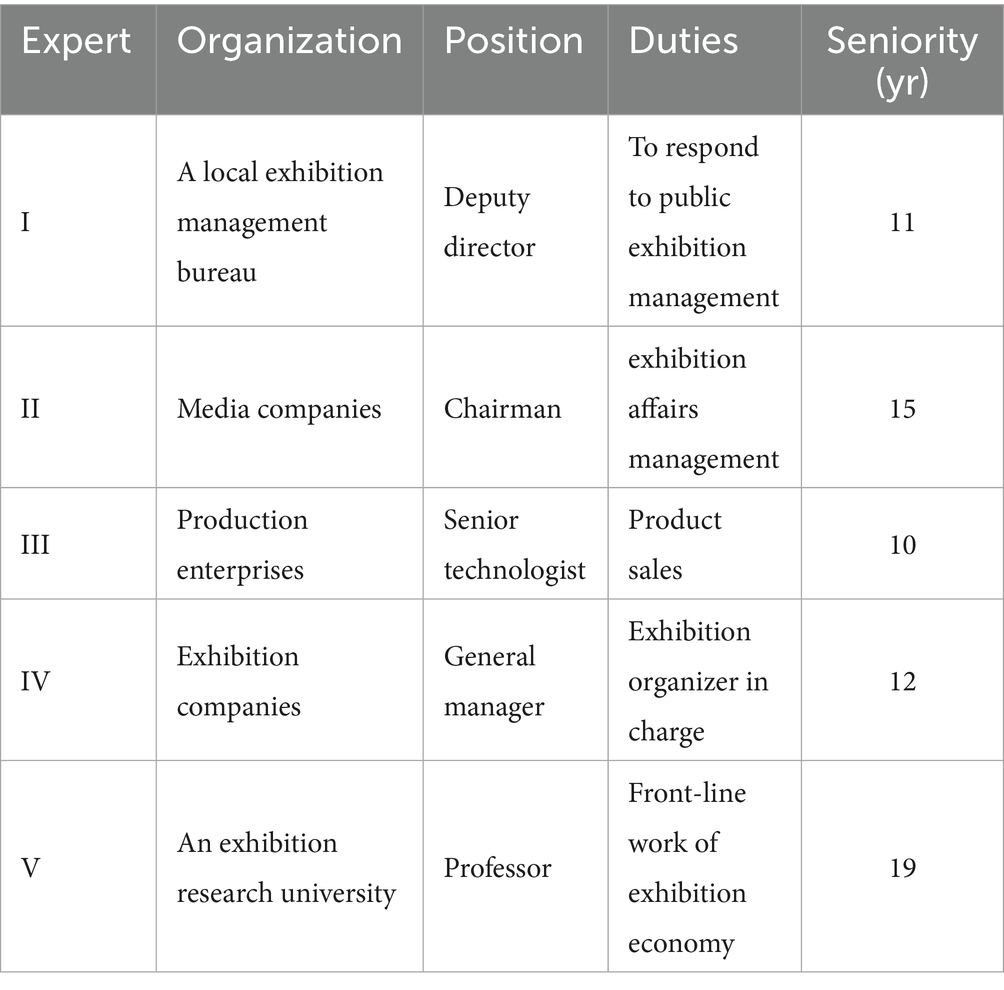
Table 3. Professional backgrounds of the selected five experts.
As per the Best-Worst Method (BWM), we calculated the absolute weight of each index. The expert evaluation process is illustrated by Expert I. Initially, Expert I identified the most and least important aspects from the five key dimensions outlined in the formal decision-making framework. Afterward, he assigned scores on a scale from 1 to 9, with higher scores indicating more significant importance. The evaluation results for Expert I are presented in Table 4.
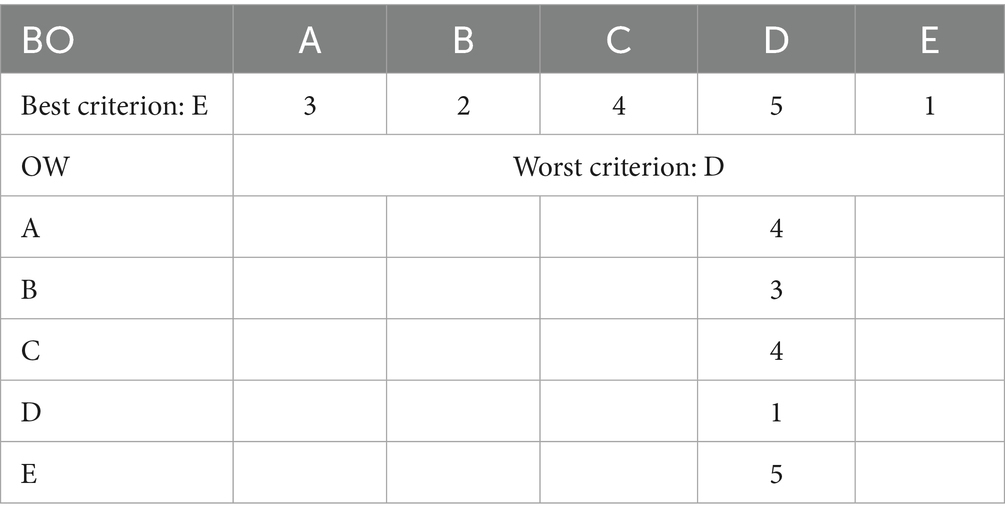
Table 4. Best-to-others (BO) and others-to-worst (OW) pairwise comparison vectors.
Second, Expert I identified the most and least important factors within Aspect A and assigned scores for the Best-to-Others (BO) and Others-to-Worst (OW) comparisons on a scale from 1 to 9. This procedure was consistently applied to Aspects B through E. The results of these evaluations are presented in Tables 5–9.
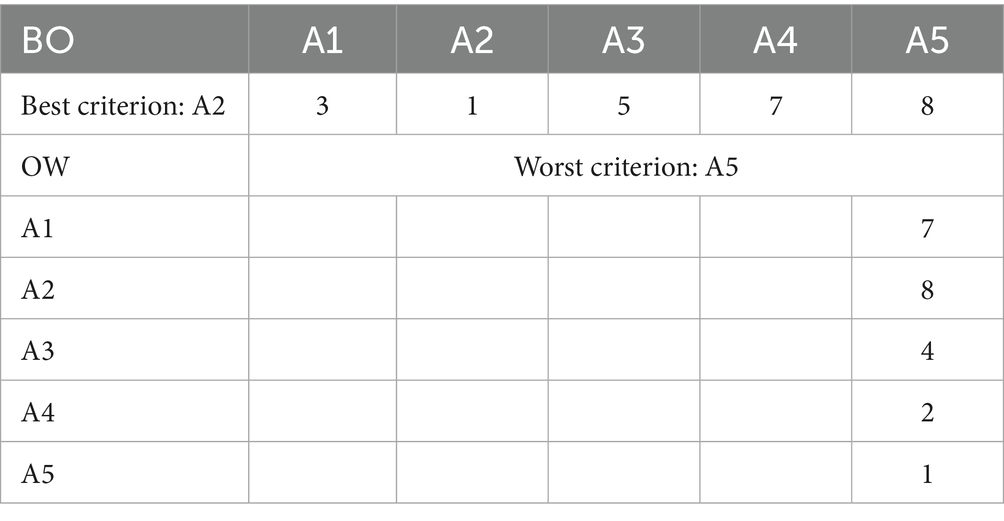
Table 5. Best-to-others (BO) and others-to-worst (OW) pairwise comparison vectors: aspect A.
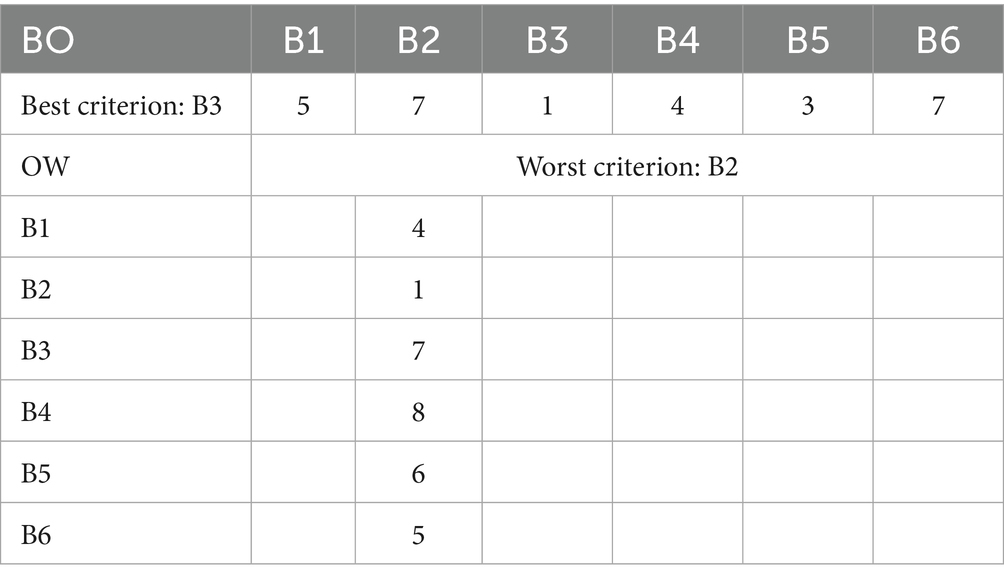
Table 6. Best-to-others (BO) and others-to-worst (OW) pairwise comparison vectors: vectors: aspect B.
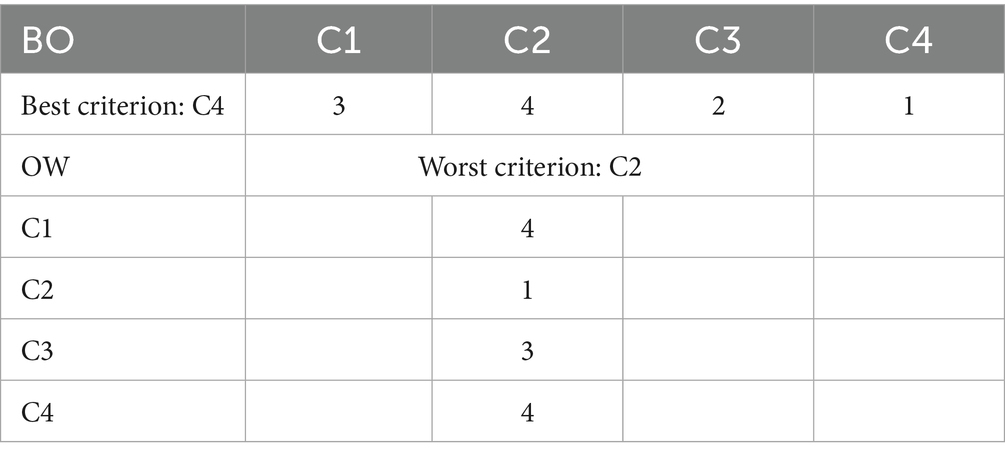
Table 7. Best-to-others (BO) and others-to-worst (OW) pairwise comparison vectors: aspect C.
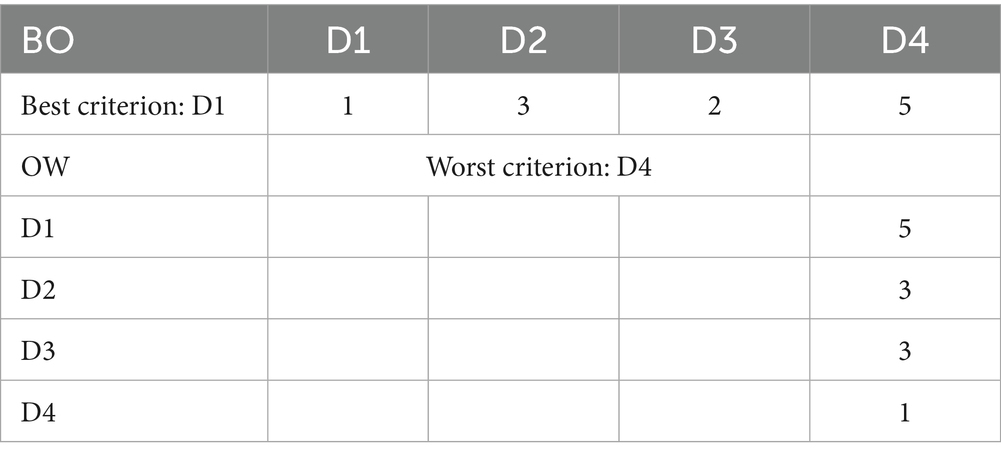
Table 8. Best-to-others (BO) and others-to-worst (OW) pairwise comparison vectors: aspect D.

Table 9. Best-to-others (BO) and others-to-worst (OW) pairwise comparison aspect E.
Finally, we applied Equations 1 and 2 to compute the relative weights and target values. A target value closer to zero indicated a higher degree of consistency among the factors. The absolute weights were subsequently calculated using Equation 4 and are presented in Table 10.
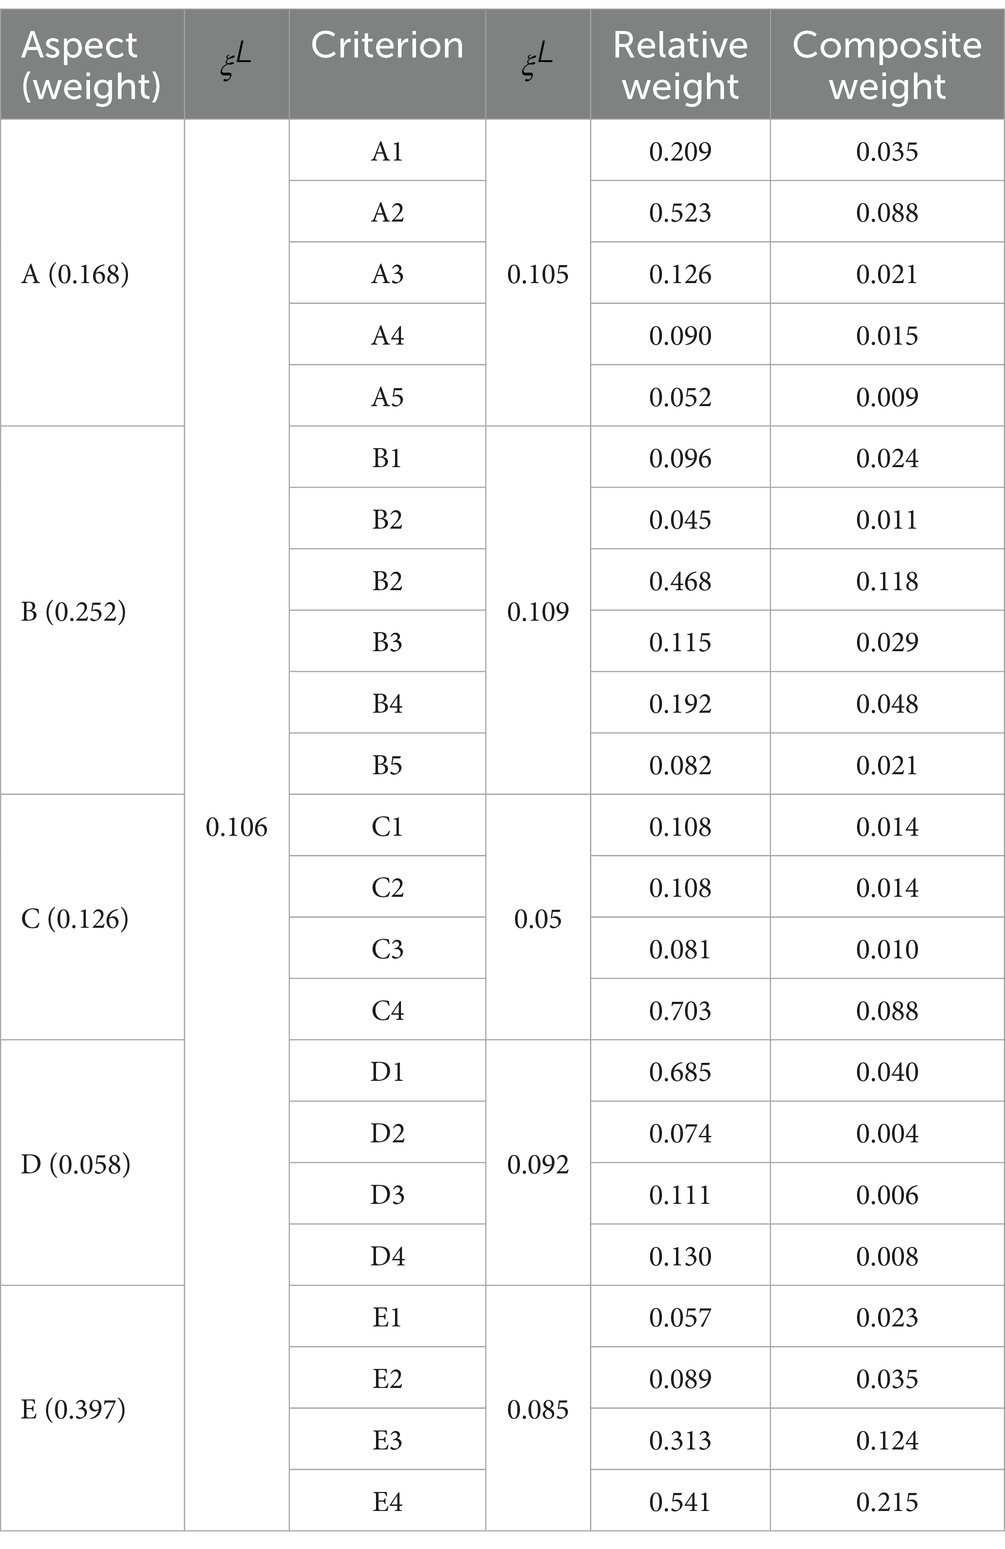
Table 10. Weight calculation results of expert I.
Using Equation 3 in conjunction with the data presented in Tables 2, 10, the CP values were calculated. The results indicate that all CP values were less than or equal to 0.1, confirming that the weight calculations for Expert I satisfied the consistency requirements of the BWM model. The evaluation procedures for Experts II, III, IV, and V followed the same process as for Expert I. The individual results were subsequently integrated, and the geometric mean of the experts’ assessments was computed to derive the final factor weights. These weights were then ranked in descending order to identify the key determinants, as reported in Table 11. Building upon this comprehensive ranking, the weight values of each factor were further analyzed using SPSS software through elbow method cluster analysis. The analysis identified E4, E3, A2, B3, C4, B5, A1, and D1 as the primary key factors influencing exhibition effectiveness.
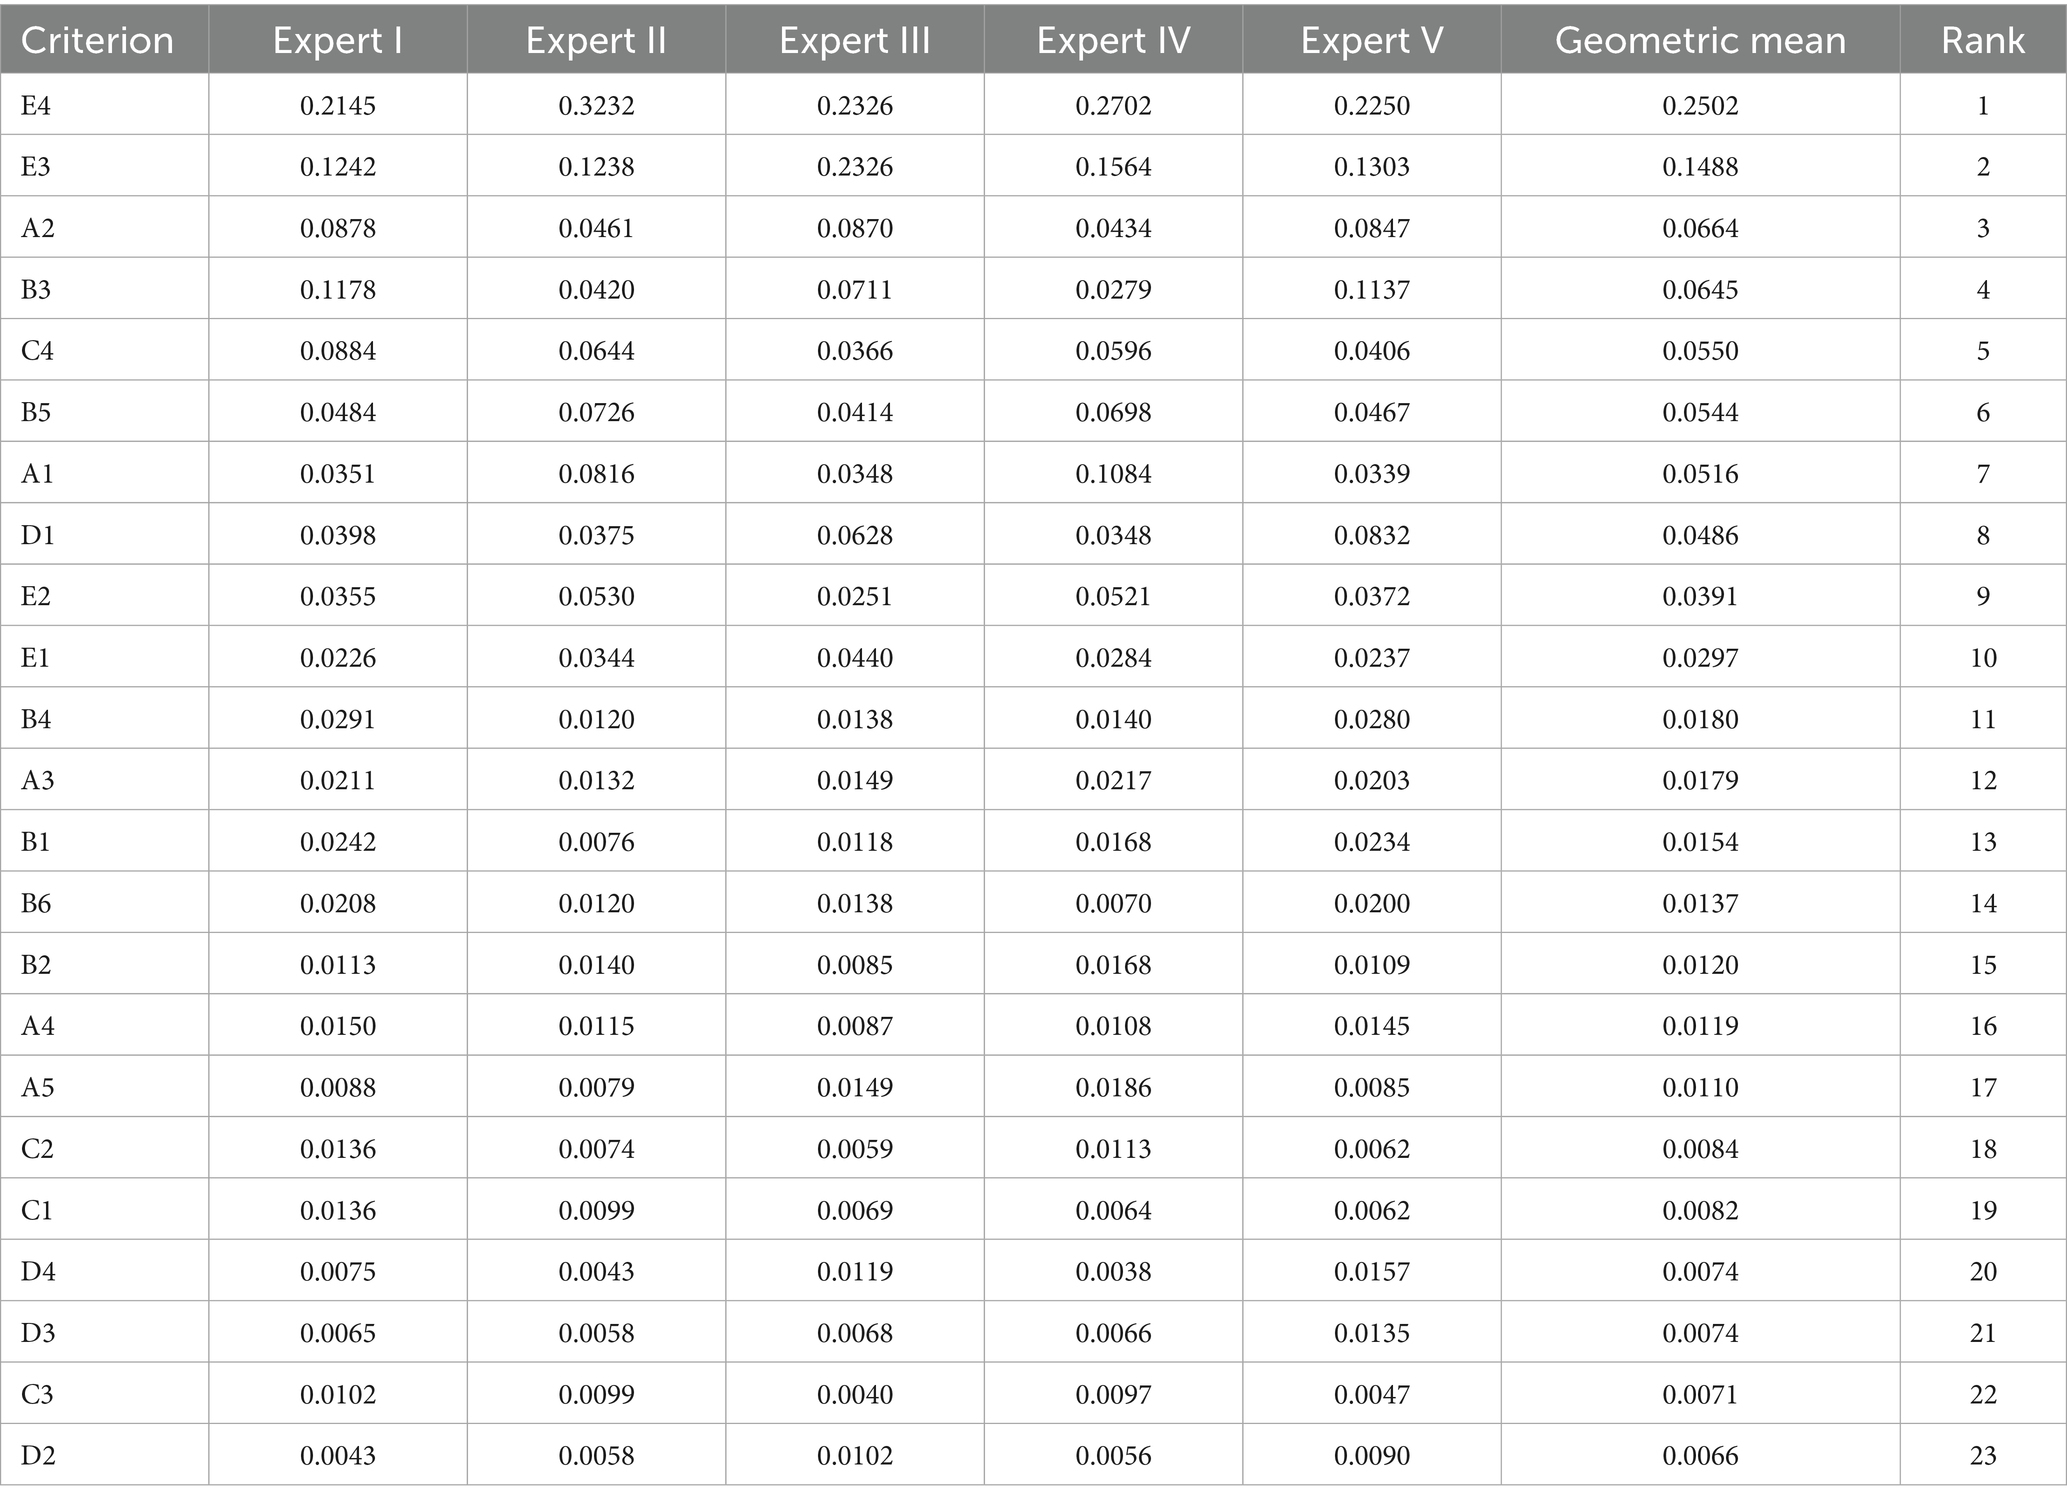
Table 11. Weight and rank of criterion.
4.2 Integrated management of key factors
This study focuses on Fishery Company Z for empirical research. As a publicly listed company and a leading enterprise in the domestic fisheries industry in China, Company Z places significant emphasis on exhibitions as a key strategy to enhance its brand influence and attract potential customers. Choosing Company Z for a case study offers strong representativeness. Raw data were collected from the eight exhibitions in which Company Z participated throughout 2023, aligning with the key factors identified in Section 4.1, as detailed in the accompanying table. The company measures exhibition effect (Y) using the number of partnerships established as the sole performance criterion.
• Step 4: The data in Table 12 and Equation 5 were utilized to conduct a correlation analysis between the key factors and exhibition effect. The results of this analysis are presented in Table 13.
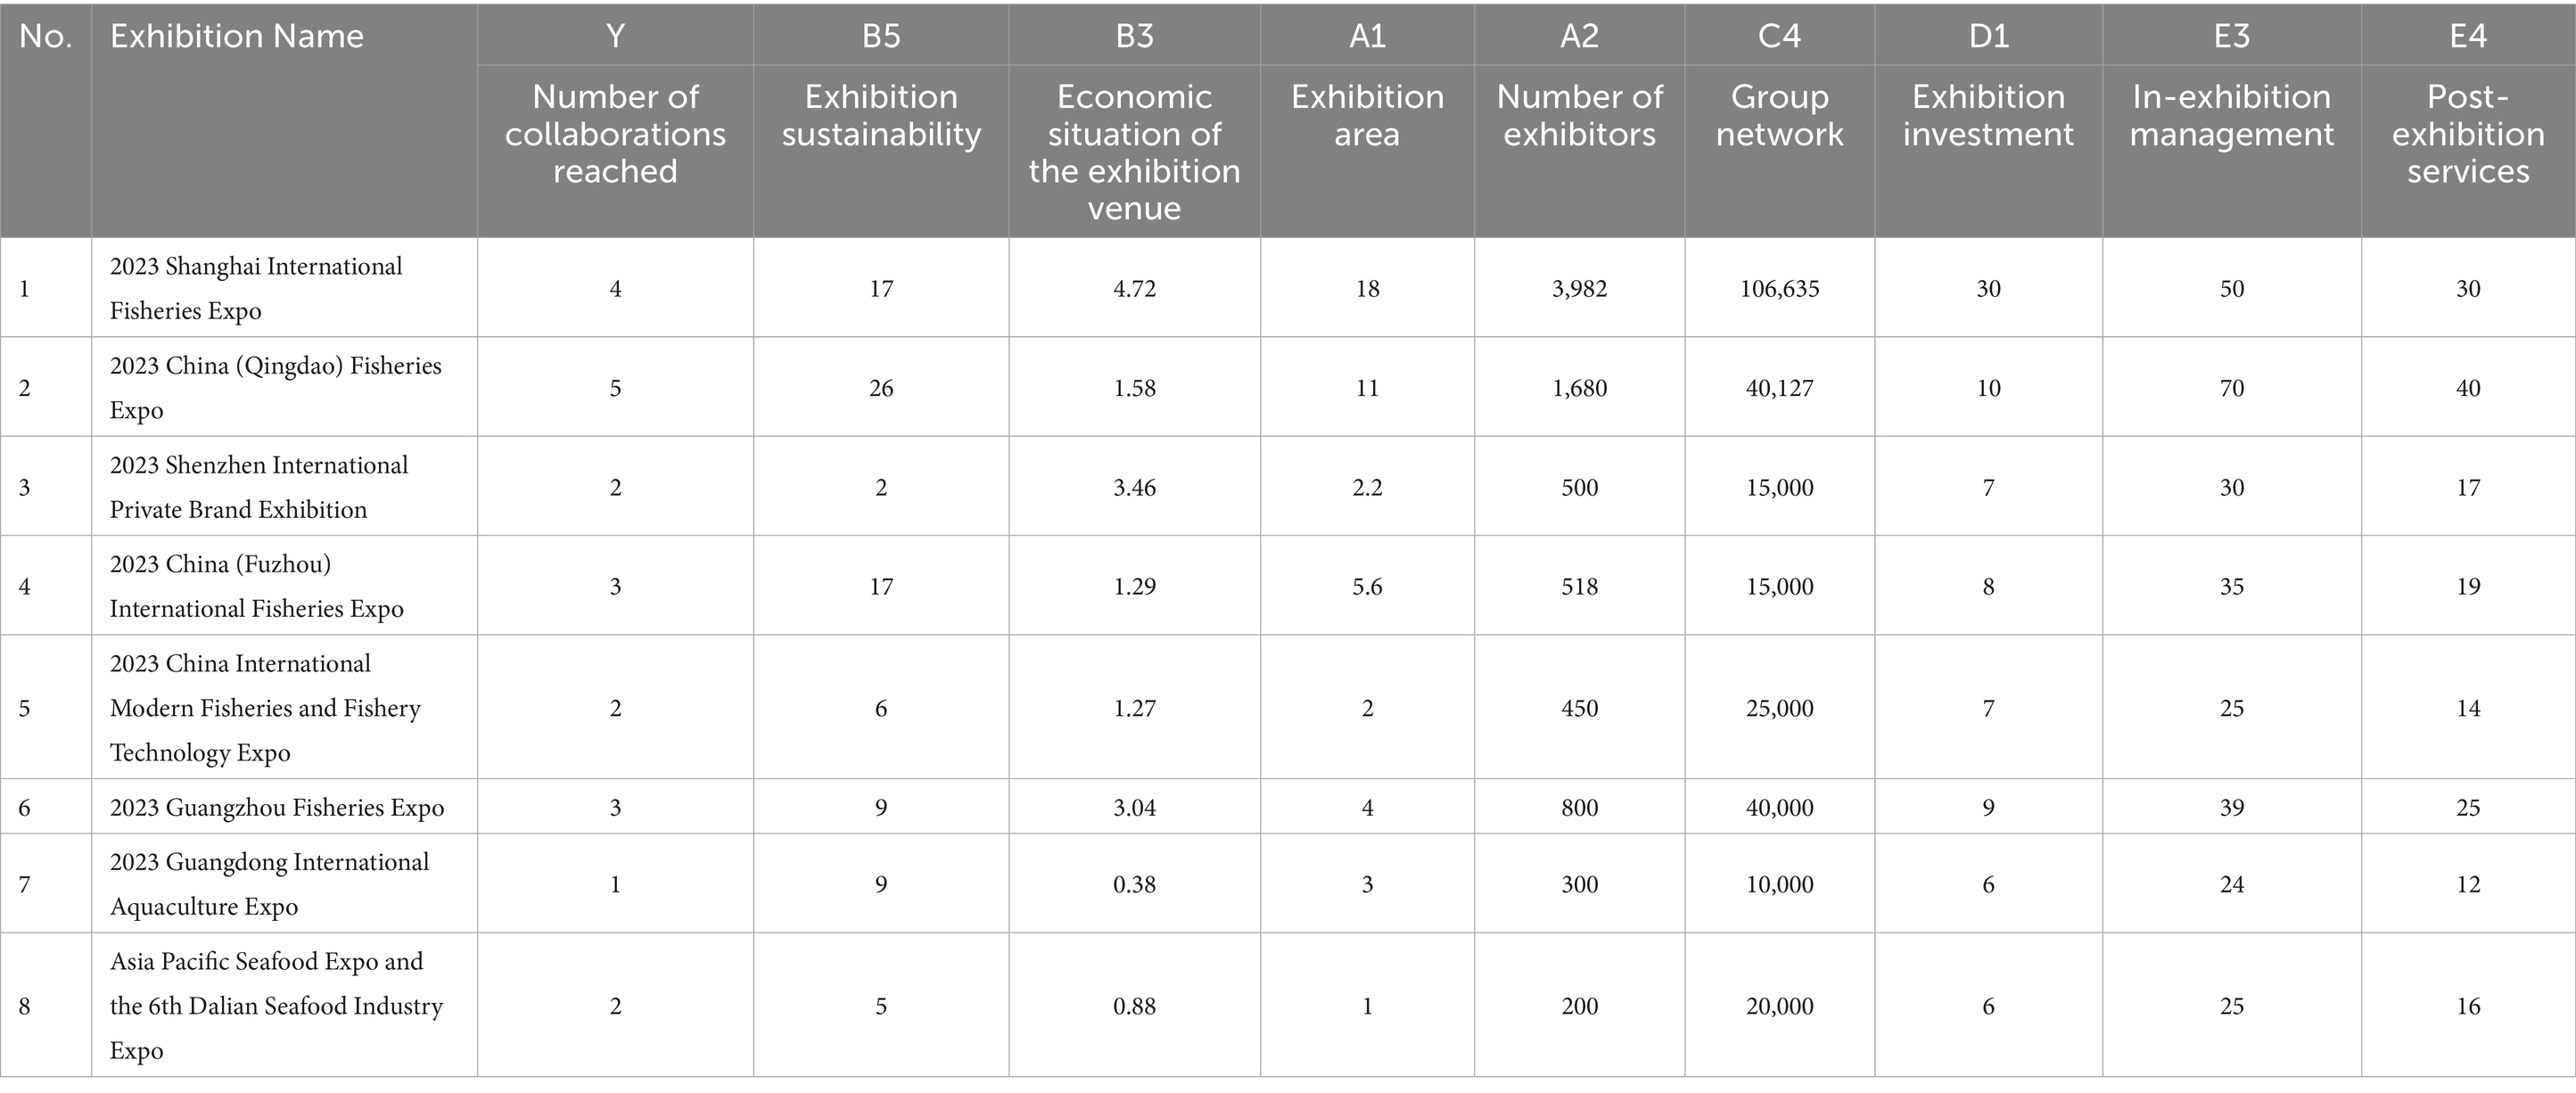
Table 12. The collection of raw data using Fishery Company Z as an example.
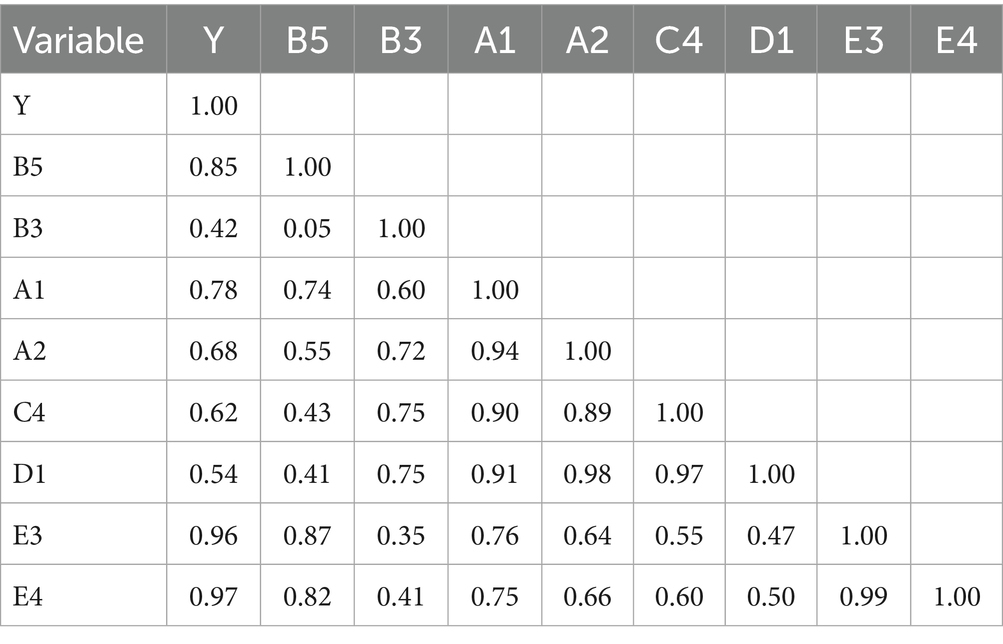
Table 13. Correlation coefficient table.
Based on the correlation rating criteria in Step 4, we found a significant correlation between factors E3 and E4 with Y, a moderate correlation between B5, A1, A2, and C4 with Y, and a low correlation between B3 and D1 with Y. Because of this, we decided to eliminate B3 and D1 from further consideration. Also, due to the strong correlation between E3 and E4, we cannot include both factors in the model. E3 represents the number of partners negotiated during the exhibition, and E4 represents the number of partners providing continuous services after the exhibition. Since post-exhibition partnerships are a direct result of exhibition negotiations, we identified E3 as the root factor of E4. Thus, we retained only E3 for constructing the multiple regression model.
• Step 5: Construction of the Multiple Regression Model.
Based on the analysis, B5, A1, A2, C4, and E3 were selected to build a multiple regression model for predicting Y. EVIEWS software was used to facilitate the model development and testing process according to Equations 6–9. The results are presented in Table 14.

Table 14. Multiple regression results.
Based on the test results, the R-squared value of the model was 94.60%, indicating a high degree of fit. The Durbin-Watson (D-W) statistic was 1.55, which falls within the acceptable range of 1.5–2.5, confirming that the model passed the autocorrelation test. In the significance test, the 90% confidence level F-test indicated a critical value of 5.31, while the calculated F-value was 7.00293, demonstrating that the model passed the overall significance test. According to the t-test results, the critical value at a 90% confidence level was 1.8595, and the t-value for E3 was 1.87, which also passed the test, confirming that E3, as an explanatory variable, has a significant impact on Y. The t-tests for the other variables did not pass, suggesting that their correlation with Y is moderate.
In summary, the multiple regression equation is constructed based on the significant factors B5, A1, A2, C4, and E3. These variables effectively map Y values, offering valuable insights into the relationship between the key factors and exhibition effect.
• Step 6: Integrated Management of Key Factors.
Considering the constraints of limited resources, management capabilities, and energy, it takes time for businesses to implement lean management across all key areas. Additionally, there may be complex relationships or potential conflicts among these key areas, so an integrated management plan is necessary. We calculated the correlation between significant factors and other key areas (the detailed process is omitted) and presented the results in Table 15.
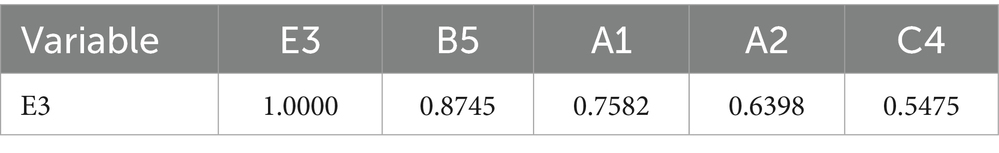
Table 15. The calculation results of the correlation between significant factors and other key factors.
It appears that there is a moderate correlation between B5, A1, and A2 with E3. However, C4 shows a weaker correlation. Notably, A2 (number of exhibitors) is highly consistent with E3, which measures the number of potential partners negotiated during the exhibition as a quantitative indicator of management success. On the other hand, A1 (exhibition area) and B5 (exhibition sustainability) do not align as effectively with E3 in practical management contexts.
Given limited resources, Company Z should prioritize the following strategies to enhance exhibition effect:
First, optimize in-exhibition management (E3) and prioritize exhibitions with a large number of exhibitors (A2) when selecting events.
Second, potential participants can be filtered by focusing on factors such as exhibition area (A1) and sustainability (B5).
Third, if additional resources permit, secondary factors should be considered, including the attention group network (C4), the economic conditions of the exhibition venue (B3), and exhibition investment (D1).
5 Discussions and implications
i. This paper identifies eight key factors for the first time, including in-exhibition management (E3), exhibition sustainability (B5), and exhibition investment (D1). These factors align with the findings of Mitchell et al. (2023) and Bazilevich (2023), supporting the scientific validity of the exhibition effect evaluation index system developed in this study. However, in most studies, key factors are ranked solely by descending weight after identification. Management measures are then proposed individually for each factor, an approach that is somewhat unreasonable. The main issue is the neglect of the complex relationships between key factors. When constructing an evaluation index system, analyzing the pairwise relationships between all indicators is too labor-intensive and challenging to carry out in practice. Nevertheless, after identifying the key factors, ignoring the relationships between them can lead to many problems. This paper has revealed a specific causal relationship between E3 and E4; managing them separately would result in resource waste. Focusing on root factors is a better choice. For example, independent management will offset the implementation effect, assuming a contradictory relationship between factors. In this case, determining a balance measure is crucial. Therefore, after identifying key factors, this between factors, which is a scientific complement to existing evaluation methods.
ii. In our study’s secondary screening of key factors, we omitted the economic conditions of the exhibition venue (B3) and exhibition investment (D1). This finding contrasts with previous research, indicating potential differences in context or methodology in evaluating the effectiveness of exhibitions. Lou and Huang (2023) argue that exhibition investment is directly proportional to exhibition effect, while Liu et al. (2020) suggest that exhibition investment follows a diminishing marginal returns pattern. Holovnia (2022) asserts that the venue’s economic condition clearly impacts the potential customer base, contingent upon the alignment between exhibited products and regional consumption habits. Generally, existing literature identifies D1 and B3 as critical factors in exhibition management. However, while D1 and B3 are recognized as necessary in the present study, they are not assigned the highest priority in management decisions. This discrepancy can be attributed to evolving trends in the exhibition industry. Contemporary exhibitions are no longer solely focused on product sales; instead, they increasingly emphasize personalization and customization, with some exhibitors targeting highly specialized niche markets. In this context, traditional approaches emphasizing scale and investment are less effective in enhancing exhibition effect. Exhibitors are placing greater importance on participant engagement and experience and the uniqueness of exhibits and services offered. As a result, the behavior of exhibitors has emerged as a critical determinant of exhibition success, necessitating lean behavioral management that aligns with exhibition objectives and desired outcomes. It should be emphasized that the exclusion of B3 and D1 from the final key factor set does not imply that environmental variables can be disregarded. Elements such as exhibition type and location continue to exert measurable influence on exhibition effectiveness (Zıraman and İmamoğlu, 2020). Consistent with the findings of this study, exhibition type is closely associated with the number of exhibitors (A2), suggesting that organizers should prioritize formats capable of attracting a larger pool of participants. Similarly, exhibition location is directly linked to exhibition area (A1), where accessibility, transportation convenience, and reasonable venue rental costs contribute to increasing A1 and, in turn, attracting both exhibitors and attendees. More broadly, the results indicate that exhibitors are placing growing emphasis on participant engagement, experiential quality, and the distinctiveness of exhibits and services offered. Consequently, exhibitor behavior has emerged as a critical determinant of exhibition success, underscoring the need for lean behavioral management strategies that align with overarching exhibition objectives and desired outcomes.
iii. The study findings highlight in-exhibition management (E3) as the most crucial factor, leading to the proposal of an integrated management plan that includes indicators such as the number of exhibitors (A2), exhibition area (A1), and exhibition sustainability (B5). This management approach involves the coordinated efforts of exhibitors, exhibition organizers, and government agencies. The results show that exhibitor behavior and selection are part of a unified decision-making process, and an isolated management plan based solely on individual key factors is inadequate. If an exhibition does not meet all the criteria outlined in A2, A1, and B5, the optimal strategy is to achieve a balanced approach across all three indicators, rather than prioritizing one over the others. Additionally, while post-exhibition management (E4) was not emphasized as a key factor in the final plan, a clear causal relationship exists between post-exhibition management and in-exhibition management (E3). It is crucial in practice to avoid overemphasizing in-exhibition management at the expense of post-exhibition tracking and negotiations. Ensuring alignment and consistency in behaviors and investments during and after the exhibition is essential for maximizing overall effectiveness.
iv. In constructing the indicator system for exhibition effectiveness, this paper explicitly considered industry-specific and region-specific characteristics. Accordingly, the system incorporated factors such as Core Competitiveness (C3), Economic Situation of the Exhibition Venue (B3), and Regional Business Environment (B4). However, empirical results indicate that only B3 qualifies as a key factor, whereas the other context-specific indicators do not exert a sufficiently strong influence to warrant prioritization during exhibition preparation. Moreover, because B3 is readily quantifiable, the findings of this study can be generalized to conventional market environments and are not restricted to particular industries. It is important to note, however, that the exhibitions examined in this research are marketing-oriented, with effectiveness closely tied to post-exhibition product sales. Public welfare exhibitions, such as science popularization or charitable exhibitions, which involve substantially different expected outcomes, fall outside the scope of this paper (Kellezi, 2014). Furthermore, the case study in this paper focused on a publicly listed company, primarily to ensure access to reliable analytical data derived from disclosed financial reports. Nevertheless, the findings of this study are also applicable to small- and medium-sized enterprises (SMEs), provided that quantitative data corresponding to the key factors identified herein can be effectively obtained. This flexibility underscores the broader applicability of the proposed methodology across organizations of varying sizes, enhancing its practical relevance in diverse exhibition contexts.
This paper identifies the key influencing factors of exhibition effectiveness through a hybrid approach that combines the BWM with regression analysis, underscoring the necessity of collaborative management. In the post-pandemic and increasingly digitalized context, exhibition organizers should prioritize the development of integrated online–offline experiences, with particular emphasis on strengthening real-time interaction and enhancing data tracking capabilities to foster greater engagement among both exhibitors and visitors. Furthermore, organizers are advised to focus on exhibitions characterized by high exhibitor participation and sustained involvement, while strategically allocating resources to avoid overreliance on traditional indicators such as venue economic level or purely financial investment. Building on these insights, the study recommends the adoption of integrated strategies that coordinate diverse resources and leverage digital tools to enable lean management across the entire exhibition lifecycle—from pre-event planning through post-event evaluation. Such an approach not only responds to the rapidly evolving exhibition environment but also advances the theoretical understanding of how digital transformation and collaborative practices can jointly enhance exhibition effectiveness.
6 Conclusion
This paper aims to improve the effectiveness of exhibitions by creating a comprehensive methodology to identify and manage key factors. The proposed method offers several advantages over traditional approaches for evaluating exhibition performance. Firstly, most existing Multi-Criteria Decision-Making (MCDM) methods suffer from inaccuracies in ranking key factors based on weight measures due to expert scoring and data collection limitations. However, our method employs multiple regression models to refine key factors identified through the Best-Worst Method (BWM). This iterative screening process simplifies data collection and makes it more feasible to implement. Secondly, our method addresses potential issues arising from strong correlations between evaluation indicators that are often overlooked during the construction of evaluation systems. By constructing a regression model based on the initial key factors and exhibition effect, factors with strong causal relationships can be eliminated, facilitating the optimization of the evaluation index system. Thirdly, our approach emphasizes the collaborative management of key factors. It focuses on the complex interrelationships between factors and recognizes that integrated management models can significantly reduce costs or yield multiplier effects when synergistic relationships exist, and identify a balanced strategy to prevent counterproductive optimization efforts when conflicting relationships arise.
This paper conducted an empirical investigation of Company Z to validate the proposed method for identifying and managing key factors influencing exhibition effectiveness. In the first stage, the Best–Worst Method (BWM) was applied to identify potential key factors. Correlation analysis was then employed to eliminate elements and derivative variables exhibiting weak associations with exhibition outcomes. Building on this, a multiple regression model was constructed to further refine the set of key factors. The case study results revealed that in-exhibition management (E3) emerged as the most decisive determinant of exhibition effectiveness, whereas exhibition investment (D1) and the broader economic situation (B3) were not prioritized within the model. On this basis, a prioritized collaborative management strategy was developed, explicitly tailored for enterprises facing resource constraints, thereby demonstrating the practical applicability of the proposed framework.
The analytical methods and conclusions of this study offer scientific and actionable support for strategic decision-making in the exhibition industry under complex and uncertain conditions. In contrast to traditional approaches, the hybrid model proposed here not only identifies with greater precision the key factors that drive exhibition outcomes but also highlights the synergistic effects and trade-offs among multiple determinants. This enables organizers to move beyond simplistic management models that rely heavily on single-factor inputs or experiential judgment. Within the current context of accelerated digitalization and heightened emphasis on return on investment, the proposed method equips enterprises to make efficient, data-driven decisions, optimize resource allocation, and implement integrated management strategies across the entire exhibition lifecycle—from pre-event planning to in-event operations and post-event evaluation. Looking ahead, this research framework could be further enhanced by incorporating intelligent algorithms and real-time data streams, thereby expanding its applicability to personalized and public-oriented exhibition contexts. Such advancements would provide enduring theoretical and practical guidance for the refined, intelligent transformation of the exhibition industry.
Data availability statement
The original contributions presented in the study are included in the article/supplementary material, further inquiries can be directed to the corresponding author.
Author contributions
DS: Conceptualization, Data curation, Formal analysis, Methodology, Software, Writing – original draft. MX: Investigation, Validation, Visualization, Writing – review & editing. YZ: Project administration, Resources, Supervision, Writing – review & editing.
Funding
The author(s) declare that financial support was received for the research and/or publication of this article. This research was partially supported by the Technology Innovation Project of Dalian Neusoft University of Information (TIFP202308).
Conflict of interest
The authors declare that the research was conducted in the absence of any commercial or financial relationships that could be construed as a potential conflict of interest.
Generative AI statement
The authors declare that no Gen AI was used in the creation of this manuscript.
Any alternative text (alt text) provided alongside figures in this article has been generated by Frontiers with the support of artificial intelligence and reasonable efforts have been made to ensure accuracy, including review by the authors wherever possible. If you identify any issues, please contact us.
Publisher’s note
All claims expressed in this article are solely those of the authors and do not necessarily represent those of their affiliated organizations, or those of the publisher, the editors and the reviewers. Any product that may be evaluated in this article, or claim that may be made by its manufacturer, is not guaranteed or endorsed by the publisher.
References
Aditya, B. G. (2019). Exhibition service quality and its influence to exhibitor satisfaction. Adv. Econ. Bus. Manag. Res. 111, 66–74. doi: 10.2991/ICOBOROT-18.2019.10
Alqahtani, A. Y., and Makki, A. A. (2023). A DEMATEL-ISM integrated modeling approach of influencing factors shaping destination image in the tourism industry. Adm. Sci. 13:201. doi: 10.3390/admsci13090201
Anisseh, M., Piri, F., Shahraki, M. R., and Agamohamadi, F. (2012). Fuzzy extension of TOPSIS model for group decision making under multiple criteria. Artif. Intell. Rev. 38, 325–338. doi: 10.1007/s10462-011-9258-2
Bazilevich, S. V. (2023). Analytical aspects of management and implementation of exhibition projects. CITISÈ 35, 38–55. doi: 10.15350/2409-7616.2023.1.04
Bermejo, L. R., and Cuadrado, R. J. R. (1995). Urban hierarchies and territorial competition in Europe: exploring the role of fairs and exhibitions. Urban Stud. 32, 379–400.
Braun, B. M. (1992). The economic contribution of conventions: the case of Orlando, Florida. J. Travel Res. 30, 32–37. doi: 10.1177/004728759203000305
De Groote, P. (2005). A multidisciplinary analysis of world fairs (= expos) and their effects. Tour. Rev. 60, 12–19. doi: 10.1108/eb058448
Dekimpe, G. M. A., Francois, P. A., Gopalakrishna, S. A. L. L., Bulte, G. A., and Christophe, V. D. (1997). Generalizing about trade show effectiveness: a cross-national comparison. J. Mark. 61, 55–64.
Dwyer, L., Forsyth, P., and Spurr, R. (2006). Assessing the economic impacts of events: a computable general equilibrium approach. J. Travel Res. 45, 59–66. doi: 10.1177/0047287506288907
Fang, Z., Zhang, Y., Wang, Z., and Zhang, L. (2017). Spatial agglomeration of exhibition enterprises on a regional scale in China. Chin. Geogr. Sci. 27, 497–506. doi: 10.1007/s11769-017-0879-5
Gereffi, G., Humphrey, J., and Sturgeon, T. (2005). The governance of global value chains. Rev. Int. Polit. Econ. 12, 58–69. doi: 10.1080/09692290500049805
Habes, M., Alhazmi, A. H., Elareshi, M., and Attar, R. W. (2024). Understanding the relationship between AI and gender on social TV content selection. Front. Commun. 9:1410995. doi: 10.3389/fcomm.2024.1410995
Hang, Y. (2022). Profit information system of exhibition enterprises based on multiobjective optimization algorithm. Mob. Inf. Syst. 2022, 1–9. doi: 10.1155/2022/7898076
Hansen, K. (2004). Measuring performance at trade shows scale development and validation. J. Bus. Res. 57, 156–166. doi: 10.1016/S0148-2963(02)00269-2
Herbig, P., Palumbo, F., and O’Hara, B. (1998). Differences in trade show behavior between American-focused firms and worldwide-oriented firm. Int. J. Comm. Manag. 6, 97–109.
Holovnia, O. M. (2022). Exhibitions and fairs as an integration tool for implementing the interests of agricultural enterprises. Probl. Econ. 1, 20–25. doi: 10.32983/2222-0712-2022-1-20-25
Kellezi, J. (2014). Trade shows: a strategic marketing tool for global vompetition. Procedia Econ. Finance 9, 466–471. doi: 10.1016/S2212-5671(14)00048-3
Kim, S., and Chon, K. K. S. (2009). An economic impact analysis of the Korean exhibition industry. Int. J. Tourism Res. 11, 311–318. doi: 10.1002/jtr.691
Kim, S. S., Chon, K., and Chung, K. Y. (2003). Convention industry in South Korea: an economic impact analysis. Tour. Manag. 24, 533–541. doi: 10.1016/S0261-5177(03)00006-2
Kim, I., Kim, S., Choi, S.-J., Kim, D., Choi, Y., Kim, D., et al. (2022). Identifying key elements for establishing sustainable conventions and exhibitions: use of the Delphi and AHP approaches. Sustainability 14:1678. doi: 10.3390/su14031678
Kim, B.-S., Kim, K.-B., Park, C.-W., and Lee, J. (2020). Effects of exhibitors' trade show participation on market performance: longitudinal research. Asia Pac. J. Tourism Res. 25, 1343–1358. doi: 10.1080/10941665.2020.1851275
Kirchgeorg, M., Jung, K., and Klante, O. (2010). The future of trade shows: insights from a scenario analysis. J. Bus. Ind. Mark. 25, 301–312. doi: 10.1108/08858621011038261
Lai, I. K. W., and Wong, J. W. C. (2021). From exhibitor engagement readiness to perceived exhibition performance via relationship quality. J. Hosp. Tour. Manag. 46, 144–152. doi: 10.1016/j.jhtm.2020.12.004
Lee, J., and Ryan, C. (2024). EXPRESS: influencing exhibitor loyalty through trust and value co-creation – the moderating effect of visit frequency. J. Hosp. Tour. Res. 49, 891–905. doi: 10.1177/10963480241311151
Lee, T.-S., Shia, B.-C., and Huh, C.-L. (2016). Social media sentimental analysis in exhibition's visitor engagement prediction. Am. J. Ind. Bus. Manag. 6, 392–400. doi: 10.4236/ajibm.2016.63035
Lei, S., and Wu, Y. M. (2024). The impact of human resource management practices on employee development and organizational performance. Adv. Econ. Manag. Polit. Sci. 89, 158–163. doi: 10.54254/2754-1169/89/20231412
Lin, C.-T., and Lin, C. W. (2013). Exhibitor perspectives of exhibition service quality. J. Conv. Event Tour. 14, 293–308. doi: 10.1080/15470148.2013.837020
Liu, X., Yu, L., Zhang, Y., and Chao, Y. (2020). Spatial spillover effect of financial flexibility on investment in China’s convention and exhibition listed companies. Math. Probl. Eng. 2020, 1–10. doi: 10.1155/2020/3926747
Lou, K.-R., and Huang, Y.-F. (2023). Effect of exhibition facilities, professional competence, and green procurement on green meeting, incentive travel, convention, and exhibition industry performance measurement: a case study of the exhibition industry of Taiwan. Sustainability 15:12179. doi: 10.3390/su151612179
Lu, M. (2022). Coupling and coordination of the regional economy, tourism industry, and exhibition industry of China's provinces. Discret. Dyn. Nat. Soc. 2022, 1–11. doi: 10.1155/2022/8535783
Mitchell, V., Makri, A., Schlegelmilch, B. B., and Blaha, P. (2023). Exhibition event evaluation revisited: an individual value approach. Event Manag. 27, 107–125. doi: 10.3727/152599522x16419948695044
Moon, H. S., Kim, J. K., and Ryu, Y. U. (2013). A sequence-based filtering method for exhibition booth visit recommendations. Int. J. Inf. Manag. 33, 620–626. doi: 10.1016/j.ijinfomgt.2013.03.004
Pan, J.-N., Pan, J., and Lee, C. Y. (2009). Finding and optimising the key factors for the multiple-response manufacturing process. Int. J. Prod. Res. 47, 2327–2344. doi: 10.1080/00207540701777423
Raghutla, C., and Chittedi, K. R. (2021). Financial development, real sector and economic growth: evidence from emerging market economies. Int. J. Financ. Econ. 26, 6156–6167. doi: 10.1002/ijfe.2114
Rezaei, J. (2015). Best-worst multi-criteria decision-making method. Omega 53, 49–57. doi: 10.1016/j.omega.2014.11.009
Rosson, P. J., Seringhaus,, and Rolf, F. H. (1955). Visitor and exhibitor interaction at industrial trade fairs. J. Bus. Res. 32, 81–90.
Sasri, S., and Kusumastuti, R. (2024). “The impact of value co-creation of the NAIFEST exhibition on the perceived value of INDOBUILDTECH 2022 exhibitors” in Advances in business strategy and competitive advantage book series, 371–405.
Seringhaus, F. H. R., and Rosson, P. J. (2004). An analysis model for performance measurement of international trade fair exhibitors. Probl. Perspect. Manage. 2, 152–165. Available at: https://businessperspectives.org/journals/problems-and-perspectives-in-management/issue-4/an-analysis-model-for-performance-measurement-of-international-trade-fair-exhibitors
Tucker, M., Bricker, J., and Huerta, A. I. (2011). An approach to measuring impact and effectiveness of educational science exhibits. J. Appl. Commun. 95, 6–20.
Wan, L., Lan, Y., Jian, J., and Liu, K. (2025). How social media involvement affect consumer purchase intention on online social networking sites: examining the mediating role of self-disclosure. Front. Commun. 10:1604727. doi: 10.3389/fcomm.2025.1604727
Yang, X. (2024). The impact of convention and exhibition industry on regional economic development based on grey relational model. J. Math. 2024, 1–8. doi: 10.1155/2022/9752636
Zhang, W., Mai, X., Huan, S., and Ju, P. (2020). An empirical study on the influence of atypical visitors’ interactive learning on exhibition brand equity. iBusiness 12, 33–51.
Keywords: exhibition industry, exhibition effect, key factors, BWM, multiple regression
Citation: Sun D, Xue M and Zhao Y (2025) Identifying and controlling key factors in exhibition effect: a hybrid method combining Best-Worst Method and regression models. Front. Commun. 10:1670964. doi: 10.3389/fcomm.2025.1670964
Edited by:
Tereza Semerádová, Technical University of Liberec, CzechiaReviewed by:
Marco Antonio Zamora Antuñano, Universidad de Investigación e Innovación de México, MexicoJosé Roberto Grande-Ramírez, Technological University of the Veracruz Center, Mexico
Copyright © 2025 Sun, Xue and Zhao. This is an open-access article distributed under the terms of the Creative Commons Attribution License (CC BY). The use, distribution or reproduction in other forums is permitted, provided the original author(s) and the copyright owner(s) are credited and that the original publication in this journal is cited, in accordance with accepted academic practice. No use, distribution or reproduction is permitted which does not comply with these terms.
*Correspondence: Yadan Zhao, dmlja3l6aGFvMTIzNDU2QDE2My5jb20=