 Alexander Hoelzemann
 Kristof Van Laerhoven
- Ubiquitous Computing, University of Siegen, Siegen, Germany
Research into the detection of human activities from wearable sensors is a highly active field, benefiting numerous applications, from ambulatory monitoring of healthcare patients via fitness coaching to streamlining manual work processes. We present an empirical study that evaluates and contrasts four commonly employed annotation methods in user studies focused on in-the-wild data collection. For both the user-driven, in situ annotations, where participants annotate their activities during the actual recording process, and the recall methods, where participants retrospectively annotate their data at the end of each day, the participants had the flexibility to select their own set of activity classes and corresponding labels. Our study illustrates that different labeling methodologies directly impact the annotations' quality, as well as the capabilities of a deep learning classifier trained with the data. We noticed that in situ methods produce less but more precise labels than recall methods. Furthermore, we combined an activity diary with a visualization tool that enables the participant to inspect and label their activity data. Due to the introduction of such a tool were able to decrease missing annotations and increase the annotation consistency, and therefore the F1-Score of the deep learning model by up to 8% (ranging between 82.1 and 90.4% F1-Score). Furthermore, we discuss the advantages and disadvantages of the methods compared in our study, the biases they could introduce, and the consequences of their usage on human activity recognition studies as well as possible solutions.
1 Introduction
Sensor-based activity recognition is one of the research fields of Pervasive Computing developed with enormous speed and success by industry and science and influencing medicine, sports, industry, and therefore the daily lives of many people. However, current available smart devices are mostly capable of detecting periodic activities like simple locomotions. In order to recognize more complex activities a multimodal sensor input, such as Roggen et al. (2010), and more complex recognition models are needed. Many of the published datasets are made in controlled laboratory environments. Such data does not have the same characteristics and patterns as data recorded in-the-wild. Data that belongs to similar classes but is recorded in an uncontrolled vs. controlled environment can differ significantly since it contains more contextual information (Mekruksavanich and Jitpattanakul, 2021). Furthermore, study participants tend to control their movements more while being monitored (Friesen et al., 2020). The recording of long-term and real-world data is a tedious, time-consuming, and therefore a non-trivial task. Researchers have various motivations to record such datasets but the technical hurdles are still high and problems during the annotation process occur regularly. In Human Activity Recognition research, capturing long-term datasets presents a challenge: balancing precise labeling with minimal participant burden. Sole reliance on self-recall methods, like activity diaries (e.g., Zhao et al., 2013), often leads to imprecise time indications that may not accurately reflect actual activity duration. Such incorrectly or noisy labeled data later on leads to a trained model that is less capable of detecting activities reliably (Natarajan et al., 2013), due to unwanted temporal dependencies learned by wrongly annotated patterns (Bock et al., 2022).
The field of HAR is witnessing a growing emphasis on real-world and long-term activity recognition. This focus stems from the need to address current limitations and achieve reliable recognition of complex daily activities. Existing long-term datasets often rely heavily on self-recall methods or additional tracking apps. These apps can set labels either automatically (Akbari et al., 2021) or require manual selection (Cleland et al., 2014). However, such approaches present challenges, leading many researchers to favor controlled environments for data collection. As a consequence, the number of publicly available “in-the-wild” datasets remains limited.
1.1 Contribution
Our study focuses on the evaluation of 4 different annotation methods for labeling data in-the-wild: ① In situ (lat. on site or in position) with a button on a smartwatch, ② in situ with the app Strava1 (an app that is available for iOS and Android smartphones), ③ pure self-recall (writing an activity diary at the end of the day), and ③ time-series assisted self-recall with the MAD-GUI (Ollenschläger et al., 2022), which displays the sensor data visually and allows to annotate it interactively. Our study was conducted with 11 participants, 10 males, and one female, over 2 weeks. Participants wore a Bangle.js Version 12 smartwatch on their preferred hand, used Strava, and completed self-recall annotations every evening. In the first week, the participants were asked to write an activity diary at the end of the day without any helping material and additionally using two user-initiated methods (in situ button and in situ app) to manually set labels at the start and beginning of each activity. In the second week, the participants were given an additional visualization of the sensor data with an adapted version of the MAD-GUI annotation tool. With the help of this, participants then were instructed to label their data in hindsight with the activity diary as a mnemonic aid. Given labels from both weeks were compared to each other regarding the quality through visual inspection and statistical analysis with regard to the consistency and quantity of missing annotations across labeling methods. The participants in this study were given the freedom to self-report their activity classes based on the diverse range of pursuits encompassed within their daily lives. Consequently, the resulting dataset exhibits a heterogeneous composition, comprising both commonplace, routine activities such as walking, driving, and eating, as well as more specialized and niche activities like badminton, yoga, horse_riding, and gardening. Furthermore, we used a Shallow-DeepConv(LSTM) architecture (see Ordóñez and Roggen, 2016; Bock et al., 2021), and trained models with a Leave-One-Day-Out cross-validation method of six previously selected subjects and each annotation method.
1.2 Impact
Annotating data, especially in real-world environments, is still very difficult and tedious. Labeling such data is always a trade-off between accuracy and workload for the study participants or annotators. We raise awareness among researchers to put more effort into exploring new annotation methods to overcome this issue. Our study shows that different labeling methodologies have a direct impact on the quality of annotations. With the deep learning analysis, we prove that this impacts the model capabilities directly. Therefore, we consider the evaluation of frequently used annotation methods for real-world and long-term studies to be crucial to give decision-makers of future studies a better base on which they can choose the annotation methodology for their study in a targeted way.
2 Related work
A very limited number of datasets are currently publicly available which were recorded in the wild (e.g. Berlin and Van Laerhoven, 2012; Thomaz et al., 2015; Sztyler and Stuckenschmidt, 2016; Gjoreski et al., 2018; Vaizman et al., 2018). Sztyler and Stuckenschmidt (2016) and Gjoreski et al. (2018) were captured in naturalistic settings, but the participants were equipped with multiple sensors on various body locations and were filmed by a third party during the exercises. Such visible equipment and the presence of an observer could potentially introduce a behavior bias (Yordanova et al., 2018) in the data, as it may alter participants' movement patterns due to the constant reminder that they are participating in a study (Friesen et al., 2020). Furthermore, multimodal datasets recorded with multiple body-worn sensors, rather than a single Inertial Measurement Unit (IMU), have faced the challenge of proper inter-sensor synchronization (Hoelzemann et al., 2019). A comprehensive dataset encompassing a diverse range of classes, accurate annotations, and recorded by a single device that is nearly unnoticeable to the participant (and therefore unlikely to influence their behavior or movement patterns), is not yet publicly available due to the aforementioned obstacles. According to Stikic et al. (2011) and later Cleland et al. (2014), we distinguish between 6 or 7, respectively, different methods and two environments (online/offline) of labeling data, the methods are (1) Indirect Observation, (2) Self-Recall, (3) Experience Sampling, (4) Video/Audio Recordings, (5) Time Diary, (6) Human Observer, (7) Prompted Labeling. Cruz-Sandoval et al. (2019) uses 4 different categories to classify data labeling approaches, these are (1) temporal (when)—is the label conducted during or after the activity, (2) annotator (who)—is the label given by the individual itself or by an observer, (3) scenario (where)—is the activity labeled in a controlled (e.g laboratory) or uncontrolled (in-the-wild) environment, and (4) annotation mechanism (how)—is the activity labeled manually, semi-automatically or fully-automatically. All labeling methods have their own benefits, and costs and come with a trade-off between required time and label accuracy. However, not every method is suitable for long-term and in-the-wild recording data. Reining et al. (2020), evaluated the annotation performance between six different human annotators of a MoCap (Motion Capturing) and IMU HAR Dataset for industrial deployment. They came to the conclusion that annotations were moderately consistent when subjects labeled the data for the first time. However, annotation quality improved after a revision by a domain expert. In the following, we would like to go into more detail on what we consider to be the most important labeling methods for the specific field of activity recognition.
2.1 Annotation methods in activity recognition
2.1.1 Self-recall
Self-recall methodologies are generally called methods in which study participants have to remember an event in the past. This methodology is used, for instance, in the medical field [e.g. in the diagnosis of injuries (Valuri et al., 2005)], but also frequently in studies in the field of long-term activity recognition. Van Laerhoven et al. (2008) used this method during a study in which participants were asked to label their personal daily data at the end of the day. They noticed that the label quality depends heavily on the participant's recall and can therefore be very coarse. During a study conducted by Tapia et al. (2004), every 15 min a questionnaire was triggered in which participants needed the answer multiple choice questions about which of 35 predefined activities were recently performed.
2.1.2 App assisted labeling
Cleland et al. (2014) presented in 2014 the so called Prompted labeling. An approach that is already used by commercial smartwatches like the Apple Watch3. In this study user's were asked to set a label for a time period which has been detected as an activity right after the activity stops. Akbari et al. (2021) leverages freely available Bluetooth Low Energy (BLE) information broadcasted by other nearby devices and combines this with wearable sensor data in order to detect context and direction changes. The participant is asked to set a new label whenever a change in the signal is detected. Gjoreski et al. (2017) published the SHL dataset which contains versatile labeled multimodal sensor data that has been labeled using an Android application that asked the user to set a label whenever they detected a position change via GPS. Tonkin et al. (2018) presented a smartphone app that was used in their experimental smart home environment with which study participants were able to either use voice-based labeling, select a label from a list of activities ordered by the corresponding location or scan NFC tags that were installed at locations in the smart house. Similar to Tonkin et al. (2018) and Vaizman et al. (2018) developed an open-source mobile app for recording sensor measurements in combination with a self-reported behavioral context (e.g. driving, eating, in class, showering). Sixty subjects participated in their study. The study found that most of the participants preferred to fill out their past behavior through a daily journal. Only some people preferred to set a label for an activity that they are about to do. Schröder et al. (2016) developed a web-based GUI which can either be used on a smartphone, tablet, or a PC to label data recorded in a smart home environment. However, it is important to mention that, According to Cleland et al. (2014), the process of continually labeling data becomes laborious for participants and can result in a feeling of discomfort.
2.1.3 Unsupervised labeling
Unsupervised labeling is a methodology that uses clustering algorithms to first categorize new samples without deciding yet to which class a sample belongs. Leonardis et al. (2002) presented the concept of finding multiple subsets of eigenspaces where, according to Huynh (2008), each of them corresponds to an individual activity. Huynh uses this knowledge to develop the eigenspace growing algorithm, whereby, growing refers to an increasing set of samples as well as to increasing the so-called effective dimension of a corresponding eigenspace. Based on the reconstruction error (when a new sample is projected to an eigenspace), the algorithm tries to find the best-fitting representation of a sample with minimal redundancy. Hassan et al. (2021) recently published a methodology that uses the Pearson Correlation Coefficient to map very specific labels of a variety of datasets to 4 meta labels (inactive, active, walking, and driving) of the ExtraSensory Dataset (Vaizman et al., 2018).
2.1.4 Human-in-the-Loop (Labeling)
Human-in-the-Loop (Labeling) is a collective term for methodologies that integrates human knowledge into their learning or labeling process. Besides of being applied in HAR research, such techniques are often used in Natural Language Processing (NLP) and according to Wu et al. (2022) the NLP community distinguishes between entity extraction (Gentile et al., 2019; Zhang et al., 2019), entity linking (Klie et al., 2020), Q&A tasks (Wallace et al., 2019), and reading comprehension tasks (Bartolo et al., 2020).
2.1.5 Active learning
Active learning is a machine learning strategy that currently receives a lot of attention in the HAR community. Such strategies involves a Human-in-the-Loop for labeling purposes. In the first step the learning algorithm automatically identifies relevant samples of a dataset which are posteriorly queued to be annotated by an expert. Incorporating a human guarantees high quality labels which directly leads to a better performing classifier. Whether a sample is determined to be relevant, and as well the decision to whom it may get presented for annotation purposes are the main focus of research in this field. Bota et al. (2019) presents a technique that relies on specific criteria defined by three different uncertainty-based selection functions to select samples that will be presented to an expert for labeling and then be propagated throughout the most similar samples. Adaimi and Thomaz (2019) benchmarks the performance of different Active Learning strategies and compared them, with regard to four different datasets with a fully-supervised approach. The authors came to the conclusion that Active Learning needs only 8%–12% of the data to reach similar or even better results than a fully-supervised trained model. These results suggest that presenting pre-selected samples to a human for labeling purposes can reduce the amount of data needed to train a machine learning classifier significantly due to the increased quality of the labels. Miu et al. (2015) presented a system which used the Online Active Learning approach published by Sculley (2007) to bootstrap (Abney, 2002) a machine learning classifier. The publication presented a smartphone app that asked the user right after finishing an activity, which activity has been performed. Afterwards a small subset of the labeled data was used to bootstrap a personalized machine learning classifier.
3 Methodology
Our study is conducted with 11 participants, from which 10 are male and one is female. The participants are between 25 and 45 years old. Out of 11 participants, six are researchers in the field of signal processing and are used to read and work with sensor data. Participants were selected among acquaintances and colleagues.
3.1 Study setup
The study was conducted over a period of 2 weeks, during which participants wore an open-source smartwatch on their chosen wrist. Throughout the two-week study period, the participants were instructed to use four different labeling methods in parallel, as illustrated in Figure 1. In the first week they were asked to use the ① in situ button, ② in situ app, and ③ pure self-recall methods. At the beginning of the 2nd week, we expanded the number of annotation methods with the ④ time-series recall. This annotation method combines the activity diary with a graphical visualization of the participants' daily data.
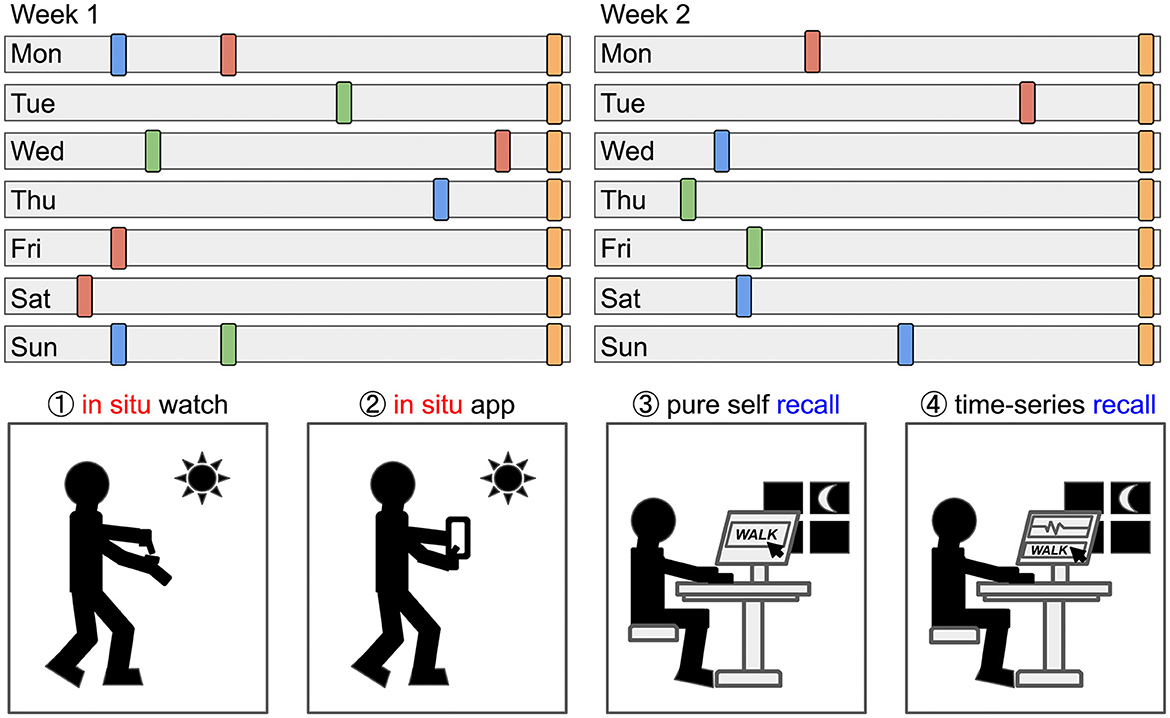
Figure 1. The study participants collected data for 14 days in total and annotated the data with 4 different methods: Labeling ① in situ with a mechanical button, ② in situ with an app, ③ by writing a pure self-recall diary, and ④ writing a self-recall diary assisted by visualization of their time-series data. The upper part of the figure is an artistic representation of our study, where the colored rectangles represent arbitrary annotations and the gray bars represent a full day of recorded activity data.
① The Bangle.js smartwatch has three mechanical buttons on the right side of the case. These buttons are programmed to record the number of consecutive button presses per minute. The button-press annotation method captures the total number of button presses along with their corresponding timestamps, enabling the delineation of the beginning and end of an activity within the time-series data. However, this approach does not inherently assign a specific label or description to the identified activity segment. To address this limitation, we employed an inference strategy that leveraged the temporal alignment of the button-press data with the annotations obtained from other methods. By identifying segments with similar timestamps across multiple annotation modalities, we could infer the appropriate label for the button-press annotations.
② In addition, the participants were asked to track their activities with the smartphone app Strava. Strava is an activity tracker that is available for Android and iOS and freely downloadable from the app stores. The user can choose from a variety of predefined labels and start recording. Recording an activity starts a timer that runs until the user stops it. The time as well as the GPS position of the user during the activity is tracked and saved locally.
③ The pure self-recall methods consist of writing an activity diary on a daily basis at the end of the day. The participants were explicitly told that they should only write down the activities that they still remember 2 h after the measurement stopped.
④ The time-series recall method can be seen as a combination of an activity diary and a graphical representation of the raw sensor data. For visualization and labeling purposes, we provided the participants with an adapted version of the MAD-GUI. The GUI was published by Ollenschläger et al. (2022) and is a generic open-source Python package. Therefore, it can be integrated into one's project. Our adaptions to the package are available for download from a GitHub repository4. It contains changes to the data loader, the definition of available labels, and color settings for displaying the 3D raw data.
3.1.1 Annotation guidelines
The participants were provided with guidelines that instructed them to document recurring daily activities, encompassing both sports and activities of daily living, that exceeded a duration threshold of 10 min. However, the annotation process was deferred until ~2 h after the cessation of the recording session. This temporal offset was implemented to allow for a reasonable time buffer, enabling participants to consolidate their experiences. For instance, if a daily recording concluded at 7 pm, the participant would typically annotate their data around 9 pm, allowing for a 2-h interim period. Each of these annotation methods represents a layer of annotation that is used for the visual, statistical, and deep learning evaluation. Figure 1 illustrates the overall concept.
3.1.2 Annotation process
To capture realistic daily data reflecting participants' natural routines, we granted them complete autonomy in choosing their activity classes. Participants were not restricted to a specific activity protocol; instead, we left the decision of what to label entirely to their judgment. During the study's first week, participants employed methods ①—③ concurrently. In the second week, method ④ was introduced for them to utilize alongside the existing methods. The labels provided by the participants were later interpreted by the researchers and, when necessary, categorized into meta-classes. However, whenever a participant was specific about the activity performed, their label was not summed up into a meta-class. For example, activities such as yoga, badminton, or horse_riding were not combined under the meta-class sport.
3.2 Hardware
Participants wore the commercial open-source smartwatch Bangle.js Version 1 with our open-source firmware5 installed. The device comes with a Nordic 64 MHz nRF52832 ARM Cortex-M4 processor with Bluetooth LE, 64 kB RAM, 512 kB on-chip flash, 4MB external flash, a heart rate monitor, a 3D accelerometer, and a 3D magnetometer. Our firmware only uses the 3D accelerometer and provides the user with the basic functions of a smartwatch, like displaying the time and counting steps. The data is recorded with 25 Hz, a sensitivity of ±8g and saved on the devices' memory with a delta compression algorithm. Therefore, we are able to save up to 8–9 h (depending on how much of the data could be compressed) of data with the given parameters. The smartwatch stops recording as soon as the memory is full. At the end of the day, the participants need to upload their daily data and program the starting time for the next day using our upload web-tool6.
4 Statistical analysis
The labels were statistically analyzed based on their consistency using the Cohen κ score as well as the number of missing annotations across all methods. The Cohen κ score describes the agreement between two annotation methods, which is defined as follows κ = (p0−pe)/(1−pe), (see Artstein and Poesio, 2008; Reining et al., 2020). Where p0 is the observed agreement ratio and pe is the expected agreement if both annotators assign labels randomly. The score shows how uniform two different annotators labeled the same data. For calculation purposes, an implementation provided by Scikit-Learn (2022), was used. Furthermore, missing annotations across methods are measured as the percentage of missing or incomplete annotations. The annotations of all methods were first compared with each other and matched based on the given time indications. Annotations that could not be assigned or were missing were marked accordingly and are the base for calculating this indicator, see Section 6.2 for more information. We used a similar representation as Brenner (1999) to visualize the matches among labeling methods. In this study, the authors compared genome annotations labeled by different annotators with regard to their error scores between different annotators.
5 Effects on deep learning performance
The deep learning analyses are performed using the DeepConvLSTM architecture (Ordóñez and Roggen, 2016) which is based on a Keras implementation of Hoelzemann and Van Laerhoven (2020). We did not perform hyperparameter tuning because it would involve a considerable amount of additional workload, since we trained 64 models independently during the evaluation. We therefore decided to opt out of the architecture with regards to efficiency rather than optimal classification results. Additionally, we don't expect that the actual experiment—evaluating different annotation methods—would benefit from hyperparameter tuning or gain any significant information and insights. Instead, we use the default hyperparameters provided by the authors. These are depicted in the Figure 2. Furthermore, we reduce the number of LSTM layers to one and instead increase the number of hidden units of the only LSTM layer to 512. According to Bock et al. (2021), this modification decreases the runtime up to 48% compared to a two-layered DeepConvLSTM while significantly increasing the overall classification performance on 4/5 publicly available datasets: (Roggen et al., 2010; Scholl et al., 2015; Stisen et al., 2015; Reyes-Ortiz et al., 2016; Sztyler and Stuckenschmidt, 2016). LSTM-Layers in general are important if the dataset contains sporadic activities (Bock et al., 2022). However, our dataset does not and our evaluation aims to identify long periods of periodic activities, like walking or running. For this reason, we can conclude that additional LSTM layers are not needed. The implementation of Hoelzemann and Van Laerhoven (2020) incorporates BatchNormalization layers after each Convolutional layer, as well as MaxPooling for the transition between the final convolutional block and the LSTM layer, and a Dropout layer before classification. Each Convolutional layer employs a ReLU activation function. The inclusion of the BatchNormalization layers serves to accelerate training and mitigate the detrimental effects of internal covariate shift, as discussed further in Ioffe and Szegedy (2015).
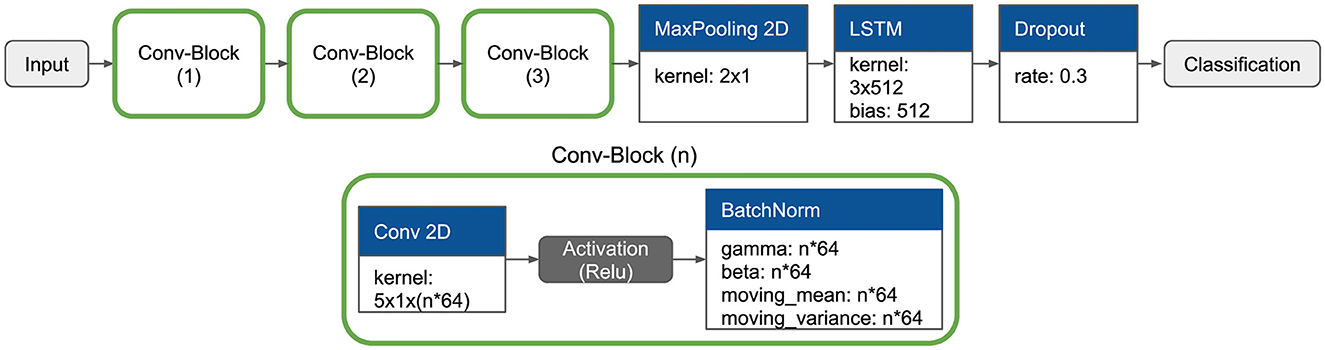
Figure 2. The architecture consists of an Input Layer with the kernel-size 10 (window_size) × 10 (filter_length) × 3 (channels). The data is passed into three concatenated convolutional blocks, followed by a MaxPooling (kernel 2 × 1) where 50% of the data is filtered. The convolutional block consists of a convolutional layer with a variable kernel size of 5 × 1 × (n*64) following a ReLU activation function and a BatchNorm-Layer. We decided to use a single LSTM-Layer with the size of 512 units, as mentioned by Bock et al. (2021), which is followed by a Dropout-Layer that filters 30% of randomly selected samples of the window.
5.1 Preprocessing
To prepare the data for neural network training, we perform two preprocessing steps. First, we address minor inconsistencies in the device's sampling rate. The original data was collected at a rate of 12.5 Hz. However, for optimal performance with neural networks, a consistent and regular sampling rate is preferred. To achieve this, we upsample the data by a factor of two, resulting in a constant frequency of 25 Hz. This upsampling process essentially inserts additional data points between the existing ones, effectively increasing the resolution of the signal. The second preprocessing step involves rescaling the accelerometer data to a range between –1 and 1.
5.2 Leave-one-day-out cross-validation
Figure 3 illustrates the train and test setting for the deep learning model. Instead of following the traditional Leave-One-Subject-Out strategy, we adapted it to our needs by using one day of the week for testing and training on the remaining days for each study participant and week. This approach was necessitated by the unique characteristics of our dataset. It consists of a predominant void class and a small number of samples per activity class and participant. To mitigate the issue of an disproportionately large void class, we trained our model with balanced class weights. By not limiting the participants in their choice of daily activities and not specifying predefined activity labels, we ended up with very unique sets of activities for each study participant. Given these circumstances, it is unrealistic to expect a model capable of generalizing across participants and days. The Leave-One-Day-Out strategy aims to maintain the consistency of class labels within each day's data, providing a more cohesive and reliable dataset for training and evaluation purposes. This strategy also mitigates the potential impact of participant-specific biases or variations in class labeling, leading to a more robust and accurate model. Furthermore, due to the in-the-wild recording setup, the intra-class differences (Bulling et al., 2014) for comparatively simple activities, such as walking or running can be significant. Consequently, the impact of different labeling methods is expected to be more pronounced and visible in a personalized model compared to a generalized model.
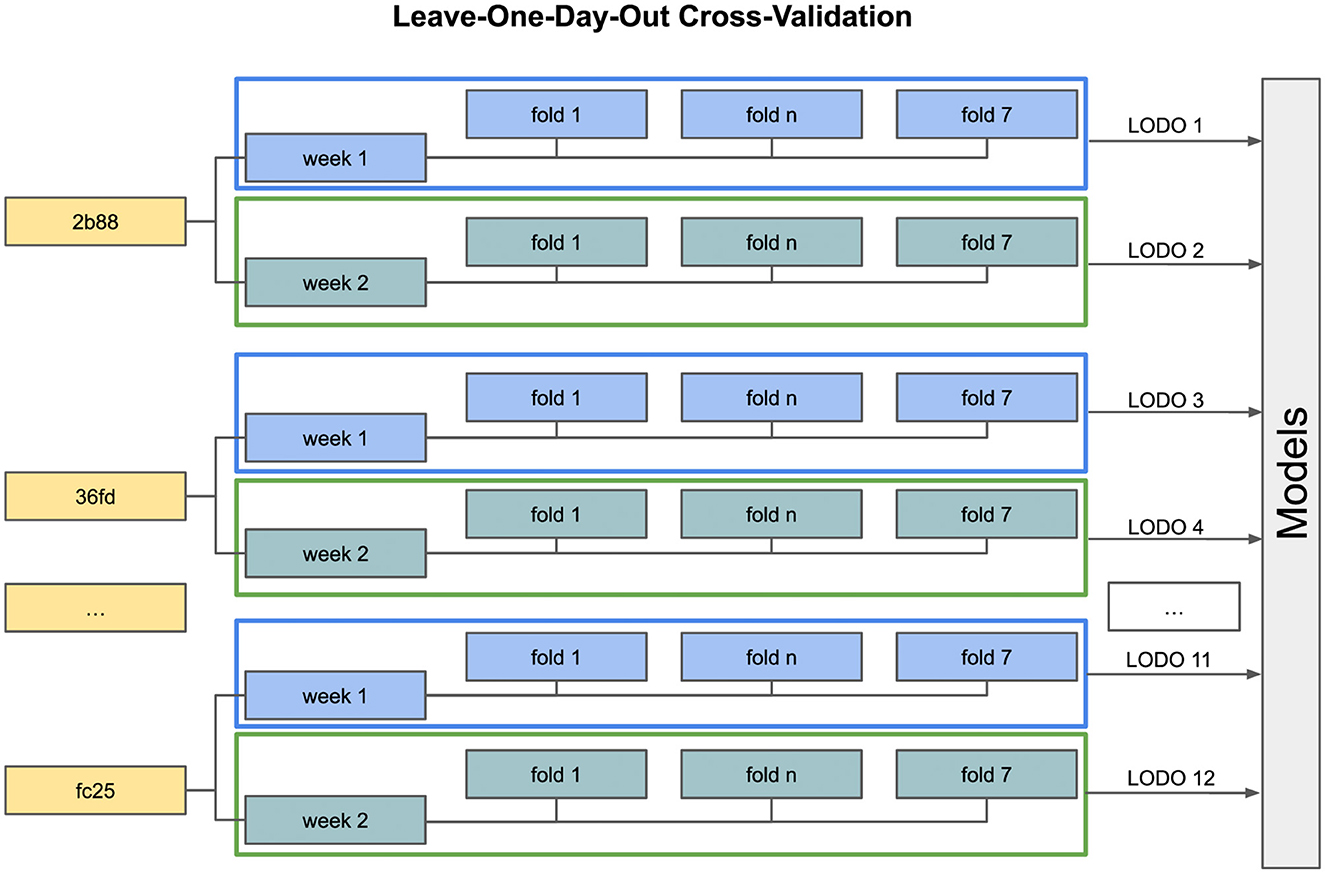
Figure 3. Leave-One-Day-Out Cross Validation. The models are personally trained for every participant and are not intended to generalize across all study participants. Instead, a generalization across all days of 1 week is desired.
5.3 Post-processing and classification
In the classification task, we initially segmented the data into fixed-length sliding windows of 2 s (50 samples). However, our objective extended beyond instantaneous classifications; we aimed to identify longer periods of recurring activities. To achieve this, we employed a post-processing technique involving a jumping window approach with a duration of 5 min. Within each 5-min window, a majority vote was applied to the individual 2-s window predictions. The activity class with the highest number of occurrences within the 5-min window was then assigned as the predominant activity for the entire window. This approach enabled us to capture sustained patterns of activities over extended periods, aligning with our goal of analyzing longer-term behavioral trends.
6 Results
Our participants were asked to annotate daily activities lasting more than 10 min. We did not limit them to a predefined set of classes; they independently decided on labels for their activities. After normalizing the labels (e.g., changing “going for a walk“ to “walking“), the participants assigned 26 different labels: laying, sitting, walking, running, cycling, bus_driving, car_driving, cleaning, vacuum_cleaning, laundry, cooking, eating, shopping, showering, yoga, sport, playing_games, desk_work, guitar_playing, gardening, table_tennis, badminton, horse_riding, cleaning, reading, weightlifting, manual_work, dish_washing. Any unlabeled samples were classified as void. However, after excluding infrequent or non-standalone classes (e.g., shopping likely combines walking, standing, and sitting), we reduced the dataset to 23 labels (22 activities plus void): laying, sitting, walking, running, cycling, bus_driving, car_driving, vacuum_cleaning, laundry, cooking, eating, shopping, showering, yoga, sport, playing_games, desk_work, guitar_playing, gardening, table_tennis, badminton, horse_riding. Nevertheless, the graphical representation of the distribution and the table in Section 6.1 include the full scope of classes.
6.1 Class distribution
The class distribution reflects a broad range of activity classes that represent the daily lives of our participants. These classes remain primarily participant-specific due to the absence of a predefined annotation protocol, which allowed participants the freedom to label activities according to their own interpretations. Consequently, we decided against employing a Leave-One-Subject-Out evaluation method, as it might introduce inconsistencies in the dataset due to the varying class labels assigned by different participants. The walking class is the most consistently annotated class across participants and annotation methods, although it may not represent the maximum amount of labeled data points. Notably, the void class, which is not visible in Figure 4, accounts for a substantial portion of the labeled data, ranging from 80% to 96%, depending on the annotation method employed.
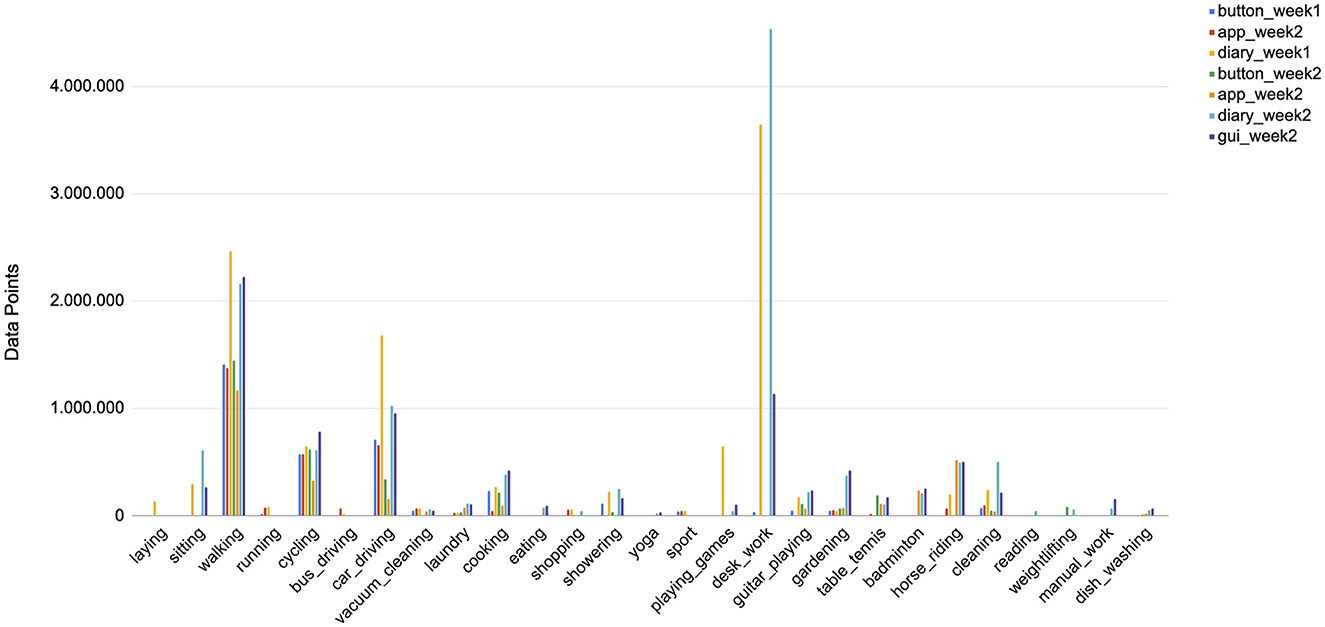
Figure 4. This figure illustrates the relative prevalence of various activity classes within the dataset, excluding the void class, see Table 1 for details. The class labeled as void represents the predominant category within the dataset, surpassing the frequency of the second most prevalent class, desk_work, by a substantial factor of 13. The figure illustrates a pronounced imbalance in the data distribution, both in terms of the annotation methodology employed and the distinct week-specific patterns observed in the annotation process.
Table 1 shows that daily activities that do not require extensive planning and are inherent to most people's everyday lives tend to be the most consistently annotated classes. Among these are activities such as walking, cycling, car_driving, or cooking. On the other hand, activities like badminton, weightlifting, manual_work, and others are highly subject-dependent and occur only sporadically. The observation that the desk_work class exhibits the highest frequency is valid solely when employing the ③ diary- or the ④ GUI-methodology for data collection, suggesting a potential limitation or bias associated with this particular approach. The classes pertaining to physical activities such as running, bus_driving, yoga, badminton, weightlifting, and sport exhibit a distinct pattern of clustering within specific weeks, indicating a temporal dependency. This observation highlights the inherent bias introduced by the real-world recording environment in which the dataset was collected, potentially limiting the generalizability of the model to broader contexts. Furthermore, it is crucial to note that the size of the void class for the recall methods ③ and ④ is up to 16% smaller than the in situ methods ① and ②. While this disparity in class representation highlights the inherent complexities and challenges associated with the data collection and annotation procedures, it simultaneously presents an opportunity to address real-world imbalances and biases. By critically examining and accounting for these factors, the resulting models can potentially enhance their generalizability and applicability across diverse scenarios, ultimately contributing to a deeper understanding of the underlying phenomena under investigation.
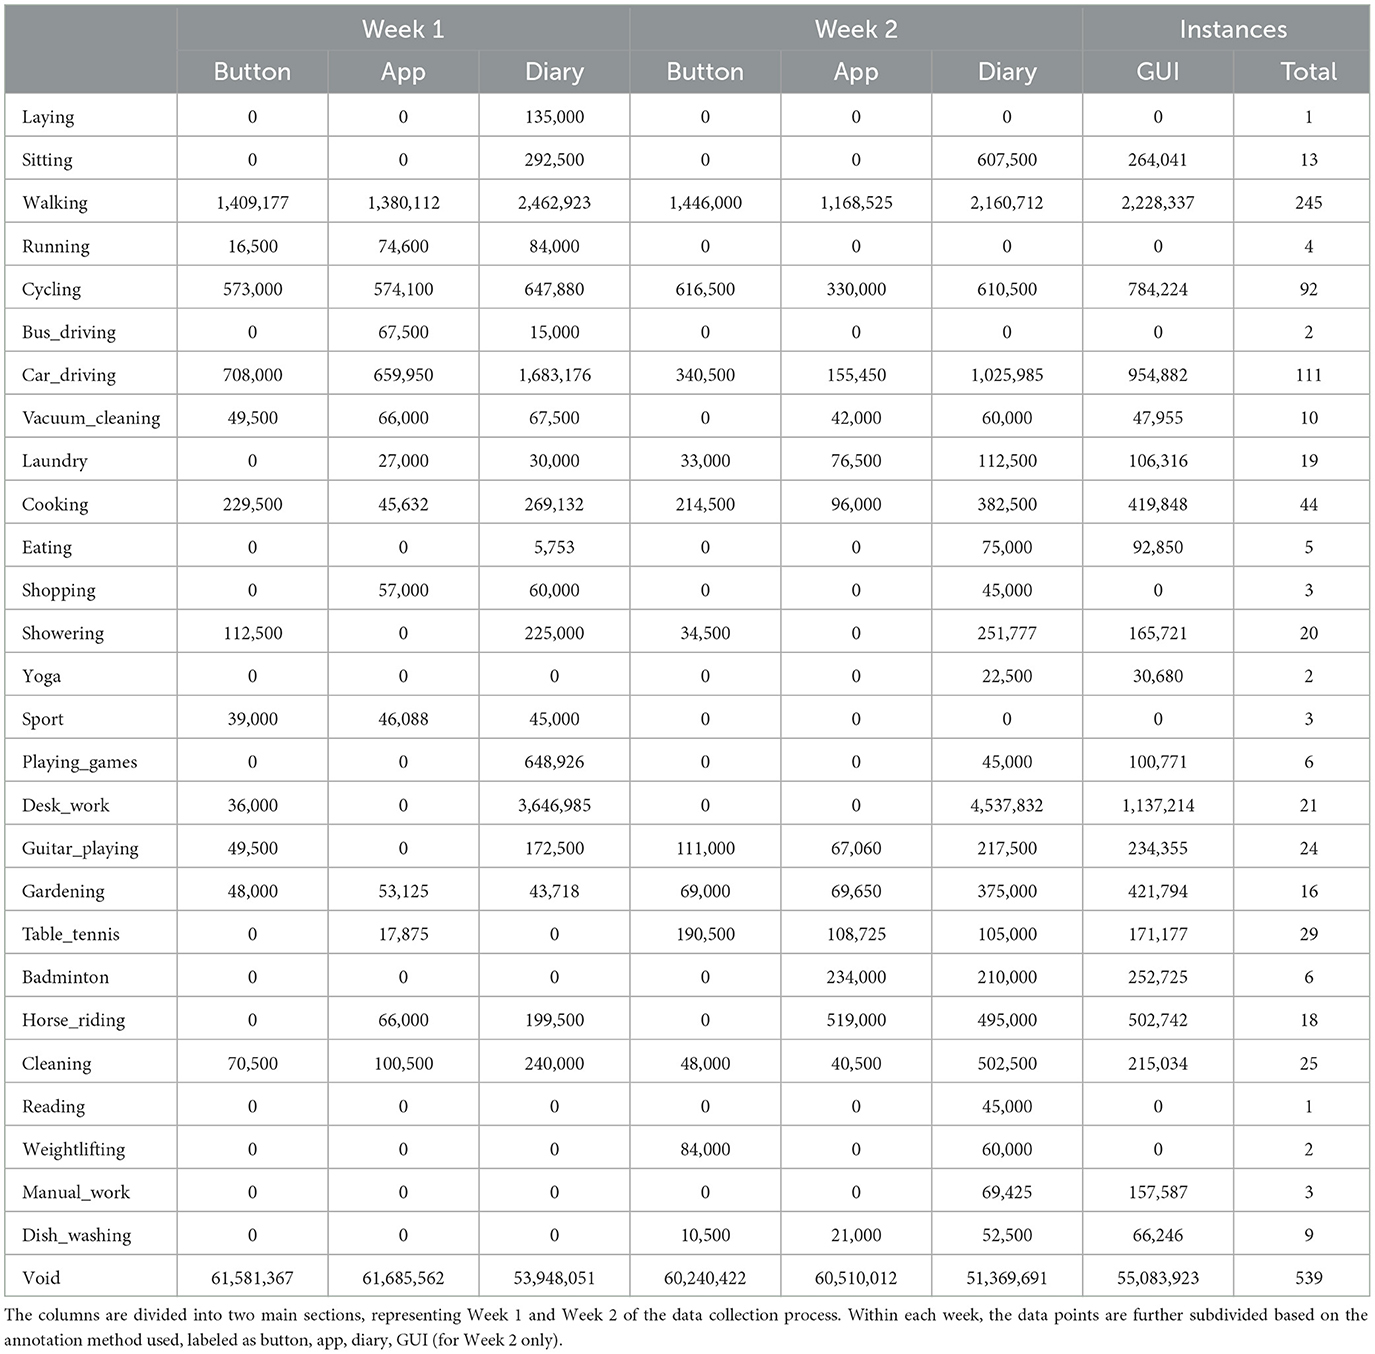
Table 1. This table presents a comprehensive overview of the number of data points for each activity class, categorized according to the different annotation methods employed during two distinct weeks.
6.2 Missing annotations and consistency across methods
Missing Annotations and the consistency of labels set over the course of one week varied greatly depending on the study participant. However, tendencies with regard to specific methods are observable. We computed missing annotations by merging all available annotations from the various methods used (button, app, diary, GUI) into an artificial global ground truth. We then compared each individual annotation layer against this consolidated ground truth to identify any missing annotations, leveraging the collective information as a reference point. Method ①, pressing the situ button on the smartwatch's case, was not consistently used by every participant. Furthermore, this method carries the risk that either setting one of the two markers (start or end) is forgotten. An annotation where one marker is missing becomes therefore obsolete. The app-assisted annotation method ②, for which we used the app Strava, is well accepted among the participants who agreed with using third-party software. However, 4 participants, namely 74e4, 90a4, d8f2, and f30d did not use the app continuously or refused to use it completely due to concerns regarding their private data. Strava is a commercial app, that is freely available for download on the app stores, but it collects certain users' metadata. To label a time period with Strava, the participant needs to (1) take the smartphone, (2) open the app, (3) start a timer, set a label, and (4) end the timer. This procedure contains significantly more steps than other methods. Therefore, the average value of missing annotations results in 46.40% (week 1) and 56.79% (week 2). One participant found the annotation process in general very tedious and therefore dropped out of the study. These data have been excluded from the dataset and the evaluation. Method ③ pure self-recall, writing an activity diary, got well accepted by every participant. As Figure 5 shows and the results in Table 2 proof, it is overall the most complete annotation method with an average amount of missing annotations of 4.30% for the first and 8.14% for the second week. By introducing the MAD-GUI, participants were able to inspect their daily data, get insights into what patterns of specific classes look like, and label them interactively. With an average amount of missing annotations of 7.67%, this method became the most complete during the second study week. Table 3 shows the resulting Cohen κ scores. Due to the constraint that only one labeling method can be compared to a second one and since, according to Table 2, the most consistent annotation methods are ③ pure self-recall and ④ time-series recall, we used these methods as our baseline and compared them with every other method used in the study. The second column indicates the comparison direction. The abbreviations used in this column are defined as follows: (③ C/W ①) pure self-recall compared with in situ button, (③ C/W ②) pure self-recall compared with in situ app and (③ C/W ④) pure self-recall compared with time-series recall. The direction (④ C/W ③) is not explicitly included since Cohens κ is bidirectional and both directions result in the same score. The score indicates how similar two annotators, or in our study labeling methods, are to each other. The resulting score is a decimal value between –1.0 and 1.0, where –1.0 means that the two annotators differ at most and 1.0 means complete similarity. 0.0 denotes that the target method was not used on that specific day.
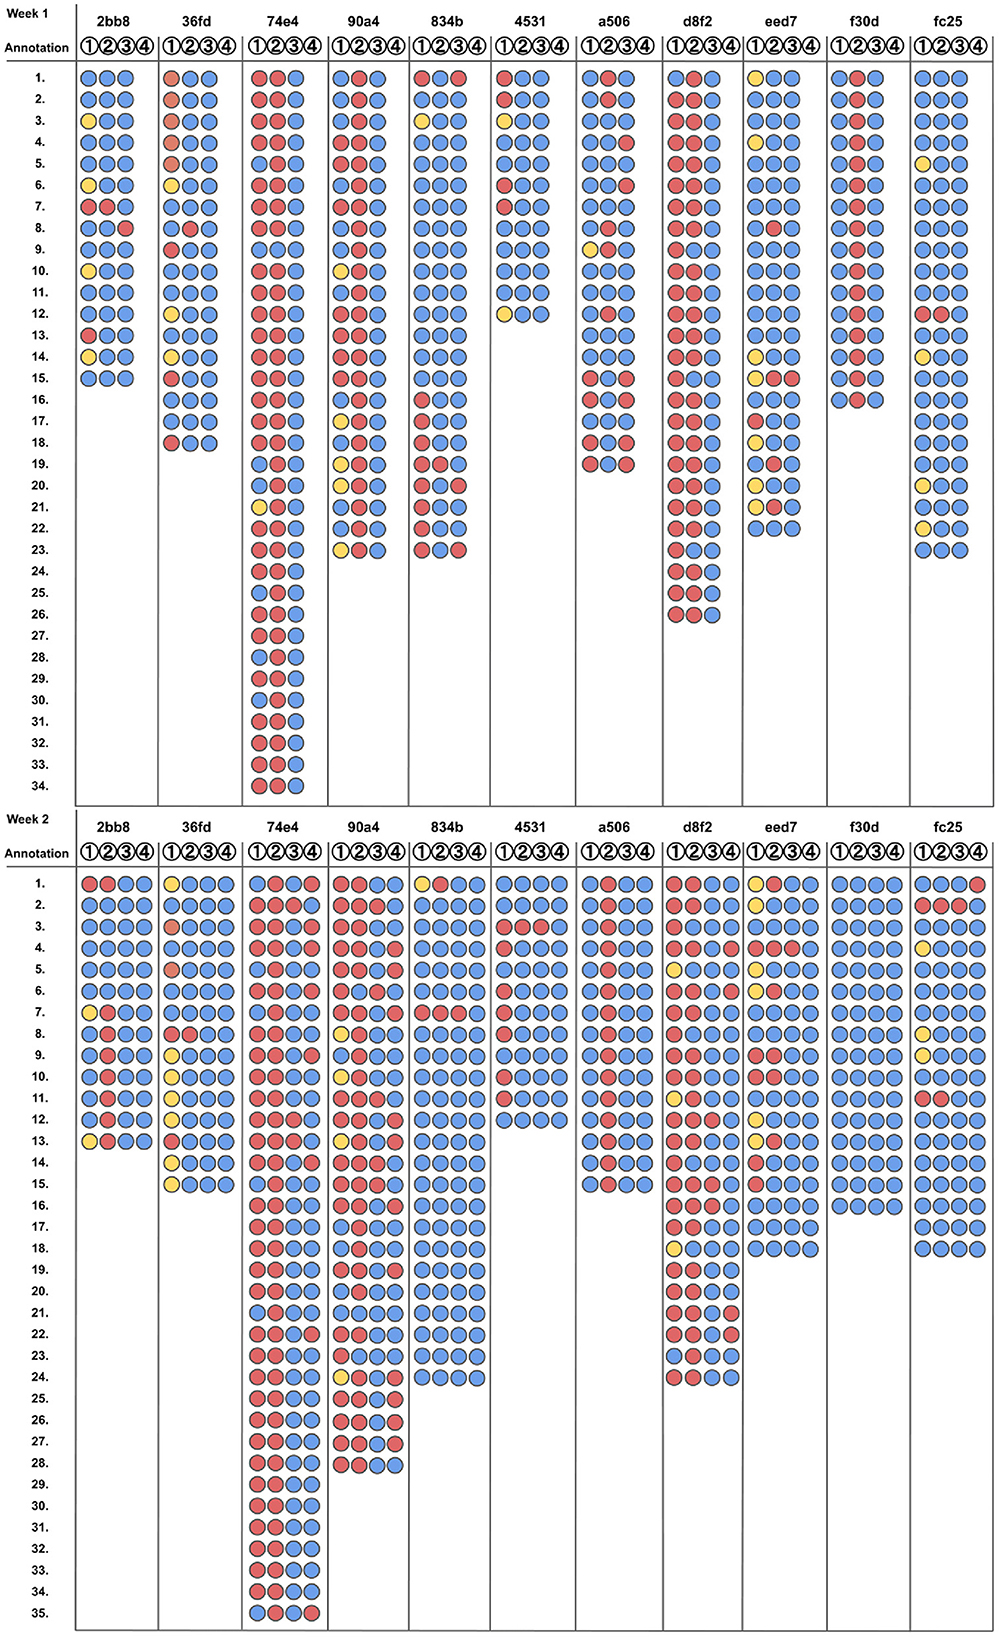
Figure 5. Missing annotations across all study participants and both weeks. The Y-axis shows the total number of annotations of one specific participant for the corresponding week. The color codes are as follows:  Annotation is missing,
  Annotation is partially missing (start or stop time),
  Annotation is complete. The figure is inspired by Brenner (1999), Figure 1.
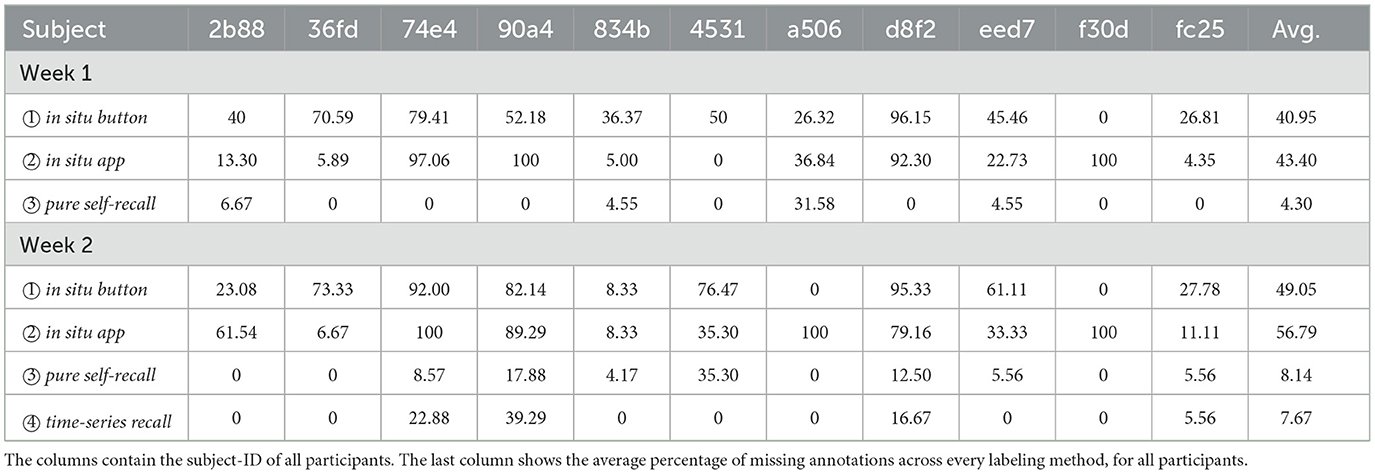
Table 2. Missing annotations across all labeling methods (in %) of both weeks.
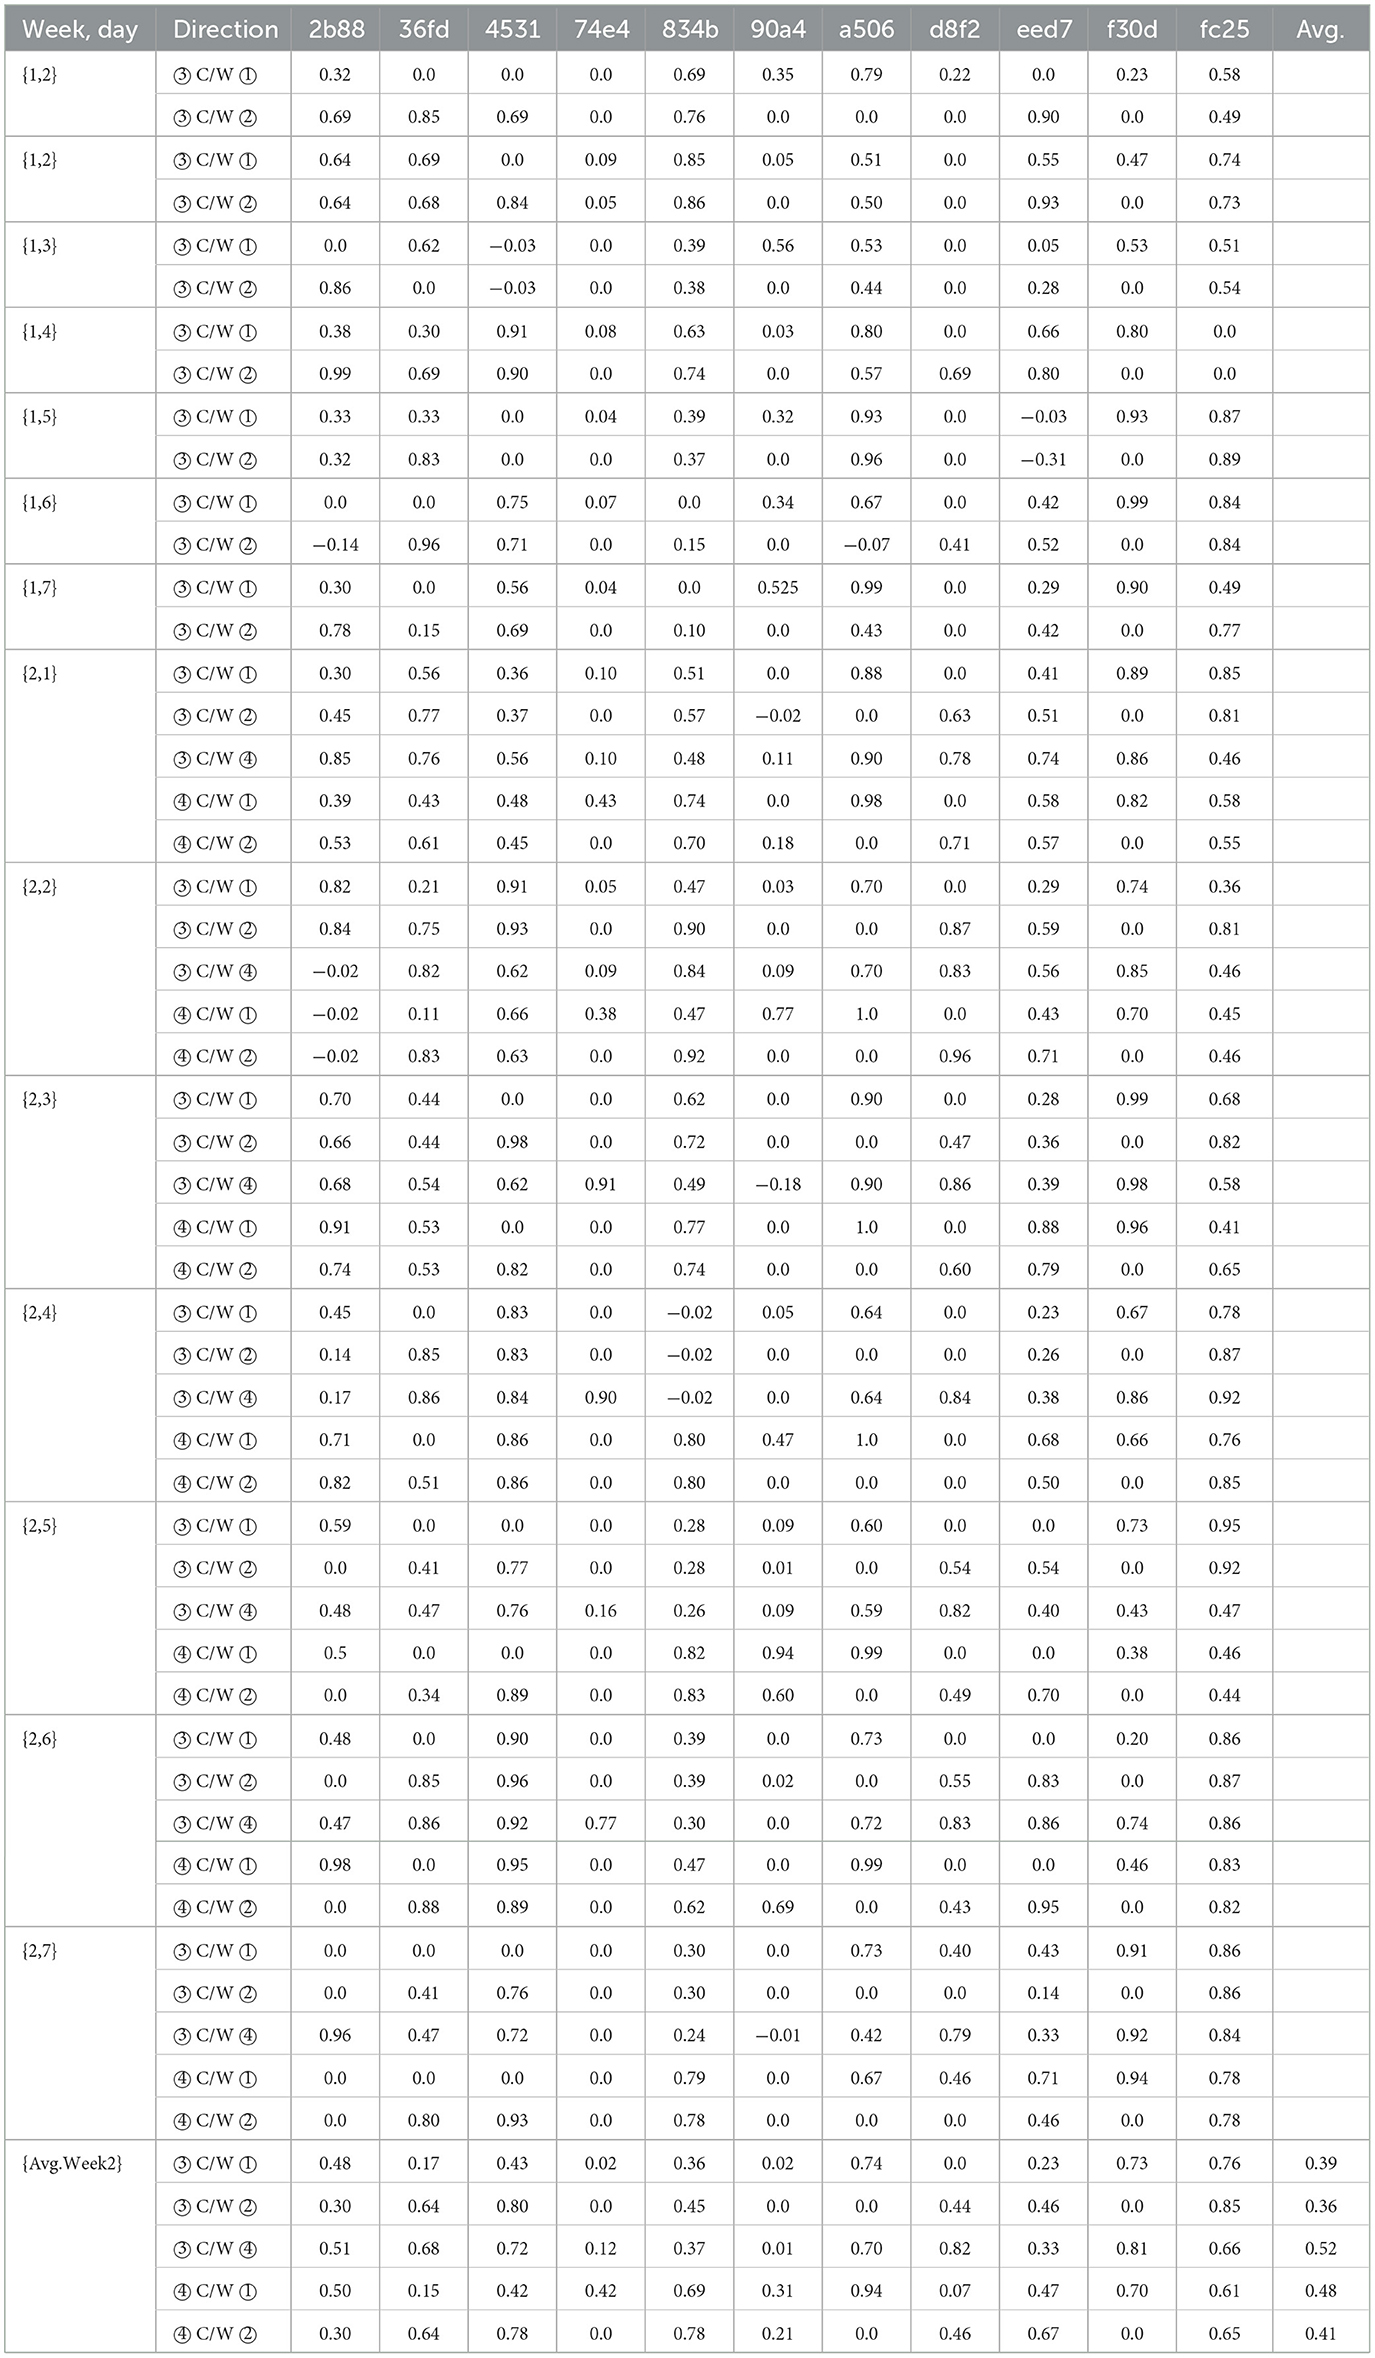
Table 3. Average similarity between annotation methods according to the Cohan κ score for both study weeks.
Comparing the ③ pure self-recall method with the ① in situ button and ② in situ app method we can see that the final results for weeks 1 and 2 are proximate to one another. ② Pure self-recall compared with the ④ time-series recall results in the highest similarity of 0.52. The comparison between the ④ time-series recall and the ① in situ button as well as the ② in situ app assisted annotations result in higher similarity than the prior comparison of ③ pure self-recall vs. both methods ① and ②. This means that subjects rather agree to the timestamps of the in situ methods than to a self-written activity diary as soon as they can visually inspect the accelerometer data.
6.3 Visual time-series analysis
Figure 6 shows exemplary the time-series of the sixth day of every participant's second week. The four bars that are visible above the accelerometer data are the labels set by the participants for every layer. The order is from bottom to top: ① in situ button, ② in situ app. ② pure self-recall, and ④ time-series recall. Examples of labels that differ with regard to the applied labeling method are marked with red boxes. The x-axis of every subplot represents roughly 8–9 h of data. Most of the day was not labeled and is therefore categorized as void. However, such long periods often contain shorter periods of other activities, like walking. This makes it difficult to define a distinguishable void-class, which results in false positive classifications of non-void samples. Figure 6 visually shows that each participant labels his or her data very subjectively. The long green-labeled periods of participant 74e4 represent the class desk_work. The only other participant that used this label is 90a4. Since each of the study participants works in an office environment and thus conclusively works at a desk, we can assume that the same class is classified as void for all other study participants. This intra-class and inter-participant discrepancy becomes a problem whenever a model is trained that is supposed to generalize across individuals. To reduce these side effects and focus on the experiment itself, we decided to evaluate personalized models that take weekly data from participants into account.
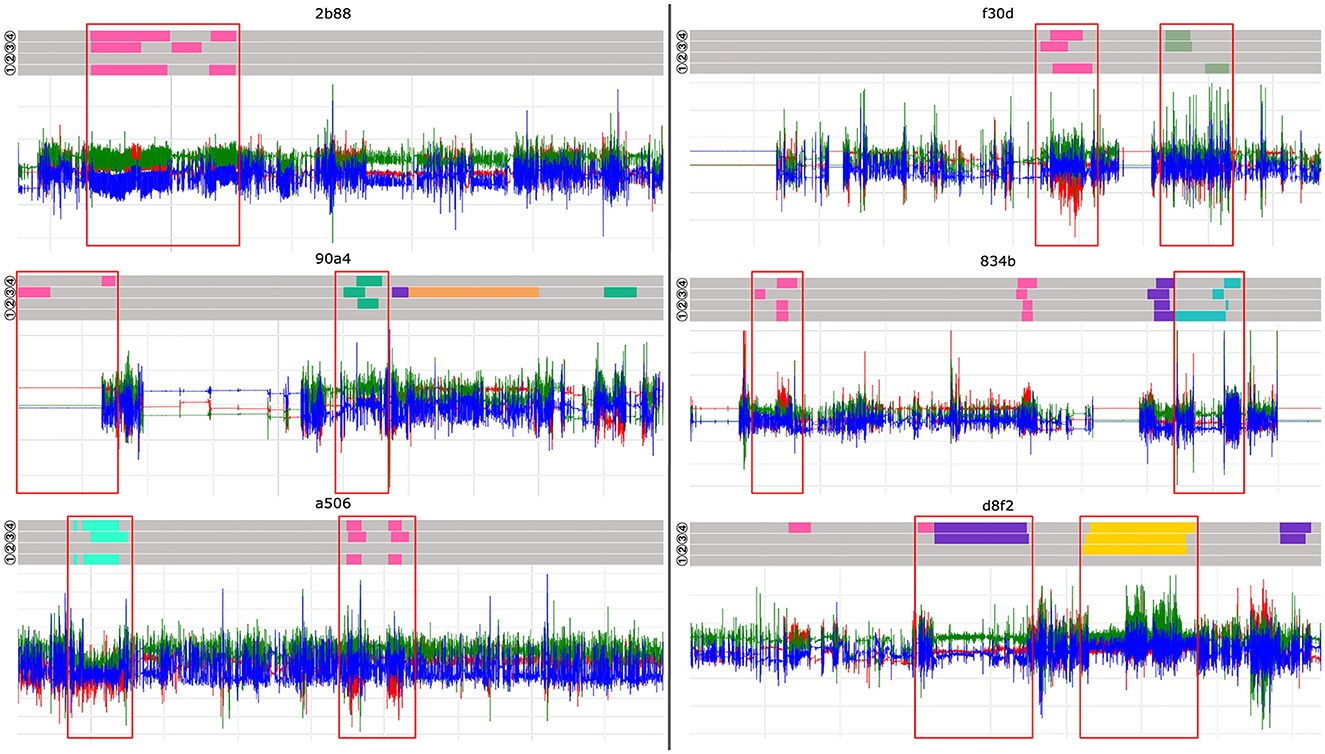
Figure 6. Visualization of participants' accelerometer data on the sixth day in the second week of the study, together with annotations set by them. The four layers in the upper part of every participant's daily data represent the four annotation methods. The order is from bottom to top: ① in situ button, ② in situ app, ② pure self-recall and ④ time-series recall.
The in situ button annotation is empty for five participants: eed7, 36fd, 74e4, 90a4, and d8f2. Labels are only partially set or missing entirely for this annotation method and we therefore assume that participants tend to forget to press the button on the smartwatch. Both Tables 2, 3, support this assumption, as this labeling method shows a high percentage of missing annotations as well as a low Cohen κ score of 0.36% (week 1) and 0.39% (week 2). The pure self-recall method ③, visible on the 2nd upper layer, is often misaligned compared to the in situ methods as well as the time-series recall method ④. Participants tend to round up or down the start- and stop-time in steps of 5 or 10 min. For example, the annotations in Figure 6 given by the subjects 2b88, 834b, or f30d, show such incorrectly annotated data. The pink color represents the class walking. With a closer look at the corresponding time-series data, one can see that the in situ button annotation (bottom layer) and time-series recall annotation (top layer) belongs to the typical periodic pattern of walking than the period labeled by pure self-recall.
A consistent reliable performance in all labeling methods can only be observed at the participants 4531 and fc25. Other participants like eed7, 36fd, 74e4, or a506 are very precise in their annotations across methods, but are missing at least one layer of labels. The complete collection of visualizations is available in our dataset repository7.
6.4 Effects on classification
The results of our deep learning evaluation8 suggest that the annotation method chosen can have a crucial impact on the classification ability of a trained deep learning model. Depending on the chosen methodology, the average F1-Score results differ by up to 8%, as depicted in Figure 7. In the first week, the in situ methodologies, button ① and app ②, generally perform better than the pure self-recall diary ②. Study participants mostly correctly estimated the duration of an activity, but tended to round up or down the start and end times. The in situ methods are up to 8% better than the pure self-recall, although the amount of annotated data available, due to missing annotations, is significantly lower than for other methods. Although, we work with a dataset recorded in-the-wild, the deep learning results generally show a high F1-Score. This is untypical for such datasets but can be explained by the fact that the majority of the daily data are assigned to the void class. This leaves proportionally only a few samples that are crucial for determining the classification performance.
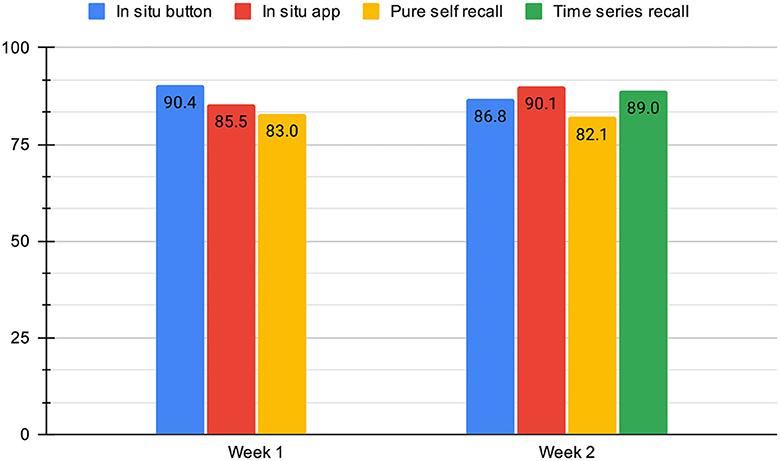
Figure 7. The overall mean F1-Scores for the Leave-One-Day-Out Cross Validation across all participants. In the first week, the participants used methods ① - ②. In the second week, we introduced method ④.
Even though the number of available annotations that have been labeled by the study participants using the time-series recall method ④ is significantly higher with 92.33%, the average F1-Score is 1.1% lower (89.00%) than the results reached with the App Assisted method (90.1%). To understand this result it is crucial to look at Table 4 in detail and take meta-information about the participants into account. The participants mostly used their diary as a mnemonic aid for the graphical annotation method and tried to identify the corresponding periods in the acceleration data. The results of subjects 2b88, a506 and eed7 show that the performance of the classifier could be increased with graphical assistance. However, the F1-Score of 2b88 is 0.01% below the F1-Score of the in situ app assisted annotation method ②. These subjects have in common that they are already trained in interpreting acceleration data due to their prior knowledge and thus assign samples to specific classes more precisely.

Table 4. In detail representation of the final F1-Scores for every annotation methodology and a week per study participant.
Subjects fc25, 4531, and 834b, on the other hand, do not have prior knowledge. Apart from subject 834b, the deep learning results show that presenting a visualization to an untrained participant rather harmed than helped the classifier. If one looks at the visualizations of day 1 and 6, week 2 of fc25 (see Figure 6, 8), the labels set by the subject with the help of the graphical interface, it is comprehensible that this study participant tended to be rather confused by the graphical representation and therefore labeled the data incorrectly.
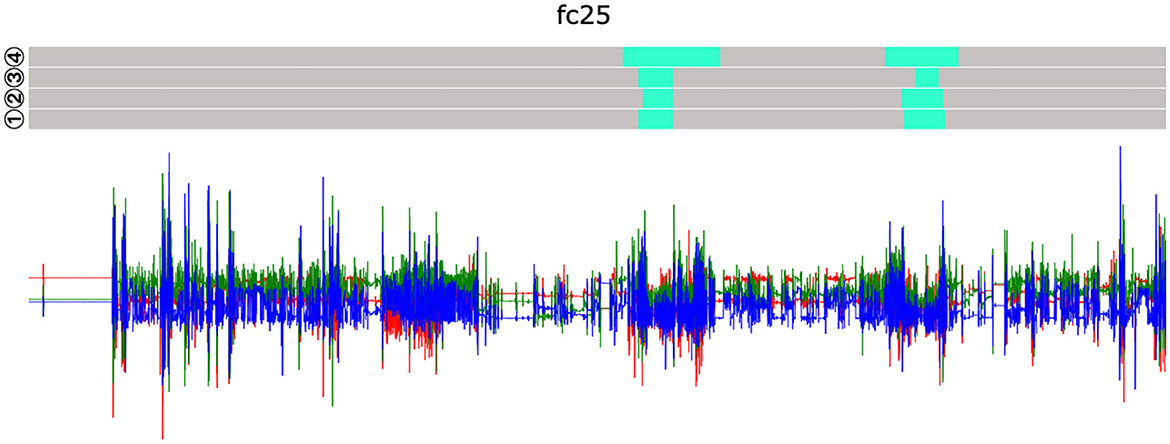
Figure 8. Visualization of the 1st day in week 2 of subject fc25. Differences can be seen in the upper annotation layer (④ time-series recall), exhibiting larger differences regarding the annotated start- and stop times compared to other methods.
7 Discussion
In our 2-week long-term study, we recorded the acceleration data of 11 participants using a smartwatch and analyzed it visually, statistically, and using deep learning. The findings of the visual and statistical analysis were confirmed by the deep learning result. They show that the underlying annotation procedure is crucial for the quality of the annotations and the success of the deep learning model.
The in situ button method ① offers accuracy but brings the risk that the setting of a label is forgotten entirely or incompletely set. However, this method can be combined with additional on-device feedback or a smartphone app, so that greater accuracy and consistency of the annotation can be achieved. This involves a considerable implementation effort, which many scientists avoid because such projects, although of their significant value to the community, attract little attention in the scientific world. The use of existing, but often commercial, software and hardware is all too often accompanied by a loss of privacy. As our research has shown in passing, many users therefore shy away from using such products.
Through our investigation of the consistency of annotations between methodologies, we were able to show that participants in our study seem to prefer to write an activity diary (pure self-recall method ③). This finding corresponds to what (Vaizman et al., 2018) already points out. However, this method has the disadvantage that it can be imprecise, which is evident in the visualization of the data and annotations. Similarly, the activity diary methodology performed the least reliably among all methodologies, which has been confirmed by the deep learning model. Since the deep learning results using the in situ app annotations ③ are almost similar to the results given by the time-series recall ④, even though the number of labeled samples is lower, it raises the question if a smaller set of high-quality annotations is more valuable for a classifier than a larger set of annotated data that comes with imprecise labels. This could mean that in future works we can reduce the amount of necessary training samples drastically if a certain annotation quality can be assured. However, this needs to be confirmed by further investigations.
Some participants reported that they found the support provided by the visual representation of the data helpful. The resulting Cohen κ scores strengthen this impression since the F1-Scores are much higher when we compare the time-series recall with both in situ methods vs. the pure self-recall. This indicates that as soon as the participants received a visual inspection tool, they tended to annotate data at similar time periods as through the in situ methods since they can easily identify periods of activity that roughly correspond to the execution time they remember. Our participants reported similar preferences, which led us to the conclusion that a digital diary that includes data visualization could combine the benefits of both annotation methods.
However, the study also showed that participants can find it difficult to interpret the acceleration data correctly and thus set inaccurate annotations. As our trained models show, this also has a strong influence on the classification result. If such a tool is to be made available to study participants, it must be ensured that they have the necessary knowledge and tools to be able to interpret these data. Thus, to ensure the success of future long-term and real-world activity recognition projects, prior training of the study participants regarding data interpretation is of crucial importance if a data visualization is supposed to be used.
Apart from trying to solve annotation difficulties during the annotation phase itself, we can also partially counter wrong or noisy classified data by using machine learning techniques like Bootstrapping (see Miu et al., 2015) or using a loss function that specifically tries to counteract this problem, such as Natarajan et al. (2013) and Ma et al. (2019). By using Bootstrapping, the machine or deep learning classifier is initially trained by a small subset of high-confident labels and further improved by using additional data. However, this technique comes with the trade-off that whenever wrong-labeled data is introduced as training data, the error will get propagated into the model. An effect that sooner or later occurs as long as the annotation methodologies themselves are not further researched. Other machine learning techniques that can work with noisy labels (see Song et al., 2022), are already successfully tested for Computer Vision problems and can, in theory, be adopted for Human Activity Recognition. However, earlier research has shown that not every technique that is applicable in other fields is also applicable to sensor-based data (Hoelzemann and Van Laerhoven, 2020).
Cause of missing annotations: We believe that specific activities are more likely to be forgotten during the labeling process than others. These activities are generally more spontaneous and require less dedicated preparation time. Examples might include classes like laying, sitting, walking, bus_driving, car_driving, eating, or desk_work. In contrast, other classes like shopping, yoga, playing_games, badminton, cooking, or horse_riding are often time-intensive, physically or mentally demanding, and frequently planned in advance or even take place at dedicated locations. Therefore, it is likely that participants find these activities easier to recall and label accurately. Obtaining separate annotations for each activity through distinct and dedicated annotation processes would have yielded valuable insights; however, this approach was deemed unfeasible for the participants involved in our study. The immense time commitment and laborious efforts required from our participants to annotate each activity individually would have imposed an unreasonable burden, rendering such a comprehensive annotation strategy impractical within the constraints of our study.
7.1 Discussing different annotation biases
Directly quantifying the perceived workload of subjective tasks like data labeling is a complex challenge. This difficulty stems from several factors. Firstly, individual differences in mental stamina and task perception mean what one person finds laborious, another might find manageable (Smith et al., 2019). Secondly, memory biases can lead to under- or overestimates of effort depending on the emotional context of the task or the participant's current state (Watkins, 2002). Social desirability bias can also come into play, with participants potentially downplaying their workload to appear competent or exaggerating it to justify breaks (Chung and Monroe, 2003). Therefore, accurately quantifying the workload associated with each of the four labeling methods presents a significant challenge. While surveys, like the NASA TLX (NASA, 1986), asking participants about perceived effort hold some value, these results are inherently subjective and can be heavily influenced by individual experiences and biases. While aiming for a fully objective measure of workload is desirable, it might require collecting more personal data from participants. This additional data could include details like preferred wearable devices (e.g., smartwatches), smartphone usage patterns, or individual memory recall capabilities or the emotional state of a participant (Ghosh et al., 2015). While recording and quantifying this type of personal data would have provided valuable insights, it would have also significantly increased the workload placed on participants. This additional workload fell outside the scope of the current study, which prioritized collecting data through the four predefined methods. However, we need to acknowledge that several biases could have been introduced due to the chosen annotation guidelines and tools. For example, the usage of in situ annotation methods during the day can have a positive effect on the self-recall capabilities of a participant at the end of the day. The comparison of consistencies across methods does not confirm that this effect indeed occurred. Every study participant showed an almost complete overall profile of self-recall annotations, even though the person has not used or has incomplete in situ annotations (see Figure 5). However, deeper investigations are needed to be able to understand such effects better.
Yordanova et al. (2018) lists the following three biases for sensor-based human activity data: Self-Recall bias (Valuri et al., 2005), Behavior bias (Friesen et al., 2020) and the Self-Annotation bias (Yordanova et al., 2018). We showed that indeed a time-deviation bias (which can be seen as a self-recall bias) has been introduced to annotations created with the pure self-recall method ②, and that such a bias affects the classifier negatively. However, visualizing the sensor data can counter this effect because it was easier for participants to detect active phases in hindsight.
A behavior bias can be neglected, because the participants were not monitored by a person or video camera during the day and the minimalistic setup of one wrist-worn smartwatch does not influence one's behavior since the wearing comfort of such a device is generally perceived as positive (Pal et al., 2020). A self-annotation bias, a bias that occurs if the annotator labels their data in an isolated environment and cannot refer to an expert to verify an annotation, did occur as well. With the deep learning analysis, we were able to show that the classifier was less negatively impacted by this bias than by time-deviation bias.
A Parallel annotation bias can arise in two scenarios: when multiple annotators independently label the same data, or when a single annotator uses multiple labeling methods for the same data, where the application of one method influences the subsequent labeling decisions made with other methods. There are three main ways this bias can manifest:
1. Anchoring bias (Lieder et al., 2018): the initial labeling method might act as an anchor, subtly influencing the annotator's decisions when using subsequent methods, even if their initial assessment might differ.
2. Confirmation bias (Klayman, 1995): the annotator might subconsciously favor interpretations that align with labels generated from previous methods, overlooking alternative possibilities.
3. Method bias (Min et al., 2016): certain methods might inherently be easier or more difficult to use for specific types of data, potentially leading to systematic inconsistencies across the labeled data.
The presence of parallel annotation bias in this context suggests that the annotations might not be entirely independent between methods, potentially impacting the overall quality of the data. Anchoring and confirmation bias can lead to a lack of diversity in annotations and potentially perpetuate errors. Method bias can introduce inconsistencies that complicate data analysis. We recognize the possibility of parallel annotation bias in our dataset, where applying one labeling method might influence subsequent methods used by the same participant. However, prioritizing participant engagement, we opted for a parallel approach. This decision ensured the workload remained manageable and prevented participant dropout from the study.
8 Conclusions
We argue that the annotation methodologies for benchmark datasets in Human Activity Recognition do not yet capture the attention it should. Data annotation is a laborious and time-consuming task that often cannot be performed accurately and conscientiously without the right tools. However, there is a very limited number of tools that can be used for this purpose and often they do not pass the prototype status.
Only a few scientific publications, such as Reining et al. (2020), focus on annotations and their quality. However, the use of properly annotated data drastically affects the final capacities of the trained machine or deep learning model. Therefore, we consider our study to be important for the HAR community, as it analyzes this topic in greater depth and thus provides important insights that go beyond the current state of science. Table 5 summarizes the advantages and disadvantages of every method.
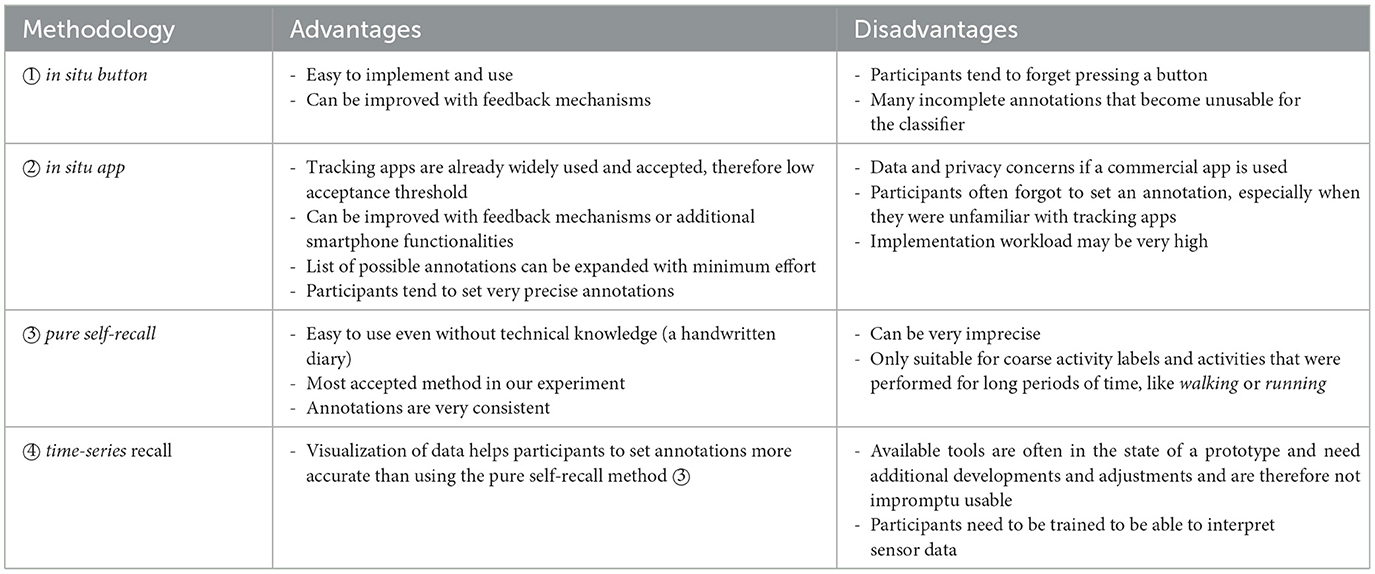
Table 5. Comparison of advantages and disadvantages of all annotation methods used in this study.
High-quality annotations are crucial for accurate activity recognition, especially in uncontrolled real-world settings where video recordings are unavailable for ground truth verification. To address this challenge, further research on activity data annotation methodologies is necessary. These methodologies should empower annotators to label data in a way that comprehensively captures the subtleties of everyday life. The annotations must not only be extensive but also complete and coherent, ensuring a consistent and well-defined understanding for the AI model to learn from. Furthermore, leveraging learning methodologies like Weakly Supervised Learning methods, exemplified by works such as Wang et al. (2019) and Wang et al. (2021), can potentially utilize datasets like ours. However, a more comprehensive evaluation is needed to determine their suitability for real-world application. The combination of a (handwritten) diary with a correction aided by a data visualization in hindsight shows the best results in terms of consistency and missing annotations and provides accurate start and end times. However, this combination results in additional work for the study participants and therefore, remains a trade-off between additional workload and annotation quality.
8.1 Lesson learned
During this study, we gained insights about the effects of different annotation methods on the reliability and consistency of annotations and finally on the classifier itself, but also about training deep learning models on data recorded in-the-wild. In this chapter, we would like to share these insights to help other researchers perform their experiments more successfully. With regards to Table 5, we are able to narrow down specific study setups that either benefit more from self-recall or in situ annotation methods. As part of our annotation guidelines, we allowed our study participants to name their activities as they wished. Therefore, we were forced to simplify certain activities. To be able to create a real-world dataset that contains complex classes or even classes that consist of several subclasses, more elaborated annotation methods and tools must be developed. We believe that with the currently available resources, the hurdle lies very high for such datasets to be annotated accurately.
Our study includes people who cycle to work in their daily work routine and others who commute by public transport or work in a home office environment. Thus, each study participant has his or her set of daily repetitive activities. Due to the nature of our dataset as one recorded in a real-world and long-term scenario, the number of labeled samples is rather small, and given labels vary participant-dependent. This mix of factors creates a bias in the dataset and we concluded that a cross-participant train-/test-strategy is not appropriate for our study design and would not give meaningful insights, since every study participant has their own set of unique activities which are too different and hardly generalizable. Therefore, for certain studies, the commonly known and accepted Leave-One-Subject-Out Cross-Validation is not suitable.
Data availability statement
The datasets presented in this study can be found in online repositories. The names of the repository/repositories and accession number(s) can be found in the article/supplementary material.
Ethics statement
The studies involving humans were approved by Ethics Committee of the University of Siegen, ethics vote #ER 12 2019. The studies were conducted in accordance with the local legislation and institutional requirements. The participants provided their written informed consent to participate in this study.
Author contributions
AH: Writing – original draft, Visualization, Validation, Software, Methodology, Investigation, Formal analysis, Data curation, Conceptualization. KV: Writing – review & editing, Supervision, Project administration, Methodology, Funding acquisition, Conceptualization.
Funding
The author(s) declare financial support was received for the research, authorship, and/or publication of this article. This project was funded by the Deutsche Forschungsgemeinschaft (DFG, German Research Foundation) – 425868829 and is part of Priority Program SPP2199 Scalable Interaction Paradigms for Pervasive Computing Environments.
Conflict of interest
The authors declare that the research was conducted in the absence of any commercial or financial relationships that could be construed as a potential conflict of interest.
The author(s) declared that they were an editorial board member of Frontiers, at the time of submission. This had no impact on the peer review process and the final decision.
Publisher's note
All claims expressed in this article are solely those of the authors and do not necessarily represent those of their affiliated organizations, or those of the publisher, the editors and the reviewers. Any product that may be evaluated in this article, or claim that may be made by its manufacturer, is not guaranteed or endorsed by the publisher.
Footnotes
2. ^https://www.espruino.com/banglejs
3. ^https://www.apple.com/watch/
4. ^https://github.com/ahoelzemann/mad-gui-adaptions/
5. ^Our smartwatch firmware is made publicly available at: https://github.com/kristofvl/BangleApps/tree/master/apps/activate.
6. ^Our web-tool is made publicly available at: https://ubi29.informatik.uni-siegen.de/upload/.
7. ^https://doi.org/10.5281/zenodo.7654684
8. ^Detailed results for every participant included in our deep learning evaluation can be accessed online on the Weights & Biases platform: https://tinyurl.com/4vxvfaed.
References
Abney, S. (2002). “Bootstrapping,” in Proceedings of the 40th annual meeting of the Association for Computational Linguistics (Philadelphia, PA), 360–367. doi: 10.3115/1073083.1073143
Adaimi, R., and Thomaz, E. (2019). Leveraging active learning and conditional mutual information to minimize data annotation in human activity recognition. Proc. ACM Interact. Mob. Wearable Ubiquitous Technol. 3, 1–23. doi: 10.1145/3351228
Akbari, A., Martinez, J., and Jafari, R. (2021). Facilitating human activity data annotation via context-aware change detection on smartwatches. ACM Trans. Embed. Comput. Syst. 20, 1–20. doi: 10.1145/3431503
Artstein, R., and Poesio, M. (2008). Inter-coder agreement for computational linguistics. Comput. Linguist. 34, 555–596. doi: 10.1162/coli.07-034-R2
Bartolo, M., Roberts, A., Welbl, J., Riedel, S., and Stenetorp, P. (2020). Beat the AI: investigating adversarial human annotation for reading comprehension. Trans. Assoc. Comput. Linguist. 8, 662–678. doi: 10.1162/tacl_a_00338
Berlin, E., and Van Laerhoven, K. (2012). “Detecting leisure activities with dense motif discovery,” in Proceedings of the 2012 ACM Conference on Ubiquitous Computing (New York, NY: ACM), 250–259. doi: 10.1145/2370216.2370257
Bock, M., Hoelzemann, A., Moeller, M., and Van Laerhoven, K. (2022). Investigating (re) current state-of-the-art in human activity recognition datasets. Front. Comput. Sci. 4:924954. doi: 10.3389/fcomp.2022.924954
Bock, M., Hölzemann, A., Moeller, M., and Van Laerhoven, K. (2021). “Improving deep learning for har with shallow lstms,” in 2021 International Symposium on Wearable Computers (New York, NY: ACM), 7–12. doi: 10.1145/3460421.3480419
Bota, P., Silva, J., Folgado, D., and Gamboa, H. (2019). A semi-automatic annotation approach for human activity recognition. Sensors 19:501. doi: 10.3390/s19030501
Brenner, S. E. (1999). Errors in genome annotation. Trends Genet. 15, 132–133. doi: 10.1016/S0168-9525(99)01706-0
Bulling, A., Blanke, U., and Schiele, B. (2014). A tutorial on human activity recognition using body-worn inertial sensors. ACM Comput. Surv. 46:33. doi: 10.1145/2499621
Chung, J., and Monroe, G. S. (2003). Exploring social desirability bias. J. Bus. Ethics 44, 291–302. doi: 10.1023/A:1023648703356
Cleland, I., Han, M., Nugent, C., Lee, H., McClean, S., Zhang, S., et al. (2014). Evaluation of prompted annotation of activity data recorded from a smart phone. Sensors 14, 15861–15879. doi: 10.3390/s140915861
Cruz-Sandoval, D., Beltran-Marquez, J., Garcia-Constantino, M., Gonzalez-Jasso, L. A., Favela, J., Lopez-Nava, I. H., et al. (2019). Semi-automated data labeling for activity recognition in pervasive healthcare. Sensors 19, 3035. doi: 10.3390/s19143035
Friesen, K. B., Zhang, Z., Monaghan, P. G., Oliver, G. D., and Roper, J. A. (2020). All eyes on you: how researcher presence changes the way you walk. Sci. Rep. 10, 1–8. doi: 10.1038/s41598-020-73734-5
Gentile, A. L., Gruhl, D., Ristoski, P., and Welch, S. (2019). “Explore and exploit. dictionary expansion with human-in-the-loop,” in The Semantic Web: 16th International Conference, ESWC 2019, Portorož, Slovenia, June 2-6, 2019, Proceedings 16 (Cham: Springer), 131–145. doi: 10.1007/978-3-030-21348-0_9
Ghosh, A., Danieli, M., and Riccardi, G. (2015). “Annotation and prediction of stress and workload from physiological and inertial signals,” in 2015 37th annual international conference of the IEEE engineering in medicine and biology society (EMBC) (Milan: IEEE), 1621–1624. doi: 10.1109/EMBC.2015.7318685
Gjoreski, H., Ciliberto, M., Morales, F. J. O., Roggen, D., Mekki, S., Valentin, S., et al. (2017). “A versatile annotated dataset for multimodal locomotion analytics with mobile devices,” in Proceedings of the 15th ACM Conference on Embedded Network Sensor Systems (New York, NY: ACM), 1–2. doi: 10.1145/3131672.3136976
Gjoreski, H., Ciliberto, M., Wang, L., Morales, F. J. O., Mekki, S., Valentin, S., et al. (2018). The university of sussex-huawei locomotion and transportation dataset for multimodal analytics with mobile devices. IEEE Access 6, 42592–42604. doi: 10.1109/ACCESS.2018.2858933
Hassan, I., Mursalin, A., Salam, R. B., Sakib, N., and Haque, H. Z. (2021). “Autoact: an auto labeling approach based on activities of daily living in the wild domain,” in 2021 Joint 10th International Conference on Informatics, Electronics & Vision (ICIEV) and 2021 5th International Conference on Imaging, Vision & Pattern Recognition (icIVPR) (Kitakyushu: IEEE), 1–8. doi: 10.1109/ICIEVicIVPR52578.2021.9564211
Hoelzemann, A., Odoemelem, H., and Van Laerhoven, K. (2019). “Using an in-ear wearable to annotate activity data across multiple inertial sensors,” in Proceedings of the 1st International Workshop on Earable Computing (New York, NY: ACM), 14–19. doi: 10.1145/3345615.3361136
Hoelzemann, A., and Van Laerhoven, K. (2020). “Digging deeper: towards a better understanding of transfer learning for human activity recognition,” in Proceedings of the 2020 International Symposium on Wearable Computers (New York, NY: ACM), 50–54. doi: 10.1145/3410531.3414311
Huynh, D. T. G. (2008). Human actIvity Recognition with Wearable Sensors. Darmstadt: Technische Universität Darmstadt, 59–65.
Ioffe, S., and Szegedy, C. (2015). “Batch normalization: accelerating deep network training by reducing internal covariate shift,” in International conference on machine learning (Lille: PMLR), 448–456.
Klayman, J. (1995). Varieties of confirmation bias. Psychol. Learn. Motiv. 32, 385–418. doi: 10.1016/S0079-7421(08)60315-1
Klie, J.-C., de Castilho, R. E., and Gurevych, I. (2020). “From zero to hero: human-in-the-loop entity linking in low resource domains,” in Proceedings of the 58th annual meeting of the association for computational linguistics (Stroudsbourg, PA: ACL), 6982–6993. doi: 10.18653/v1/2020.acl-main.624
Leonardis, A., Bischof, H., and Maver, J. (2002). Multiple eigenspaces. Pattern Recognit. 35, 2613–2627. doi: 10.1016/S0031-3203(01)00198-4
Lieder, F., Griffiths, T. L., Huys, M., and Goodman, Q. J. N. D. (2018). The anchoring bias reflects rational use of cognitive resources. Psychon. Bull. Rev. 25, 322–349. doi: 10.3758/s13423-017-1286-8
Ma, Z., Wei, X., Hong, X., and Gong, Y. (2019). “Bayesian loss for crowd count estimation with point supervision,” in Proceedings of the IEEE/CVF international conference on computer vision (Seoul: IEEE), 6142–6151. doi: 10.1109/ICCV.2019.00624
Mekruksavanich, S., and Jitpattanakul, A. (2021). “Recognition of real-life activities with smartphone sensors using deep learning approaches,” in IEEE 12th International Conference on Software Engineering and Service Science (ICSESS) (Beijing: IEEE), 243–246. doi: 10.1109/ICSESS52187.2021.9522231
Min, H., Park, J., and Kim, H. J. (2016). Common method bias in hospitality research: a critical review of literature and an empirical study. Int. J. Hosp. Manag. 56, 126–135. doi: 10.1016/j.ijhm.2016.04.010
Miu, T., Missier, P., and Plötz, T. (2015). “Bootstrapping personalised human activity recognition models using online active learning,” in 2015 IEEE International Conference on Computer and Information Technology; Ubiquitous Computing and Communications; Dependable, Autonomic and Secure Computing; Pervasive Intelligence and Computing (Liverpool: IEEE), 1138–1147. doi: 10.1109/CIT/IUCC/DASC/PICOM.2015.170
NASA (1986). NASA task load index (NASA-TLX), version 1.0: Paper and pencil package. Moffett Field, CA.
Natarajan, N., Dhillon, I. S., Ravikumar, P. K., and Tewari, A. (2013). “Learning with noisy labels,” in Advances in neural information processing systems (Lake Tahoe, NV), 26.
Ollenschläger, M., Küderle, A., Mehringer, W., Seifer, A.-K., Winkler, J., Gaßner, H., et al. (2022). Mad gui: an open-source python package for annotation and analysis of time-series data. Sensors 22:5849. doi: 10.3390/s22155849
Ordóñez, F., and Roggen, D. (2016). Deep convolutional and LSTM recurrent neural networks for multimodal wearable activity recognition. Sensors 16:115. doi: 10.3390/s16010115
Pal, D., Funilkul, S., and Vanijja, V. (2020). The future of smartwatches: assessing the end-users' continuous usage using an extended expectation-confirmation model. Univers. Access. Inf. Soc. 19, 261–281. doi: 10.1007/s10209-018-0639-z
Reining, C., Rueda, F. M., Niemann, F., and Fink, G. A. ten Hompel, M. (2020). “Annotation performance for multi-channel time series har dataset in logistics,” in 2020 IEEE International Conference on Pervasive Computing and Communications Workshops (PerCom Workshops) (Austin, TX: IEEE), 1–6. doi: 10.1109/PerComWorkshops48775.2020.9156170
Reyes-Ortiz, J.-L., Oneto, L. Samà, A., Parra, X., and Anguita, D. (2016). Transition-aware human activity recognition using smartphones. Neurocomputing 171, 754–767. doi: 10.1016/j.neucom.2015.07.085
Roggen, D., Calatroni, A., Rossi, M., Holleczek, T., Förster, K., Tröster, G., et al. (2010). “Collecting complex activity datasets in highly rich networked sensor environments,” in 2010 Seventh international conference on networked sensing systems (INSS) (Kassel: IEEE), 233–240. doi: 10.1109/INSS.2010.5573462
Scholl, P. M., Wille, M., and Van Laerhoven, K. (2015). “Wearables in the wet lab: a laboratory system for capturing and guiding experiments,” in Proceedings of the 2015 ACM International Joint Conference on Pervasive and Ubiquitous Computing (New York, NY: ACM), 589–599. doi: 10.1145/2750858.2807547
Schröder, M., Yordanova, K., Bader, S., and Kirste, T. (2016). “Tool support for the online annotation of sensor data,” in Proceedings of the 3rd International Workshop on Sensor-based Activity Recognition and Interaction (New York, NY: ACM), 1–7. doi: 10.1145/2948963.2948972
scikit-Learn (2022). Cohen's kappa - scikit-learn. Available online at: https://scikit-learn.org/stable/modules/generated/sklearn.metrics.cohen_kappa_score.html (accessed Febuary 10, 2022).
Sculley, D. (2007). “Online active learning methods for fast label-efficient spam filtering,” in CEAS, Vol. 7 (Mountain View, CA), 143.
Smith, M. R., Chai, R., Nguyen, H. T., Marcora, S. M., and Coutts, A. J. (2019). Comparing the effects of three cognitive tasks on indicators of mental fatigue. J. Psychol. 153, 759–783. doi: 10.1080/00223980.2019.1611530
Song, H., Kim, M., Park, D., Shin, Y., and Lee, J.-G. (2022). Learning from noisy labels with deep neural networks: a survey. IEEE Trans. Neural Netw. Learn. Syst. 34, 8135–8153. doi: 10.1109/TNNLS.2022.3152527
Stikic, M., Larlus, D., Ebert, S., and Schiele, B. (2011). Weakly supervised recognition of daily life activities with wearable sensors. IEEE Trans. Pattern Anal. Mach. Intell. 33, 2521–2537. doi: 10.1109/TPAMI.2011.36
Stisen, A., Blunck, H., Bhattacharya, S., Prentow, T. S., Kjærgaard, M. B., Dey, A., et al. (2015). “Smart devices are different: assessing and mitigatingmobile sensing heterogeneities for activity recognition,” in Proceedings of the 13th ACM conference on embedded networked sensor systems (New York, NY: ACM), 127–140. doi: 10.1145/2809695.2809718
Sztyler, T., and Stuckenschmidt, H. (2016). “On-body localization of wearable devices: an investigation of position-aware activity recognition,” in IEEE International Conference on Pervasive Computing and Communications (Sydney, NSW: IEEE), 1–9. doi: 10.1109/PERCOM.2016.7456521
Tapia, E. M., Intille, S. S., and Larson, K. (2004). “Activity recognition in the home using simple and ubiquitous sensors,” in International conference on pervasive computing (Cham: Springer), 158–175. doi: 10.1007/978-3-540-24646-6_10
Thomaz, E., Essa, I., and Abowd, G. D. (2015). “A practical approach for recognizing eating moments with wrist-mounted inertial sensing,” in Proceedings of the 2015 ACM international joint conference on pervasive and ubiquitous computing (New York, NY: ACM), 1029–1040. doi: 10.1145/2750858.2807545
Tonkin, E. L., Burrows, A., Woznowski, P. R., Laskowski, P., Yordanova, K. Y., Twomey, N., et al. (2018). Talk, text, tag? Understanding self-annotation of smart home data from a user's perspective. Sensors 18:2365. doi: 10.3390/s18072365
Vaizman, Y., Ellis, K., Lanckriet, G., and Weibel, N. (2018). “Extrasensory app: data collection in-the-wild with rich user interface to self-report behavior,” in Proceedings of the 2018 CHI conference on human factors in computing systems (New York, NY: ACM), 1–12. doi: 10.1145/3173574.3174128
Valuri, G., Stevenson, M., Finch, C., Hamer, P., and Elliott, B. (2005). The validity of a four week self-recall of sports injuries. Inj. Prev. 11, 135–137. doi: 10.1136/ip.2003.004820
Van Laerhoven, K., Kilian, D., and Schiele, B. (2008). “Using rhythm awareness in long-term activity recognition,” in 2008 12th IEEE International Symposium on Wearable Computers (Pittsburgh, PA: IEEE), 63–66. doi: 10.1109/ISWC.2008.4911586
Wallace, E., Rodriguez, P., Feng, S., Yamada, I., and Boyd-Graber, J. (2019). Trick me if you can: human-in-the-loop generation of adversarial examples for question answering. Trans. Assoc. Comput. Linguist. 7, 387–401. doi: 10.1162/tacl_a_00279
Wang, K., He, J., and Zhang, L. (2019). Attention-based convolutional neural network for weakly labeled human activities' recognition with wearable sensors. IEEE Sens. J. 19, 7598–7604. doi: 10.1109/JSEN.2019.2917225
Wang, K., He, J., and Zhang, L. (2021). Sequential weakly labeled multiactivity localization and recognition on wearable sensors using recurrent attention networks. IEEE Trans. Hum.-Mach. Syst. 51, 355–364. doi: 10.1109/THMS.2021.3086008
Watkins, P. C. (2002). Implicit memory bias in depression. Cogn. Emot. 16, 381–402. doi: 10.1080/02699930143000536
Wu, X., Xiao, L., Sun, Y., Zhang, J., Ma, T., He, L., et al. (2022). A survey of human-in-the-loop for machine learning. Future Gener. Comput. Syst. 134, 365–381. doi: 10.1016/j.future.2022.05.014
Yordanova, K. Y., Paiement, A., Schröder, M., Tonkin, E., Woznowski, P., Olsson, C. M., et al. (2018). Challenges in annotation of user data for ubiquitous systems: results from the 1st ARDUOUS workshop. arXiv [Preprint]. doi: 10.48550/arXiv.1803.05843
Zhang, S., He, L., Dragut, E., and Vucetic, S. (2019). “How to invest my time: lessons from human-in-the-loop entity extraction,” in Proceedings of the 25th ACM SIGKDD International Conference on Knowledge Discovery & Data Mining (New York, NY: ACM), 2305–2313. doi: 10.1145/3292500.3330773
Keywords: data annotation ambiguity, data labeling, deep learning, dataset, annotation method
Citation: Hoelzemann A and Van Laerhoven K (2024) A matter of annotation: an empirical study on in situ and self-recall activity annotations from wearable sensors. Front. Comput. Sci. 6:1379788. doi: 10.3389/fcomp.2024.1379788
Received: 31 January 2024; Accepted: 02 July 2024;
Published: 18 July 2024.
Edited by:
Jamie A. Ward, Goldsmiths University of London, United KingdomReviewed by:
Mathias Ciliberto, University of Sussex, United KingdomLei Zhang, Nanjing Normal University, China
Copyright © 2024 Hoelzemann and Van Laerhoven. This is an open-access article distributed under the terms of the Creative Commons Attribution License (CC BY). The use, distribution or reproduction in other forums is permitted, provided the original author(s) and the copyright owner(s) are credited and that the original publication in this journal is cited, in accordance with accepted academic practice. No use, distribution or reproduction is permitted which does not comply with these terms.
*Correspondence: Alexander Hoelzemann, YWxleGFuZGVyLmhvZWx6ZW1hbm5AdW5pLXNpZWdlbi5kZQ==