- 1Department of Computer Science, College of Computer Engineering and Science, Prince Sattam bin Abdulaziz University, Al Kharj, Saudi Arabia
- 2Otto-von-Guericke-University Magdeburg (IIKT), Magdeburg, Germany
Driver drowsiness or fatigue is among the most important factors that cause traffic accidents; therefore, a monitoring system is necessary to detect the state of a driver drowsiness or fatigue. In this paper, an automated vision-based system for real-time prediction of driver drowsiness or fatigue is presented, in which multiple visual ocular features such as eye closure, eyebrow shape, eye blinking, and other perfectly defined geometric facial features are employed as robust cues for driver's drowsiness. In addition, an efficient scheme is applied to extract local Gabor features of driver images based on Fisher's quantum information. A novel Fisher-Gabor descriptor (FGD) is then constructed from the extracted features, which is invariant to scale and rotation and also robust to changes in illumination, noise, and minor changes in viewpoint. The normalized FGDs are ultimately fed to a Latent Dynamic Conditional Random Field (LDCRF) classification model to predict whether the driver is drowsy/fatigued and a warning signal is thus issued (if required). A series of intensive experiments conducted on the benchmark NTHU-DDD video dataset show that the proposed system can predict driver drowsiness or fatigue effectively and efficiently, exceeding several state-of-the art alternatives by achieving a competitive detection accuracy of 97.6%, while still preserving stringent real-time guarantees.
1 Introduction
The recent tremendous technological advancements in computing and telecommunications over the course of past few decades have continuously given assistance to vehicular drivers, particularly in the form of various modern Intelligent Transportation Systems (ITS). Research in drowsy-driver monitoring reveals that driver fatigue is a leading contributory factor in up to approximately 20% of road accidents, and roughly up to one-fourth of total serious and fatal accidents (Beles et al., 2024). Therefore, the automated detection and recognition of driver fatigue or drowsiness has emerged as a high potential and increasingly attractive area of research with numerous applications (Bakheet and Al-Hamadi, 2021). Globally, an average of 3200 persons die each day around the world due to road traffic crashes (RTCs). It is anticipated that the great majority of these collisions (i.e., 95%–99%) (Hendricks et al., 2001) are caused by driver-related risky behaviors, such as sleepiness, drug and alcohol usage, psychological stress, inexperience, etc. For instance, the National Highway Traffic Safety Administration (NHTSA) in the USA indicates that sleepy driving contributed to an estimated 72,000 collisions, resulting in 44,000 injuries and nearly 800 deaths (Rep, 2017).
Numerous studies have looked closely at the connection between driver tiredness and collision risk in an effort to pinpoint and measure the elevated risk. For example, Williamson et al. clearly demonstrate in Williamson et al. (2011) how sleep homeostatic effects lead to decreased performance and accidents. According to another study in (Klauer et al., 2006), taking your eye off the road for just two seconds, for example when using a mobile phone or even texting while driving, can significantly increase the chance of a crash up to 24 times. Furthermore, it has also been stated that drivers who are sleep deprived are around 4–6 times more likely than alert drivers to be involved in sleep-related collisions or near-crash incidents (Alajlan and Ibrahim, 2023). Recent research by Stevenson et al. (2014) in a case-control study of heavy-vehicle drivers has revealed that chronic sleep debt or deprivation can also raise the risk of a catastrophic collision. Additionally, in Bouchner et al. (2006), Bouchner et al. argued that drowsy drivers not only show more fast corrective steering wheel movements and larger deviations from the desired trajectory, but also they are even less likely to comply with the speed limit.
Over the last two decades or so, several methods and strategies have emerged that greatly aid in reducing the trauma caused by traffic accidents, such as, teaching drivers how to manage their exhaustion by taking the necessary breaks (Çivik and Yüzgeç, 2023). Subjective measurements, including self-assessment of one's own state of exhaustion, are necessary for this. Drivers can identify when they are feeling sleepy and when they are likely to fall asleep, according to a study (Williamson et al., 2014). While self-assessment of sleepiness is a moderately effective first coping strategy, it is insufficient to completely eradicate sleepiness-related road trauma; as such, further safety and warning systems must be established immediately. By warning drivers of their sleepiness before accidents happen, technological advancements have the potential to dramatically lower the number of injuries and fatalities related to traffic accidents (Albadawi et al., 2023).
For instance, a study by Blommer et al. (2006) found that a warning signal considerably increases the driver's lane departure reaction time. The authors also came to the conclusion that there is no hard-and-fast rule regarding how these warning signals are issued. In other words, visual, audible, and tactile warnings are all equally effective. The state of the art approaches for driver fatigue detection fall mainly into three broad categories: i.e., physiological measures, vehicular measurements and computer vision methods. Steering wheel movements (Sayed and Eskandarian, 2001) and deviations from lane position (Lawoyin, 2014) are two examples of driving behavior metrics that are calculated in traditional vehicle-based measurement methods (Hegde et al., 2020) to identify abrupt or abrupt changes in driving direction. Another method for identifying shifts in a driver's level of awareness is to keep an eye on and measure certain internal indicators, like heart rate variability (Tsuchida et al., 2010), or brain activity (King et al., 2006).
Physiological measurement techniques, however, are frequently less practical in practice than vehicle-based and computer vision approaches because they require multiple sensors (Bakheet and Al-Hamadi, 2021). In this context, it is significant to remember that the primary drawback of physiological sensors is that they are invasive, which means that they are never suitable for use in a production vehicle. Artificial neural network (ANN) based image processing methods have been (and are) successfully used to address a variety of traffic safety issues [such as traffic safety analysis of toll booths (Abdelwahab and Abdel-Aty, 2002) and driver behavior changes (Wijnands et al., 2018)]. Additionally, these methods have shown to be the best architectures for a variety of visual recognition tasks (Abd El-Mageed et al., 2024). The detection of driver drowsiness has garnered significant attention in computer vision and pattern recognition in recent years. An automated system for detecting fatigued driving was introduced by Park et al. (2017). The system recognizes each frame in a captured driver video sequence as drowsy or not by using three pre-trained deep networks (i.e., AlexNet, FlowImageNet, and VGG-FaceNet) and two ensemble strategies (both independently averaged and feature-fused architectures). Similarly, the authors of Huynh et al. (2017) proposed a method to detect driver drowsiness by enhancing supervised learning by utilizing deep 3D neural networks in conjunction with a boosting framework for semi-supervised learning.
Jabbar et al. (2018) present a deep learning technique for identifying fatigue driver in real-time. The technique can be conveniently articulated into Android apps and with a high accuracy. The compression of a heavy base model into a light one is the main contribution of this work. Furthermore, this method uses facial feature detection (key points) to create a minimized network structure that determines whether the driver is sleepy. In Lenskiy and Lee (2012), a novel color and texture segmentation algorithm was employed to present an eye blink detection technique that extracts facial features using an ANN-based face segmentation algorithm. The extracted features are then used to perform iris tracking and eye blink detection. In this method, an eye closure lasting more than 220 milliseconds is classified as sleepy or drowsy. Moreover, Harada et al. (2013) provide an assessment model for cognitive distraction state that mainly makes use of eye-tracking data and recurrent neural networks. To predict a driver's state of distraction, eye-tracking data are used to automatically compute the pupil diameter which is then fed into a recurrent neural network model.
In Pauly and Sankar (2015), the authors presented a technique for detecting drowsy drivers that relies on blink detection with the use of a typical HOG feature and an SVM classifier. Through evaluation on their own dataset, the technique achieved a total accuracy of 91.62% by comparing the prediction of the developed system with that of a human observer. In addition, in Moujahid et al. (2021), a facial monitoring based framework for fatigued driver detection uses a succinct facial texture description to discover highly discriminative sleepiness traits. In a similar vein, Singh et al. (2018) demonstrate the application of linear SVM classification and HOG feature extraction to identify impending driver fatigue and provide enough time for an accident to be avoided. The remainder of the paper is structured as follows. Section 2 details the architecture of the proposed methodology for driver drowsiness prediction. In Section 3, the experimental setup is presented and the evaluation results are fully reported and discussed. Finally, in Section 4, the paper closes with a short conclusion as well as a discussion of limitations and directions for future research.
2 The proposed methodology
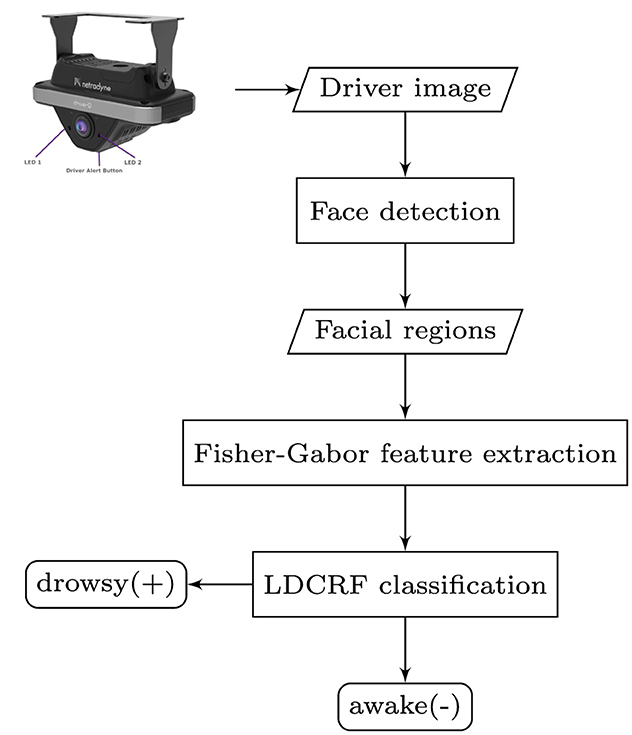
This section presents in details the methodology of the proposed system for drowsy driving prediction. The main system steps are shown by a functional block diagram in Figure 1. The following key steps gives a quick description of the technique used in the suggested approach to identify driver drowsiness. Initially, the adaptive contrast-limited histogram equalization technique is applied to preprocess the diver's image taken with a dashboard mounted camera. This would help in the illumination intensity fluctuations and then improves the image's overall brightness and contrast. An adaBoost classifier depending on Haar-like basic features is then employed to identify the driver's face region (Viola and Jones, 2001). In addition, a simple but efficient technique utilizing an enhanced Active Shape Model (ASM) is applied to automatically locate the facial regions of interest. An effective feature extraction scheme based on Fisher's quantum information is then applied for extracting a set of potentially discriminative local Gabor facial features from the detected driver facial regions. An invariant Fisher-Gabor feature descriptor that is most robust to scale, rotation, and illumination invariance is thus built from the extracted facial features. Finally, the Fisher-Gabor descriptor is fed to a latent-dynamic conditional random field (LDCRF) classification model to predict the driver status (i.e., fatigued or not). The following subsections include further details about each module of the architecture of the proposed driver drowsiness prediction system.
2.1 Image preprocessing
The input image that is originally captured by a car dashboard camera is first smoothed using, e.g., a 2D Gaussian blur filter (a 5 × 5 pixel neighborhood, standard deviation of 0.5) in order to eliminate (or reduce) distracting noises and undesired dark spots while maintaining original image spatial structures. An adapted contrast-limited histogram equalization technique (Bakheet and Al-Hamadi, 2017; Gomaa et al., 2022; Bakheet and Al-Hamadi, 2020a) is then applied, where each of the color channels is independently equalized, resulting in an even more lighting-compensated image which eventually acts as an input to the subsequent face detection model. One can argue that significantly reducing the resolution of the light-compensated image following the light compensation procedure is one technique to increase the computing speed of the detection framework (Bakheet and Al-Hamadi, 2020b).
2.2 Facial landmark localization
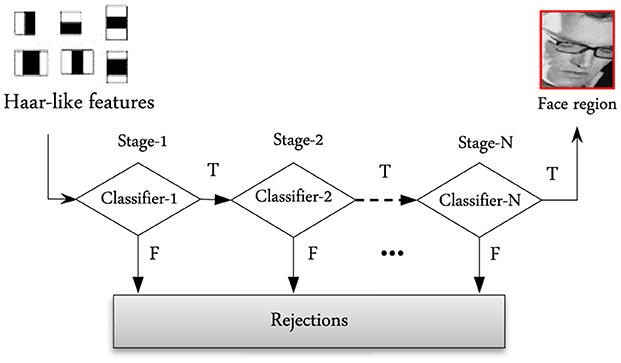
As previously mentioned, facial landmark detection and localization (also well-known as region of interest–ROI) that seek to pinpoint the location of the driver facial features represent the first and most important step in creating and putting into practice an effective framework for drowsy driving prediction. In this work, a rapid facial landmark localization technique is applied, whereby the driver facial landmarks are located using a collection of Haar like features to train an improved adaBoost classifier (see Figure 2). In this detection technique, the corrected image is first divided into several rectangular regions, since a driver's face can be found in the image at any position and scale. As shown in Figure 2, the features that are being used are characterized by various configurations of bright and dark areas. The difference between the total intensity of pixels in the bright and dark sections for each instance determines the feature value. Due to their quick training time, Haar-like features hold great potential for real-time facial landmark identification. In essence, a cascaded adaBoost classifier is a strong (non-linear) classifier built from an ensemble of multiple weak (linear) classifiers, each of which based on adaBoost training framework. A face landmark region is found when an eligible sample goes through the cascaded adaBoost classifier. While samples from non-facial landmarks are rejected, nearly all samples from the facial landmark regions are accepted. Figure 3 below illustrates waterfall-type classification for facial landmark identification using the adaBoost algorithm.
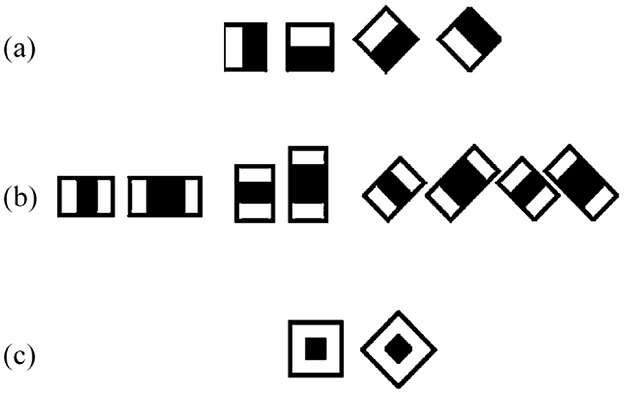
Figure 2. Basic Haar-like features: (a) edge feature, (b) linear feature, and (c) surrounded feature.
An enhanced Active Shape Model (ASM) technique based on statistical learning models has the ability to quickly and effectively extract pertinent facial characteristics for eye-mouse area detection. The ultimate purpose of active forms in this technique is to match the model to each fresh image. This is achieved by training the ASM on a set of precise points that reflect contours of facial features, that are manually annotated with the points of interest related to those features. Next, the primary components of the training dataset are identified using Principal Component Analysis (PCA). Figure 4 illustrates the detection and localization process of the eye-mouse areas in the image following the establishment of the ASM. Models can be iteratively matched using a cost function in an iterative strategy to the disparity between the actual contour and the model.
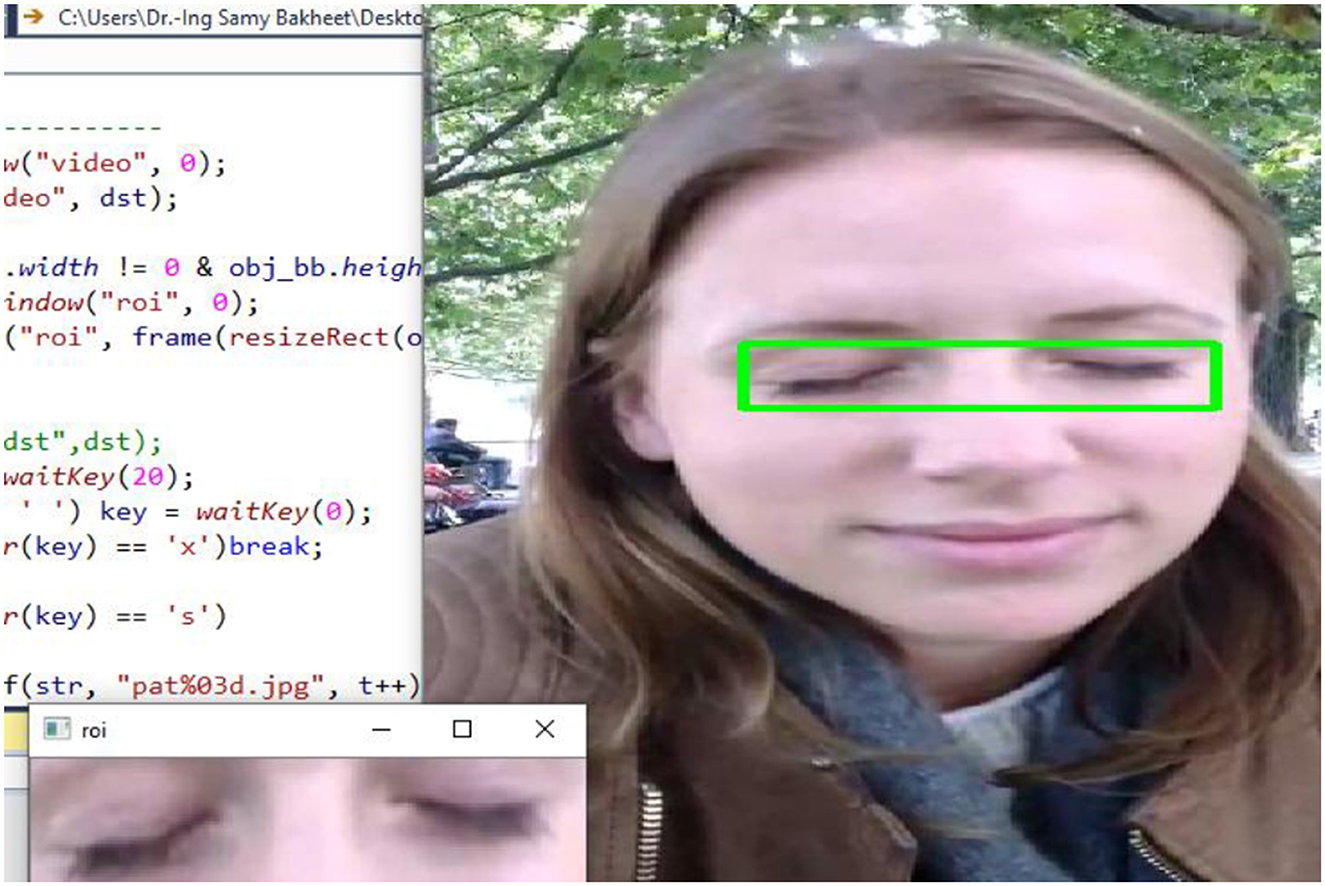
Figure 4. An exemplar snapshot of facial region localization in the drowsy driving detection system.
2.3 Feature extraction
Information is frequently taken from images using Gabor wavelets, which are extracted at various frequencies and orientations (Grigorescu et al., 2002). This section explains the process of detecting distinctive key points or features in an image for facial landmark representation and constructing an invariant texture descriptor [i.e., Fisher-Gabor descriptor (FGD)] that is robust to changes in scale, rotation, and affine transformations.
2.3.1 2-D Gabor filters
Gabor wavelet-based texture features have been applied extensively and successfully in many different fields, such as signal processing, object recognition, and data clustering, because of their incredibly unique qualities. In the frequency and spatial domains, Gabor kernels (Lades et al., 1993; Jeon et al., 2021) are optimally localized and they show favorable properties of capturing orientation selectivity and spatial localization. As a result, they are able to offer target object discriminative characteristics in images. The representation of a 2-D Gabor filter is a shifted Gaussian in the frequency domain and a Gaussian modulated sinusoid in the spatial domain. In order to preserve information regarding spatial relations and spatial frequency structure, digital images can be correctly characterized using the Gabor wavelet representation (Malik and Perona, 1990). The expression for a family of Gabor wavelets (also called filters or kernels), can be potentially described as the product of a complex plane wave with an elliptical Gaussian envelope:
where |·| represents the norm operator. This yields the wave vector kj:
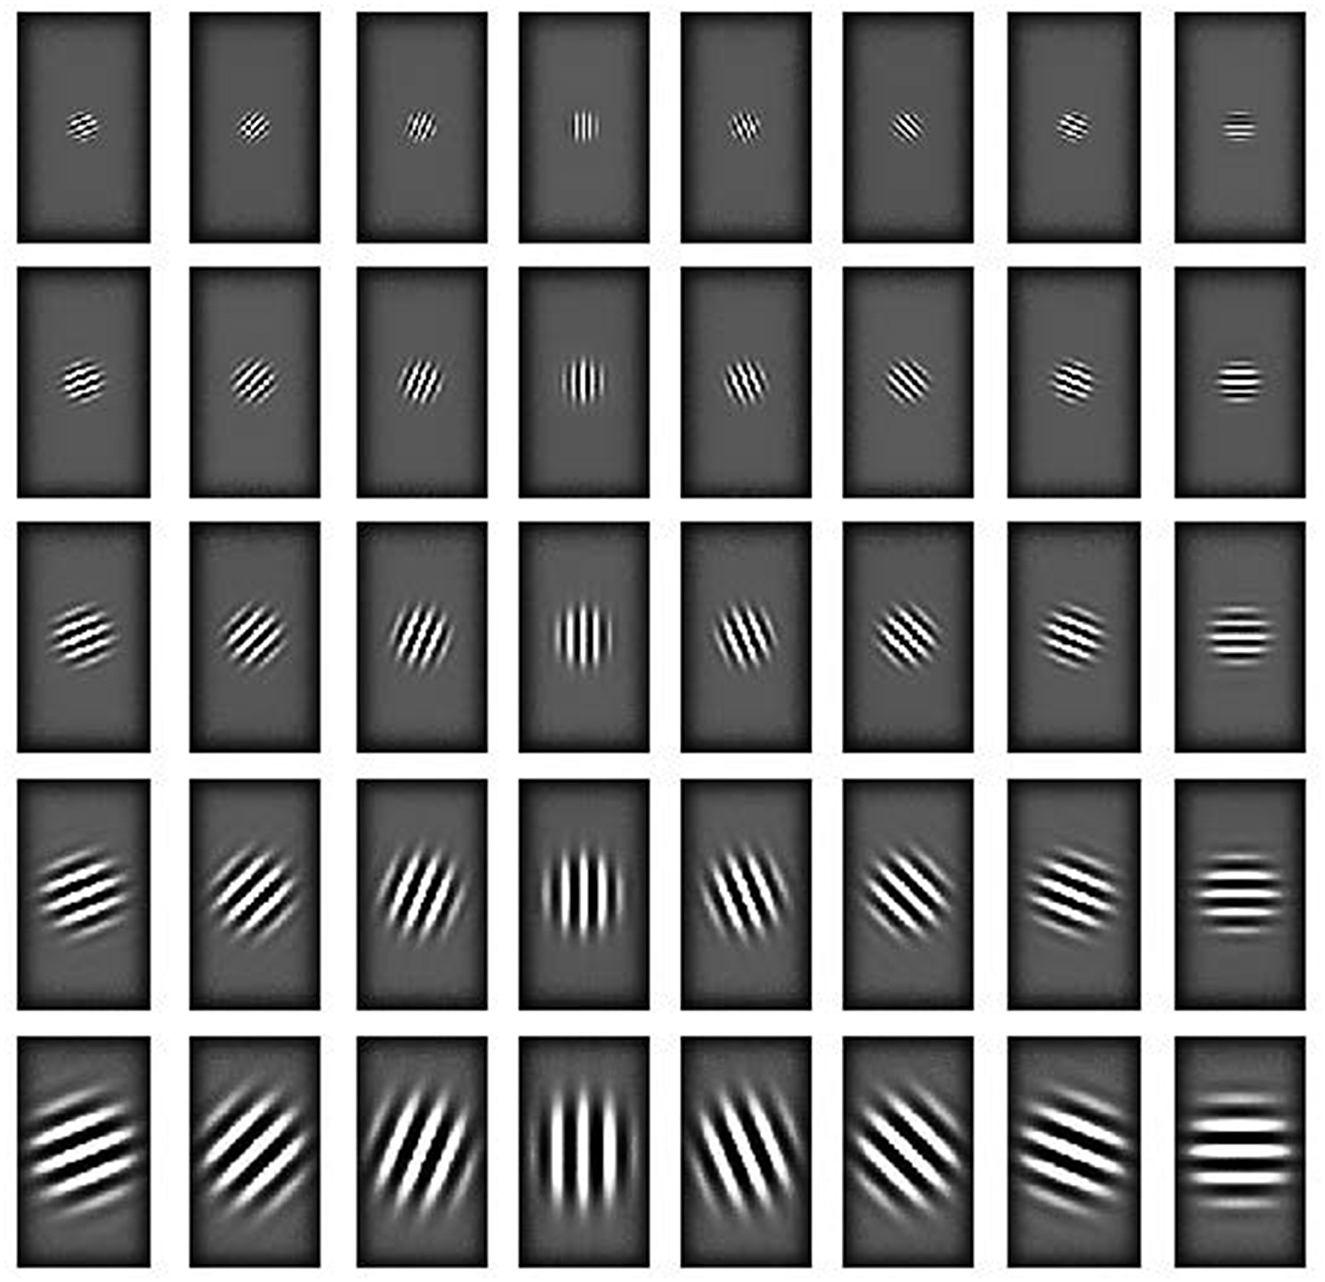
where, the direction and scale of Gabor kernels are denoted by μ and v of the index j = μ+8v, respectively. Two-dimensional plots for the real parts of a collection of 40 Gabor kernels with eight orientations and five frequencies are displayed in Figure 5.
2.3.2 Local fisher-Gabor features
A group of Gabor kernel coefficients with different frequencies and orientations is called a jet at each pixel. Using a wavelet transform, the jet holding the Gabor convolution responses at each z pixel in an image I may be represented as follows:
Equation 5 above illustrates how to obtain Gabor features by convolving an image with a set of suitable Gabor filters, or kernels of Gaussian functions modulated by sinusoidal plane waves, applied at different points in the image. For the purpose of extracting local features from facial regions (also known as regions of interest, or ROIs), we start by using a filter bank consisting of 40 log-Gabor filters (eight orientations and five scales):
Formally, the produced Gabor features at (x, y) location are obtained by convoluting the bank of all 40 Gabor filters with a pixel at (x, y) in the facial region:
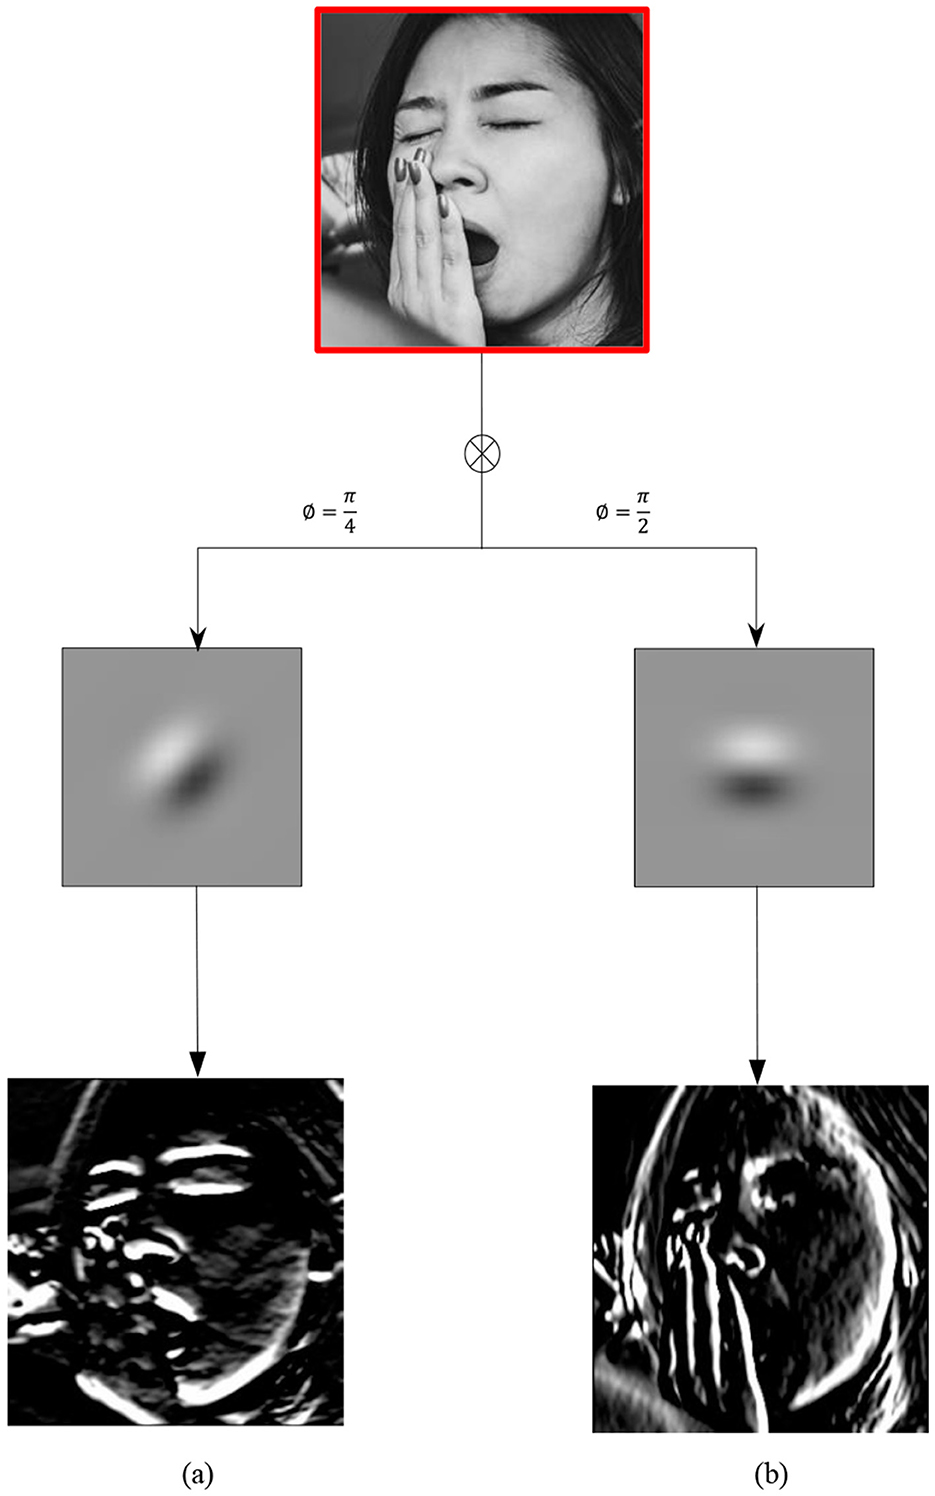
Figure 6 shows the convolution results of a sample face area with two Gabor filters with two orientation angles of and . In general, 5 × 8 × m×n = 40mn features will be obtained by using a set of 40 Gabor filters in the final convolution of a patch picture of size m×n.
Since Gabor filter settings are usually chosen by experimentation, a significant portion of the resulting features (such as strongly correlated features) probably include a significant amount of duplicated/irrelevant information. Reduced influence of redundant information transmitted among features may be achieved by de-correlating the derived Gabor features and efficiently reducing their dimension while maintaining good detection performance using an efficient feature selection procedure (Gjoreski et al., 2020). In many object identification and classification tasks, most relevant statistical features (e.g., mean, standard deviation, or energy) are commonly used to be extracted from the Gabor filtered image. In this work, however, we take a new strategy that proves to be highly beneficial for our goals of selecting the most important features as well as reducing the number of features. In achieving this goal, the outputs of Gabor filters are first normalized in order to enhance the convolved image with spatially dispersed maxima. Next, for each normalized Gabor filter output, the non-extensive entropies and Fisher information are calculated as follows,
where P is an estimate of the probability distribution obtained from the Gabor response histograms, H1 and H2 are the Rényi and Tsallis generalized formalisms of non-extensive entropies, respectively, F is the Fisher information measure (Bakheet and Al-Hamadi, 2017). It is crucial to note at this point that achieving relatively acceptable detection performance is the primary driving force for the use of such a method for feature selection, in addition to the reduction of computational costs associated with the feature extraction task. Furthermore, there is general consensus that in many computer vision applications, local features offer significantly more stability than global features because of their resilience to geometrical transformations and occlusion. As a result, local features are commonly regarded as a surprisingly powerful tool for representing objects.
2.4 Feature classification
The feature classification module of the proposed driver drowsiness prediction system which differentiates between a fully awake and mildly drowsy driver, is described in detail in this section. Broadly speaking, in the proposed system, the classification module's main objective is to use the retrieved Fisher-Gabor features to classify each driver image into one of two states—drowsy or awake. The classification module primarily relies on the availability of a set of instances (e.g., facial images) that may serve as examples for the machine learning algorithm, enabling it to learn how to accomplish the intended classification task. Traditionally, this collection of previously identified (or labeled) facial images is called the “training set” and then the applied learning method is called “supervised learning.” Several machine learning (ML) models, such as Artificial Neural Networks (ANN), Bayesian Networks (BN), Support Vector Machines (SVM), k-Nearest Neighbors (k-NN), and Conditional Random Fields (CRF), are available in the literature for the current task of classifying facial expressions. In this work, we decide to carry out the classification task using the latent-dynamical CRF (LDCRF) model. The LDCRF model is characterized as a typical discriminative probabilistic latent variable model that can successfully and consistently learn dynamics between class labels and represent the sub-structure of a class label, based on its inherent dependence on CRFs. Moreover, it's been shown that the LDCRF model performs substantially better in several large-scale object recognition applications when compared to several machine learning models, such as naive Bayes, hidden Markov models, and hidden Semi-Markov models (Deufemia et al., 2014). Additionally, it could do a better job of assimilating pertinent background and successfully fusing it with visual observations.
The LDCRF models were essentially introduced as an extension of conventional CRF models to discover the hidden interactions between features. These models are powerful in classifying and segmenting sequential data; they are conceptualized as undirected probabilistic graphical models. As a result, windowing the signal is not necessary because they are immediately relevant to sequential data. Every label (or state) in this way points to a particular facial instance. With a class label assigned to every observation, LDCRF models may effectively learn and categorize facial patterns in unsegmented face pictures. Additionally, during training and testing, the LDCRF models are able to accurately infer facial patterns.
In formal terms, the main goal of the LDCRF model. Morency et al. (2007) is to discover a direct mapping between a series of observations (or raw features) x = 〈x1, x2, …, xm〉 and a series of class labels y = 〈y1, y2, …, ym〉, where each label yj for the j-th observation indicates a member in a class label set Y and a feature vector represents each image observation xj. Now, let h = 〈h1, h2, …, hm〉 for each sequence represent a collection of latent substructure variables that will be “hidden” in the created model, since they aren't observed in the training data, as shown in the following Figure 7.
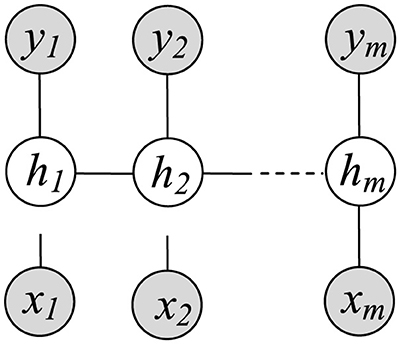
Figure 7. Graphical representation of LDCRF model, where hj denotes the hidden state assigned to the j-th observation xj, and yj is the class label of xj. The filled gray nodes correspond to the observed model variables.
In light of the aforementioned definitions, the formulation of a latent-conditional model is given by
where the set θ denotes the ideal model parameters. Now, assuming a set of training examples, each has its appropriate class value {(xi, yi), i = 1…n}, the training technique aims at learning the optimal model parameters θ from the objective function (Lafferty et al., 2001) defined as:
where n is the number of training samples in this case. It is important to note that the above Equation 8 has two terms on the right-hand side: the log-likelihood of the training data is the first term, and the log of a Gaussian prior with variance σ2 is the second one that can be written as follows,
The optimal model parameters can be estimated by maximizing the objective function iteratively using a gradient ascent technique:
The trained model can subsequently apply inductive inference to predict unknown (test) data after the parameters θ* are learnt:
where y* is a predicted label for a new sample x that has not been observed.
3 Experimental results
In order to validate the superior performance of the proposed framework for driver drowsiness detection over competing state-of-the-art techniques in the literature, a variety of experimental data are shown and analyzed in this section. As per many previously published methods (Khushaba et al., 2011; Vu et al., 2019), there are currently relatively few publicly available datasets for thorough performance evaluation of various methods for predicting driver sleepiness, especially those that include information on driver concentration in realistic driving circumstances (Ramzan et al., 2019). However, establishing a meaningful dataset for realistic driver drowsiness detection that can be utilized to fully train the proposed system is very challenging and risky. The only dataset that is made accessible to the public and includes annotations for driver fatigue, head, eye-pair, and mouth states is the NTHU dataset for drowsy driving detection (NTHU-DDD). For this reason, we conduct a set of extensive experiments on this dataset to confirm the efficacy of the proposed framework for drowsy driving detection.
The academic NTHU-DDD dataset (Weng et al., 2016) collected by the NTHU Computer Vision Lab at National Tsing Hua University was first published in the 2016 Asian conference on computer vision (ACCV) on driver drowsiness detection from video. The video sequences in the NTHU-DDD dataset were captured in AVI format at a spatial resolution of 640 × 480 pixels, using a high-speed camera operating under active infrared (IR) light. Approximately nine and a half hours is the total duration of all video streams in the NTHU-DDD dataset. The dataset comprises 36 subjects of different ethnic backgrounds who were twice filmed (both with and without spectacles/sunglasses) in a range of challenging simulated driving settings, including slow blinking, normal driving, yawning, laughing uncontrollably, falling aslzeep, etc., in both daytime and nighttime illuminations. While being filmed, the participants were instructed to make specific facial expressions while playing a racing game with a mimicked steering wheel and pedals while seated in a vehicle chair. In addition, five scenario variations, i.e., BareFace, Glasses, Sunglasses, Night-BareFace and Night-Glasses were used to record the dataset streams in a simulated setting. The dataset streams of the first three situations were recorded at a frame rate of 30fps, while the other dataset streams were recorded at a frame rate of 15fps. Sample snapshots of the NTHU-DDD dataset are displayed in Figure 8.
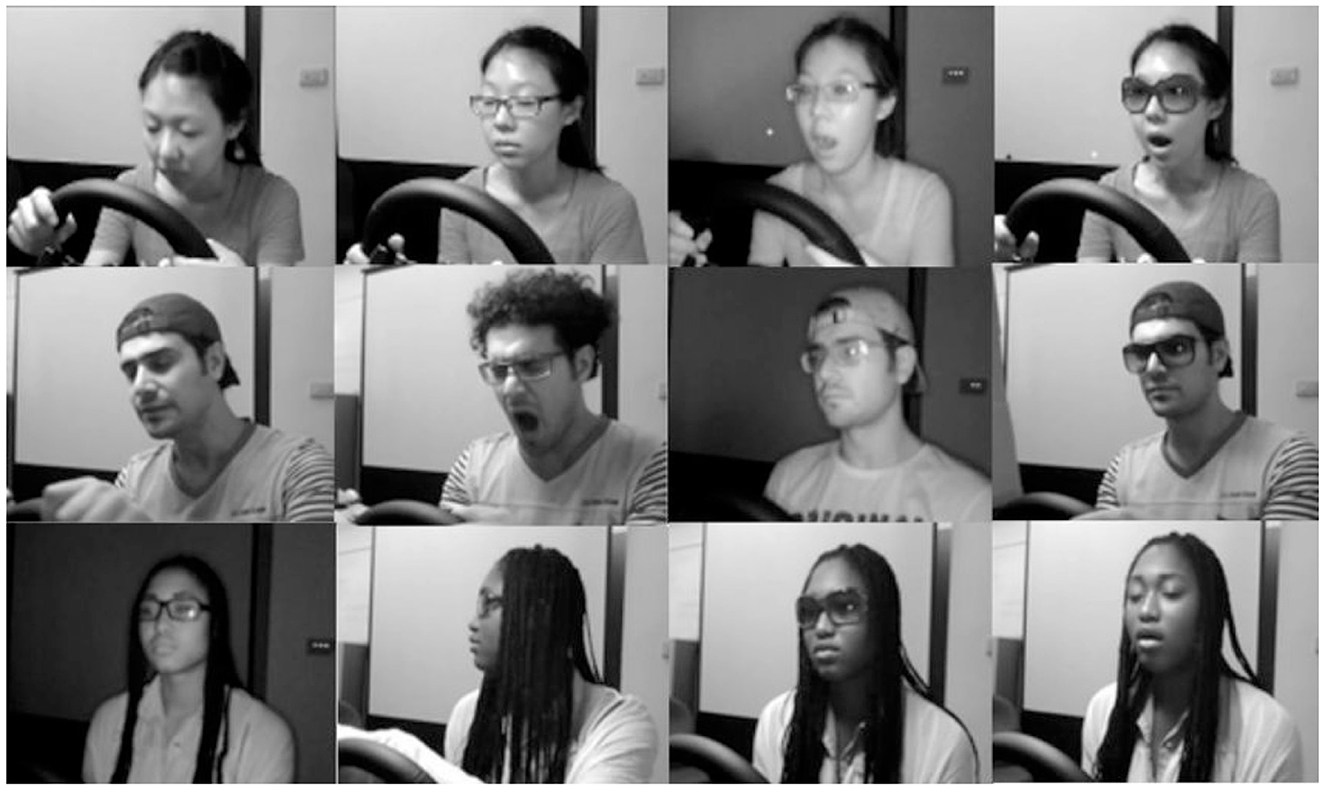
Figure 8. Sample frames of the public NTHU-DDD dataset videos (Weng et al., 2016).
For the purpose of assessing the proposed detection framework, we divide the complete NTHU dataset in our experiments into two separate subsets, i.e., test set and training set. There are 20 video stream samples from four participants in the test set and 356 video sequences from 18 subjects in the training set. The training set is further divided into streams from four participants (used for validation) and the other 14 subjects (used for training). To statistically guarantee the consistency between training and test data, all chosen test clips are re-sampled to 15 frames per second. The evaluation process of the performance of the suggested detection model is quantified using two conclusive metrics: Accuracy and F1-score (namely, the harmonic mean of both precision and recall scores) that are computed for all simulated driving scenarios. These metrics are given as follows,
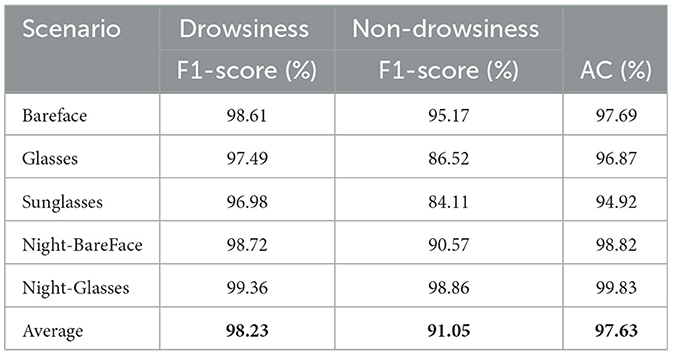
where true positive (TP) and true negative (TN) represent the number of correct drowsiness and correct non-drowsiness predictions, respectively. Likewise, false positive (FP) and false negative (FN) refer to the number of incorrect drowsy driver predictions (type-I errors) and incorrect awake driver predictions (type-II errors), respectively. Table 1 provides the accuracy and F1-score metrics of the proposed drowsy driving detection framework for all driving scenarios in the NTHU-DDD dataset.
Results in the above table reveal a series of interesting observations First, the suggested framework obtains an overall accuracy of 97.63% for drowsy driving prediction which is quite promising and competitive with that obtained by other state-of-the-art methods proposed in the literature. This is possibly the most amazing statistics that stands out from the table. Furthermore, based on these findings, it is plausible to infer that the viability and resilience of the suggested framework for real-time traffic monitoring would be considerably enhanced by a high degree of accuracy in the sleepiness detection job in addition to noticeably low processing costs.
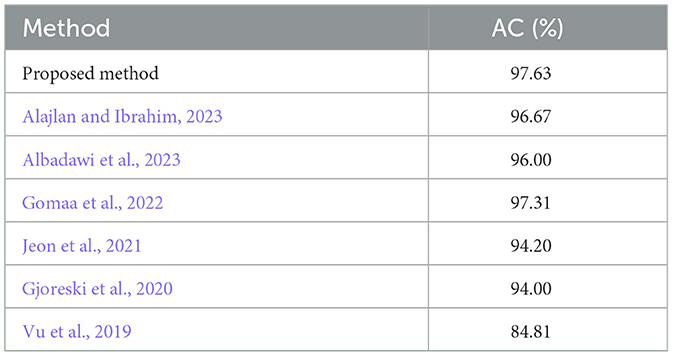
Furthermore, we offer performance comparison of the suggested detection technique against a number of cutting-edge techniques (Alajlan and Ibrahim, 2023; Albadawi et al., 2023; Gomaa et al., 2022; Jeon et al., 2021; Gjoreski et al., 2020; Vu et al., 2019) in terms of detection accuracy in order to evaluate the competitive performance of the applied methodology. A summary of this comparison is given in Table 2. It is argued, based on the comparison, that the suggested detection system is able to offer the real-time traffic monitoring guarantees, while demonstrating better performance than other cutting-edge methods. It is noteworthy to emphasize that the approaches compared (below in Table 2) were all based on essentially identical experimental settings and the same dataset. Consequently, it is most likely that the comparison is highly reliable and insightful.
We can thus draw the conclusion that, while maintaining its real-time guarantees, the proposed prediction framework has the potential to enhance the performance of driver sleepiness detection systems, as demonstrated by the given experimental findings.
Finally, it is worth to point out that all programs/procedures for implementing the proposed technique were coded and run using Microsoft Visual Studio 2019 and OpenCV version 4.5 (Open Source Computer Vision Library: http://opencv.org).
The above results illustrate that the detection system can function with high reliability and efficiency, achieving real-time performance. This can be attributed to the combination of custom C++ functions and highly efficient algorithmic implementations found in the OpenCV library. A PC with Intel (R) Core(TM) i7-8750 U CPU 2.8GHz, 8GB RAM, running Windows 10 Pro 64-bit OS was used for carrying out all experiments involving extensive training, validating and testing the prediction model.
4 Conclusions
This paper has presented an automated vision-based system for real-time driver fatigue prediction, where several visual ocular parameters, such as eyebrow shape, eye blinking, eye closure, and other precisely constructed facial are used as robust fatigue indicators. Furthermore, local Gabor facial features are extracted from a driver image using Fisher's quantum information From the extracted features, a Fisher-Gabor feature descriptor that is quite robust to changes in illumination and invariant to rotation and scaling is constructed. The Fisher-Gabor feature descriptor is then fed to an LDCRF classification model to predict whether the driver is fatigued or drowsy. When evaluated on the benchmark NTHU dataset incorporating a large and diverse collection of driver facial images, the presented system delivers promising detection results that compare favorably with those previously reported in the literature, without sacrificing computational guarantees. The proposed system offers real-time monitoring capabilities and can be integrated into various applications, such as in-vehicle driver assistance systems or workplace safety monitoring. It can thus play a crucial role in enhancing safety and reducing the risk of accidents caused by drowsy or fatigued individuals.
Data availability statement
The original contributions presented in the study are included in the article/supplementary material, further inquiries can be directed to the corresponding author.
Author contributions
SB: Conceptualization, Data curation, Formal analysis, Funding acquisition, Investigation, Methodology, Project administration, Resources, Software, Supervision, Validation, Visualization, Writing – original draft, Writing – review & editing. AA-H: Formal analysis, Writing – review & editing. AA: Visualization, Writing – review & editing.
Funding
The author(s) declare that financial support was received for the research and/or publication of this article. The authors extend their appreciation to Prince Sattam bin Abdulaziz University for funding this research work through the project number (PSAU/2014/01/29740).
Conflict of interest
The authors declare that the research was conducted in the absence of any commercial or financial relationships that could be construed as a potential conflict of interest.
Publisher's note
All claims expressed in this article are solely those of the authors and do not necessarily represent those of their affiliated organizations, or those of the publisher, the editors and the reviewers. Any product that may be evaluated in this article, or claim that may be made by its manufacturer, is not guaranteed or endorsed by the publisher.
References
Abd El-Mageed, A. A., Al-Hamadi, A., Bakheet, S., and Abd El-Rahiem, A. H. (2024). Hybrid sparrow search-exponential distribution optimization with differential evolution for parameter prediction of solar photovoltaic models. Algorithms 17:26. doi: 10.3390/a17010026
Abdelwahab, H., and Abdel-Aty, M. (2002). Artificial neural networks and logit models for traffic safety analysis of toll plazas. Transp. Res. Rec. 2270:1784. doi: 10.3141/1784-15
Alajlan, N., and Ibrahim, D. M. (2023). DDD tinyml: a tinyml-based driver drowsiness detection model using deep learning. Sensors 23:5696. doi: 10.3390/s23125696
Albadawi, Y., Redhaei, A. A., and Takruri, M. (2023). Real-time machine learning-based driver drowsiness detection using visual features. J. Imag. 9:91. doi: 10.3390/jimaging9050091
Bakheet, S., and Al-Hamadi, A. (2017). Hand gesture recognition using optimized local Gabor features. J. Comput. Theor. Nanosci. 14, 1–10. doi: 10.1166/jctn.2017.6460
Bakheet, S., and Al-Hamadi, A. (2020a). Chord-length shape features for license plate character recognition. J. Russian Laser Res. 41, 156–170. doi: 10.1007/s10946-020-09861-1
Bakheet, S., and Al-Hamadi, A. (2020b). Computer-aided diagnosis of malignant melanoma using Gabor-based entropic features and multilevel neural networks. Diagnostics 10, 822–837. doi: 10.3390/diagnostics10100822
Bakheet, S., and Al-Hamadi, A. (2021). A framework for instantaneous driver drowsiness detection based on improved HOG features and naïve Bayesian classification. Brain Sci. 11, 240–254. doi: 10.3390/brainsci11020240
Beles, H., Vesselenyi, T., Rus, A., Mitran, T., Scurt, F., and Tolea, B. (2024). Driver drowsiness multi-method detection for vehicles with autonomous driving functions. Sensors 24:1541. doi: 10.3390/s24051541
Blommer, M., Curry, R., Kozak, K., Greenberg, J., and Artz, B. (2006). “Implementation of controlled lane departures and analysis of simulator sickness for a drowsy driver study,”? in Proceedings of the 2006 Driving Simulation Conference Europe (Paris).
Bouchner, P., Pieknk, R., Novotny, S., Pěkny, J., Hajny, M., and Borzova, C. (2006). “Fatigue of car drivers-detection and classification based on the experiments on car simulators,” in Proceedings of the 6th WSEAS International Conference on Simulation, Modelling and Optimization (Lisbon), 727–732.
Çivik, E., and Yüzgeç, U. (2023). Real-time driver fatigue detection system with deep learning on a low-cost embedded system. Microprocess. Microsyst. 99:104851. doi: 10.1016/j.micpro.2023.104851
Deufemia, V., Risi, M., and Tortora, G. (2014). Sketched symbol recognition using latent-dynamic conditional random fields and distance-based clustering. Pattern Recognit. 47, 1159–1171. doi: 10.1016/j.patcog.2013.09.016
Gjoreski, M., Gams, M., Lutrek, M., Genc, P., Garbas, J.-U., and Hassan, T. (2020). Machine learning and end-to-end deep learning for monitoring driver distractions from physiological and visual signals. IEEE Access 8, 70590–70603. doi: 10.1109/ACCESS.2020.2986810
Gomaa, M., Mahmoud, R. O., and Sarhan, A. M. (2022). A CNN-LSTM-based deep learning approach for driver drowsiness prediction. J. Eng. Res. 6:7. doi: 10.21608/erjeng.2022.141514.1067
Grigorescu, S., Petkov, N., and Kruizinga, P. (2002). Comparison of texture features based on gabor filters. IEEE Trans. Image Proc. 11, 1160–1167. doi: 10.1109/TIP.2002.804262
Harada, T., Iwasaki, H., Mori, K., Yoshizawa, A., and Mizoguchi, F. (2013). “Evaluation model of cognitive distraction state based on eyetracking data using neural networks,” in Proceedings of the 12th IEEE International Conference on Cognitive Informatics and Cognitive Computing (New York, NY: IEEE), 428–434. doi: 10.1109/ICCI-CC.2013.6622278
Hegde, C., Dash, S., and Agarwal, P. (2020). “Vehicle trajectory prediction using GAN,” in 2020 Fourth International Conference on I-SMAC (IoT in Social, Mobile, Analytics and Cloud) (I-SMAC), 502–507. doi: 10.1109/I-SMAC49090.2020.9243464
Hendricks, D., Freedman, M., Zador, P., and Fell, J. (2001). The relative frequency of unsafe driving acts in serious traffic crashes. Tech. rep. dot hs 809 206, National Highway Traffic Safety Administration, Washington, DC.
Huynh, X., Park, S., and Kim, Y. (2017). “Detection of driver drowsiness using 3d deep neural network and semi-supervised gradient boosting machine,” in Computer vision–ACCV 2016 workshops, Part III (Springer), 134–145. doi: 10.1007/978-3-319-54526-4_10
Jabbar, R., Al-Khalifa, K. N., Kharbeche, M., Alhajyaseen, W. K. M., Jafari, M. A., and Jiang, S. (2018). Real-time driver drowsiness detection for android application using deep neural networks techniques. ArXiv, abs/1811.01627.
Jeon, Y., Kim, B., and Baek, Y. (2021). Ensemble cnn to detect drowsy driving with in-vehicle sensor data. Sensors 21:2372. doi: 10.3390/s21072372
Khushaba, R. N., Kodagoda, S., Lal, S., and Dissanayake, G. (2011). Driver drowsiness classification using fuzzy wavelet-packet-based featureextraction algorithm. IEEE Trans. Biomed. Eng. 58, 121–131. doi: 10.1109/TBME.2010.2077291
King, L., Nguyen, H., and Lal, S. (2006). “Early driver fatigue detection from electroencephalography signals using artificial neural networks,” in International IEEE Conference of the Engineering in Medicine and Biology Society (New York, NY: IEEE), 2187–2190. doi: 10.1109/IEMBS.2006.259231
Klauer, S. G., Dingus, T. A., Neale, V. L., Sudweeks, J. D., and Ramsey, D. J. (2006). The impact of driver inattention on near-crash/crash risk: an analysis using the 100-car naturalistic driving study data. Tech. rep. dot hs 810 594, Virginia Tech Transportation Institute, Blacksburg, VA. doi: 10.1037/e729262011-001
Lades, M., Vorbruggen, J. C., Buhmann, J., Lange, J., von der Malsburg, C., Wurtz, R. P., et al. (1993). Distortion invariant object recognition in the dynamic link architecture. IEEE Trans. Comput. 42, 300–311. doi: 10.1109/12.210173
Lafferty, J., McCallum, A., and Pereira, F. (2001). “Conditional random fields: Probabilistic models for segmenting and labeling sequence data,” in Proceedings of the Eighteenth International Conference on Machine Learning, 282–289.
Lawoyin, S. (2014). Novel technologies for the detection and mitigation of drowsy driving. Ph.d. thesis, Virginia Commonwealth University, Richmond, VA.
Lenskiy, A., and Lee, J. (2012). Driver's eye blinking detection using novel color and texture segmentation algorithms. Int. J. Control. Autom. Syst. 10, 317–327. doi: 10.1007/s12555-012-0212-0
Malik, J., and Perona, P. (1990). Scale-space and edge detection using anisotropic diffusion. IEEE Trans. Pattern Anal. Mach. Intell. 12, 629–639. doi: 10.1109/34.56205
Morency, L. P., Quattoni, A., and Darrell, T. (2007). “Latent-dynamic discriminative models for continuous gesture recognition,” in CVPR '07. doi: 10.1109/CVPR.2007.383299
Moujahid, A., Dornaika, F., Arganda-Carreras, I., and Reta, J. (2021). Efficient and compact face descriptor for driver drowsiness detection. Expert Syst. Appl. 168:114334. doi: 10.1016/j.eswa.2020.114334
Park, S., Pan, F., Kang, S., and Yoo, C. (2017). “Driver drowsiness detection system based on feature representation learning using various deep networks,” in Computer vision–ACCV 2016 workshops Part III, eds. C. S. Chen, J. Lu, K. K. Ma (Taipei: Springer), 154–164. doi: 10.1007/978-3-319-54526-4_12
Pauly, L., and Sankar, D. (2015). “Detection of drowsiness based on HOG features and SVM classifiers,” in 2015 IEEE International Conference on Research in Computational Intelligence and Communication Networks (ICRCICN), 181–186. doi: 10.1109/ICRCICN.2015.7434232
Ramzan, M., Khan, H. U., Awan, S. M., Ismail, A., Ilyas, M., and Mahmood, A. (2019). A survey on state-of-the-art drowsiness detection techniques. IEEE Access 7, 61904–61919. doi: 10.1109/ACCESS.2019.2914373
Rep (2017). Fatality analysis reporting system. National Highway Traffic Safety Administration (NHTSA). Available online at: https://www.nhtsa.gov/research-data
Sayed, R., and Eskandarian, A. (2001). Unobtrusive drowsiness detection by neural network learning of driver steering. Proc. Inst. Mech. Eng. 215, 969–975. doi: 10.1243/0954407011528536
Singh, A., Chandewar, C., and Pattarkine, P. (2018). Driver drowsiness alert system with effective feature extraction. Int. J. Res. Emerg. Sci. Technol. 5, 26–31. Available online at: https://ijrest.net/index.php/ijrest/article/view/34/19
Stevenson, M. R., Elkington, J., Sharwood, L., Meuleners, L., Ivers, R., Boufous, S., et al. (2014). The role of sleepiness, sleep disorders, and the work environment on heavy-vehicle crashes in 2 Australian states. T. Am. J. Epidemiol. 179, 594–601. doi: 10.1093/aje/kwt305
Tsuchida, A., Bhuiyan, M., and Oguri, K. (2010). “Estimation of drivers' drowsiness level using a neural network based ‘error correcting output coding' method,” in 13th International IEEE Conference on Intelligent Transportation Systems (Funchal), 1887–1892. doi: 10.1109/ITSC.2010.5624964
Viola, P., and Jones, M. (2001). “Rapid object detection using a boosted cascade of simple feature,” in Proceedings of the 2001 IEEE Computer Society Conference on CVPR, 11–518.
Vu, T. H., Dang, A., and Wang, J.-C. (2019). A deep neural network for real-time driver drowsiness detection. IEICE Trans. Inf. Syst. 102, 2637–2641. doi: 10.1587/transinf.2019EDL8079
Weng, C.-H., Lai, Y.-H., and Lai, S.-H. (2016). “Driver drowsiness detection via a hierarchical temporal deep belief network,” in Asian Conference on Computer Vision Workshop on Driver Drowsiness Detection from Video (Taipei, Taiwan). doi: 10.1007/978-3-319-54526-4_9
Wijnands, J., Thompson, J., Aschwanden, G., and Stevenson, M. (2018). Identifying behavioural change among drivers using long short-term memory recurrent neural networks. Transp. Res. Part F. 53, 34–49. doi: 10.1016/j.trf.2017.12.006
Williamson, A., Friswell, R., Olivier, J., and Grzebieta, R. (2014). Are drivers aware of sleepiness and increasing crash risk while driving? Accid. Anal. Prev. 70, 225–234. doi: 10.1016/j.aap.2014.04.007
Keywords: drowsy driving prediction, fisher-Gabor facial features, LDCRF classification, NTHU-DDD dataset, intelligent transportation systems
Citation: Bakheet S, Al-Hamadi A and Alanazi A (2025) An effective approach for real-time drowsy driving prediction using quantized fisher-Gabor features and latent-dynamic conditional random fields. Front. Comput. Sci. 7:1437084. doi: 10.3389/fcomp.2025.1437084
Received: 23 May 2024; Accepted: 18 March 2025;
Published: 01 May 2025.
Edited by:
Bülent Bolat, Yíldíz Technical University, TürkiyeReviewed by:
Muhammad Aamir, Huanggang Normal University, ChinaJims Marchang, Sheffield Hallam University, United Kingdom
Paolo Mercorelli, Leuphana University Lüneburg, Germany
Amir Shafie, International Islamic University Malaysia, Malaysia
Copyright © 2025 Bakheet, Al-Hamadi and Alanazi. This is an open-access article distributed under the terms of the Creative Commons Attribution License (CC BY). The use, distribution or reproduction in other forums is permitted, provided the original author(s) and the copyright owner(s) are credited and that the original publication in this journal is cited, in accordance with accepted academic practice. No use, distribution or reproduction is permitted which does not comply with these terms.
*Correspondence: Samy Bakheet, cy5iYWtoZWV0QHBzYXUuZWR1LnNh
 Samy Bakheet
 Ayoub Al-Hamadi2