 Ashish Saini1
 Khushwant Singh
 Fernando Moreira
- 1Department of Computer Science & Applications, Maharshi Dayanand University, Rohtak, India
- 2University Institute of Engineering & Technology, Maharshi Dayanand University, Rohtak, India
- 3REMIT, IJP, Universidade Portucalense, Porto, Portugal
In an era of rapidly growing multimedia data, the need for robust and efficient classification systems has become critical, specifically the identification of class names and poses or styles. This study provides an understanding of the organization of data, and feature selection (i.e., edge) using the k-means segmentation technique is explained. Furthermore, for the optimization of features, the linear regression technique is used. The optimized features can be directly used with classifiers, but to reduce the noise, outliers are identified and removed from the training data. The classifiers are involved in training and recognizing the face or text class label. After the prediction of class labels, the distance matrix-based technique is used to identify the style or pose name. Finally, the experiments are conducted with the help of the ORL dataset (40 classes and 10 poses in each class) and character dataset (36 characters and 10 font styles in each character). The experimental results indicated that the proposed methodology accurately classifies hierarchically organized data and demonstrates superiority over KNN and Bayesian-based classification when compared to support vector machine (SVM). The system provides classification outcomes with up to 100% accuracy for outlier-removed data, and up to 98% for basic features. Unlike traditional flat classification approaches, our system leverages hierarchical structures to enhance classification accuracy, scalability, and interpretability.
1 Introduction
Classification is an essential tool in data mining. The classification algorithms are applied in a few applications, where similar patterns need to be recognized (Buczak and Guven, 2015). Classification techniques are typically supervised, which means that predefined samples are used to train the classifiers. After training, the algorithms can recognize the patterns based on the data they were trained on (Sathya and Abraham, 2013). The complexity and nature of data decide the selection of classification algorithms (Gómez et al., 2016). The classification problem concept (Huang et al., 2017) is used for classifying the human face and image characters with pose and style, respectively. In the literature, there are several issues similar to field classification problems. For example:
1. Behavioral biometric authentication: A single subject can have diverse patterns of device usage; these distinct usage patterns are essential to distinguish the legitimate owner of the device (De Cnudde et al., 2020).
2. Face recognition: It is classically used for authentication and access control; in this context, a subject can be defined using manifold poses (Dhanalakshmi and Srinivasan, 2013).
3. Character recognition: In a vehicle number plate recognition system, character recognition is required for interpreting different types of font styles.
Therefore, data mining-based applications have become popular and complex day by day. In this study, a technique is proposed to compute the features from the image dataset. Additionally, the features are optimized to improve classification performance in terms of accuracy. Thus, the objective of experiments and system design is to classify face and text character-based images in order to recognize both the face (Al-Dabbas et al., 2024) and the text class, as well as to identify the pose and font style. In this context, two techniques are proposed to implement on two different datasets. Moreover, it recognizes both the classes and styles. To experimentally justify the work, the following objectives are established:
1. To find the effect of outliers on classification performance.
2. To find different applications that can use the proposed technique to accurately classify data.
3. To contribute a generalized method for image-based data classification in order to recognize classes and sub-classes.
This section offers an overview of the proposed hierarchical classification technique and its applicability in real-world applications. Additionally, it provides the objectives of the present study. In the next section, a detailed discussion of the available literature is provided. Furthermore, in the third section, the proposed model is designed. Finally, the proposed work is justified using different experiments and a comparative study.
2 Motivation
In the field of computer vision and natural language processing, accurate text and face of pose recognition is essential for a wide variety of applications, including security systems, analysis of multimedia content, and human-computer interaction, to name just a few. In text and face pose recognition, traditional methods frequently encounter issues with scalability, noise resilience, and the ability to handle high-dimensional data. Using the advantages of hybrid hierarchical clustering and linear regression, which can overcome these challenges, we present a new method that improves face and text as well as pose recognition. This method eliminates the difficulties that have been mentioned. By applying hierarchical clustering strategies, we intend to organize the feature space more effectively into meaningful clusters. Thus, the recognition task will become less difficult, and the system will become more scalable.
When linear regression models are incorporated, both recognition accuracy and interpretability are further improved. The reason is that linear regression models capture the linear relationships that exist between features and labels. This hybrid approach uses clustering and regression techniques, which are complementary to one another, to overcome the limitations of each method and achieve superior results in tasks involving text and face as well as pose recognition. Due to the urgent need, we aim to develop this solution that is both scalable and reliable and capable of processing a large amount of complex face and text data efficiently. Our objective is to enhance recognition systems and facilitate the development of new applications in various fields, including human-computer interaction, multimedia analysis, and security. This objective will be accomplished through the integration of hierarchical clustering and linear regression.
3 Background
Classification is a fundamental task in machine learning, aiming to assign data samples to predefined categories based on their features. It plays a crucial role in numerous applications, such as biometric identification, image recognition, natural language processing, and medical diagnosis. Traditional classification techniques, such as Support Vector Machines (SVM), Decision Trees, and Naïve Bayes classifiers, have been widely used for both binary and multi-class problems (Opanasenko et al., 2024). Recent advancements in deep learning have enabled convolutional neural networks (CNNs) and recurrent neural networks (RNNs) to autonomously learn intricate feature representations from high-dimensional data.
Multi-class classification, where a sample must be assigned to one of more than two classes, introduces additional challenges such as increased computational complexity and reduced accuracy due to different angles of class and overlapping features. Hierarchical classification has emerged as a promising strategy for addressing these issues. In hierarchical classification (Zangari et al., 2024), classes are organized in a tree or directed acyclic graph structure, allowing the model to make decisions at multiple levels of abstraction. This method can reduce misclassification by narrowing down predictions through intermediate nodes and is particularly effective for large-scale datasets with numerous categories.
This research builds upon these foundations to propose a novel hierarchical multi-class classification system capable of handling both face and text datasets. The system aims to improve performance, scalability, and robustness in complex classification tasks by utilizing the advantages of modal-specific feature extraction and hierarchical learning.
4 Literature survey
The field classification problem is described in Gupta and Devanand (2013) as Field Support Vector Machines, where the set of samples describes the pattern classes and styles. Here, face classes and pose, as well as image characters, font, and styles, are recognized. To learn the basics of field classification (Yang et al., 2024), we studied where the style context with second-order statistics is explained. Further, to deal with such complexities, we need to find suitable features from images. Thus, we studied (Gao and Leung, 2002) where the edge feature is used to recognize the faces. To find effective edge features from object-based images (Zaitoun and Aqel, 2015; Hassaballah et al., 2016) are helpful guidelines. During this investigation, various edge detection techniques were found (Hassaballah et al., 2016; Ng et al., 2006; Pham and Lee, 2015). Among them, k-means clustering is a popular segmentation technique that can be used to recover object edges.
Conversely, some research articles (Mohan et al., 2016; Atmaja et al., 2016a,b) were found that recommend transforming segmented images into binary information for more fruitful consequences. The considered dataset for the face recognition application contains a total of 400 images, with 40 classes and 10 different pose images. Thus, a significant amount of data needs to be learned by the classifier. Therefore, to reduce the dimensions of learning data, first, we considered the dimensionality reduction technique discussed in Voukelatou et al. (2021); and Zhao and Du (2016). Additionally Haghighat et al. (2016); Sankaranarayanan et al. (2016), and Lai et al. (2015) are considered for face-specific data processing. Furthermore, we used some techniques that favor the data normalization process for optimizing image features. Thus, the following studies are considered for examination: 3D−2D face recognition with pose and illumination normalization (Kakadiaris et al., 2017); Beyond trace ratio: weighted harmonic mean of trace ratios for multiclass discriminant analysis (Li et al., 2017); high-fidelity pose and expression (Hebri et al., 2024); normalization for face recognition in the wild (Zhu et al., 2015); reconstruction-based disentanglement for pose-invariant face recognition (Peng et al., 2017); multi-task pose-invariant face recognition (Ding et al., 2015).
Using these techniques, we get the idea of feature reconstruction. Thus, the feature normalization process is used to compare and reconstruct the obtained features. To normalize all the features, we considered two articles (Ciocca et al., 2015; Li et al., 2015). In the first article, LBP-based texture features with logistic regression is used, and in the second article (Li et al., 2015), the regression on deep features for the classification problem was used. Thus, we get the idea of linear regression to reconstruct image features. Finally, the features of outlier detection techniques (Guo et al., 2008; Bakar et al., 2006) were studied. Combining all the collected methods and techniques, we proposed a new data model for handling hierarchical classification issues.
Survey conclusion: the aim of the survey conducted is to observe the development and strategies of pose-invariant face recognition techniques. In this context, we selected 30 research articles randomly between the years 2015 and 2023. During this survey, we found the following techniques that are adopted for deploying effective pose-based learning models, as illustrated in Figure 1:
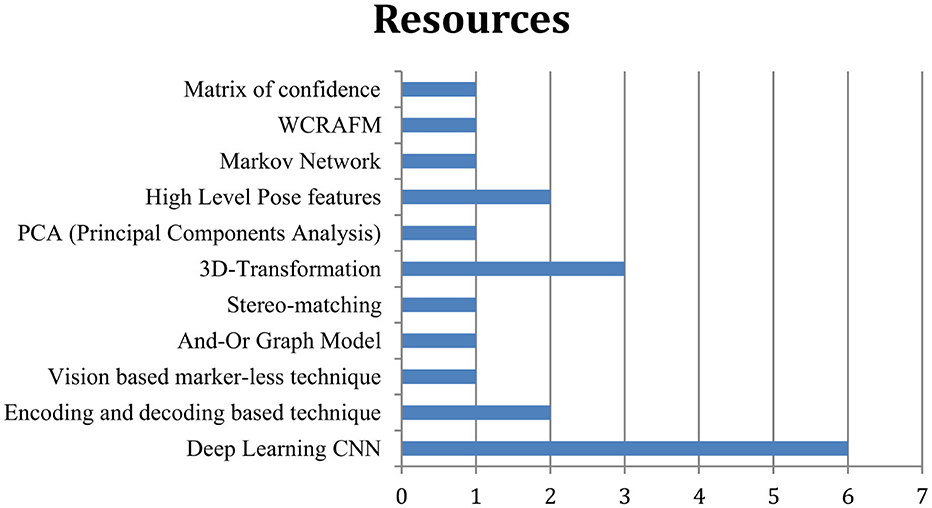
Figure 1. According to the availability of resources and the content distribution, their graphical representation is given.
1. Deep learning CNN
2. Encoding and decoding-based technique
3. Vision-based marker-less technique
4. And-Or graph model
5. Stereo-matching
6. 3D-transformation
7. PCA (Principal Components Analysis)
8. High-level pose features
9. Markov network
10. WCRAFM
11. Matrix of confidence
5 Proposed work
This section describes the proposed hierarchical classification system for complexities like field classification problems.
5.1 Face and text class label recognition
The proposed work focused on classifying complex datasets, such as a face recognition application with multiple people and multiple poses. A structured dataset, namely the ORL dataset (Kougka et al., 2018), is used for face recognition. Similarly, a syntactic dataset is used for character recognition. Thus, different fonts and style characters, including numbers (0–9) and letters (A–Z) have been used in image form. Using this organization of the dataset, we must learn about the class name and the pose name. For example, in face recognition, if we have an image of 40 people, then everyone is a class label or name. Additionally, the pose is a subclass. Thus, the aim is to design a hierarchical classification technique for the dataset described above. Figure 2 shows the hierarchical dataset of the organization.
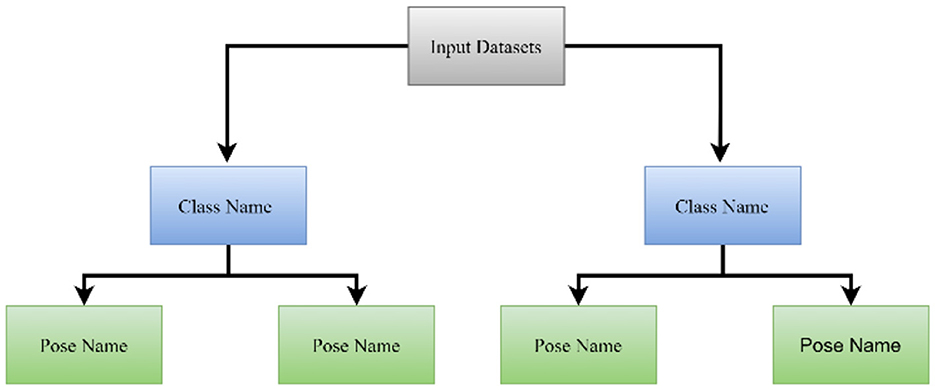
Figure 2. Hierarchical clustering of a dataset.
Referring to Equations 1, 2, to understand how the proposed system works, let us consider a dataset such that:
Thus, dataset D contains a set of classes (i.e., persons) with n elements.
Where C is the class labels, and according to the dataset description, each class contains a subset of D to ensure that each C consists of a set of samples.
The content of Equations 1, 2 are joined in Equation 3, where m is the number of samples in the ith class. Thus, the dataset D can be defined as:
The dataset is first produced for the system for learning, and each instance of data is grouped according to its primary label. Here, the primary class label predicts the class name or person name, and the secondary term is used to recognize the pose or style name.
To process or classify the dataset structure, a model is prepared, which is demonstrated in Figure 3. According to Figure 2, data are first used with the k-means algorithm (Dhanachandra et al., 2015) for recovering edges. The k-means algorithm is an unsupervised learning algorithm that works with the optimization concept for creating a user-defined number of clusters based on the distance matrix (Dhanachandra et al., 2015). Here, two centroids are parameterized with the k-means algorithm for the segmentation of the image. Among them, one of the segments was selected as an edge feature. After the selection of the appropriate segment of the image, the pixels are transformed into binary format.
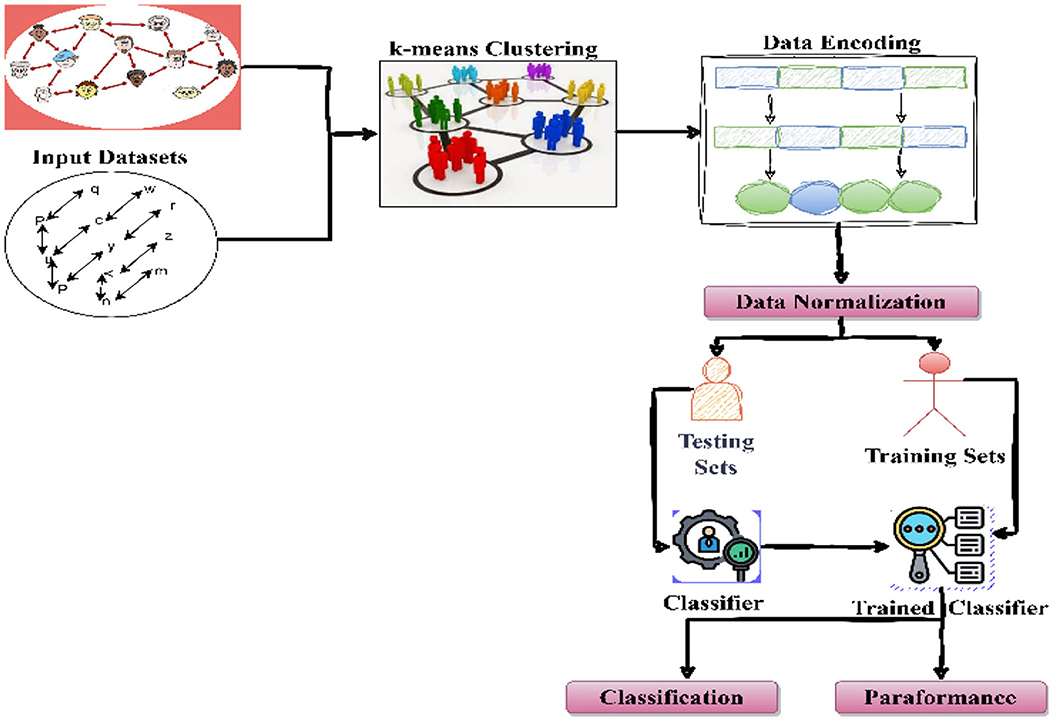
Figure 3. Schematic view of the advanced proposed system.
In the first step, the dimensions of the dataset are calculated, where n represents the number of class labels in the dataset, and m denotes the poses in each class. Thus, first, each sample pose in the dataset is converted from an RGB image to a grayscale image (Saravanan, 2010). Thus, the following function is used in Equation 4.
Where Pgray is the gray pixel value; PR, PG, and PB are the red, green, and blue pixel values.
This step can be considered as the step of data preprocessing (Kourou et al., 2015).
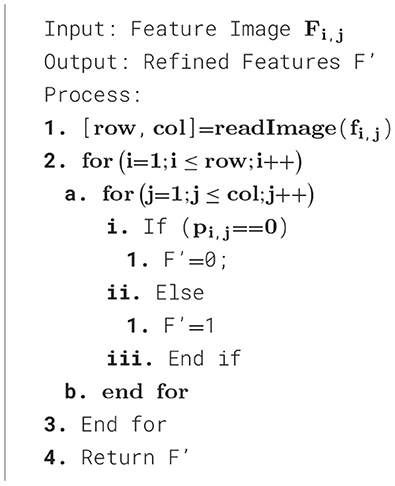
According to Algorithm 1, each sample from the dataset is extracted and then preprocessed to convert the color image to grayscale. Finally, using k-means, we recover the edges. The edge of the image is denoted as F. The feature F gained from k-means is further encoded in the form of 0–1 or binary format. Therefore, all gray-scaled pixels are transformed into 0 or 1. That process is termed here as the encoding of the image, because the grayscale image data varies between 0–255 ranges (Morris, 2016). The process of binary encoding of the image is described in Algorithm 2.
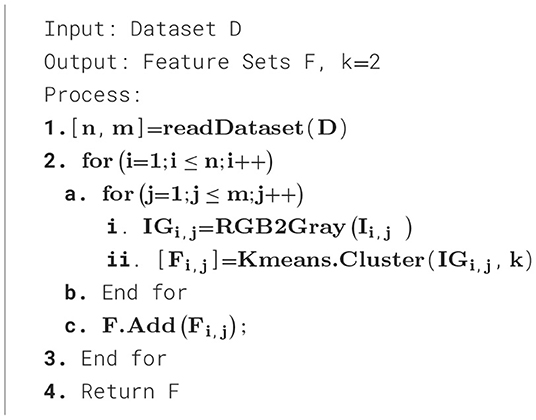
Algorithm 1. Extraction of edge feature.
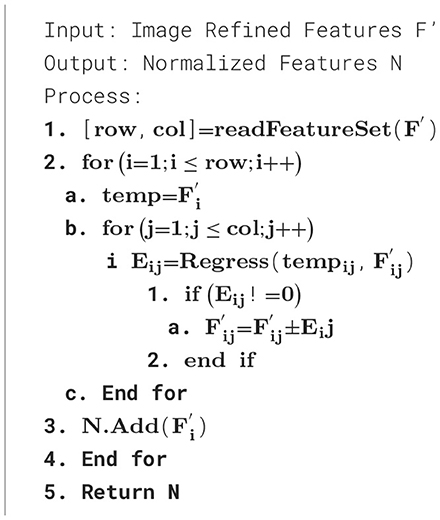
Algorithm 2. Image feature encoding.
According to the given steps in Algorithm 2, every image sample is processed individually. Each non-zero-pixel value of the images is converted to 1; otherwise, it is left as it is. After that, encoded image samples are denoted as F'.
According to the proposed solution of hierarchical classification, first, we need to recognize the class name or label. Thus, the encoded images are normalized to shape all the data instances into a common format. This process in some articles is denoted as the reconstruction of features that help the classifiers to recognize the class name by producing any pose for recognition. This reconstruction of data is termed as normalization process. In this context, linear regression is employed (Schmidt et al., 2015). Every class contains a set of images (i.e., poses), and the first image pose is selected as the reference. The remaining pose images of a class are compared with the reference image, with the help of regression analysis. In this process, the objects of images are not in a regular pattern. Thus, adjustment is made using the mean values of neighboring pixels. This process results in a new image, which is categorized as a normalized feature.
The F' is a two-dimensional vector of encoded images. Thus, each class first encodes a pose image extracted from the feature set F' shown in Equation 5:
Therefore, to normalize the feature set, we grouped the individual pose samples:
Where
Additionally, the remaining nine images of the same class (Equation 6) differ in poses are compared with the initial pose image. This comparison is based on the pixel level between two images. The linear regression is used for this task. Here, ref Equation 7 is a set of first pose images. For comparison vector F12 (Equation 8) prepared for image second to m number of samples.
According to linear regression, we need the coefficient as given in Equation 9
Now, first we calculate:
Using the coefficients β results in some error of prediction, we have n prediction errors (Venkataraman et al., 2016) shown in Equation 11.
By using the error componente (β) measured by linear regression, the adjustment on pixels was made (Katukam and Sindhoora, 2015). Thus, the corrected matrix of F12becomes
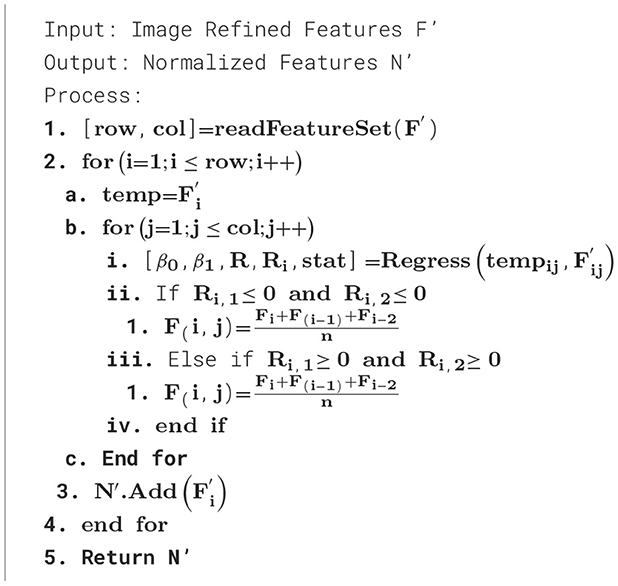
The corrected image pixels are stored in a new vector N as seen in Equation 12. This is the normalized feature that is going to be used with the classifier [i.e., support vector machine (SVM)] (Kotelnikova et al., 2016). The steps of feature set normalization are demonstrated in Algorithm 3. Each sample image is normalized with the help of the method to derive the normalized vector N using Algorithm 3 steps.
Algorithm 3. Feature normalization.
In some cases, the images may be noisy (Wu et al., 2018). To address this, it is essential to optimize the features more effectively, as well as perform outlier detection and removal on the normalized features (Patel and Mehta, 2011). Thus, for outlier removal (Zhou et al., 2017), before the classification, Algorithm 4 contains the required steps.
Algorithm 4. Outlier removal with normalization.
The outlier estimation using linear regression requires Ri. This is recognized as an interval to diagnose outliers in MATLAB, which is a numeric matrix. If the interval Ri(i, :) for an observation i does not pass through zero, it is suggesting an outlier. Now, we have two different kinds of features; the first is a normalized feature N, and the second is normalized features with outlier removal N′. After normalization, the entire normalized data are subdivided into two parts, i.e., training and testing. The set of 70% of the entire data is denoted as a training sample, and the remaining 30% are recognized as test samples. After partitioning, the training of classification algorithms is performed with 70% of the samples.
Now both the features (i.e., N and N′) are used to train multi-class support vector machine (SVM) (Thaseen and Kumar, 2017), k-nearest neighbor (KNN) (Adeniyi et al., 2016), and Bayesian classifier (Chaturvedi et al., 2018). In the proposed approach, we used multiclass-SVM in one vs. all scenarios; thus, the decision rules are as follows:
Thus
However, the dimensionality of data is large, thus
Thus, decision rules become
Where
So,
For the RBF function
Equations 13– 20 show the formulation of the support vector machine [51], which helps to classify data through two hyperplanes shown in Equations 13, 14 with RBF kernel function (Equation 20).
5.2 Face pose and text style recognition
The previous section is designed to recognize dataset objects by class name or labels. But I need to identify their pose or style also. Therefore, the existing system adopts the following steps to recognize the style of a class for the given image.
According to the process described in Algorithm 5, first, the input grayscale image is segmented using the k-means algorithm to recover edge features. The extracted features are encoded in binary format. The second input is a recognized class, and its samples are used to calculate distance. The pose, for which the distance is <25%, is recognized. Thus, the most likely class pose is predicted as the final outcome.
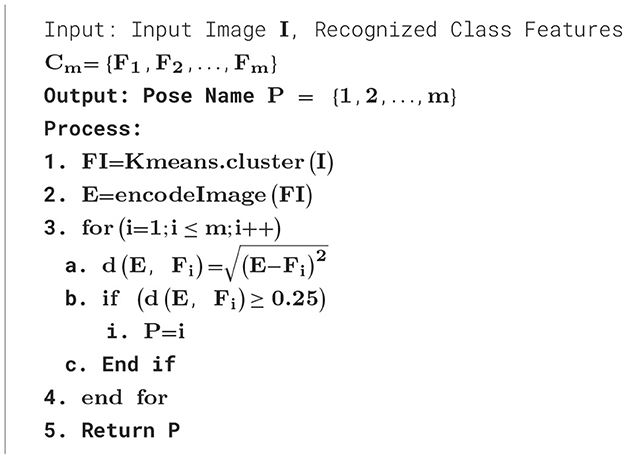
Algorithm 5. Pose recognition.
6 Result analysis
This section provides a discussion about experimental consequences. The measured performance of the classification system is reported.
6.1 Precision and accuracy
Precision is the fraction of relevant instances among the total instances produced to classify. That is computed using the following formula:
The precision demonstrates the correctness of classified outcomes. To perform experiments, two different datasets are used:
1. Face dataset: That is the ORL dataset, which contains 40 classes, and each class is defined by 10 images or poses.
2. Text dataset: This dataset is prepared by us, using text character images that contain 26 character images and 0–9 numerical characters with different font text styles.
Additionally, two scenarios of experiments are used with three classification algorithms, namely support vector machine (SVM), k-nearest neighbor (KNN) classifier, and Bayesian classifier. The scenarios are:
1. Classification of extracted features N without outlier removal.
2. Classification of features N′ with outlier removal.
The precision and accuracy of the proposed hierarchical multi-class classification system are discussed using experiments. Both terms are similar; the difference is only in representing the values. Precision is measured in a fraction between 0 and 1. Additionally, accuracy is measured in percentages. Accuracy can be calculated by the total correctly classified data and the total data produced for classification. The following equation can be used:
The measured precision of the system is shown in Figure 4, and the accuracy is given in Figure 5.
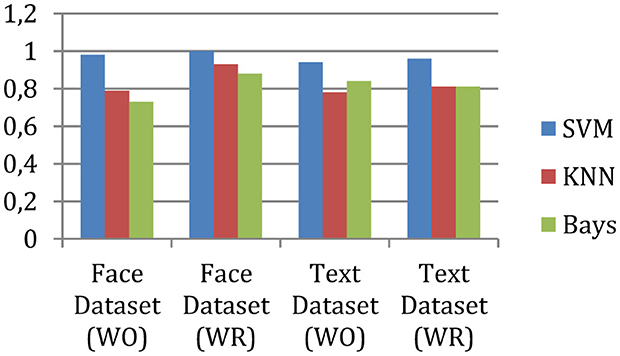
Figure 4. Precision.
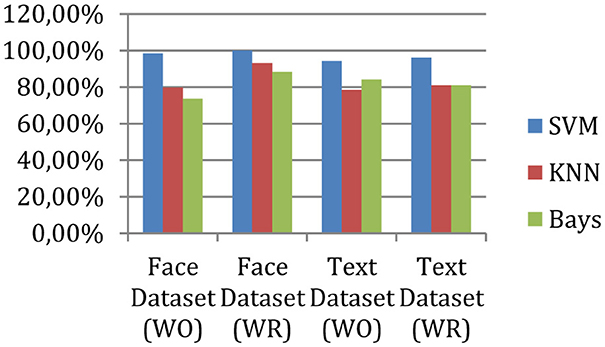
Figure 5. Accuracy.
According to experimental observations, the accuracy of the face data is 98% without outlier removal, and after outlier removal, the performance of the same application increases to 100%. On the other hand, for text classification without outlier removal, the system achieved 94% accuracy, and after outlier removal, the accuracy becomes 96%. Therefore, the outlier removal process enhances accuracy or precision.
6.2 Recall
The recall of a classification system shows improved outcomes. It is sometimes also called sensitivity, which is the fraction of the data correctly classified over the entire data produced. It is calculated as:
The measured recall of the system is shown in Figure 6.
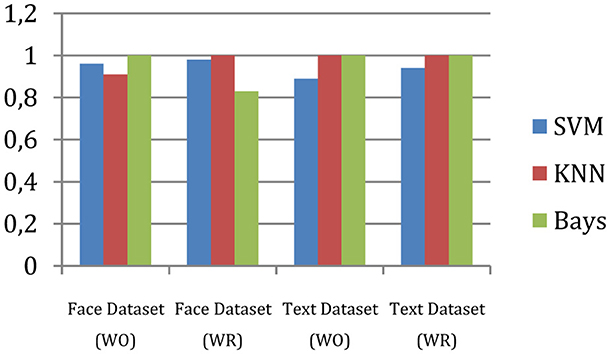
Figure 6. Recall.
The proposed hierarchical multi-class classification system's recall is enhanced using the outlier reduction process. Furthermore, with respect to the other two classifiers, i.e., KNN and Bayes, the proposed method demonstrates higher and stable outcomes.
6.3 F-measures
The F-measure shows fluctuations in the performance of a classifier. The F-measures are computed using precision and recall. To calculate F-measures, the following formula can be used. The measured measure of the system is shown in Figure 7.
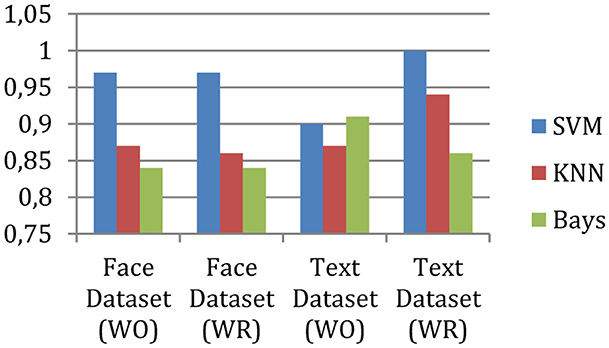
Figure 7. F-measures.
F-measures show the harmonic meaning of precision and recall. This implies that the consistency in the performance, according to results, f-measures of the proposed approach are efficient and consistent compared to the other two implemented techniques. The results demonstrate up to 100% accurate classification results for the text dataset; for the face dataset, it is 97%.
6.4 Error rate
The misclassification rate of the classifier is recognized as an error rate. It can be calculated using the following equation:
Or
The measured error rate of the system is shown in Figure 8.
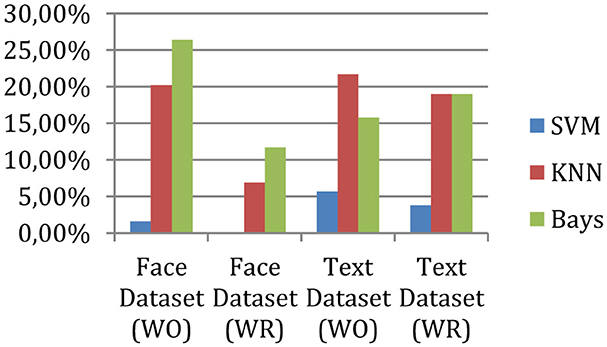
Figure 8. Error rate.
The error rate of the proposed hierarchical multi-class classification system for three classifiers is very low. According to the results, the error rate of the system implemented based on SVM is accurate. The experiment shows that the proposed technique can classify the complex nature of data with accurate consequences. But the text character technique needs more attention. In the near future, we wish to improve the character recognition process.
6.5 Statistical analysis
The results are statistically analyzed with an F-test to verify the effectiveness of SVM. The test has been carried out in two phases; the first phase confirms that there is a significant difference among schemes, and the second phase ensures that it is SVM that outperforms other schemes. (i) First phase (i.e., considering all the schemes): conducted to confirm if there is any significant difference w.r.t. accuracy and F-measures among the schemes. In this phase, the f-calculated value Fcal for accuracy and f-measures is found to be 42.6,722 and 10.2,541, respectively, while the f-critical value Fc in this case is 2.24. Therefore, it can be inferred that there is a significant difference between the schemes when accuracy and f-measure time are considered. (ii) Second phase (i.e., two schemes at a time): this phase tries to identify which scheme(s) are contributing to the difference. So, two schemes are considered at a time. Here, Fc in this case is 3.18 with α = 0.05. From the statistical results (refer to Table 1), it has been deduced that Fcal corresponding to accuracy is very small compared to Fc for the KNN and Bayes classifiers.
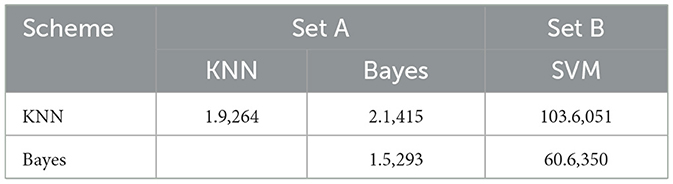
Table 1. Fcal for accuracy.
But Fcal for SVM (Table 1, Set B) w.r.t. all others are much larger. So, it is inferred that the accuracy of all schemes except SVM is almost the same, and the significant difference in the first phase is due to the presence of SVM. So, it has been concluded that SVM is performing far better than the rest in terms of accuracy, and hence, it is considered the best. We have observed similar behavior for f-measures (Table 2).
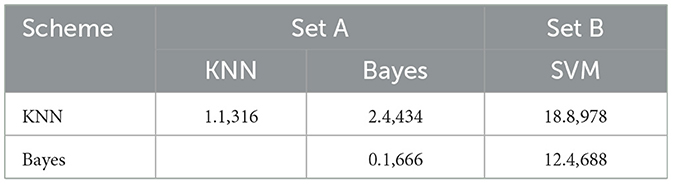
Table 2. Fcal for f-measures.
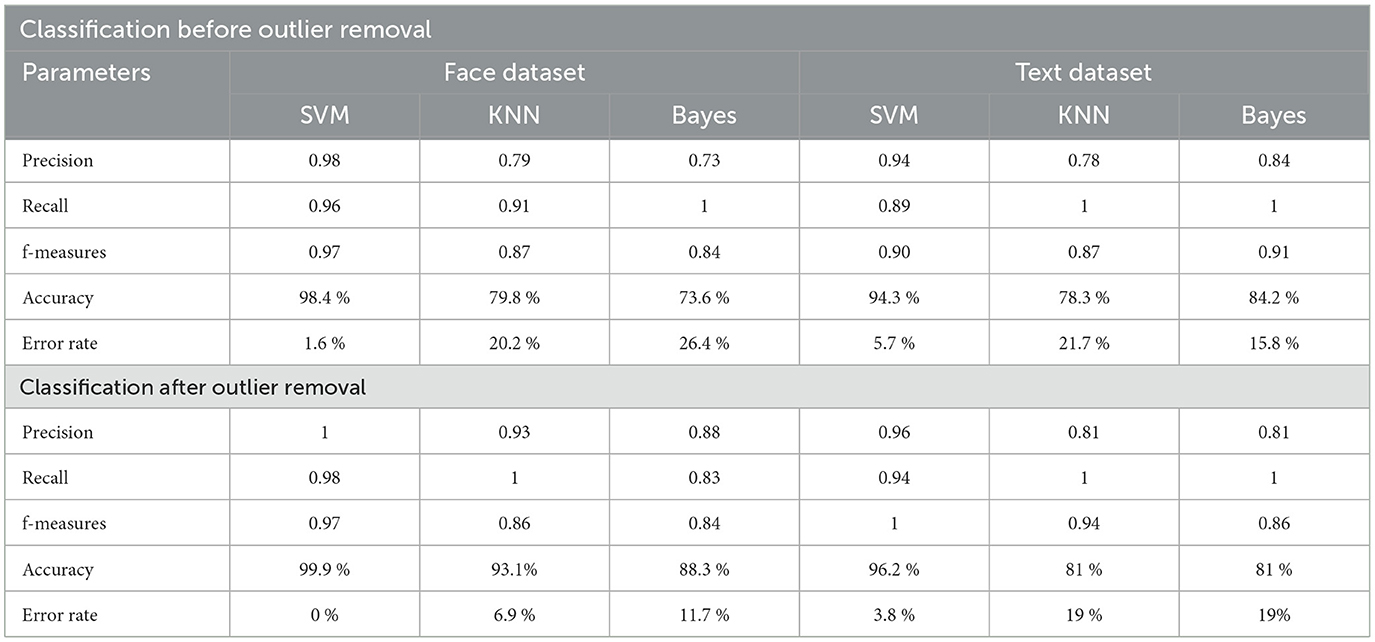
Table 3. Performance summary.
To evaluate and compare classifier performance, the Receiver Operating Characteristic (ROC) curve was used. The ROC curve plots the True Positive Rate (TPR) against the False Positive Rate (FPR), offering a visual assessment of a classifier's ability to distinguish between classes. The Area Under the Curve (AUC) provides a single-value summary, where higher values indicate better performance.
In this study, three classification algorithms—Support Vector Machine (SVM), K-Nearest Neighbors (KNN), and Naïve Bayes—were evaluated using face and text datasets. Among these, SVM demonstrated superior performance, consistently achieving the highest AUC values shown in Figure 9. Its ability to handle high-dimensional data and define optimal class-separating boundaries made it particularly effective. SVM also showed robustness to noise and outliers due to its use of kernel functions and regularization.
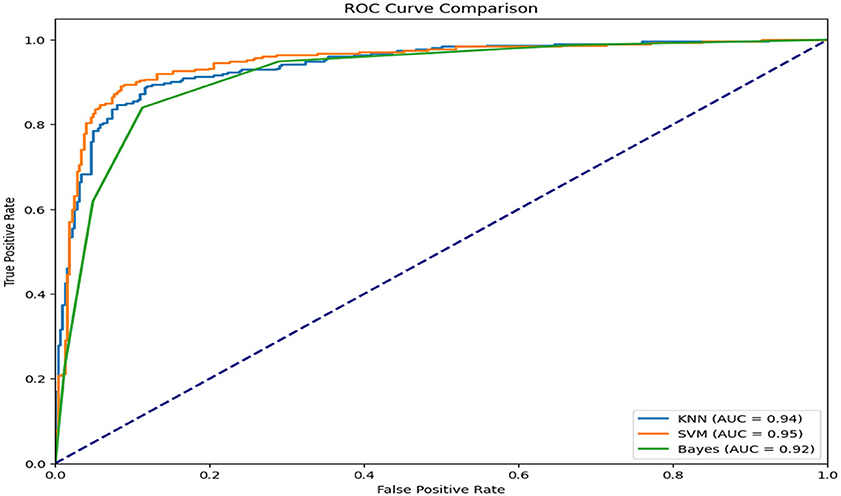
Figure 9. ROC curve comparisons.
7 Conclusion and future work
The summary of the proposed research and efforts undertaken are described in this section. Additionally, the future extension of the study is also suggested.
7.1 Conclusion
The demand for machine learning applications is increasing across different areas, including production, decision-making, and advertising. These techniques are widely used and accepted. This study focused on designing and implementing a hierarchical multiclass classification system that fits all different natures of datasets. The core work focuses on the extraction and optimization of learning features, as well as the reorganization of the class label and pose or style. The successful outcomes are as follows:
1. The system was applied to real-world benchmark datasets, such as Labeled Faces in the Wild (LFW) for face classification and 20 Newsgroups or AG News for text classification, to validate its scalability and generalizability.
2. The proposed hierarchical multi-class classification system demonstrated high accuracy for the classification of hierarchically organized data.
3. Simplification of the learning data helps in improving the algorithm's running cost and classification accuracy.
4. The proposed hierarchical multi-class classification technique is suitable for working with different datasets for the multiclass problem.
The implementation of the proposed technique is provided using MATLAB. According to the performance obtained, it is found acceptable.
7.2 Future work
The experiments demonstrate that the proposed technique is accurate and efficient. The following future extensions are proposed for the study.
1. Investigate additional feature selection and dimensionality reduction techniques to further reduce data size while preserving classification accuracy.
2. The system is implemented with the help of multi-class SVM; shortly, other classifiers are used for improvement, i.e., CNN.
3. Additional feature selection approaches can help reduce data size while achieving more accurate results.
Data availability statement
The original contributions presented in the study are included in the article/supplementary material, further inquiries can be directed to the corresponding author.
Author contributions
AS: Conceptualization, Investigation, Methodology, Writing – original draft, Writing – review & editing. NG: Conceptualization, Investigation, Methodology, Writing – original draft, Writing – review & editing. PG: Conceptualization, Investigation, Methodology, Writing – original draft, Writing – review & editing. KS: Conceptualization, Investigation, Methodology, Writing – original draft, Writing – review & editing. FM: Conceptualization, Investigation, Methodology, Writing – original draft, Writing – review & editing.
Funding
The author(s) declare that financial support was received for the research and/or publication of this article. This work was funded by national funds through FCT – Fundação para a Ciência e a Tecnologia, I.P., under the support UID/05105: REMIT – Investigação em Economia, Gestão e Tecnologias da Informação.
Conflict of interest
The authors declare that the research was conducted in the absence of any commercial or financial relationships that could be construed as a potential conflict of interest.
Generative AI statement
The author(s) declare that no Gen AI was used in the creation of this manuscript.
Publisher's note
All claims expressed in this article are solely those of the authors and do not necessarily represent those of their affiliated organizations, or those of the publisher, the editors and the reviewers. Any product that may be evaluated in this article, or claim that may be made by its manufacturer, is not guaranteed or endorsed by the publisher.
References
Adeniyi, D. A., Wei, Z., and Yongquan, Y. (2016). Automated web usage data mining and recommendation system using K-Nearest Neighbor (KNN) classification method. Appl. Comput. Inform. 12, 90–108. doi: 10.1016/j.aci.2014.10.001
Al-Dabbas, H. M., Azeez, R. A., and Ali, A. E. (2024). Two proposed models for face recognition: achieving high accuracy and speed with artificial intelligence. Eng. Technol. Appl. Sci. Res. 14, 13706–13713. doi: 10.48084/etasr.7002
Atmaja, R. D., Murti, M. A., Halomoan, J., and Suratman, F. Y. (2016a). An image processing method to convert RGB image into binary. Indones. J. Electr. Eng. Comput. Sci. 3, 377–382. doi: 10.11591/ijeecs.v3.i2.pp377-382
Atmaja, R. D., Susanto, E., Halomoan, J., and Murti, M. A. (2016b). One layer object separation algorithm in binary image. Indones. J. Electr. Eng. Comput. Sci. 1, 215–220. doi: 10.11591/ijeecs.v1.i1.pp215-220
Bakar, Z. A., Mohemad, R., Ahmad, A., and Deris, M. M. (2006). “A comparative study for outlier detection techniques in data mining,” in 2006 IEEE Conference on Cybernetics and Intelligent Systems (Bangkok, Thailand: IEEE), 1–6.
Buczak, A. L., and Guven, E. (2015). A survey of data mining and machine learning methods for cyber security intrusion detection. IEEE Commun. Surv. Tutor. 18, 1153–1176. doi: 10.1109/COMST.2015.2494502
Chaturvedi, I., Ragusa, E., Gastaldo, P., Zunino, R., and Cambria, E. (2018). Bayesian network based extreme learning machine for subjectivity detection. J. Franklin Inst. 355, 1780–1797. doi: 10.1016/j.jfranklin.2017.06.007
Ciocca, G., Cusano, C., and Schettini, R. (2015). Image orientation detection using LBP-based features and logistic regression. Multimed. Tools Appl., 74, 3013–3034. doi: 10.1007/s11042-013-1766-4
De Cnudde, S., Martens, D., Evgeniou, T., and Provost, F. (2020). A benchmarking study of classification techniques for behavioral data. Int. J. Data Sci. Anal. 9, 131–173. doi: 10.1007/s41060-019-00185-1
Dhanachandra, N., Manglem, K., and Chanu, Y. J. (2015). Image segmentation using K-means clustering algorithm and subtractive clustering algorithm. Procedia Comput. Sci. 54, 764–771. doi: 10.1016/j.procs.2015.06.090
Dhanalakshmi, A., and Srinivasan, B. (2013). Improved person identification system using face biometric detection. Int. J. Adv. Netw. Appl. 4:1731.
Ding, C., Xu, C., and Tao, D. (2015). Multi-task pose-invariant face recognition. IEEE Trans. Image Process. 24, 980–993. doi: 10.1109/TIP.2015.2390959
Gao, Y., and Leung, M. K. (2002). Face recognition using line edge map. IEEE Trans. Pattern Anal. Mach. Intell. 24, 764–779. doi: 10.1023/A:1013978711124
Gómez, C., White, J. C., and Wulder, M. A. (2016). Optical remotely sensed time series data for land cover classification: a review. ISPRS J. Photogramm. Remote Sens. 116, 55–72. doi: 10.1016/j.isprsjprs.2016.03.008
Guo, G., Fu, Y., Dyer, C. R., and Huang, T. S. (2008). Image-based human age estimation by manifold learning and locally adjusted robust regression. IEEE Trans. Image Process. 17, 1178–1188. doi: 10.1109/TIP.2008.924280
Gupta, V., and Devanand, P. (2013). A survey on data mining: tools, techniques, applications, trends and issues. Int. J. Sci. Eng. Res. 4, 1–14.
Haghighat, M., Abdel-Mottaleb, M., and Alhalabi, W. (2016). Discriminant correlation analysis: real-time feature level fusion for multimodal biometric recognition. IEEE Trans. Inf. Forensic Secur. 11, 1984–1996. doi: 10.1109/TIFS.2016.2569061
Hassaballah, M., Abdelmgeid, A. A., and Alshazly, H. A. (2016). “Image features detection, description and matching,” in Image Feature Detectors and Descriptors. Studies in Computational Intelligence, Vol. 630 (Cham: Springer), 11–45.
Hebri, D., Nuthakki, R., Digal, A. K., Venkatesan, K. G. S., Chawla, S., and Raghavendra Reddy, C. (2024). Effective facial expression recognition system using machine learning. EAI Endorsed Trans. Int. Things 10:5362. doi: 10.4108/eetiot.5362
Huang, K., Jiang, H., and Zhang, X. Y. (2017). Field support vector machines. IEEE Trans. Emerg. Topics Comput. Intell. 1, 454–463. doi: 10.1145/3109761.3158392
Kakadiaris, I. A., Toderici, G., Evangelopoulos, G., Passalis, G., Chu, D., Zhao, X., et al. (2017). 3D-2D face recognition with pose and illumination normalization. Comput. Vision Image Underst. 154, 137–151. doi: 10.1016/j.cviu.2016.04.012
Kotelnikova, Y., LeMoult, J., Mackrell, S. V., Sheikh, H. I., Singh, S. M., Joormann, J., et al. (2016). The serotonin transporter promoter variant, stress, and attentional biases in middle childhood. Pers. Individ. Dif. 101, 371–379. doi: 10.1016/j.paid.2016.06.004
Kougka, G., Gounaris, A., and Simitsis, A. (2018). The many faces of data-centric workflow optimization: a survey. Int. J. Data Sci. Anal. 6, 81–107. doi: 10.1007/s41060-018-0107-0
Kourou, K., Exarchos, T. P., Exarchos, K. P., Karamouzis, M. V., and Fotiadis, D. I. (2015). Machine learning applications in cancer prognosis and prediction. Comput. Struct. Biotechnol. J. 13, 8–17 doi: 10.1016/j.csbj.2014.11.005
Lai, Z., Wong, W. K., Xu, Y., Yang, J., and Zhang, D. (2015). Approximate orthogonal sparse embedding for dimensionality reduction. IEEE Trans. Neural Netw. Learn. Syst. 27, 723–735. doi: 10.1109/TNNLS.2015.2422994
Li, B., Shen, C., Dai, Y., Van Den Hengel, A., and He, M. (2015). “Depth and surface normal estimation from monocular images using regression on deep features and hierarchical CRFs,” in Proceedings of the IEEE Conference on Computer Vision and Pattern Recognition (Boston, MA: IEEE), 1119–1127.
Li, Z., Nie, F., Chang, X., and Yang, Y. (2017). Beyond trace ratio: weighted harmonic mean of trace ratios for multiclass discriminant analysis. IEEE Trans. Knowl. Data Eng. 29, 2100–2110. doi: 10.1109/TKDE.2017.2728531
Mohan, V. M., Kanaka Durga, R., Devathi, S., and Srujan Raju, K. (2016). “Image processing representation using binary image; grayscale, color image, and histogram,” in Proceedings of the Second International Conference on Computer and Communication Technologies: IC3T 2015, Vol. 3 (New Delhi: Springer), 353–361. doi: 10.1007/978-81-322-2526-3_37
Morris, T. (2016). Image processing with MATLAB. Supporting Material for COMP27112, 14. https://www.researchgate.net/profile/Girish-Prajapati-2/post/Does_anyone_have_MatLab_code_for_image_processing/attachment/59d6247f79197b8077982d50/AS%3A313341027782658%401451717730619/download/matlab.pdf
Ng, H. P., Ong, S. H., Foong, K. W. C., Goh, P. S., and Nowinski, W. L. (2006). “Medical image segmentation using k-means clustering and improved watershed algorithm,” in 2006 IEEE Southwest Symposium on Image Analysis and Interpretation (Denver, CO: IEEE), 61–65. doi: 10.1109/SSIAI.2006.1633722
Opanasenko, V. M., Fazilov, S. K., Radjabov, S. S., and Kakharov, S. S. (2024). Multilevel face recognition system. Cybern. Syst. Anal. 60, 146–151. doi: 10.1007/s10559-024-00655-w
Patel, V. R., and Mehta, R. G. (2011). Impact of outlier removal and normalization approach in modified k-means clustering algorithm. Int. J. Comput. Sci. Issues (IJCSI) 8:331.
Peng, X., Yu, X., Sohn, K., Metaxas, D. N., and Chandraker, M. (2017). “Reconstruction-based disentanglement for pose-invariant face recognition,” in Proceedings of the IEEE International Conference on Computer Vision (Venice, Italy: IEEE), 1623–1632.
Pham, V. H., and Lee, B. R. (2015). An image segmentation approach for fruit defect detection using k-means clustering and graph-based algorithm. Vietnam J. Comput. Sci. 2, 25–33. doi: 10.1007/s40595-014-0028-3
Sankaranarayanan, S., Alavi, A., Castillo, C. D., and Chellappa, R. (2016). “Triplet probabilistic embedding for face verification and clustering,” in 2016 IEEE 8th International Conference on Biometrics Theory, Applications and Systems (BTAS) (Niagara Falls, NY: IEEE), 1–8. doi: 10.1109/BTAS.2016.7791205
Saravanan, C. (2010). “Color image to grayscale image conversion,” in 2010 Second International Conference on Computer Engineering and Applications, Vol. 2 (Bali: IEEE), 196–199. doi: 10.1109/ICCEA.2010.192
Sathya, R., and Abraham, A. (2013). Comparison of supervised and unsupervised learning algorithms for pattern classification. Int. J. Adv. Res. Artif. Intell. 2, 34–38. doi: 10.14569/IJARAI.2013.020206
Schmidt, U., Jancsary, J., Nowozin, S., Roth, S., and Rother, C. (2015). Cascades of regression tree fields for image restoration. IEEE Trans. Pattern Anal. Mach. Intell. 38, 677–689. doi: 10.1109/TPAMI.2015.2441053
Thaseen, I. S., and Kumar, C. A. (2017). Intrusion detection model using fusion of chi-square feature selection and multi class SVM. J. King Saud Univ. Comput. Inf. Sci. 29, 462–472. doi: 10.1016/j.jksuci.2015.12.004
Venkataraman, S., Yang, Z., Franklin, M., Recht, B., and Stoica, I. (2016). “Ernest: efficient performance prediction for large-scale advanced analytics,” in 13th USENIX Symposium on Networked Systems Design and Implementation (NSDI 16) (Santa Clara, CA: USENIX Association), 363–378.
Voukelatou, V., Gabrielli, L., Miliou, I., Cresci, S., Sharma, R., Tesconi, M., and Pappalardo, L. (2021). Measuring objective and subjective well-being: dimensions and data sources. Int. J. Data Sci. Anal. 11, 279–309. doi: 10.1007/s41060-020-00224-2
Wu, X., He, R., Sun, Z., and Tan, T. (2018). A light CNN for deep face representation with noisy labels. IEEE Trans. Inf. Forensic Secur. 13, 2884–2896. doi: 10.1109/TIFS.2018.2833032
Yang, Y., Qu, J., Dong, W., Zhang, T., Xiao, S., and Li, Y. (2024). TMCFN: text-supervised multidimensional contrastive fusion network for hyperspectral and LiDAR classification. IEEE Trans. Geosci. Remote Sens. 62, 5511015–5511015. doi: 10.1109/TGRS.2024.3374372
Zaitoun, N. M., and Aqel, M. J. (2015). Survey on image segmentation techniques. Procedia Comput. Sci. 65, 797–806. doi: 10.1016/j.procs.2015.09.027
Zangari, A., Marcuzzo, M., Rizzo, M., Giudice, L., Albarelli, A., and Gasparetto, A. (2024). Hierarchical text classification and its foundations: a review of current research. Electronics 13:1199. doi: 10.3390/electronics13071199
Zhao, W., and Du, S. (2016). Spectral–spatial feature extraction for hyperspectral image classification: a dimension reduction and deep learning approach. IEEE Trans. Geosci. Remote Sens. 54, 4544–4554. doi: 10.1109/TGRS.2016.2543748
Zhou, G., Wang, Q., and Xiao, Z. (2017). Robust outlier removal using penalized linear regression in multiview geometry. Neurocomputing 267, 455–465. doi: 10.1016/j.neucom.2017.06.043
Keywords: data mining, support vector machine, Bayes classifier, k-nearest neighbor, machine learning
Citation: Saini A, Gill NS, Gulia P, Singh K and Moreira F (2025) A hierarchical multi-class classification system for face and text datasets. Front. Comput. Sci. 7:1550453. doi: 10.3389/fcomp.2025.1550453
Received: 23 December 2024; Accepted: 20 May 2025;
Published: 20 June 2025.
Edited by:
Shekoufeh Rahimi, University of Roehampton London, United KingdomReviewed by:
Ganapati Panda, C. V. Raman College of Engineering, IndiaAlireza Rouhi, Azarbaijan Shahid Madani University, Iran
Copyright © 2025 Saini, Gill, Gulia, Singh and Moreira. This is an open-access article distributed under the terms of the Creative Commons Attribution License (CC BY). The use, distribution or reproduction in other forums is permitted, provided the original author(s) and the copyright owner(s) are credited and that the original publication in this journal is cited, in accordance with accepted academic practice. No use, distribution or reproduction is permitted which does not comply with these terms.
*Correspondence: Fernando Moreira, Zm1vcmVpcmFAdXB0LnB0