- Institute for Computer Research, University of Alicante, Alicante, Spain
The integration of technology in education faces challenges like smartphone distractions. Educators' acceptance depends on perceived usefulness, ease of use, and technical support. Innovative methodologies, such as dynamic activity detection and wearable tech, improve classroom interaction and learning outcomes. However, no studies have focused on the acceptance of this software. This research examines young engineering professors' perceptions of advanced monitoring technologies for improving student attention and engagement based on their gestures, hypothesizing significant enhancements in teachers' performance according to Extended Technology Acceptance Model (TAM2). Data were collected from 10% of the young engineering faculty members (under 40 years old) at a Spanish university (107 individuals) through a structured questionnaire examining perceptions of usefulness, ease of use, and anxiety. Short training sessions proved critical for successful implementation, addressing financial, privacy, and technical challenges. Findings indicate positive acceptance, with ease of use influencing the intention to use and the image construct. Anxiety negatively impacts usage, underscoring the need to address it. Adequate technical support and continuous training are vital. The study reveals positive acceptance of real-time behavior measurement software among young engineering professors, highlighting the importance of training and addressing anxiety and institutional acceptance.
1 Introduction
The integration of advanced technologies in educational environments has become an imperative necessity to improve student attention and performance (Ahmad and Hamad, 2020). Despite the numerous technological advances, education has been one of the fields that has benefited the least methodologically (Loh et al., 2021). However, the field of engineering presents a unique scenario.
In the fields of engineering, where there is a presumed predisposition to adapt technology in the classroom, there is a noticeable delay in the effective transmission of knowledge from professors to students, similar to other subjects (Technology et al., 2020). This underutilization of technological tools adds complexity when implementing systems designed for high reproducibility, such as those employing commercial and economical wrist sensors (smartwatches), Docker-based architectures, and online monitoring systems accessible from any device (Marquez-Carpintero et al., 2023).
Building on this context, recent studies have emphasized the growing importance of wearable technologies, particularly smartwatches, not only for educational purposes but also for monitoring stress and related conditions such as anxiety among students (Abd-Alrazaq et al., 2024). These tools offer new avenues for understanding student well-being, which is increasingly relevant given the growing challenges to maintaining attention in the classroom.
Indeed, one of the most pressing issues in current educational environments is the increasing tendency of students to be less attentive and more focused on their mobile phones during class. In crowded classroom settings, this shift in behavior makes it particularly difficult for instructors to assess student engagement with precision (Höver and Mühlhäuser, 2015).
Our system addresses the activity using a low-impact approach that respects privacy. Engineering professors often lack the means to objectively measure attention, which is closely linked to the student's activity in class. It is known that mobile phone use represents less attention to class than taking notes in class, which influences a significant part of the final grade (Zaletelj and Košir, 2017).
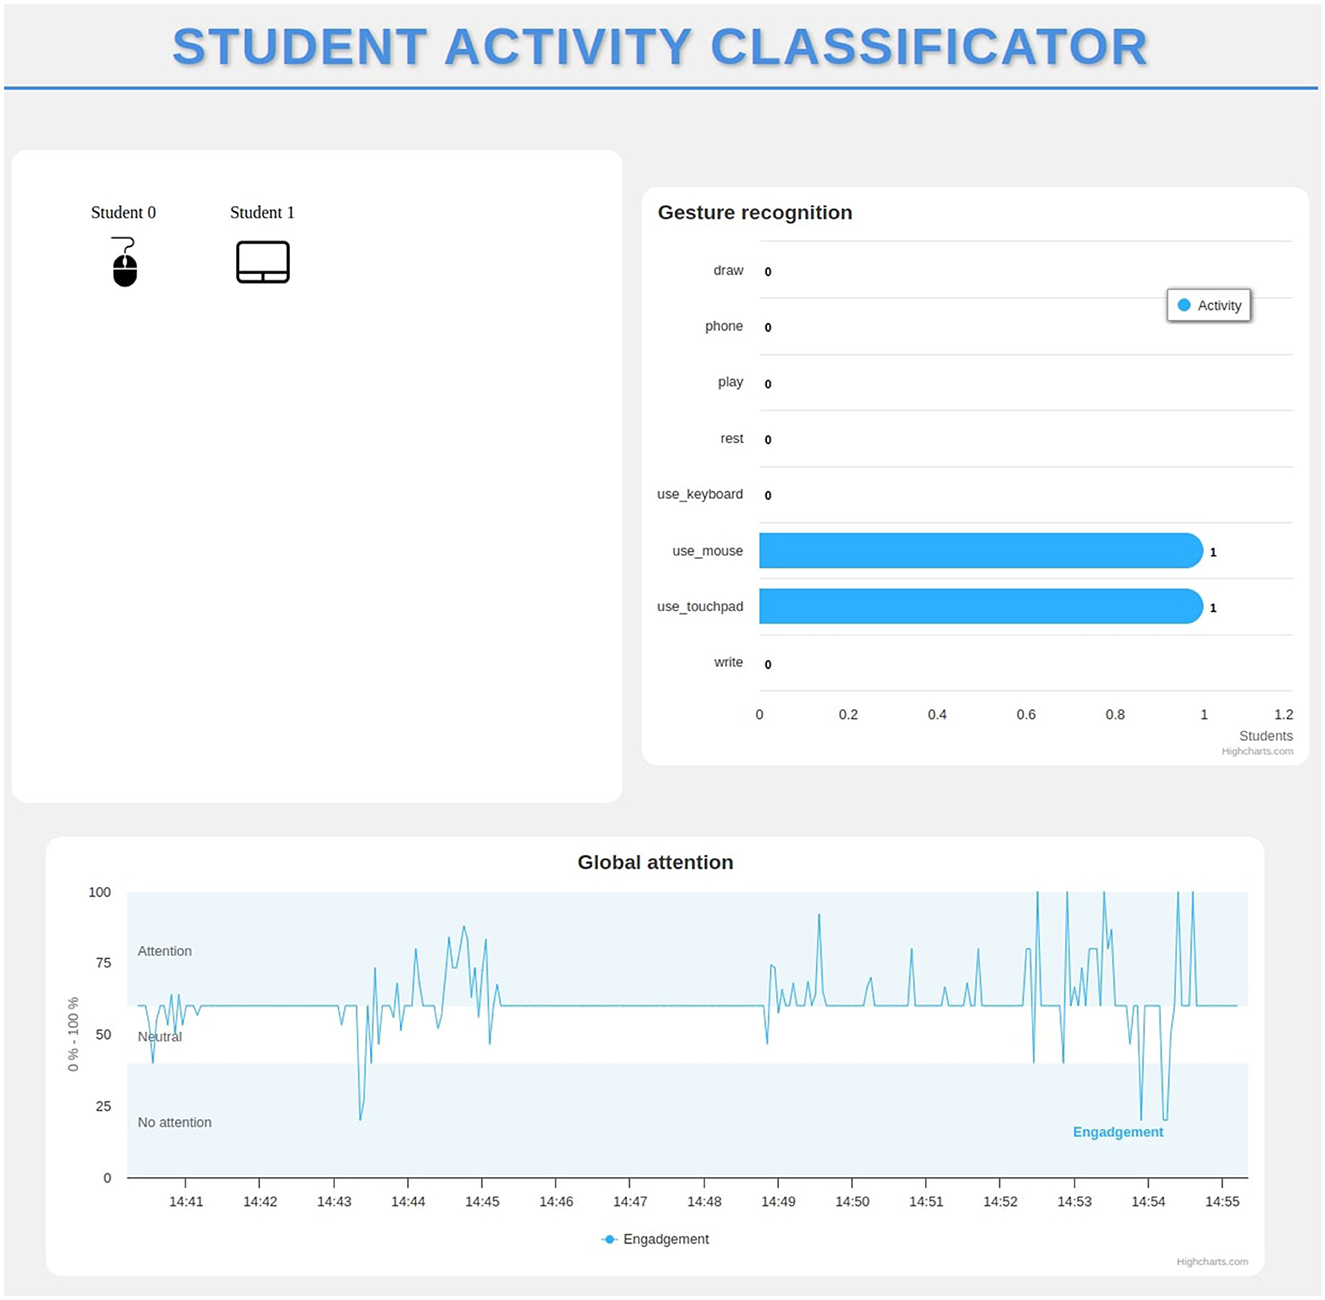
This study introduces an innovative approach to dynamic activity detection in the classroom through an effective graphical user interface (GUI) (see Figure 1), validated by engineering faculty in diverse educational settings. The interface is organized into distinct sections: one displays individual student data, indicating the specific activities being performed (writing on a smartphone, drawing on paper, typing on a keyboard, using a mouse, resting, playing with a pen and using a touchpad), while the remaining sections summarize overall classroom information by providing the global heart rate and a concise overview of student activities. This structure offers synthesized and easily accessible insights for instructors and administrators.
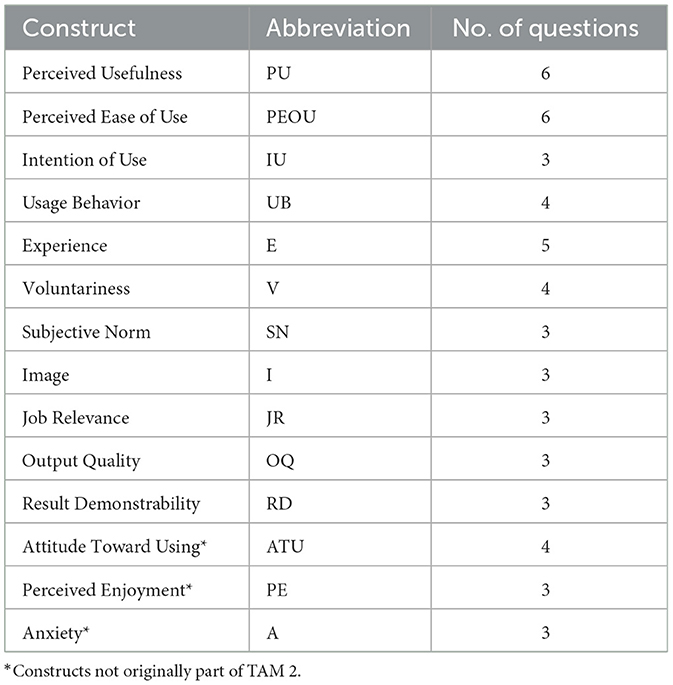
By leveraging the Technology Acceptance Model (TAM2) (Venkatesh and Davis, 2000), as shown in Figure 2, this work evaluates both the effectiveness and acceptance of the proposed technology in real-world educational contexts. The research objectives include collecting quantitative and qualitative evidence of improved classroom behaviors and enhanced student academic performance. Additionally, Table 1 provides the abbreviations used for each construct in the study, along with the number of questions associated with each.
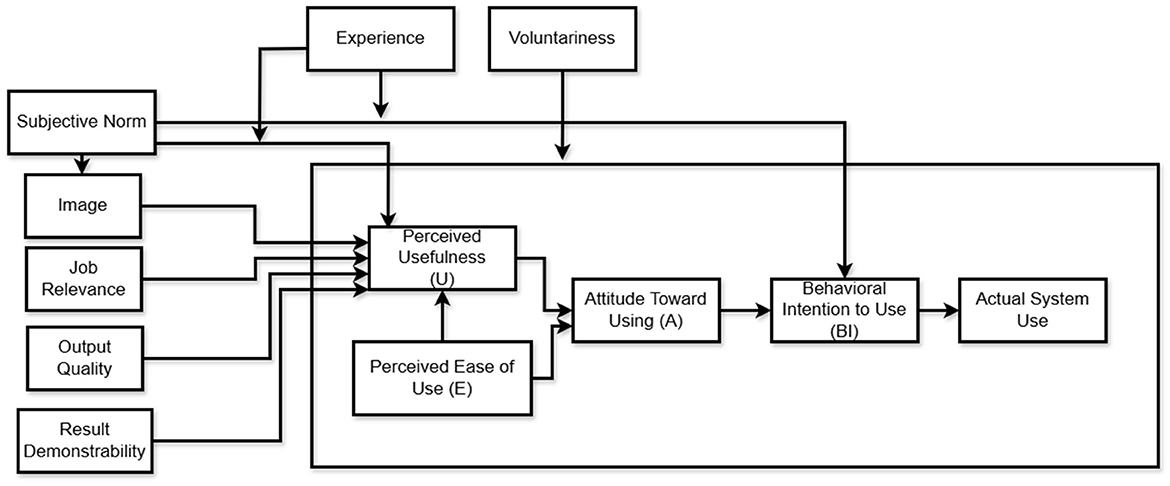
Figure 2. TAM 2 model (Wu et al., 2008).
This paper examines how young engineering professors (defined here as those under 40 years of age) perceive the implementation of advanced technologies, specifically through the use of action control systems enabled by online monitoring. It explores how these systems can provide objective and effective tools for evaluating student activity and the attention associated with that activity while respecting student privacy. Finally, the study presents quantitative and qualitative results from user validation using the TAM2 standard, demonstrating the technology's acceptance and effectiveness in educational contexts.
This research investigates the following questions:
• How do young engineering professors perceive the impact of advanced monitoring technologies on their ability to evaluate and enhance student engagement in the classroom?
• What are the challenges and benefits experienced by engineering professors when integrating online monitoring systems for student activity and engagement, and how do these systems influence their teaching practices and effectiveness?
The integration of technology into education has significantly transformed conventional teaching and learning methodologies, offering both opportunities and challenges. This literature review explores three main areas related to this transformation. First, it discusses the impact of mobile devices on student engagement, highlighting both the potential advantages and the distractions they introduce. Next, it examines the acceptance of technology within educational institutions, focusing on factors that influence the adoption and effective use of new tools and platforms. Finally, it investigates innovative didactic methodologies, emphasizing how dynamic activity detection and wearable technology can enhance classroom interactions and learning outcomes.
1.1 Theoretical framework
Technology has reshaped multiple facets of modern society, and education is no exception. This framework reviews the impact of mobile devices, examines technology acceptance in educational institutions, and considers didactic strategies that integrate emerging technologies into classroom practice. Additionally, it addresses novel approaches such as dynamic activity detection and wearable technology to illustrate their potential benefits in educational settings.
1.1.1 Impact of mobile devices on student engagement
A variety of studies indicate that the proliferation of smartphones poses significant challenges in regulating student behavior in the classroom (Akopova, 2020), reducing attention span and engagement among digital natives. Since 2010, a decrease of over 60% in note-taking during lectures has been reported, largely attributable to mobile device usage (Kuznekoff and Titsworth, 2013).
Research further shows that using mobile phones during class negatively affects students' information retention and academic performance (Sapci et al., 2021). Students who refrained from using their phones took more comprehensive notes, remembered more information, and achieved higher grades than peers who used their devices (Abd Rashid et al., 2020). Moreover, mobile device usage can undermine critical thinking and collaborative work (Green, 2019), as students composing responses on mobile devices demonstrated lower levels of critical reasoning compared with those using computer keyboards or handwriting.
Given these findings, providing educators with tools to detect and manage mobile device usage is essential for improving student attention and engagement.
1.1.2 Technology acceptance in educational institutions
Educators' resistance to adopting new technologies in classroom settings is well documented (Watty et al., 2016). Despite the potential benefits for teaching and learning, implementation barriers remain. According to numerous systematic reviews, “perceived usefulness” and “ease of use”–key constructs of the TAM–are major predictors of successful technology acceptance (Granić and Marangunić, 2019).
For instance, a study in higher education noted positive attitudes toward platforms like Moodle, Facebook, and YouTube, again underscoring the roles of perceived usefulness and ease of use (Costa et al., 2019). Nevertheless, resistance persists for certain technologies, partly due to unfamiliarity and concerns about possible distractions in educational environments.
Additional evidence indicates that computer self-efficacy and technical support are essential for the acceptance of mobile and online technologies among students (Chahal, 2022). In Jordanian universities, familiarity with e-learning systems and internet technologies has been identified as critical for successful adoption (Al-Adwan et al., 2013), while a study in Nepalese universities reports that perceived enjoyment and self-efficacy also significantly affect students' technology acceptance (Teo et al., 2019).
1.1.3 Didactic methodology
In engineering education, there is notable resistance to the integration of new instructional methods. Maintaining high levels of attention is crucial for practical tasks and problem-solving activities, which promote active learning and critical thinking skills.
The technology discussed here aims to reinforce behaviorist principles in the classroom, where learning is driven by observable behaviors and shaped by experience. Employing problem-solving approaches focuses on changing student behavior through trial and error, with repeated reinforcement of the strategies that lead to successful problem resolution (Pape, 2004; Gorrell and Downing, 1989; Gorrell, 1993).
Addressing learned helplessness–a misguided belief that one has no control over academic situations–is also vital. Strategies involving appropriate reinforcement and personalized guidance can help students sustain a sense of control and efficacy in their learning processes (Ghasemi and Karimi, 2021).
By combining these didactic methodologies with the activity detection tools introduced in this study, the teaching-learning process may be substantially improved. For instance, detecting and recording student participation during problem-solving tasks can provide immediate insight into engagement levels (Kasparova et al., 2020), while biometric data can inform positive reinforcement for active students and negative reinforcement for those who are less engaged (Asai and Yamana, 2013). Moreover, real-time performance data enable instructors to customize problem-solving activities, which is especially beneficial in engineering disciplines, by providing additional tasks or support to students exhibiting low engagement (Tang et al., 2023).
1.2 Dynamic activity detection in educational contexts
Numerous studies have investigated the application of individual RGB cameras for real-time activity detection within educational environments. While this approach is cost-effective and relatively straightforward to implement, smartwatches, as utilized in this study, present a less intrusive alternative, minimizing the potential for behavioral alterations due to the awareness of being observed (Weiss et al., 2016). Furthermore, smartwatches demonstrate greater resilience to challenges such as occlusion or head movement.
Recent advancements highlight the value of incorporating physiological and biometric data alongside conventional visual inputs to augment the capabilities of Vision-Language Models (VLM) and Multimodal Large Language Models (MLLM). For example, the real-time measurement of heart rate variability and other biometric indicators via smartwatches provides deeper insights into cognitive load and emotional states (Bustos-Lopez et al., 2022).
Among the most recognized and effective AI models for attention detection using RGB cameras are those presented in Abedi and Khan (2021) and Ai et al. (2022). However, in the educational domain, no specific attention-detection models for smartwatches have been developed thus far, even though their use in sports activity recognition has been evaluated.
The software discussed in this paper has been tested on smartwatches for the aforementioned reasons. Its modular architecture also allows easy integration of RGB-based approaches, providing a flexible platform that can accommodate diverse data collection methods.
2 Materials and methods
This section describes the methodological framework for evaluating the acceptance and effectiveness of a novel technological system among engineering faculty members. It includes the study context, institutional setting, participant selection, system specifications, data collection strategies, and analytic procedures.
2.1 Study context
The research took place in Spain with professors from Robotics Engineering and Computer Science programs, each specializing in engineering. To determine how short training sessions impact technology adoption, participants received a concise explanation (under two minutes) of the software's features. This approach was chosen to assess how effectively minimal instruction could facilitate software usability and intuitiveness. Streamlining training also helped address faculty workload constraints, allowing for quick integration of new tools without substantial disruption to daily responsibilities (Georgina and Hosford, 2009). Such rapid adoption of emerging technologies is vital for maintaining both the quality and timeliness of education programs (Granziera et al., 2019).
As previously mentioned, the study was performed at a Spanish university with over 30,000 students enrolled across six faculties and one Polytechnic School. Like many institutions, it faces considerable hurdles in implementing advanced technologies (e.g., AI-driven tools, smart classrooms), including:
• High financial investments,
• Privacy and security issues,
• Extensive training requirements for effective use,
• Technical integration challenges and potential biases in AI-based systems.
The university fosters a multicultural and inclusive environment that attracts both international students and faculty. Its mission centers on delivering state-of-the-art educational and research opportunities and supporting innovation and personal growth within a Mediterranean setting.
2.2 Participants
A total of 107 early-career engineering instructors (doctoral students with teaching responsibilities and junior professors) were considered for this analysis. From this group, 10 educators (nearly 10% of the total) agreed to participate and provided informed consent. All possessed the necessary teaching credentials.
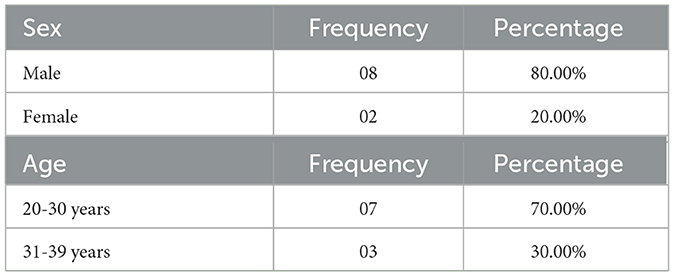
Participants answered a total of 59 survey questions, including 53 structured items targeting the acceptance of disruptive AI technologies designed to enhance teaching effectiveness, particularly in detecting academic activities and managing classroom attention, and 6 open-ended qualitative questions aimed at eliciting deeper insights into their perceptions and concerns. Table 2 summarizes their demographic characteristics. Their teaching experience ranged from 1 to 7 years, covering basic undergraduate courses (e.g., mathematics) to advanced graduate topics (e.g., intelligent computer vision). Despite their distinct teaching assignments, they shared strong foundations in engineering.
Although the sample included only ten participants–approximately 10% of the total population of early, career engineering faculty at the institution, this study adopted an exploratory approach that prioritized the collection of rich, nuanced data over a broader sample size. The questionnaire was specifically designed to capture a wide range of perceptions and behavioral drivers based on the extended TAM2 model, enabling a fine-grained analysis suited to identifying emerging patterns and informing future, larger-scale investigations.
2.3 Computer system
The system under evaluation builds on a previously developed architecture (Marquez-Carpintero et al., 2023) and introduces an innovative procedure for capturing and displaying user activities and attention through a smartwatch.
2.3.1 System architecture
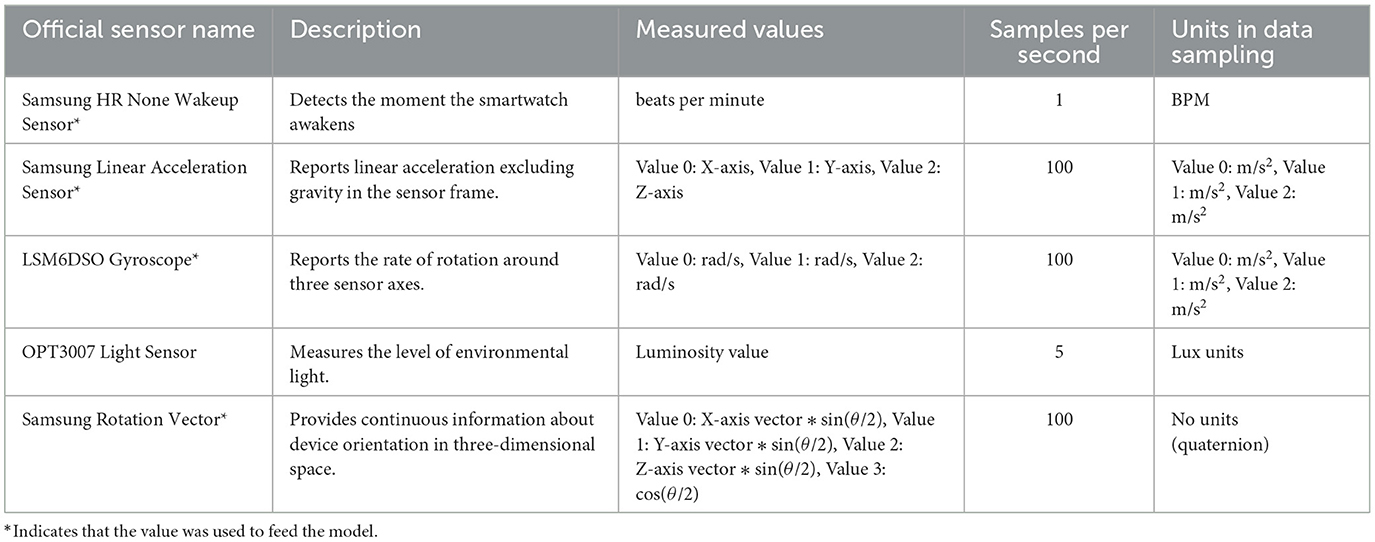
A modular client-server platform, containerized using Docker, ensures portability and scalability for the inference component. The Wear OS smartwatch collects sensor data at the maximum allowable frequency (see Table 3 for sensor specifications). This data is then processed and classified by the server in real time to infer attention levels, and the resulting information is securely stored in a database.
To ensure data security, all information is managed on protected servers using standard encryption protocols–SSL/TLS for data transmission and symmetric encryption for storage. Leveraging the system's modular architecture, a dedicated web server can also be seamlessly integrated to transmit the stored data to the instructor's computer interface.
2.3.2 Data flow
As depicted in Figure 3, the smartwatch sends sensor data to a web server, which stores the incoming information and guarantees fault tolerance. The web server subsequently transmits the data to the instructor's computer, enabling distributed processing and efficient load balancing when running on a remote server.
Upon receiving a request, the AI engine classifies user activities (writing on a smartphone, drawing on paper, typing on a keyboard, using a mouse, resting, playing with a pen and using a touchpad) within four-second intervals, computing the probability of each possible action and labeling the activity with the highest likelihood. Since the sensor data arrive at one-second intervals and remain relatively small in volume, a conventional SQL database was deemed suitable for quick queries and retrieval. Automatic interface updates for the instructor's system are facilitated by AJAX.
Figure 4 illustrates the structure of the input data used for the model's final classification. The architecture consists of a Conv1D layer to extract local features from time-series data, an RNN layer to capture temporal dependencies, and a fully connected (FC) layer that generates the final output. The model assigns an activity label by selecting the class with the highest predicted probability. A previously evaluated baseline model achieved an activity recognition accuracy of 80% (Suescun-Ferrandiz et al., 2025). The combination of sensor readings enables the identification of different activities, which are reflected in the model's output. These outputs are then mapped to specific attention weights (0, 0.5 or 1).

Figure 4. Detailed pipeline of data usage. *One digit is obtained for each class, representing the probability that a given sequence of data belongs to each class.
Once the student's attention level is inferred, assigning a value of 1 for attentive actions, 0.5 for a neutral state, and 0 for inattentive behavior, this value is aggregated with those of the remaining students. The combined data are normalized on a 0-100 scale and averaged across all students to enable visualization in the global attention graph.
2.4 Data collected
Assessing software usability was pivotal to determining technology acceptance. Accordingly, the extended TAM2 (Varela, 2004; Wu et al., 2008) was employed, incorporating additional contextual factors.
2.4.1 Questionnaire design
In line with TAM2, a structured and validated questionnaire (Venkatesh and Davis, 2000; Alwreikat et al., 2021) focused on key constructs such as subjective norm, voluntariness, image, job relevance, output quality, and result demonstrability. These constructs are crucial for evaluating workplace software adoption (Turner et al., 2010; Sharifzadeh et al., 2017; King and He, 2006).
TAM2 extends the original TAM (1989) by incorporating factors (e.g., subjective norms, perceived job relevance) essential for analyzing contemporary, dynamic software. Additionally, three constructs were integrated from earlier studies: Anxiety (A) (Tsai et al., 2020), Perceived Enjoyment (PE) (Teo and Noyes, 2011; Alalwan et al., 2018), and Attitude Toward Using (ATU) (Teo, 2009). Given the high-stakes context of teaching, Anxiety items were reversed on the Likert scale to ensure that higher scores indicated more positive evaluations.
These supplementary measures (A, PE, ATU) were included to gauge how readily educators might adopt this system in real-world academic scenarios. Anxiety captures potential apprehension under observation, Perceived Enjoyment investigates user engagement, and Attitude Toward Using examines perceived usefulness and relevance within educational environments.
2.4.2 Response coding
Participants used a five-point Likert scale (Joshi et al., 2015) to answer each question:
1: Strongly disagree
2: Disagree
3: Neutral
4: Agree
5: Strongly agree
This scale is valued for its simplicity, clarity, and reliability in measuring the intensity of opinions and attitudes, enabling robust statistical analysis. Responses were interpreted using the following ranges:
• Very Poor: 0–1.25
• Poor: 1.25–2.5
• Acceptable: 2.5–3.5
• Good: 3.5–4.0
• Excellent: 4–4.5
• Best: 4.5–5.0
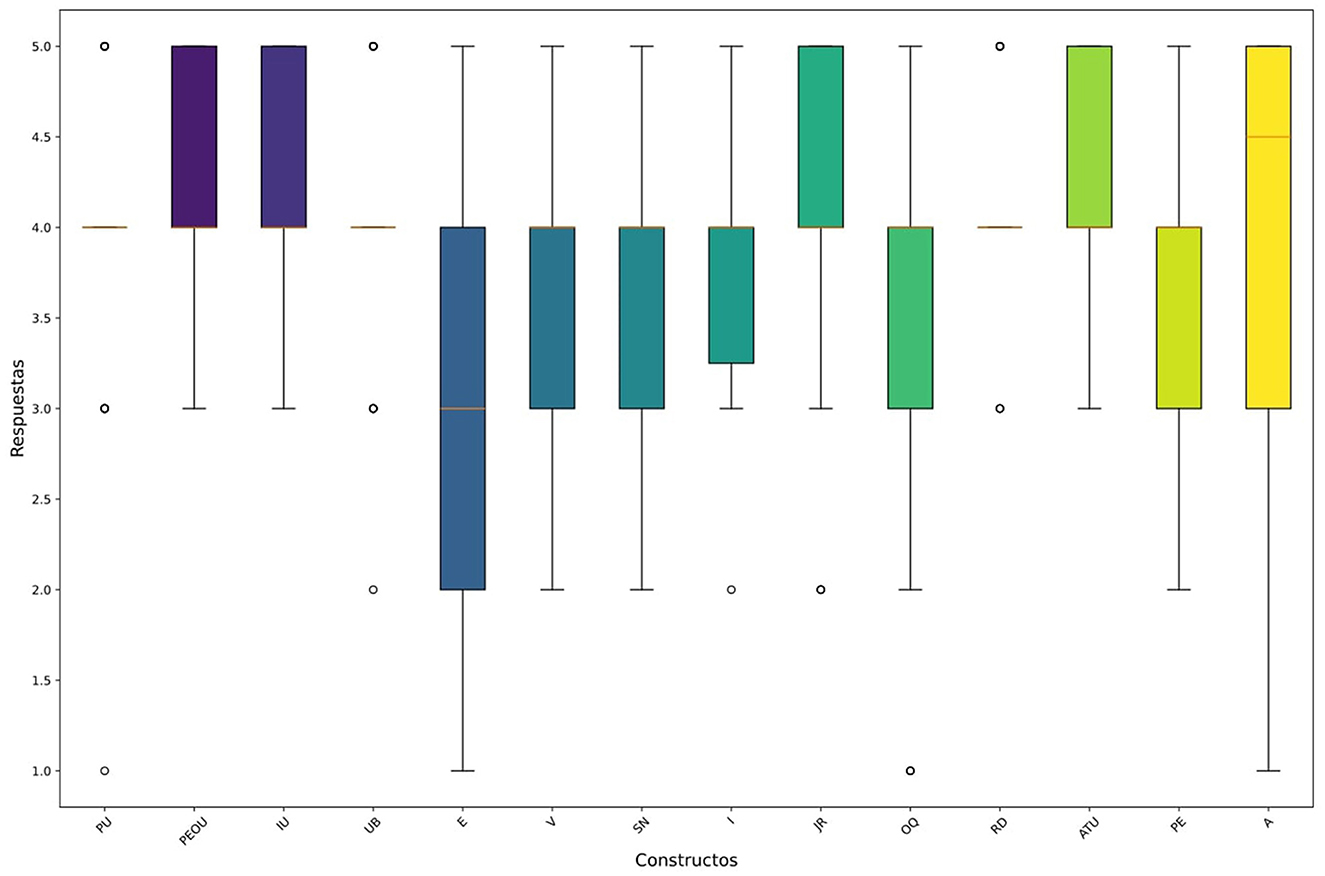
By converting qualitative perspectives into quantitative data, the Likert scale facilitated rigorous examination of user responses. A qualitative analysis of these results appears in Section 4, accompanied by a global box plot (Figure 5) for an overview of how respondents perceived each construct.
3 Results
A range of statistical methods was employed to assess user acceptance based on the TAM2 framework. Figures 6, 7 display the distribution of responses across various constructs, serving as the basis for the descriptive and inferential analyses discussed in Section 5.
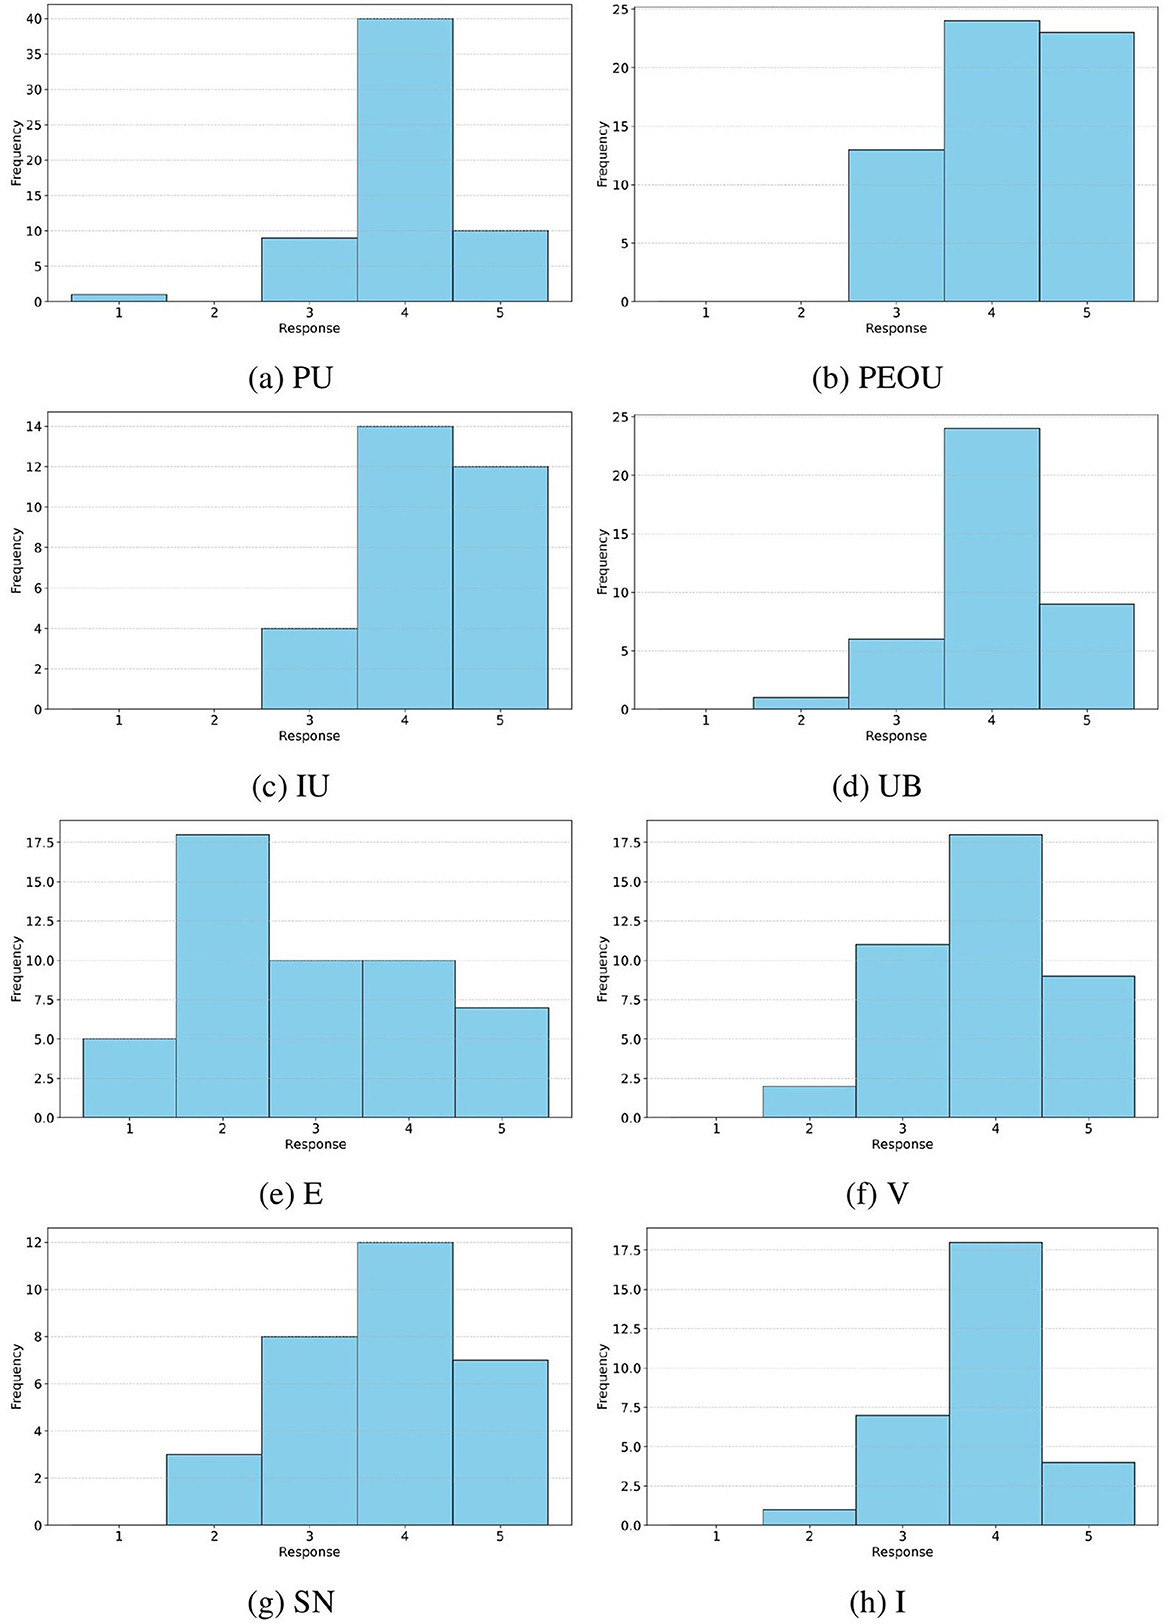
Figure 6. Frequency distribution of responses for constructs Job Relevance (JR), Output Quality (OQ), Result Demonstrability (RD), Attitude Toward Using (ATU), Perceived Enjoyment (PE), and Anxiety (A).
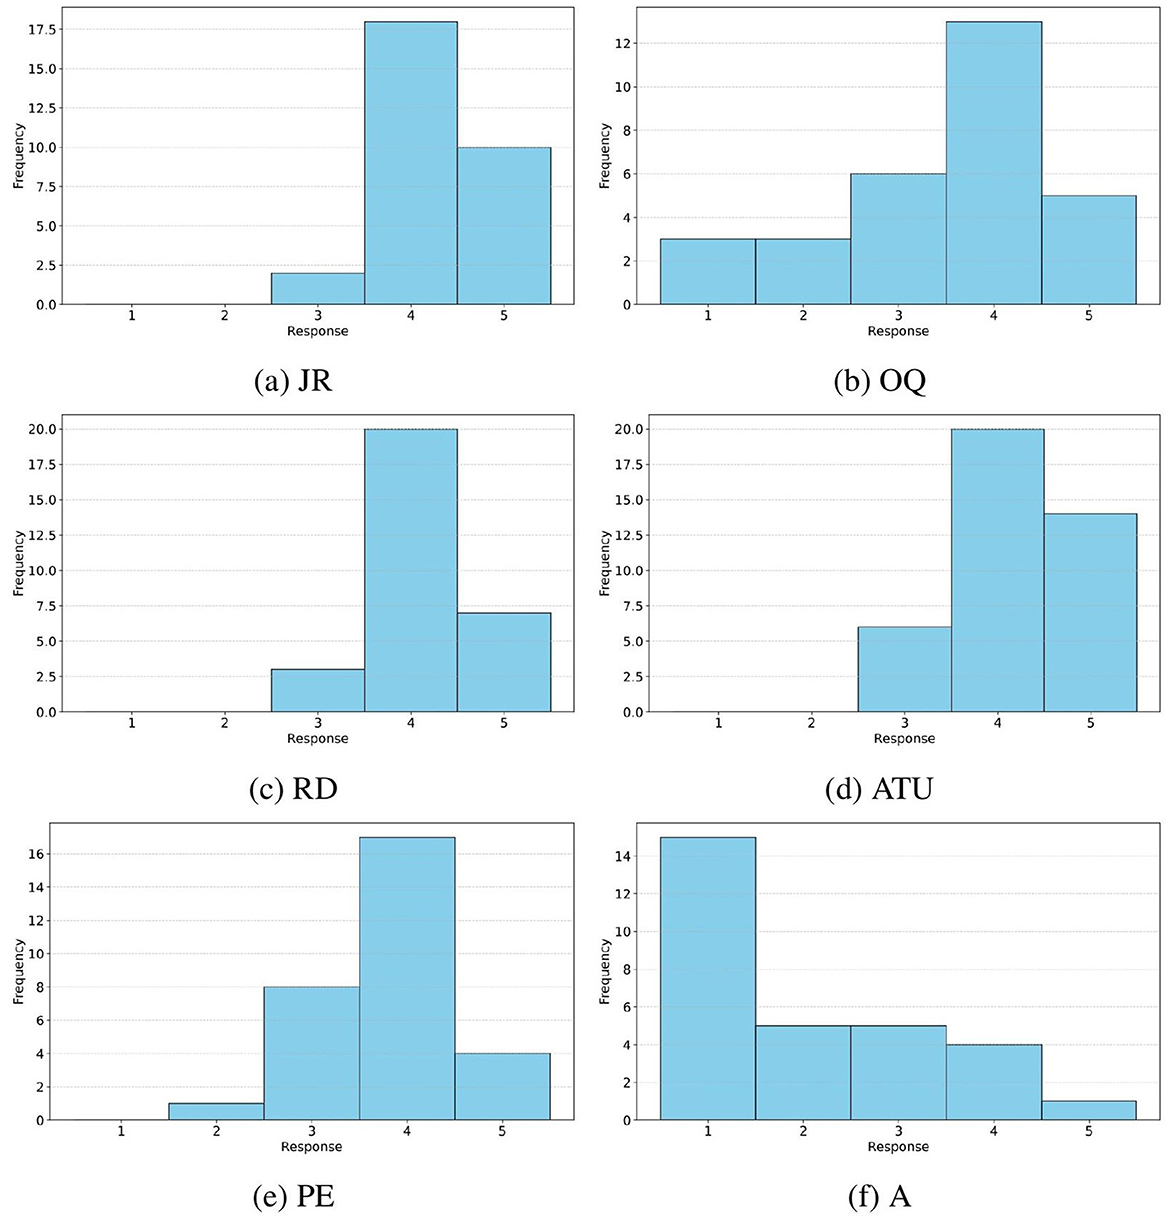
Figure 7. Frequency distribution of responses for Perceived Usefulness (PU), Perceived Ease of Use (PEOU), Intention of Use (IU), Usage Behaviour (UB), Experience (E), Voluntariness (V), Subjective Norm (SN), and Image (I) constructs.
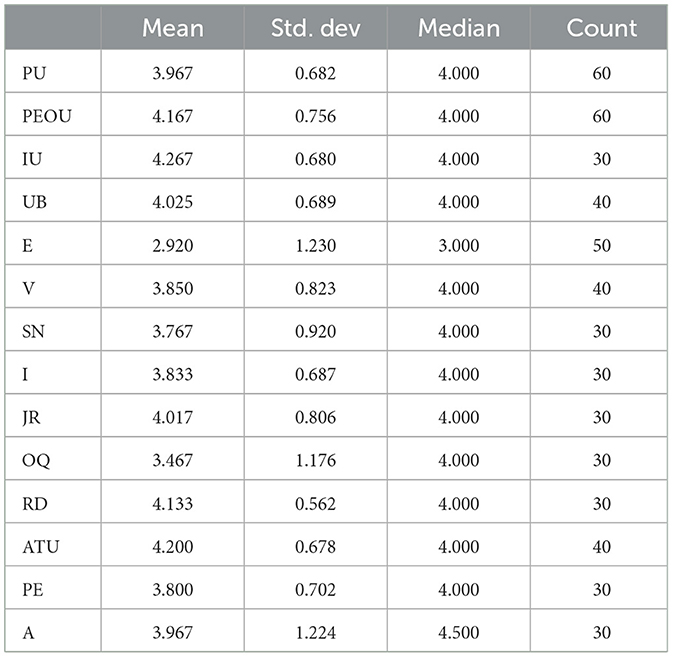
Table 4 presents summary statistics for each construct, including measures of central tendency (mean and median) and dispersion (standard deviation). These initial descriptive analyses provided a foundation for identifying potential redundancies among variables.
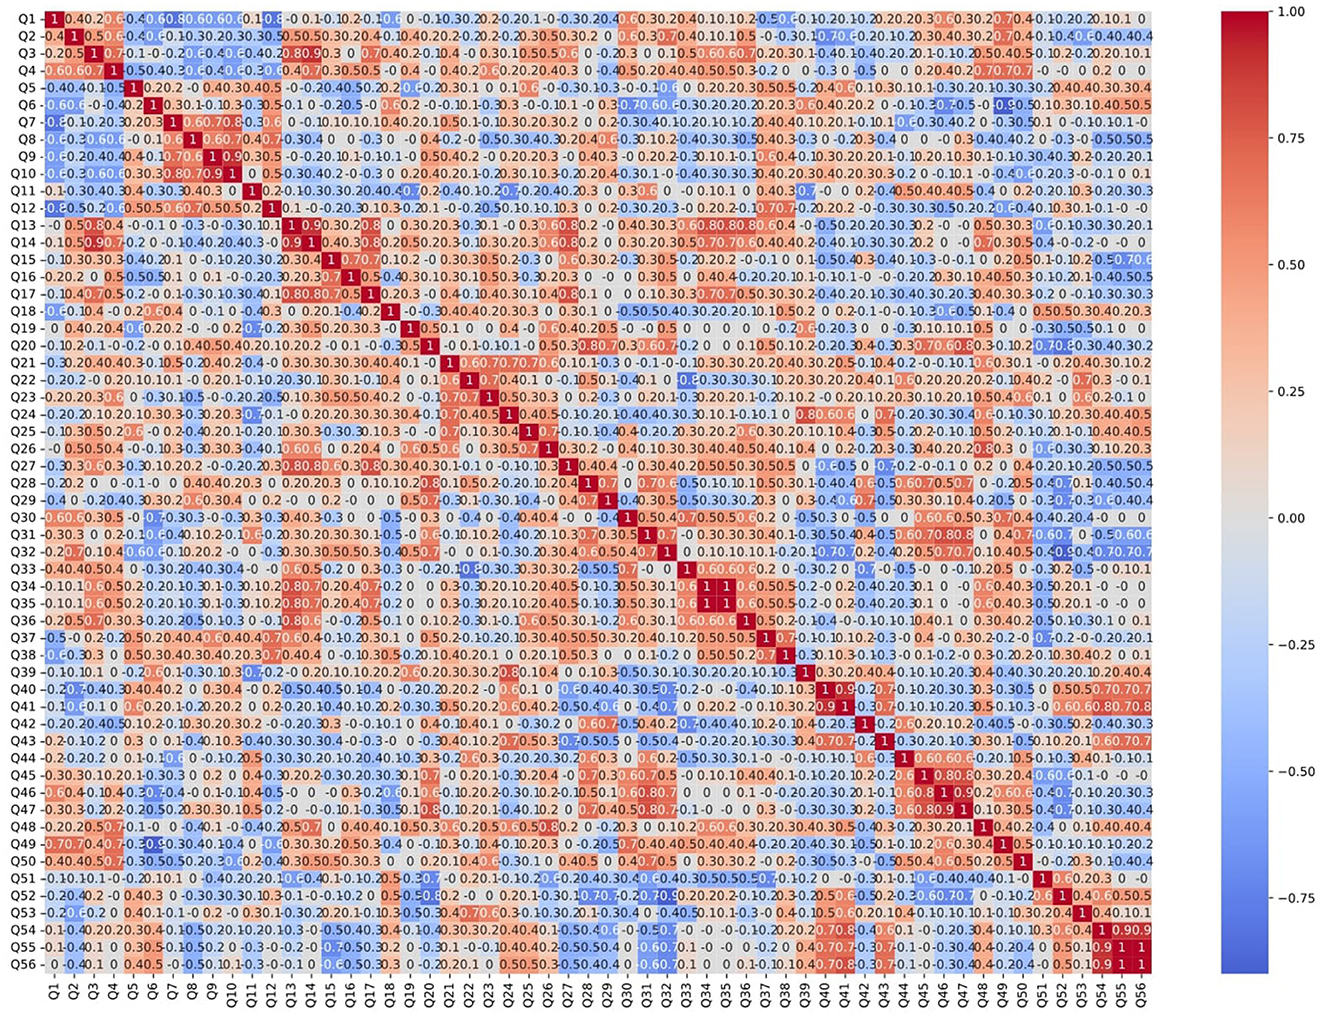
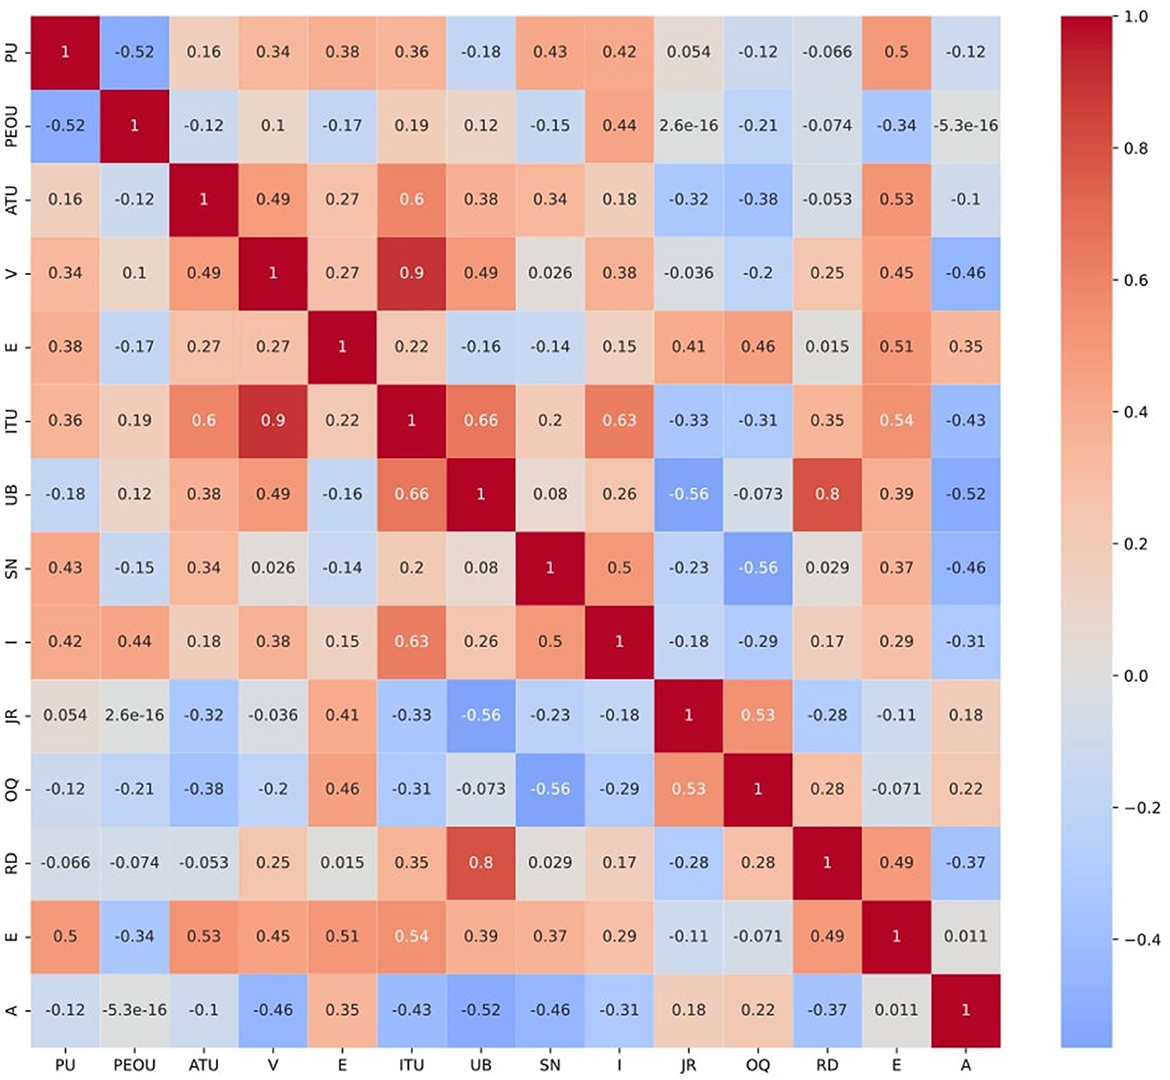
Building on this, Figure 8 illustrates the correlation matrix, where variables Q35, Q56, Q47, Q14, Q49, Q55, Q41, Q10, and Q52 exhibited correlations above 0.85 (r > 0.85). To address multicollinearity and enhance model precision, these variables were subsequently removed.
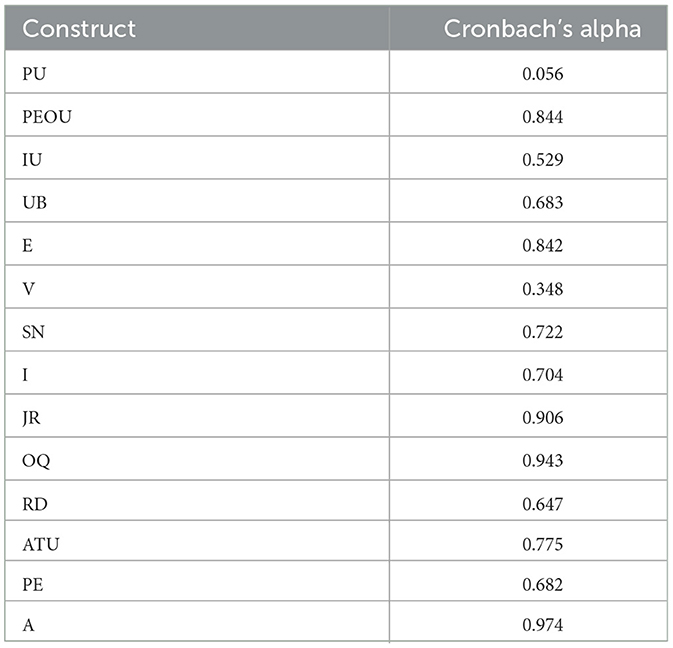
Following the refinement of variables, the internal consistency of the survey constructs, Cronbach's Alpha was calculated for each item set (Vaske et al., 2017) (see Table 5). Notably, PU (α = 0.056) and V (α = 0.348) showed low reliability, suggesting that the associated items may not adequately capture these constructs. In contrast, IU (α = 0.529) and UB (α = 0.683) demonstrated moderate reliability, acceptable in exploratory research yet indicating potential for item refinement. The matrix invertibility analysis (Ward et al., 1985) confirmed that constructs such as PU and PEOU contributed non-redundant information to the overall model.
Figure 8 displays the correlation matrix of all survey items. To mitigate multicollinearity, items with intercorrelations above 0.85 (Q35, Q56, Q47, Q14, Q49, Q55, Q41, Q10, and Q52) were excluded from further analysis.
Figure 9 illustrates the interrelationships between key constructs, along with their associated p-values:
• PU was positively correlated with IU (r = 0.355, p = 0.314).
• PEOU was negatively correlated with PU (r = −0.520, p = 0.109), and positively correlated with both IU (r = 0.192, p = 0.624) and Image (r = 0.438, p = 0.744).
• ATU showed positive correlations with both IU (r = 0.602, p = 0.022) and UB (r = 0.380, p = 0.284).
• A was negatively correlated with both IU (r = −0.429, p = 0.248) and UB (r = −0.524, p = 0.035).
• SN and I were also positively correlated with IU (r = 0.633, p = 0.050).
All correlations were tested under the null hypothesis of no linear relationship between the paired variables (r = 0). The corresponding p-values indicate the likelihood that the observed associations occurred by chance.
To complement the quantitative findings, six open-ended questions were included to capture participants' subjective impressions. The analysis of these qualitative responses, summarized in Figure 10, revealed four main areas of concern: discomfort, a sense of being monitored, technical issues, and the perceived risk of data misinterpretation. While most participants described the system as easy to use, several noted limitations related to the user interface and privacy.
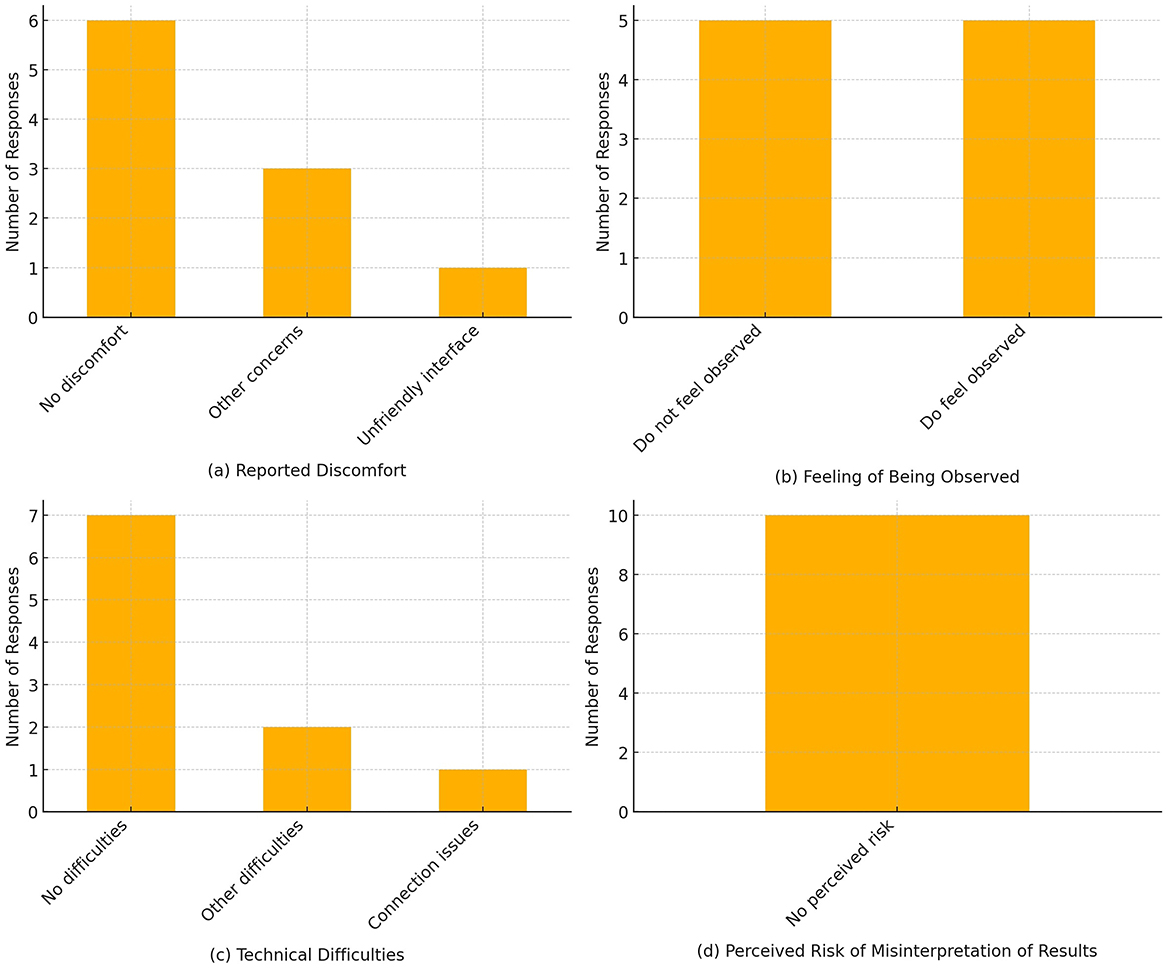
Figure 10. Categorical summary of participants' responses. (a) Reported discomfort. (b) Feeling of being observed. (c) Technical difficulties. (d) Perceived risk of misinterpretation of results.
4 Discussion
This study has sought to ascertain the level of acceptance of real-time behavior measurement software among a cohort of young engineering professors in Spain. The findings showed in Table 4 suggest that the technology is met with a favorable response, particularly when it is introduced alongside concise and well-structured training sessions. According to TAM2, high levels of perceived usefulness and ease of use indicate that professors are willing to incorporate these tools into their teaching practices.
The real-time measurement system enhances the quality of teaching by enabling the detection and adaptation of classroom activities through continuous monitoring of student participation and engagement. This facilitates more personalized instruction, which in turn promotes greater student involvement and potentially improved academic outcomes. The system's modular architecture ensures adaptability and scalability across diverse educational settings. Additionally, its deployment via smartwatches reduces perceptions of intrusiveness and minimizes behavioral modifications linked to awareness of being monitored, particularly when compared to more invasive technologies such as RGB cameras.
Two of the most significant factors influencing technology acceptance were anxiety and institutional support. The analysis shows that anxiety had a substantial inhibitory effect on both Intention to Use (-0.429) and Usage Behavior (-0.524), reinforcing the importance of mitigating user apprehension to promote adoption. Likewise, the level of difficulty perceived in using the system and the degree of institutional backing were pivotal in shaping user acceptance.
To better understand the sources of anxiety underlying the significant negative correlations identified, we analyzed participants' open-ended responses collected via the qualitative section of the survey. The analysis revealed three recurrent themes:
• Perceived Surveillance: Several participants expressed concern about being “observed” or “recorded,” stating that such real-time monitoring could lead to discomfort or an overly surveilled classroom environment.
• Technical Complexity: Some users pointed out usability issues, such as a need for a more intuitive interface or occasional connectivity problems (e.g., “problems with Wi-Fi” or “unfriendly GUI”).
• Fear of Data Misinterpretation: A number of responses highlighted apprehension regarding how attention or behavior data might be misunderstood or misused, e.g., “the system might misread levels of attention” or “be used to manipulate classroom climate.”
These qualitative findings corroborate and contextualize the quantitative results, suggesting that anxiety is rooted not only in technological self-efficacy but also in ethical and pedagogical concerns. Addressing these areas in future deployments, via improved training, clearer system transparency, and data usage protocols, may reduce anxiety and promote broader acceptance.
Additionally, several of the computed correlations did not reach conventional thresholds for statistical significance (p < 0.05). This outcome is primarily attributed to the limited sample size, which limits statistical power. In such cases, even moderate to strong correlations may fail to achieve significance despite reflecting meaningful patterns. Importantly, the direction and magnitude of most associations were consistent with theoretical expectations of the TAM2 model, suggesting the presence of underlying relationships that warrant further investigation. These findings provide exploratory evidence and offer a foundation for hypothesis refinement and future studies with larger, more diverse samples.
Notably, ATU showed a strong correlation with both IU and UB, suggesting that fostering positive attitudes toward the system could significantly enhance both intention and actual usage.
Further supporting this relationship, PU correlated moderately with IU (0.355), while PEOU showed a negative association with PU (-0.520) but maintained positive correlations with IU (0.192) and IM (0.438), underscoring the nuanced role of usability in shaping both perceived value and user intent. Additionally, A demonstrated inhibitory effects on IU (-0.429) and UB (-0.524), suggesting that reducing user anxiety may enhance system acceptance. Social influences, including SN and I, also emerged as relevant factors, highlighting the importance of social context in technology adoption decisions.
4.1 Comparative analysis
When compared to prior studies grounded in the TAM2 framework (Wingo et al., 2017; Khoa et al., 2020), the results of this research demonstrate a consistent directional alignment with established theoretical predictions. For example, although the correlation between PEOU and IU in this study did not reach statistical significance (r = 0.192, p = 0.624), it maintained the positive direction reported in previous research, reinforcing its conceptual validity. Conversely, the relationship between SN and IU was notably stronger in this study (r = 0.633, p = 0.050) than that reported by Khoa et al. (2020) (β = 0.235), suggesting that social pressure and institutional endorsement play a particularly influential role in technology adoption within structured academic settings. This finding aligns with TAM2, which posits that SN becomes a key determinant when technology use is mandated or formally encouraged by the organization (Venkatesh and Davis, 2000).
A notable divergence was observed in the relationship between PEOU and PU, which unexpectedly showed a negative correlation (r = −0.520, p = 0.109). This inverse association may reflect a ceiling effect among technologically proficient faculty, for whom ease of use does not necessarily imply greater utility. In fact, simpler systems may be perceived as lacking the functional depth required for advanced pedagogical applications.
Furthermore, this study highlights the critical role of A, an external factor not originally included in TAM2 but increasingly recognized as essential in digital education research (Dönmez-Turan and Kır, 2019). Although A was not quantitatively measured here, its relevance was acknowledged within the theoretical model. Other studies based on the extended TAM3 framework report substantially lower A levels among our study and general users (e.g., M = 2.44, SD = 1.25; M = 2.01, SD = 1.07 on a 7-point scale) (Kleine et al., 2025), suggesting that educators may experience qualitatively distinct forms of A, especially when coupled with the simultaneous demands of managing both the classroom and the educational software.
4.2 Limitations
The relatively small sample size and its demographic specificity, comprising engineering faculty members under the age of 40 from a single Spanish university, limit the generalizability of the findings. Nonetheless, the sample is internally diverse within the defined target group of young engineering faculty. Given the exploratory nature of this study, the results should be viewed as preliminary insights rather than definitive conclusions. Future research should aim to broaden the sample by incorporating more diverse participants across multiple institutions, academic disciplines, and geographic regions, thereby enhancing the robustness and external validity of the findings.
Additionally, the study's cross-sectional design captured only initial user perceptions following a brief training session. As a result, it does not account for long-term adoption, changes in teaching practices, or evolving attitudes such as reduced anxiety over time.
To overcome these limitations, future research should replicate this study with larger and more diverse samples across institutions, age groups, and academic fields. Longitudinal designs are also recommended to evaluate sustained technology use, its impact on pedagogical practices, and the development of user perceptions over time. Follow-up studies tracking continued usage are particularly important to determine whether early positive perceptions lead to long-term adoption and meaningful educational change.
Furthermore, the limited literature on faculty-specific anxiety within the TAM framework, highlighted in the comparative analysis, represents a critical research gap and a valuable opportunity for future studies to enhance our understanding of technology adoption in educational settings.
Finally, some measurement limitations were identified. PU (α = 0.056) and V (α = 0.348) exhibited low internal consistency, indicating the need for item refinement to more accurately capture these constructs. Despite this, both were retained due to their central theoretical roles within the TAM2 framework. PU is a key predictor of technology adoption, and omitting it would compromise the model's conceptual integrity. Likewise, V remains essential for understanding peer influence on adoption behavior. The low reliability scores may stem from the small sample and item adaptation issues rather than conceptual irrelevance. Future research should revise and strengthen the measurement of these constructs.
5 Conclusion
This study investigated the acceptance of real-time behavior measurement software among young engineering professors at a Spanish university. The findings indicate a generally positive reception, with participants valuing the system's usability and practical relevance for enhancing classroom engagement. By offering instructors an objective, real-time tool to assess student activity, this technology presents a promising path toward improving teaching effectiveness and academic outcomes through more personalized learning experiences.
Key factors that facilitated technology acceptance included the simplicity of the interface and the minimal training required for initial use. These elements contributed significantly to the perceived ease of use and overall user acceptance. However, the analysis also revealed two critical barriers to adoption: anxiety and institutional support. Notably, anxiety exerted the strongest inhibitory influence, with a substantial negative effect on both the intention to use the system (r = −0.429) and actual usage behavior (r = −0.524). This underscores the central role of psychological readiness and the importance of fostering user confidence to ensure successful implementation.
Interestingly, contrary to expectations, the relationship between Perceived Ease of Use and Perceived Usefulness yielded a negative correlation. This unexpected result may reflect a ceiling effect, whereby technologically proficient faculty do not necessarily associate ease of use with greater utility, perhaps perceiving simpler systems as less capable of supporting complex pedagogical tasks.
The system's unobtrusive design, particularly the use of smartwatches instead of more invasive technologies like RGB cameras, was positively received. This design choice helped mitigate perceptions of surveillance, fostering a more natural classroom environment and contributing to broader acceptance. Its modular and scalable architecture further enhances its potential applicability across various educational settings.
While the study affirms the feasibility of deploying real-time behavior monitoring tools in academic contexts, it also highlights the need for further research. The limited sample, comprising early-career engineering faculty from a single institution, constrains the generalizability of the results. Future research should involve more diverse samples across disciplines and age groups, and adopt longitudinal approaches to assess sustained usage, pedagogical impacts, and evolving user perceptions over time.
To facilitate broader adoption, it is essential to reduce user anxiety, ensure robust institutional support, and provide ongoing technical assistance. The study provides meaningful preliminary insights into the factors shaping technology acceptance in educational settings. These results open the door to future lines of research aimed at refining and expanding the use of real-time behavior measurement tools.
Data availability statement
The original contributions presented in the study are included in the article/supplementary material, further inquiries can be directed to the corresponding author.
Ethics statement
The study deals with highly non-sensitive and anonymized data on teachers and does not require approval by the university's ethics committee. The studies were conducted in accordance with the local legislation and institutional requirements. The participants provided their written informed consent to participate in this study.
Author contributions
LM-C: Conceptualization, Investigation, Methodology, Software, Validation, Visualization, Writing – original draft, Writing – review & editing. FG-D: Formal analysis, Supervision, Writing – review & editing. MC: Formal analysis, Funding acquisition, Project administration, Resources, Supervision, Writing – review & editing.
Funding
The author(s) declare that financial support was received for the research and/or publication of this article. This work was supported by the Prometeo program from Conselleria de Innovación, Universidades, Ciencia y Sociedad Digital of Generalitat Valenciana (Spain) under Grant CIPROM/2021/17. Additionally, generative AI tools were utilized as an assistant for drafting and refining the text, ensuring clarity and accuracy in the presentation of this work.
Conflict of interest
The authors declare that the research was conducted in the absence of any commercial or financial relationships that could be construed as a potential conflict of interest.
Generative AI statement
The author(s) declare that Gen AI was used in the creation of this manuscript. Generative AI tools were employed to assist in drafting, refining, and translating the text, ensuring clarity, precision, and accuracy in the presentation of this work.
Publisher's note
All claims expressed in this article are solely those of the authors and do not necessarily represent those of their affiliated organizations, or those of the publisher, the editors and the reviewers. Any product that may be evaluated in this article, or claim that may be made by its manufacturer, is not guaranteed or endorsed by the publisher.
References
Abd Rashid, J., Aziz, A. A., Rahman, A. A., Saaid, S. A., and Ahmad, Z. (2020). The influence of mobile phone addiction on academic performance among teenagers. Malays. J. Commun. Jilid 36, 408–424. doi: 10.17576/JKMJC-2020-3603-25
Abd-Alrazaq, A., Alajlani, M., Ahmad, R., AlSaad, R., Aziz, S., Ahmed, A., et al. (2024). The performance of wearable ai in detecting stress among students: systematic review and meta-analysis. J. Med. Internet Res. 26:e52622. doi: 10.2196/52622
Abedi, A., and Khan, S. S. (2021). “Improving state-of-the-art in detecting student engagement with resnet and tcn hybrid network,” in 2021 18th Conference on Robots and Vision (CRV) (Burnaby, BC: IEEE), 151–157.
Ahmad, A. S., and Hamad, K. Y. (2020). Original paper technology integration in teaching: a study that examines how technology integration affects student achievement. J. Educ. Culture Stud. 4, 44–52. doi: 10.22158/jecs.v4n3p44
Ai, X., Sheng, V. S., Li, C., and Cui, Z. (2022). Class-attention video transformer for engagement intensity prediction. arXiv [preprint] arXiv:2208.07216. doi: 10.48550/arXiv.2208.07216
Akopova, M. A. (2020). Influence of Smartphones On Students‘ Attentional Processes. Cambridge, MA: Vestnik Universiteta.
Al-Adwan, A., Al-Adwan, A., and Smedley, J. (2013). Exploring students acceptance of e-learning using technology acceptance model in jordanian universities. Int. J. Educ. Dev. Using ICT 9:2.
Alalwan, A. A., Baabdullah, A. M., Rana, N. P., Tamilmani, K., and Dwivedi, Y. K. (2018). Examining adoption of mobile internet in saudi arabia: Extending tam with perceived enjoyment, innovativeness and trust. Technol. Soc. 55, 100–110. doi: 10.1016/j.techsoc.2018.06.007
Alwreikat, A., Shehata, A., and Zaid, M. K. A. (2021). “Arab scholars' acceptance of informal scholarly communication tools: applying the technology acceptance model 2 (tam2),” in Global Knowledge, Memory and Communication (Emerald Publishing Limited), 160–178. doi: 10.1108/GKMC-04-2021-0070
Asai, H., and Yamana, H. (2013). “Detecting student frustration based on handwriting behavior,” in Adjunct Proceedings of the 26th Annual ACM Symposium on User Interface Software and Technology (New York: ACM).
Bustos-Lopez, M., Cruz-Ramirez, N., Guerra-Hernandez, A., Sánchez-Morales, L. N., Cruz-Ramos, N. A., and Alor-Hernandez, G. (2022). Wearables for engagement detection in learning environments: a review. Biosensors 12:509. doi: 10.3390/bios12070509
Chahal, J. (2022). “Effect of computer and internet self-efficacy on students' acceptance of e-learning: Analysis of tam model using pls sem approach,” in 2022 International Conference on Computing, Communication, and Intelligent Systems (ICCCIS) (Greater Noida: IEEE), 257–262.
Costa, C., Alvelos, H., and Teixeira, L. (2019). Investigating the use and acceptance of technologies by professors in a higher education institution. Int. J. Online Pedag. Course Design (IJOPCD) 9, 1–20. doi: 10.4018/IJOPCD.2019040101
Dönmez-Turan, A., and Kır, M. (2019). User anxiety as an external variable of technology acceptance model: a meta-analytic study. Procedia Comput. Sci. 158, 715–724. doi: 10.1016/j.procs.2019.09.107
Georgina, D. A., and Hosford, C. C. (2009). Higher education faculty perceptions on technology integration and training. Teach. Teach. Educ. 25, 690–696. doi: 10.1016/j.tate.2008.11.004
Ghasemi, F., and Karimi, M. (2021). La indefensión aprendida en las escuelas secundarias públicas: los efectos de un programa de intervención basado en estrategias motivacionales. Middle School J. 52, 23–32. doi: 10.1080/00940771.2021.1948297
Gorrell, J. (1993). Cognitive modeling and implicit rules: effects on problem-solving performance. Am. J. Psychol. 106, 51–65. doi: 10.2307/1422865
Gorrell, J., and Downing, H. D. (1989). Effects of computer-simulated behavior analysis on pre-service teachers' problem solving. J. Educ. Comp. Res. 5, 335–347. doi: 10.2190/KW8Y-F816-BFVN-LQQB
Granić, A., and Marangunić, N. (2019). Technology acceptance model in educational context: A systematic literature review. Br. J. Educ. Technol. 50, 2572–2593. doi: 10.1111/bjet.12864
Granziera, H., Collie, R. J., and Martin, A. J. (2019). Adaptability: an important capacity to cultivate among pre-service teachers in teacher education programmes. Psychol. Teach. Rev. 25:60. doi: 10.53841/bpsptr.2019.25.1.60
Green, M. (2019). Smartphones, distraction narratives, and flexible pedagogies: Students' mobile technology practices in networked writing classrooms. Comp. Composit. 52, 91–106. doi: 10.1016/j.compcom.2019.01.009
Höver, K. M., and Mühlhäuser, M. (2015). “Classquake: Measuring students' attentiveness in the classroom,” in 2015 IEEE International Symposium on Multimedia (ISM) (Miami, FL: IEEE), 577–582.
Joshi, A., Kale, S., Chandel, S., and Pal, D. K. (2015). Likert scale: explored and explained. Br. J. Appl. Sci. Technol. 7, 396–403. doi: 10.9734/BJAST/2015/14975
Kasparova, A., Çeliktutan, O., and Cukurova, M. (2020). “Inferring student engagement in collaborative problem solving from visual cues,” in Companion Publication of the 2020 International Conference on Multimodal Interaction, 177–181. doi: 10.1145/3395035.3425961
Khoa, B. T., Ha, N. M., Nguyen, T. V. H., and Bich, N. H. (2020). Lecturers' adoption to use the online learning management system (LMS): empirical evidence from TAM2 model for Vietnam. Ho Chi Minh City Open Univer. J. Sci.-Econ. Busin. Administ. 10, 3–17. doi: 10.46223/HCMCOUJS.econ.en.10.1.216.2020
King, W. R., and He, J. (2006). A meta-analysis of the technology acceptance model. Inf. Manag. 43, 740–755. doi: 10.1016/j.im.2006.05.003
Kleine, A.-K., Schaffernak, I., and Lermer, E. (2025). Exploring predictors of ai chatbot usage intensity among students: within-and between-person relationships based on the technology acceptance model. Comp. Human Behav.: Artif. Humans 3:100113. doi: 10.1016/j.chbah.2024.100113
Kuznekoff, J. H., and Titsworth, S. (2013). The impact of mobile phone usage on student learning. Commun. Educ. 62, 233–252. doi: 10.1080/03634523.2013.767917
Loh, A., Law, E., Putra, A. S., Koh, E., Zuea, T. K., and Tat, K. E. (2021). “Innovation, design & entrepreneurship in engineering education,” in Advances in Engineering Education.
Marquez-Carpintero, L., Pina-Navarro, M., Suescun-Ferrandiz, S., Escalona, F., Gomez-Donoso, F., Roig-Vila, R., et al. (2023). Artificial intelligence-based system for detecting attention levels in students. J. Visual. Exp. JoVE 202:65931. doi: 10.3791/65931
Pape, S. J. (2004). Middle school children's problem-solving behavior: a cognitive analysis from a reading comprehension perspective. J. Res. Mathem. Educ. 35, 187–219. doi: 10.2307/30034912
Sapci, O., Elhai, J. D., Amialchuk, A., and Montag, C. (2021). The relationship between smartphone use and students academic performance. Learn. Individ. Differ. 89:102035. doi: 10.1016/j.lindif.2021.102035
Sharifzadeh, M. S., Damalas, C. A., Abdollahzadeh, G., and Ahmadi-Gorgi, H. (2017). Predicting adoption of biological control among iranian rice farmers: an application of the extended technology acceptance model (TAM2). Crop Prot. 96, 88–96. doi: 10.1016/j.cropro.2017.01.014
Suescun-Ferrandiz, S., Cazorla, M., and Gomez-Donoso, F. (2025). “Human activity recognition in the classroom using low-cost sensors,” in Proceedings of the 18th International Work-Conference on Artificial Neural Networks (IWANN).
Tang, H., Dai, M., Du, X., Hung, J.-L., and Li, H. (2023). Understanding college students' cognitive engagement in online collaborative problem-solving: a multimodal data analysis. Dist. Educ. 44, 306–323. doi: 10.1080/01587919.2023.2209025
Technology, I., and Association, E. E. (2020). Standards for Technological and Engineering Literacy: The Role of Technology and Engineering in Stem Education.
Teo, T. (2009). Is there an attitude problem? reconsidering the role of attitude in the tam. Br. J. Educ. Technol. 40, 1139–1141. doi: 10.1111/j.1467-8535.2008.00913.x
Teo, T., Doleck, T., Bazelais, P., and Lemay, D. J. (2019). Exploring the drivers of technology acceptance: a study of nepali school students. Educ. Technol. Res. Dev. 67, 495–517. doi: 10.1007/s11423-019-09654-7
Teo, T., and Noyes, J. (2011). An assessment of the influence of perceived enjoyment and attitude on the intention to use technology among pre-service teachers: a structural equation modeling approach. Comput. Educ. 57, 1645–1653. doi: 10.1016/j.compedu.2011.03.002
Tsai, T.-H., Lin, W.-Y., Chang, Y.-S., Chang, P., and Lee, M.-Y. (2020). Technology anxiety and resistance to change behavioral study of a wearable cardiac warming system using an extended tam for older adults. PLoS ONE 15:e0227270. doi: 10.1371/journal.pone.0227270
Turner, M., Kitchenham, B., Brereton, P., Charters, S., and Budgen, D. (2010). Does the technology acceptance model predict actual use? a systematic literature review. Inf. Softw. Technol. 52, 463–479. doi: 10.1016/j.infsof.2009.11.005
Varela, L. A. Y. (2004). Modelo de aceptación tecnológica (TAM) para determinar los efectos de las dimensiones de cultura nacional en la aceptación de las tic. Revista Internacional de Ciencias Sociales y Humanidades 14, 131–171. Available online at: https://www.redalyc.org/articulo.oa?id=65414107
Vaske, J., Beaman, J., and Sponarski, C. (2017). Rethinking internal consistency in cronbach's alpha. Leisure Sci. 39, 163–173. doi: 10.1080/01490400.2015.1127189
Venkatesh, V., and Davis, F. D. (2000). A theoretical extension of the technology acceptance model: four longitudinal field studies. Manage. Sci. 46, 186–204. doi: 10.1287/mnsc.46.2.186.11926
Ward, R., Davis, G. J., and Kane, V. E. (1985). Algorithm 633: an algorithm for linear dependency analysis of multivariate data. ACM Trans. Math. Softw. 11, 170–182. doi: 10.1145/214392.214403
Watty, K., McKay, J., and Ngo, L. (2016). Innovators or inhibitors? accounting faculty resistance to new educational technologies in higher education. J. Accoun. Educ. 36, 1–15. doi: 10.1016/j.jaccedu.2016.03.003
Weiss, G. M., Timko, J. L., Gallagher, C. M., Yoneda, K., and Schreiber, A. J. (2016). “Smartwatch-based activity recognition: a machine learning approach,” in 2016 IEEE-EMBS International Conference on Biomedical and Health Informatics (BHI) (Las Vegas, NV: IEEE), 426–429.
Wingo, N. P., Ivankova, N. V., and Moss, J. A. (2017). Faculty perceptions about teaching online: exploring the literature using the technology acceptance model as an organizing framework. Online Learn. 21, 15–35. doi: 10.24059/olj.v21i1.761
Wu, M.-Y., Chou, H.-P., Weng, Y.-C., and Huang, Y.-H. (2008). “A study of web 2.0 website usage behavior using TAM 2,” in 2008 IEEE Asia-Pacific Services Computing Conference (IEEE), 1477–1482. doi: 10.1109/APSCC.2008.92
Keywords: educational technology adoption, stem education, real-time behavior measurement, educational technology, student engagement
Citation: Marquez-Carpintero L, Gomez-Donoso F and Cazorla M (2025) Engineering young faculty's acceptance of real-time behavior measurement software. Front. Comput. Sci. 7:1565809. doi: 10.3389/fcomp.2025.1565809
Received: 05 February 2025; Accepted: 13 May 2025;
Published: 06 June 2025.
Edited by:
José Manuel de Amo Sánchez-Fortún, University of Almeria, SpainReviewed by:
Kevin Baldrich, University of Almeria, SpainFatma Sukmawati, Sebelas Maret University, Indonesia
Copyright © 2025 Marquez-Carpintero, Gomez-Donoso and Cazorla. This is an open-access article distributed under the terms of the Creative Commons Attribution License (CC BY). The use, distribution or reproduction in other forums is permitted, provided the original author(s) and the copyright owner(s) are credited and that the original publication in this journal is cited, in accordance with accepted academic practice. No use, distribution or reproduction is permitted which does not comply with these terms.
*Correspondence: Luis Marquez-Carpintero, bHVpc21hcnF1ZXpjYXJwaW50ZXJvQGdtYWlsLmNvbQ==
†These authors share senior authorship
 Luis Marquez-Carpintero
 Francisco Gomez-Donoso
 Miguel Cazorla