 Muhammad Syauqie1,2*
 Harry Patria3Sutanto Priyo Hastono2Kemal Nazaruddin Siregar2Nila Djuwita Farieda Moeloek4
- 1Department of Ophthalmology, Faculty of Medicine, Universitas Andalas, Padang, Indonesia
- 2Department of Biostatistics and Population Studies, Faculty of Public Health, Universitas Indonesia, Depok, Indonesia
- 3Strathclyde Business School, University of Strathclyde, Glasgow, United Kingdom
- 4Department of Ophthalmology, Faculty of Medicine, Universitas Indonesia, Cipto Mangunkusumo Hospital, Jakarta, Indonesia
Introduction: Uncorrected refractive errors are a leading cause of preventable vision impairment globally, particularly affecting individuals in low-resource regions where timely diagnosis and screening access remain significant challenges despite the availability of economical treatments.
Aim: This study introduces a novel deep learning-based system for automated refractive error classification using photorefractive images acquired via a standard smartphone camera.
Methods: A multi-branch convolutional neural network (CNN) was developed and trained on a dataset of 2,139 corneal images collected from an Indonesian public eye hospital. The model was designed to classify refractive errors into four categories: significant myopia, significant hypermetropia, insignificant refractive error, and not applicable to classified. Grad-CAM visualization was employed to provide insights into the model’s interpretability.
Results: The 3-branch CNN architecture demonstrated superior performance, achieving an overall test accuracy of 91%, precision of 96%, and recall of 98%, with an area under the curve (AUC) score of 0.9896. Its multi-scale feature extraction pathways were pivotal in effectively addressing overlapping red reflex patterns and subtle variations between classes.
Conclusion: This study establishes the feasibility of smartphone-based photorefractive assessment integrated with artificial intelligence for scalable and cost-effective vision screening. By training the CNN model with a real-world dataset representative of Southeast Asian populations, this system offers a reliable solution for early refractive error detection with significant implications for improving accessibility to eye care services in resource-limited settings.
Introduction
Uncorrected refractive errors are the leading cause of vision problems in children and adults. Worldwide, among the 338 million individuals with visual impairments, approximately 153 million are affected by uncorrected distance refractive errors, 8 million are blind, and 145 million experience considerable distance vision impairment (Holden, 2007; GBD 2019 Blindness and Vision Impairment Collaborators, 2021). Uncorrected refractive errors can lead to immediate and long-term consequences for children and adults, such as lost educational and job opportunities, reduced economic productivity for individuals, families, and communities, and a lowered quality of life (Resnikoff et al., 2008; Rahi et al., 2014).
Treatments for refractive errors, such as glasses, are economical and easily obtainable in high-income regions. However, refractive errors frequently go undiagnosed or are not referred for treatment, and some obstacles prevent people from accessing these services, especially in low-middle-income countries (Cochrane et al., 2010). Identifying significant refractive errors in communities remains a challenge in both diagnosis and public health. The challenge persists in finding a timely and cost-effective method to screen large groups of people. Screening approaches using professional equipment, such as autorefraction and photo-screening, have been developed to overcome the screening challenges in communities (Braverman, 2007). Such equipment entails high costs, the need for trained eye health professionals, and patient cooperation, which can be challenging to obtain in children. As a result, this poses difficulties for the screening of refractive disorders in communities in resource-limited areas (Yang et al., 2020).
Photoscreening equipment operates on a principle known as photorefractive assessment, which evaluates the red reflex pattern in the fundus. In addition, photorefractive assessment can be adapted to work with a smartphone camera to detect refractive errors. Characteristics, such as the position and size of the red reflex pattern, can provide insights into the specific type of refractive disorder that a person may have (Donahue, 2009; Cooper et al., 1996; Watts et al., 1999). Previous studies (Yang et al., 2020; Wang et al., 2024; Ma et al., 2020; Kiu et al., 2024) have shown the potential of smartphone-based photorefractive assessment in refractive error detection and vision screening initiatives, especially in regions with restricted access to eye care services. Nonetheless, this approach requires trained eye care professionals, particularly optometrists, to analyze the photorefractive images.
Artificial Intelligence (AI) can be a valuable supplementary resource developed to perform specific functions, like analyzing images and handling data processing. Integrating AI into smartphone-based photorefractive assessment could automate the analysis of photorefractive images, enabling accurate predictions of the type of refractive error. Deep learning (DL), a branch of artificial intelligence that employs convolutional neural networks (CNN) with several layers of algorithms, is used for image analysis’s advanced feature extraction. This technique enables machines to process and learn autonomously from raw data while examining intricate non-linear relationships. A significant advantage of applying DL algorithms in the medical field is their effectiveness in medical image analysis and screening. Incorporating AI, especially DL, can significantly improve the efficiency and accessibility of eye care services (Martinez-Perez et al., 2022; Keskinbora and Güven, 2020; Ng et al., 2021; Lim et al., 2022; Panda and Kumar Dhaka, 2022; Latif et al., 2019).
Previous studies have attempted to develop a DL model to predict refractive error. Varadarajan et al. (2018) created a deep-learning prediction model for estimating refractive error using retinal fundus images. The model demonstrates substantial accuracy in forecasting spherical power but lacks precision in predicting cylindrical power. Linde et al. (2023) used portable infrared smartphone-based fundus cameras to obtain red reflex images. However, the CNN model they developed using those images has a modest accuracy in predicting spherical power and a weak accuracy in predicting cylindrical power. Both studies utilized professional equipment or additional devices for smartphones to capture the necessary images for CNN model development. This can incur extra costs and limit their usefulness for vision screening. The development of the CNN model for refractive error prediction using images captured by the built-in smartphone camera has been demonstrated by Do et al. (2022), Fu et al. (2020), Chun et al. (2019), and Yang et al. (2020). These models show promising good accuracy in the validation phase. However, those models did not undergo the testing phase due to the small-size dataset limitation; thus, the actual accuracy score is not yet determined. The models were also trained with the eye image of the East Asian population, mainly of Chinese and Korean ethnicity. Hence, the validity and reliability of the models for use on another ethnicity still need further validation.
South East Asian populations have a high prevalence of refractive error and uncorrected refractive error (Cao et al., 2022; Pan et al., 2013; Hashemi et al., 2018). The vision screening program in this region is hindered by the lack of facilities and the scarcity of human resources. Smartphone-based photorefractive assessment incorporating artificial intelligence (AI) could be an interesting solution to expand the coverage of refractive error screening in this region. Developing an AI model, particularly the CNN model, which is trained with an image dataset derived from the Southeast Asia population, will provide a prompt and timely refractive error detection for this population. A previous study (Linde et al., 2023) shows low accuracy of the pre-trained CNN model for predicting refractive error using red reflex images. Therefore, we chose to develop a multi-branch CNN because single-branch CNNs were not able to differentiate well enough the subtle variations in the morphological patterns of the pupillary red reflex, which are crucial for differentiating the categories of refractive error like significant myopia and hypermetropia. The single-pathway architectures consistently failed to differentiate between subtle variations in pupillary red reflex patterns, resulting in a misclassification in refractive error classes. Finally, we selected the multi-branch CNN because this approach allows us to simultaneously capture features at multiple scales, which is essential for distinguishing crescent-shaped reflexes that often have overlapping characteristics between different refractive error classes. This study aimed to develop an automated deep learning-based prediction system to assess refractive error using photorefractive images of Indonesian patients taken with a smartphone. Another aim of this study is to train the Multi-branch CNN models using photorefractive images to detect different types of refractive errors, as we classified in our previous study (Syauqie et al., 2025), and test the models with different new datasets to establish the validity and reliability of this new CNN model.
Methods
Design and selection of subjects
This study design is a cross-sectional study. Subjects were patients who visited the outpatient clinic for refractive examination at a Public Eye Hospital in Pekanbaru, Riau Province, Indonesia, from January 2023 to June 2024 were invited to participate in this study. Patients with eyelid and ocular abnormalities that obscure the visual axis (cornea, lens, and vitreous), ocular infection or inflammation, and a history of ocular surgery were excluded from this study. A total of 952 patients, most whom were of Malay ethnicity, participated in this study. The mean age (S.D.) of the patients was 20.06 (11.27) years, and the median was 18 years (range 1–55 years).
The study protocol was reviewed and approved by the Ethics Committee of the Faculty of Public Health Universitas Indonesia (Ket-541/UN2.F10.D11/PPM.00.02/2024). All patients underwent complete ophthalmic examinations, including uncorrected visual acuity (UCVA), slit lamp biomicroscope examination, fundus photography, objective refraction using an autorefractor (Tonoref II, Nidek Co., Japan), and subjective refraction to determine best-corrected visual acuity (BCVA). After complete ophthalmic examinations, the patients underwent both eye images were captured in a dark room with a smartphone camera.
Workflow of the CNN model development
The workflow for the Multi-branch CNN model begins with the acquisition of pupillary red reflex images using a smartphone (Figure 1). These images were preprocessed to ensure uniformity, including resizing to 256 × 256 pixels and normalization to a range of [0,1][0,1][0,1]. Data augmentation techniques, such as rotation, flipping, and zooming, are applied to increase the diversity of the dataset and improve the model’s robustness.
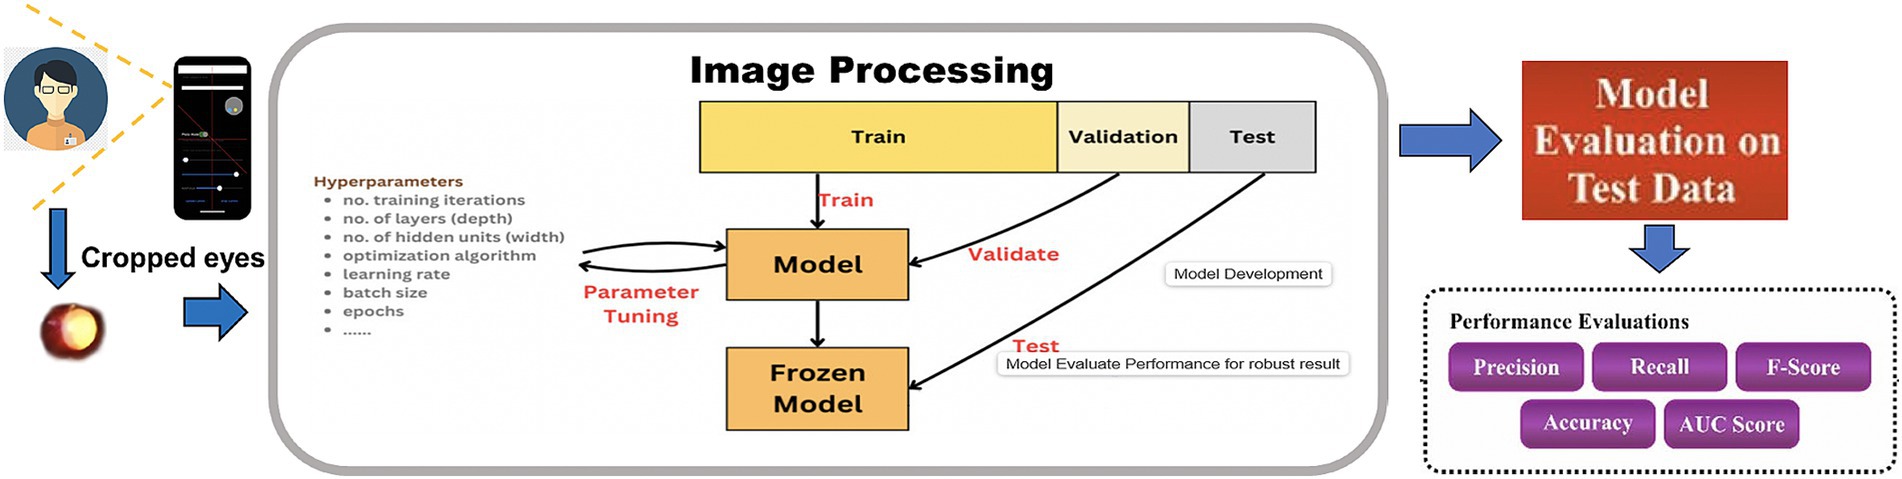
Figure 1. Workflow of multi-branch CNN model development.
The preprocessed images are fed into the selected CNN architecture—1-branch, 2-branch, or 3-branch—for feature extraction and classification. Each architecture processes the input differently, with the 3-branch model providing the most comprehensive feature representations. The classification output predicts one of the following four classes: “Not Applicable to Classified,” “Significant Hypermetropia,” “Insignificant Refractive Error,” and “Significant Myopia.”
The workflow culminates in model evaluation, where metrics such as accuracy, precision, recall, and F1-score are computed. The results are visualized through confusion matrices, ROC curves, and training-validation plots to assess model performance. The successful deployment of the model on a smartphone platform represents the final step, enabling real-time, low-cost refractive error screening in clinical and community settings.
Data acquisition
Eye images were acquired with a 12-megapixel smartphone camera (iPhone 6s, Apple Inc., California, United States) at a 50–60 cm distance from the front of the patient in a dark room (<10 lux) and using an external light source to the camera (Figure 2A). The smartphone was placed straightforward to the face of the patient without angulation. The patient’s gaze is slightly upward (15 degrees) during image capture (Ik et al., 2015). The smartphone’s built-in flash, which was present next to the left of the camera lens, was used as the light source for image capturing, wherein light entered the eye through the pupil, reached the retinal surface, and then reflected to the camera lens. Reflected light from the eye is shown as a characteristic crescent-shaped red reflex that appears in the pupil, which is called the pupillary red reflex (Chun et al., 2019). All the images were acquired in the same setting (in a dark room, in portrait orientation, and without instilling the cycloplegic agents) and done with one operator (MS) (Figure 2B). All images, each containing images of both eyes with pupillary red reflex, were stored in the database with ophthalmology examination records (Figure 2C).
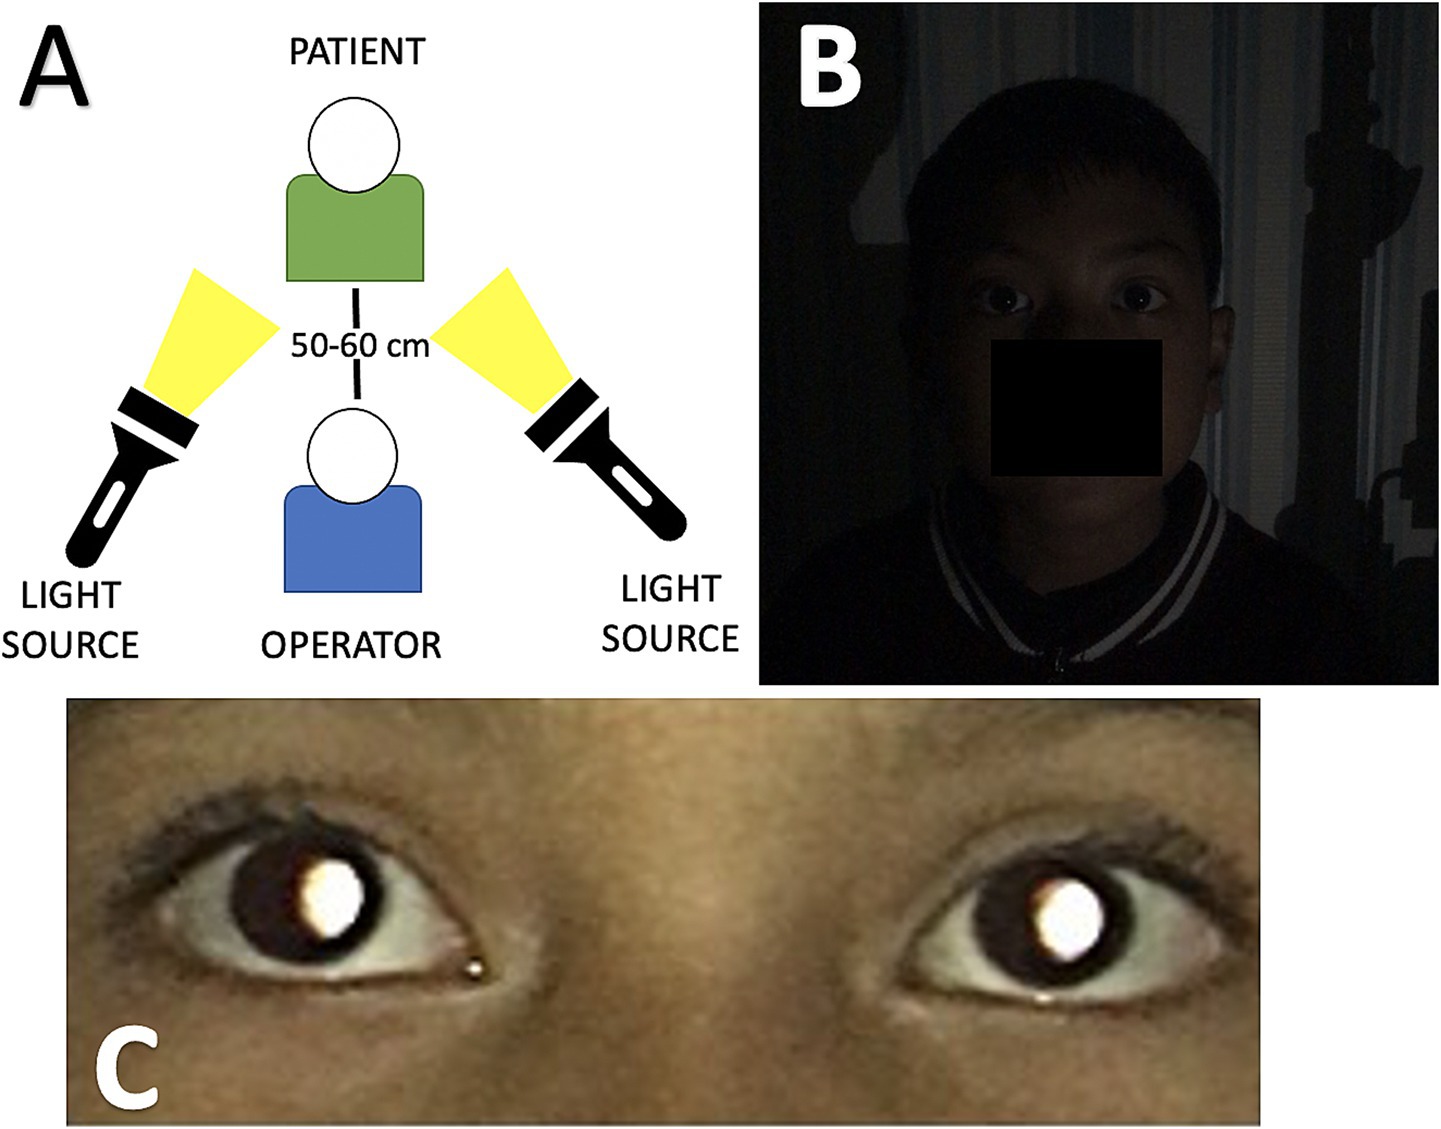
Figure 2. (A) Data acquisition process environment setting during image capture, the distance between the operator and the patient is about 50–60 cm. An external light source is positioned beside the operator and faces the patient. (B) Dim lightning conditions and portrait orientation before the image is captured. (C) The image captured by the smartphone shows the pupillary red reflex in both eyes.
Data preprocessing and augmentation
Data preprocessing ensures that the input images are standardized for optimal training performance. Each image was cropped to extract only the corneal portion so that each image could produce two corneal images. Each corneal image has a 72 × 72 pixels resolution. Each corneal image is labeled with one type of refractive error classification based on findings in our previous study (Syauqie et al., 2025). Corneal images with the same refractive error classification were stored in one folder. The images were labeled considering the red reflex pattern in the pupil, which indicates significant myopia, significant hypermetropia, and insignificant refractive error. Corneal images with the absence of pupillary red reflexes were labeled as not applicable to classification (Figures 3A–D). In addition to the red reflex pattern in the pupil, the ground truth of each type of refractive error classification also considers the spherical equivalent (SE) dioptric power acquired from objective refractive using an autorefractor (Tonoref II, Nidek Co., Japan) and subjective refraction examination. From the findings in our previous study (Syauqie et al., 2025), we found a significant correlation between the red reflex pattern and spherical equivalent dioptric power (p < 0.001). The crescent red reflex pattern, which is dominant on the right side of the pupil, has a spherical equivalent of −5.977 ± 3.655 diopters (95% CI: −6.393 to −5.562); the crescent red reflex pattern, which is dominant on the left side of the pupil, has a spherical equivalent of +1.361 ± 1.925 diopters (95% CI: 0.941–1.782); and the red reflex pattern, which occupies the entire pupil area, has a spherical equivalent of −1.174 ± 1.325 diopters (95% CI: −1.334 to −1.015). These results support the use of subjective refraction and autorefractor data for refractive error type labeling, which can be further used for model training and testing.
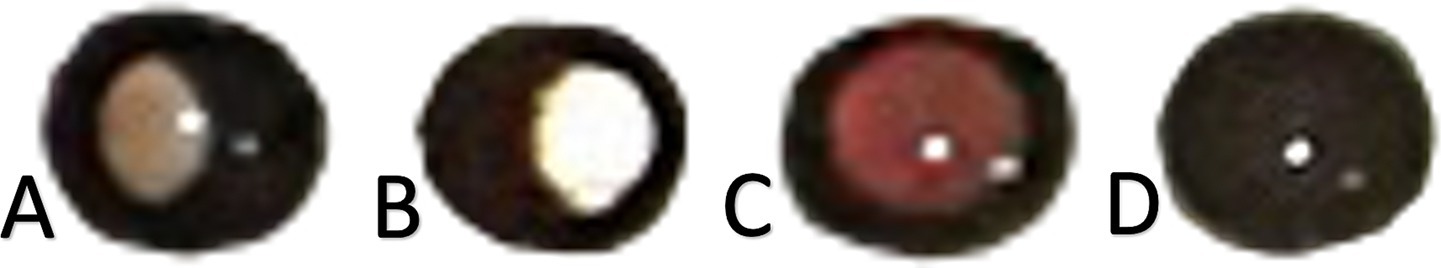
Figure 3. (A) Corneal images with a specific pupillary red reflex marked certain types of refractive error. (B) Corneal image of significant myopia. (C) Corneal image of significant hypermetropia. Corneal image of an insignificant refractive error. (D) Corneal image showing the absence of pupillary red reflex.
We classified the refractive error type according to its SE dioptric power. Significant myopia was observed if the patient’s eye had a dioptric power below −3.00 Diopter and the crescent red reflex pattern was dominant on the right side of the pupil; significant hypermetropia was observed if the dioptric power was above +1.00 Diopter and the crescent red reflex pattern was dominant on the left side of the pupil; and insignificant refractive error was observed if the dioptric power was between 3.00 and 0.50 Diopter and between +0.50 and +1.00 Diopter and the red reflex pattern occupied the entire pupillary area (Figures 3A–C). The dataset labeling was done by one operator (MS) to avoid bias in labeling the dataset. This procedure ensures that each corneal image is assigned correctly to its refractive error type labeling.
The first step involves preprocessing the raw dataset Dinput, which comprises corneal images for k = 1,…, N. The corneal images is normalized to a pixel range of [0,1] to stabilize gradients during training and accelerate convergence (Krizhevsky et al., 2012), represented mathematically as described by the Equation 1 given below.
Typical input normalization was applied by rescaling the pixel values in [0,255] to [0,1], as shown in Equation 1. The normalization of corneal images to a pixel range of [0,1] is a standard and essential pre-processing technique in deep learning for medical image analysis. Normalization ensures consistency across images, minimizes the influence of varying imaging conditions, and enables the network to learn more robust and generalizable features by providing a consistent scale for all input pixel intensities. The images are then cropped to focus on the corneal region and resized to 72 × 72 pixels, ensuring that the model processes inputs of consistent size, balancing computational efficiency and the retention of significant features (Simonyan and Zisserman, 2014).
Data augmentation was performed for the significant hypermetropia class because the number of images is significantly low compared with other classes, which could affect the accuracy of the model. Initially, the significant hypermetropia class had 237 images (12.3%); the significant myopia class had 586 images (30.9%); the insignificant refractive error class had 538 images (27.9%), and the not applicable to classified class had 555 images (28.9%). Data augmentation for the significant hypermetropia class was performed by resizing the original image (zoom-in at 20%), resulting in 460 images.
Data augmentation techniques are used to improve model generalization and address class imbalance. This augmentation enhances the dataset’s diversity, reducing the risk of overfitting (Shorten and Khoshgoftaar, 2019). Data augmentation introduces synthetic variability into the dataset. Data augmentation techniques, including transformations T such as rotation (0 € [−20°, 20°]), zooming (z Є [0.8, 1.2]), and vertical flipping, are applied to the images as described by the Equation 2.
where T augments the original image I into multiple augmented variants. This ensures that the model encounters a diverse set of inputs during training, reducing overfitting.
A total of 2,139 images were acquired after data augmentation, and the proportion of images between each class was quite similar; the significant hypermetropia class had 21.5% of total images; the significant myopia class had 27.4% of total images; the insignificant refractive error class had 25.2% of total images, and the not applicable to classified class had 25.9% of total images. The encoding for each class is set as follows: 0 for the not applicable to classified class, 1 for the significant hypermetropia class, 2 for the insignificant refractive error class, and 3 for the significant myopia class (Figure 4). Finally, the dataset is divided into training (70%), validation (15%), and test (15%) subsets following standard practices for model evaluation (Heaton et al., 2018), denoted as , , and , respectively. This partitioning ensures that the model is trained and validated on distinct data while reserving unseen examples for unbiased evaluation. The final distribution of classes in each subset is balanced through augmentation, which is critical for mitigating biases during model training.
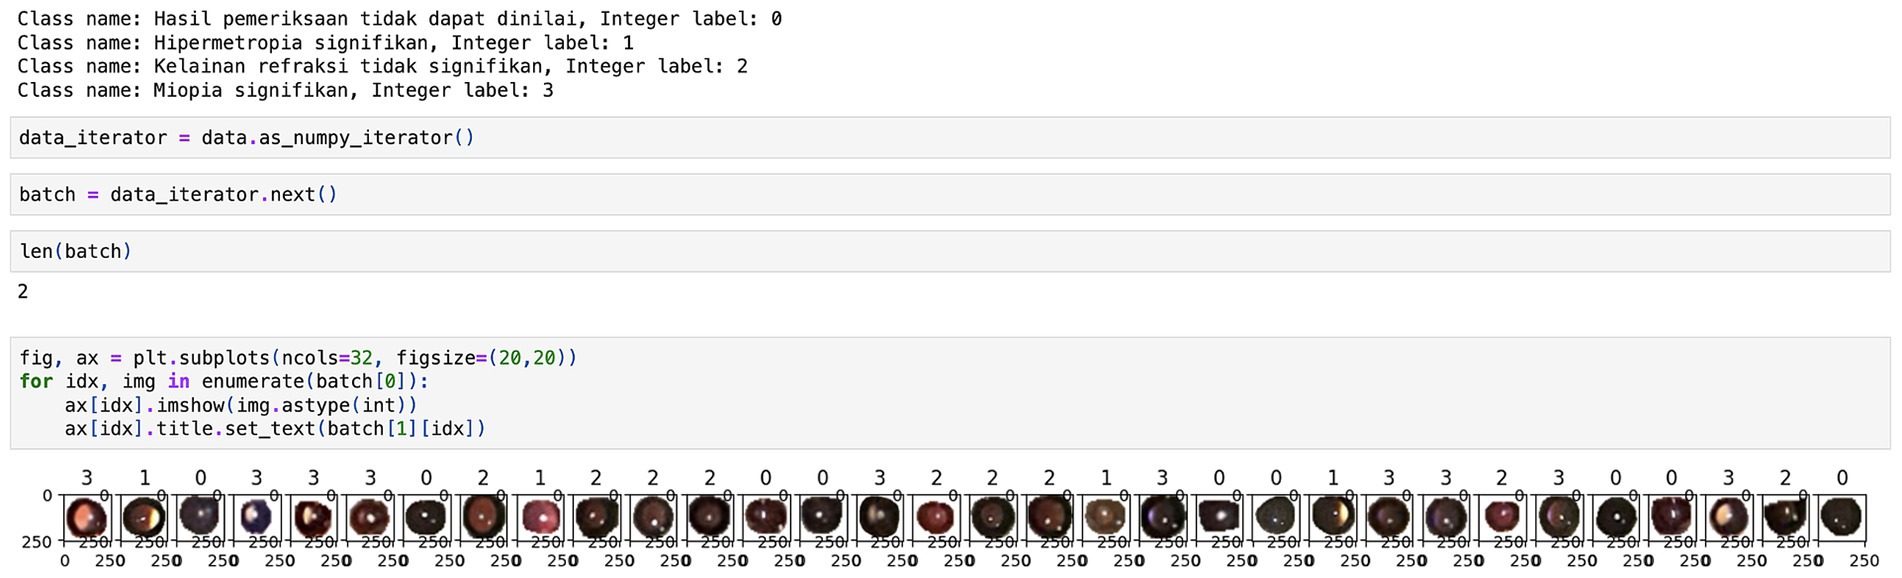
Figure 4. Encoding of corneal images according to their class.
Model architecture
The model is designed as a multi-branch CNN with three branches. The multi-branch architecture enhanced the model’s capability to process features at multiple resolutions. Each branch independently captured spatial patterns, and their combined outputs improved feature extraction, particularly for classes with subtle distinctions, such as insignificant refractive errors.
The CNN model is initialized to extract the hierarchical features critical for refractive error classification. The architecture consists of convolutional layers (Conv2D) followed by ReLU activations and MaxPooling layers. The kernel size taken has been 3 × 3, uniformly with an input image size of 256 × 256 and batch size of 32. Convolutional layers learn spatial filters to extract low-level features like edges, and progress to high-level features (LeCun et al., 2015). Batch normalization improves convergence and mitigates internal covariate shifts (Ioffe and Szegedy, 2015). The convolutional layer described here uses a ReLU (i.e., Rectified linear unit (RU)) activation function. The equation for the ReLU activation function is described in Equation 3.
ReLU has been used to introduce nonlinearity in the form of half-rectified (from the bottom). ReLU gives a zero output for any vector value that is less than 0, while it behaves as an identity function for any vector value that is equal to 0 or greater than 0. It and its derivatives are both monotonic functions. Nevertheless, the fact that all negative values become 0 reduces the functionality of the models that train from data. Hence, it has been used in conjunction with other activation functions. The output layer uses four neurons because four classes can be predicted using the softmax function. The equation for the softmax activation function in the output layer computes class probabilities for multi-class classification and is mathematically described in Equation 4.
We use adam as the optimizer and sparse_categorical_cross-entropy as the loss function to measure the prediction error because we encoded our dataset using ‘tf.keras.utils.image_dataset_from_directory’, which returns an integer label instead of one hot encoding (Kingma and Ba, 2014). We also want to use accuracy as the metrics. The Adam optimizer with an initial learning rate provided stable convergence and accelerated training. Training consisted of 10 epochs which is extensible to 100 epochs, and EarlyStopping callback with patience = 20 was used to monitor validation accuracy. EarlyStopping is used to restore the best weights when validation accuracy does not improve after 20 epochs and the training is stopped. The use of EarlyStopping ensured that the model converged efficiently, preventing overfitting. By restoring the best weights after 20 epochs of non-improvement, the model maintained a balance between training and validation performance. We experimented with learning rates and optimizers (we chose Adam due to stable convergence) and dropout rates (settling on 0.5 to avoid overfitting). We experimented with different layer configurations, finally deciding on three convolutional layers with 32, 64, and 128 filters with MaxPooling, providing the optimal balance between model capacity and generalization.
Model training
The CNN is trained over E epochs using batch size B. Early stopping is applied to monitor validation loss and halt training when no improvement is observed for P consecutive epochs (Prechelt, 2000). This prevents overfitting and ensures efficient training. The model’s weights are updated iteratively using the Adam optimization algorithm, which adapts the learning rate based on gradient updates as described by the Equation 5:
Model evaluation
Model evaluation is performed on the test set using standard metrics. The confusion matrix is computed as described by the Equation 6:
Model explainability
Grad-CAM (Gradient-weighted Class Activation Mapping) is applied to enhance model interpretability by visualizing regions in the input image that contribute most to predictions. Grad-CAM heatmaps illustrate the corneal image regions that contribute most significantly to the predictions. For instance, the heatmaps for significant myopia consistently highlighted crescent-shaped red reflex patterns on the right side of the pupil, aligning with the ground truth. This level of interpretability enhances the model’s acceptance in clinical settings, as it provides insights into the decision-making process. Grad-CAM computes the gradients GGG of class scores ScS_cSc with respect to the last convolutional feature map AAA, producing class-specific heatmaps as described by the Equation 8 given below:
These visualizations help clinicians interpret the model’s focus, improving trust, and facilitating adoption in real-world ophthalmic diagnostics (Rs et al., 2020).
Model deployment
The final CNN model is converted to TensorFlow Lite format , optimizing it for mobile deployment. This lightweight version retains accuracy and enables real-time inference on smartphones. Techniques like quantization further reduce the model size and computational requirements (Abadi et al., 2016). The optimized is integrated into smartphone applications to provide a scalable, low-cost solution for vision screening in resource-limited regions. Table 1 summarizes the pseudocode of each step in CNN model development.
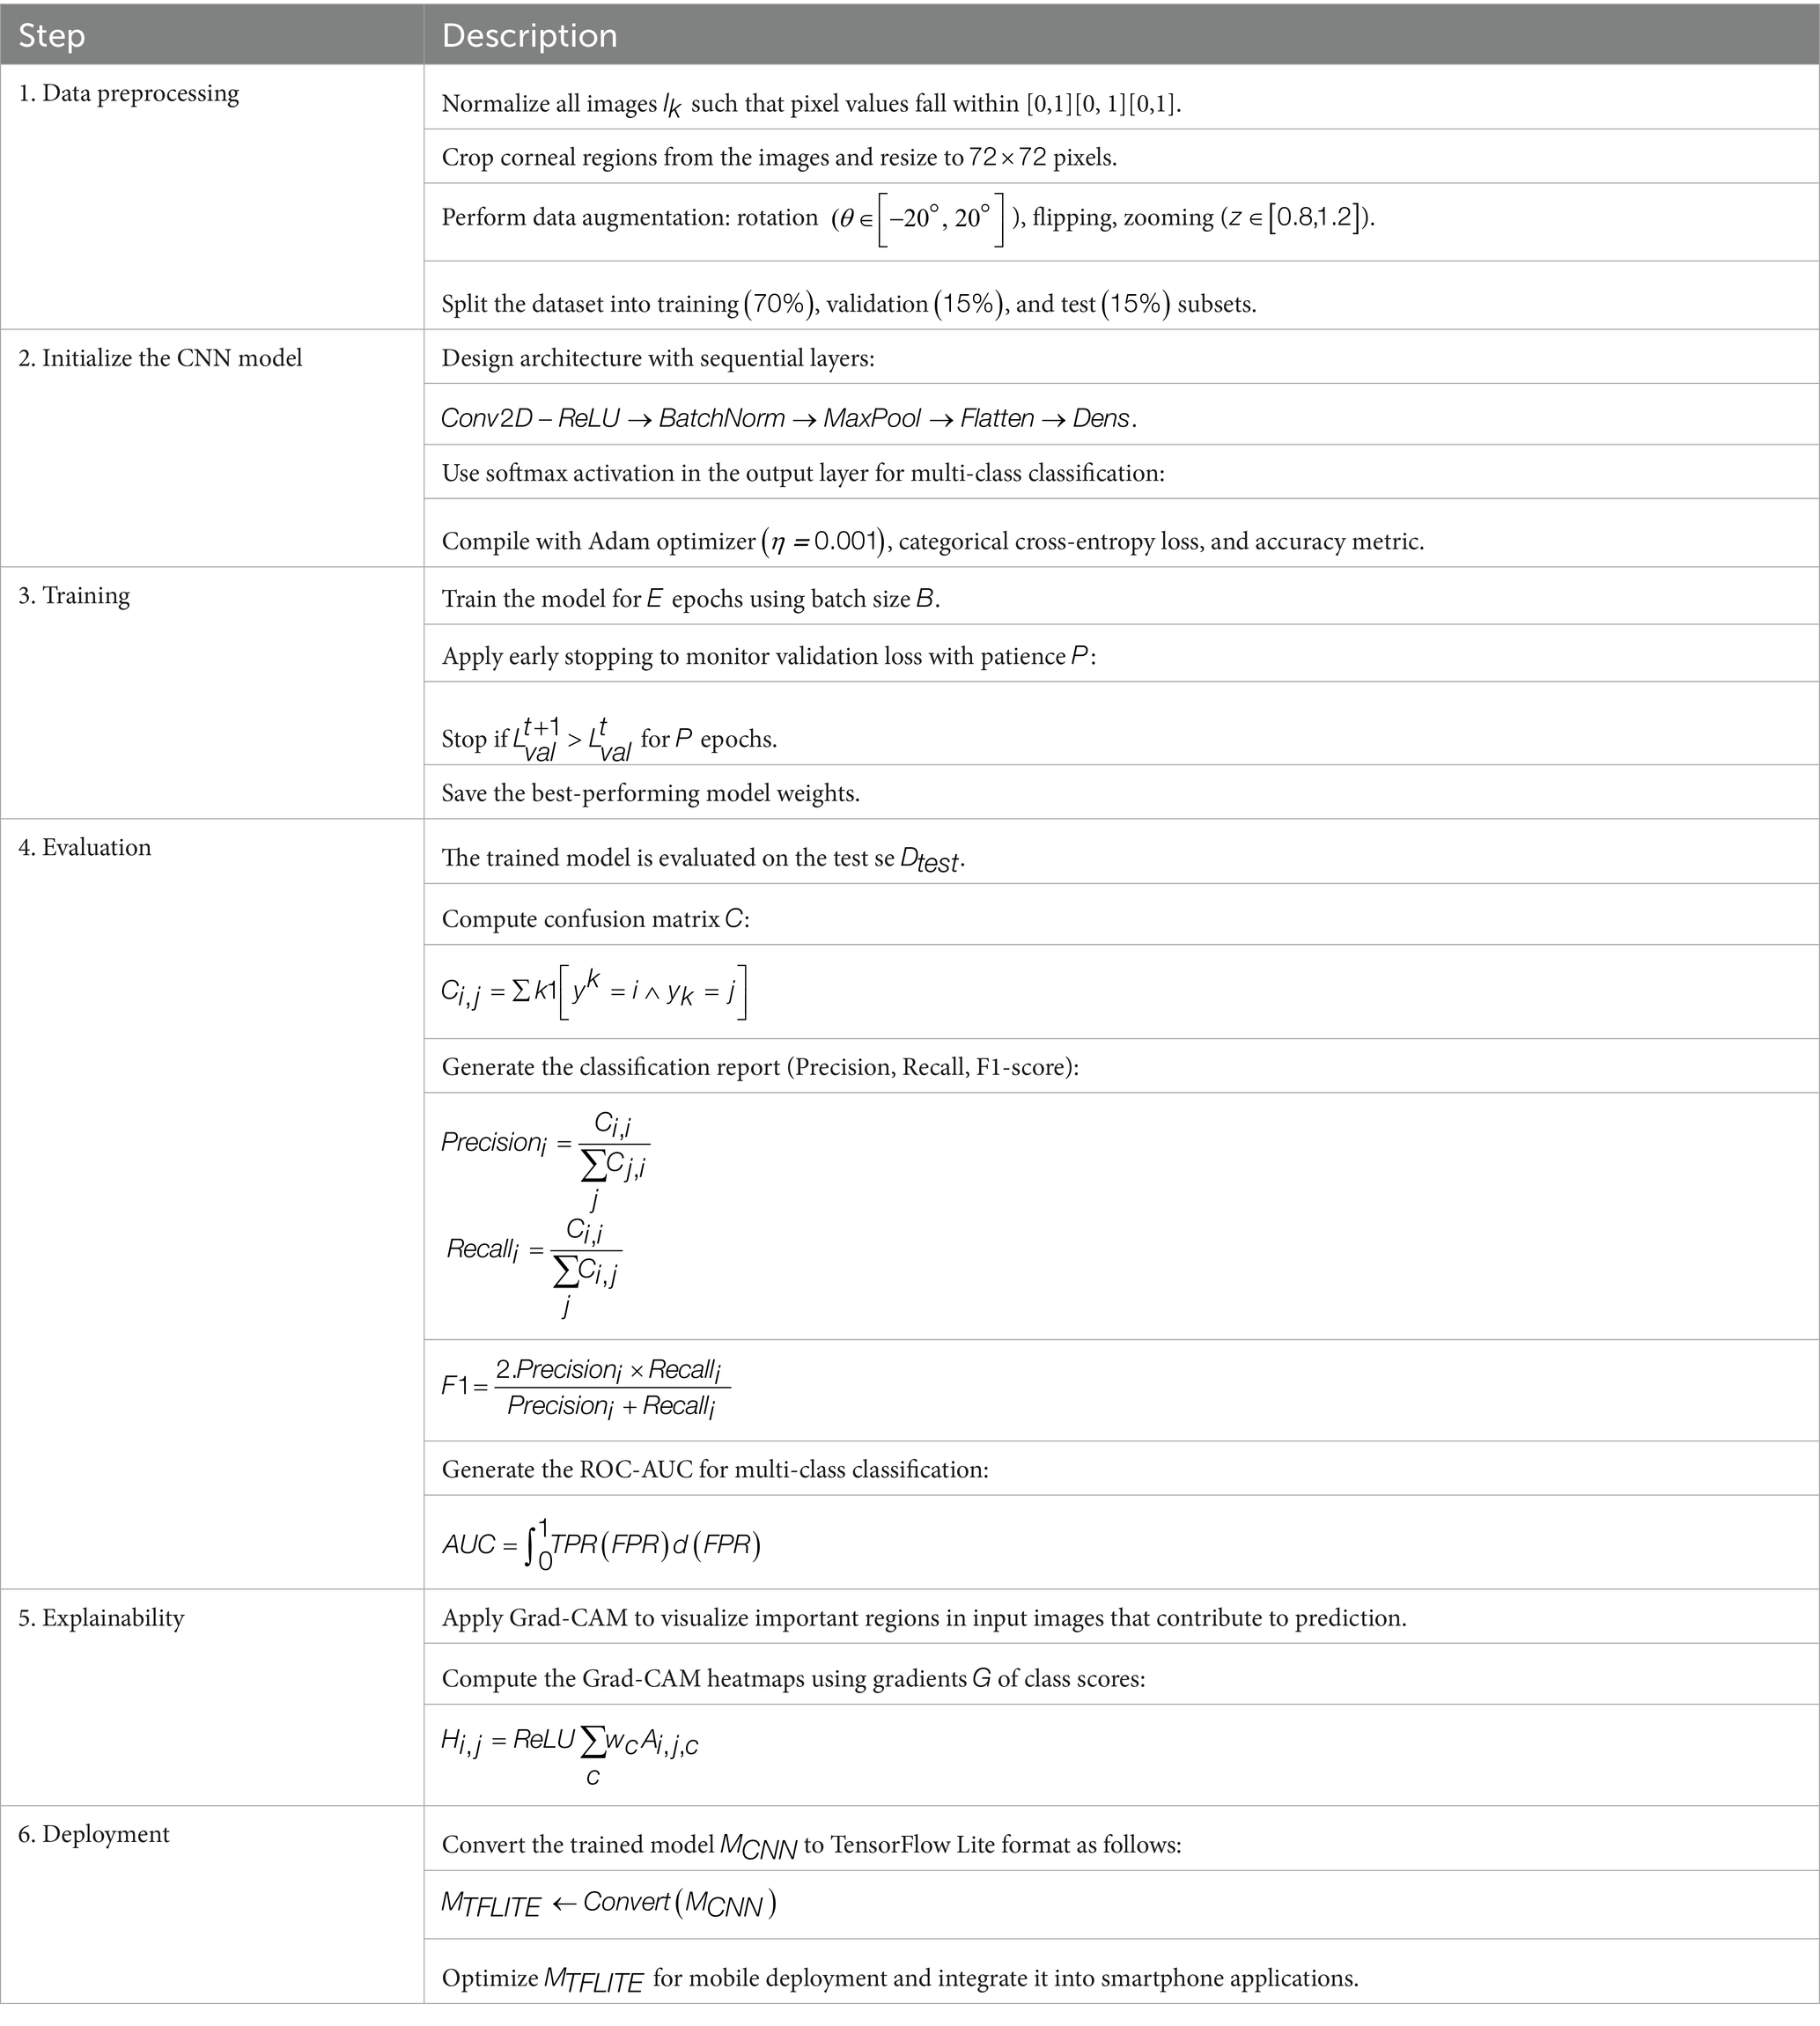
Table 1. Pseudocode of corneal image detection.
Results and discussion
The CNN model demonstrated strong performance across all evaluation metrics, achieving an overall testing accuracy of 91%. The inclusion of three convolutional layers with ReLU activation and MaxPooling, followed by fully connected dense layers, allowed the network to extract hierarchical features relevant to the classification task. Categorical cross-entropy was used as the loss function to ensure proper gradient propagation for multi-class classification. The model shows excellent results in the testing phase. The model can predict most images according to the type of refractive error, as shown in the confusion matrix (Figure 5, Left). The model also effectively distinguishes one class from another and has a perfect score (AUC score: 0.9896). This excellent score proves that this model could correctly predict the type of refractive error based on corneal images captured by a smartphone camera. The performance metric of this model shows high scores in all classification metrics.
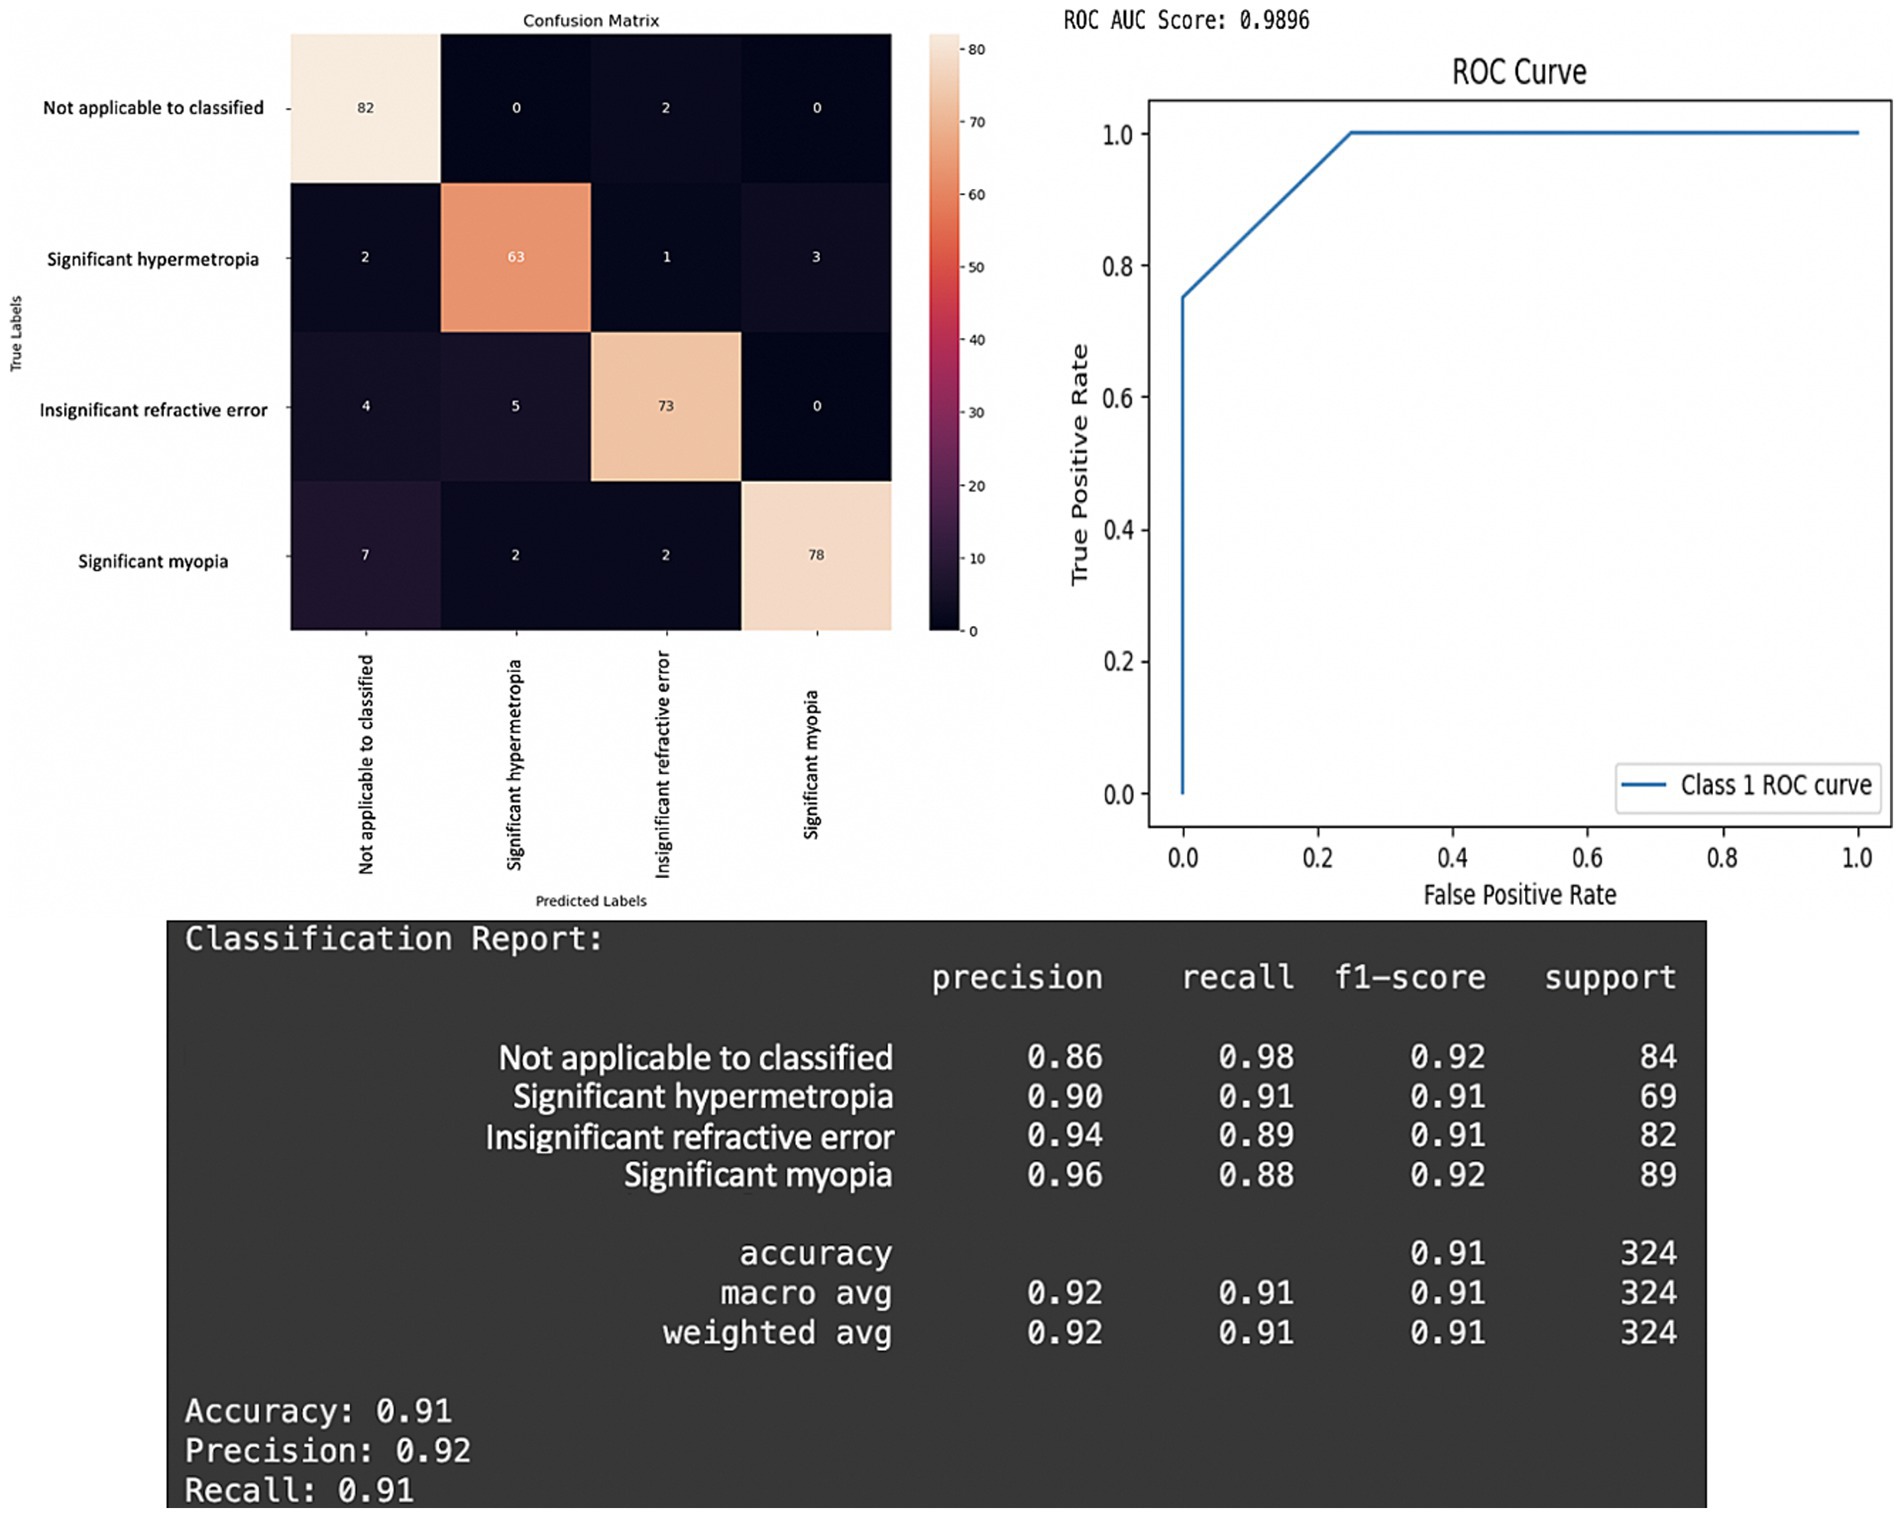
Figure 5. Performance of the CNN model in the testing phase. Left: Confusion matrix for prediction result of four classes of refractive error. Right: Receiver operating characteristic (ROC) curve for prediction of refractive error based on pupillary red reflex image. The ROC area under the curve (AUC) score is 0.9896. Bottom: Metrics results of the CNN model classification report.
The confusion matrix revealed that the model performed particularly well in predicting each class (Figure 5, Left). The model accuracy is 91% (95% CI: 87.9–94.1%), which means that the model can correctly predict 91% of all predictions of the refractive error type. The overall precision of the model was 92% (95% CI: 89.0–95.0%), and the precision of the significant myopia class was the highest 96%. This means that the model can correctly predict 96% of 89 corneal images in the testing dataset with the crescent red reflex pattern dominant on the right side of the pupil as significant myopia, indicating that the majority of the predictions for this class were correct.
The overall recall of the model is 92% (95% CI: 87.9–94.1%), and the recall of the not applicable to classified class is the highest 98%, signifying the model’s strong ability to identify images where the pupillary red reflex was absent or could not be classified. This means that the model can correctly predict 98% of the 84 corneal images in the testing dataset with an absence of pupillary red reflex as not applicable to classification (Figure 5). The high recall scores achieved by the 3-branch model, for the “Not Applicable to Classified” category, underscore its reliability in identifying cases where refractive errors cannot be determined. This is of critical importance in clinical settings because failure to detect such cases could result in delayed or improper interventions. Moreover, the model’s high precision (96%) for “Significant Myopia” and “Significant Hypermetropia” ensures that most positive predictions correspond to true positives, reducing unnecessary follow-up diagnostics.
The model also has a high F1 score of 91% (95% CI: 87.9–94.1%). This means that the model performs well in labeling a patient with refractive error or not. If the model labels a patient with significant myopia, there is a high chance that the patient truly has significant myopia. If the model labels a patient as not applicable to classification, there is a high chance that the patient does not have a refractive error or has another eye disease that impedes the pupillary red reflex.
Figure 5 highlights the confusion matrix, the Receiver Operating Characteristic (ROC) curve, and detailed classification report. The confusion matrix shows the true vs. predicted classifications for the four classes as follows: “Not Applicable to Classified,” “Significant Hypermetropia,” “Insignificant Refractive Error,” and “Significant Myopia.” The results reveal strong classification performance, with particularly high recall (98%) for the “Not Applicable to Classified” category, indicating the model’s ability to accurately identify the absence of refractive error or any patterns that preclude classification. The classification report below confirms this trend with high precision (96%) and F1-scores (0.92) for “Significant Myopia” and balanced metrics across all categories. The overall accuracy of 91% and weighted precision of 92% further emphasize the reliability of the 3-branch CNN architecture. The results argue in favor of the 3-branch model’s capacity to generalize across varying image complexities. The balanced recall and precision scores ensure that the model avoids bias toward any specific class, a challenge often observed in smaller or imbalanced datasets.
The ROC curve in Figure 5, Right, demonstrates near-perfect discrimination, with an AUC score of 0.9896 (95% CI: 0.976–0.996), indicating that the model can effectively and confidently separate positive and negative classes for each category with high confidence. This is critical in medical applications where the cost of false negatives can outweigh that of false positives. The ROC curve shows a one-vs-rest multi-class classification in our model. “Class 1” refers to the significant hypermetropia class. The ROC illustrates the model’s ability to differentiate cases of “significant hypermetropia” (Class 1) from all other conditions (i.e., not applicable, insignificant refractive error, and significant myopia). Class 1 (significant hypermetropia) was treated as the “positive” class, whereas all other classes combined were treated as the “negative” class. The reported ROC area under the curve (AUC) score of 0.9896 quantifies this discriminatory power for Class 1.
The appearance of only three distinct segments (or roughly four distinct points including the origin and (1,1)) in the ROC curve, giving it a very pronounced “staircase” or “step-like” appearance rather than a smooth curve, arises when the classifier’s output probabilities (or confidence scores) for the “positive” class are highly discrete or coarsely quantized, rather than spanning a continuous range. The most probable reason for such a sharply segmented curve is that the model, when predicting the probability of a sample belonging to “Class 1,” generates only a very small number of unique confidence scores across the test set. The test set for “Class 1” is relatively small; thus, the number of distinct prediction scores for these samples will naturally be limited, leading to fewer distinct (True Positive Rate, False Positive Rate) points and a more segmented curve. A smooth ROC curve is often expected and implies finely-graded confidence scores. However, a segmented curve does not indicate a fundamental flaw in the model’s performance. This reflects the distinct nature of the model’s output probabilities for the given test set. The area under the curve (AUC) remains the gold standard metric because this model shows a perfect AUC score and excellent discriminatory power between classes.
The 1-branch CNN architecture is the simplest model in this study, designed to sequentially extract features from the input image (Figure 6). It comprises a single pipeline in which convolutional layers detect spatial patterns in the corneal images. The network’s structure is straightforward, starting with a convolutional layer followed by max-pooling. The initial layers capture low-level features, such as edges and textures, which are essential for identifying general patterns in the red pupillary reflex. Higher-level features, such as the symmetry or orientation of the reflex, are captured as the input progresses through additional convolutional and pooling layers.
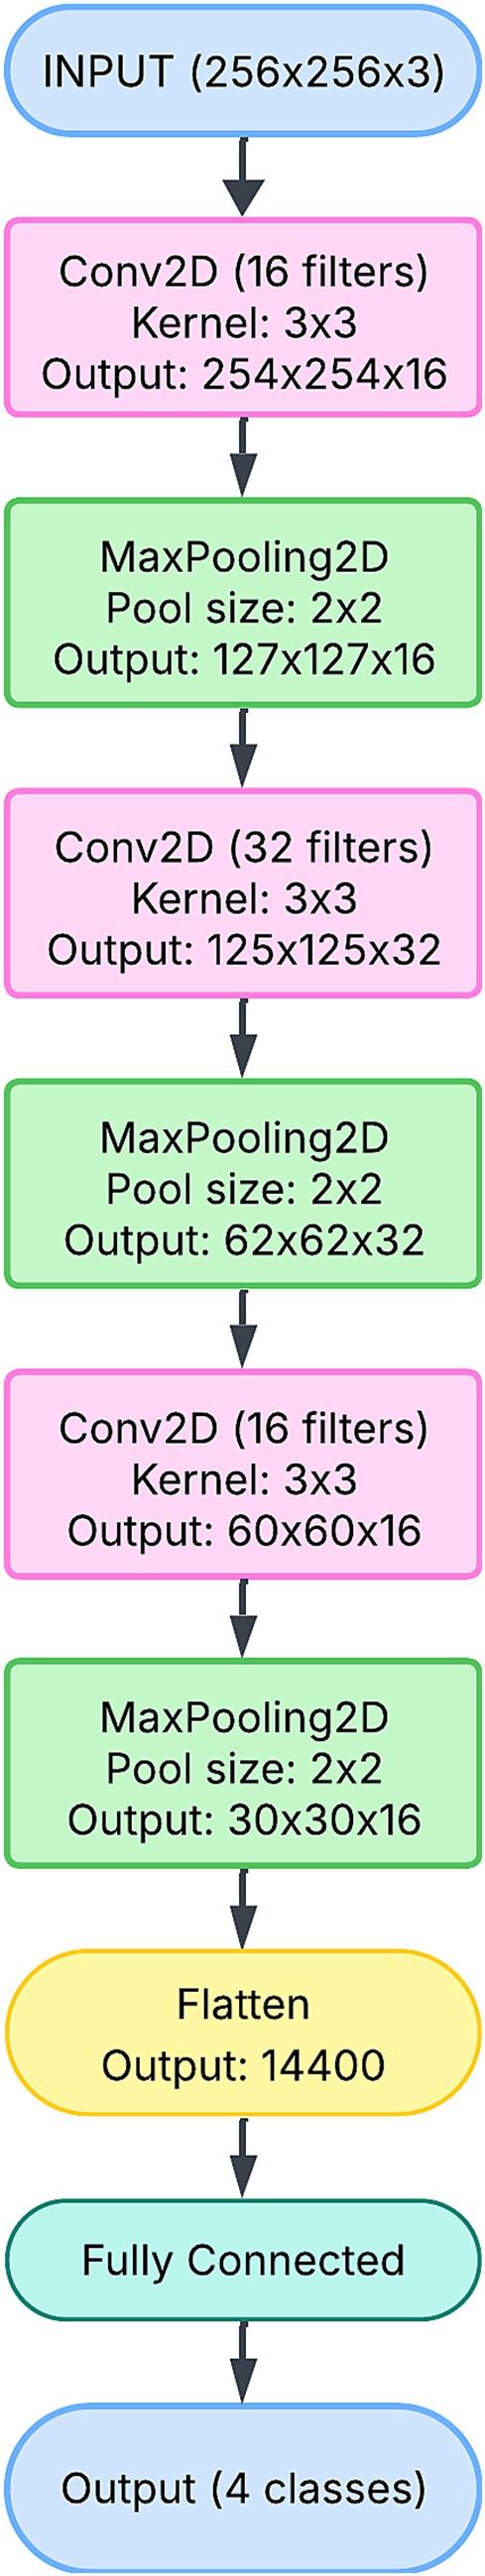
Figure 6. One-branch CNN model diagram chart.
The simplicity of the 1-branch CNN ensures computational efficiency, as reflected in its relatively small parameter count (approximately 11 million). However, this simplicity comes at a cost: the model is unable to capture the multi-scale features that are often necessary for distinguishing subtle differences between refractive error classes. For instance, overlapping patterns between “Insignificant Refractive Error” and “Significant Hypermetropia” may remain indistinguishable due to the lack of diversity in the feature extraction process.
Although the model demonstrated stable training and validation curves, as shown in Figures 7A,D, its overall performance metrics lagged behind the more complex architectures. The inability to capture diverse and hierarchical features limited its precision and recall, particularly in complex cases. Thus, while the 1-branch model provides a baseline for comparison, its architectural simplicity limits its effectiveness.
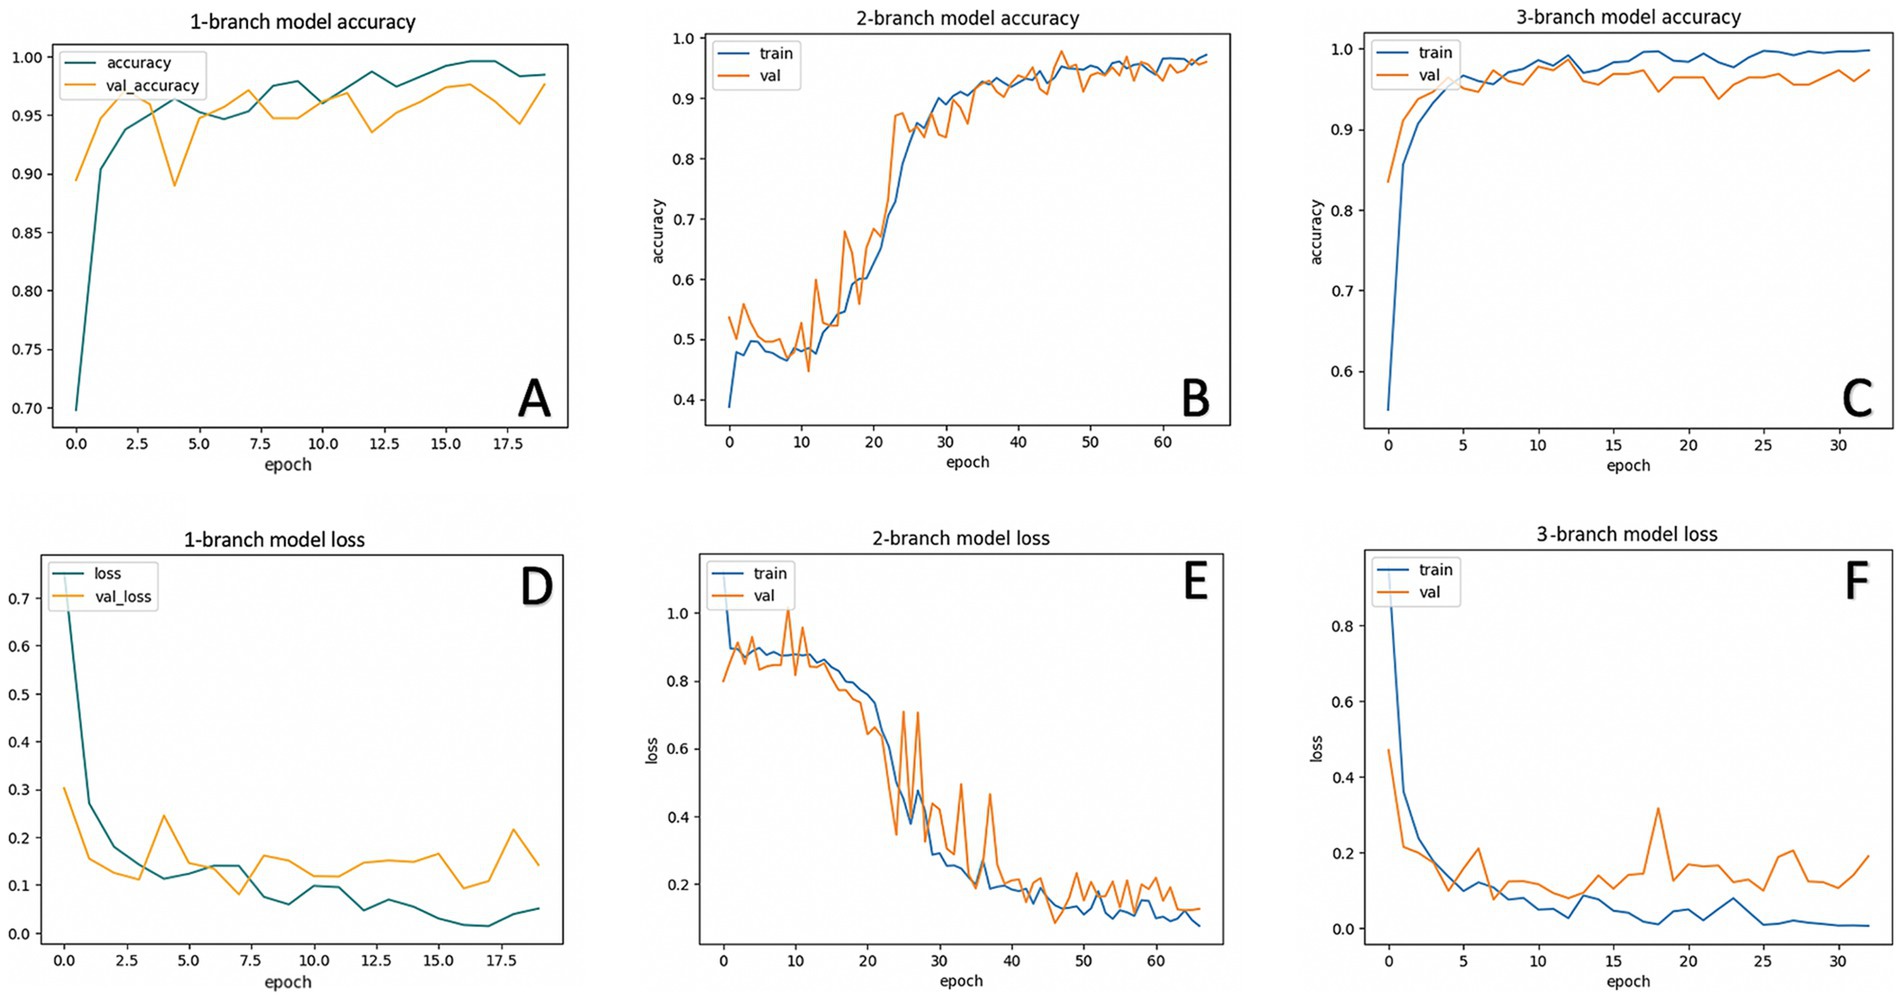
Figure 7. Accuracy and loss in each model. Training and validation accuracy of one-branch (A) two-branch (B) and three-branch (C) CNN models. Training and validation loss of one-branch (D), two-branch (E), and three-branch (F) CNN models.
The 2-branch CNN introduces additional complexity by splitting the input data into two parallel pipelines (Figure 8). Each branch independently processes the input, capturing distinct features at different spatial scales. This design enables the network to learn complementary feature representations, which are later combined through a concatenation layer. The branches leverage deeper convolutional and pooling layers, allowing them to detect both localized patterns (e.g., crescent-shaped reflexes) and broader contextual features (e.g., reflex symmetry).
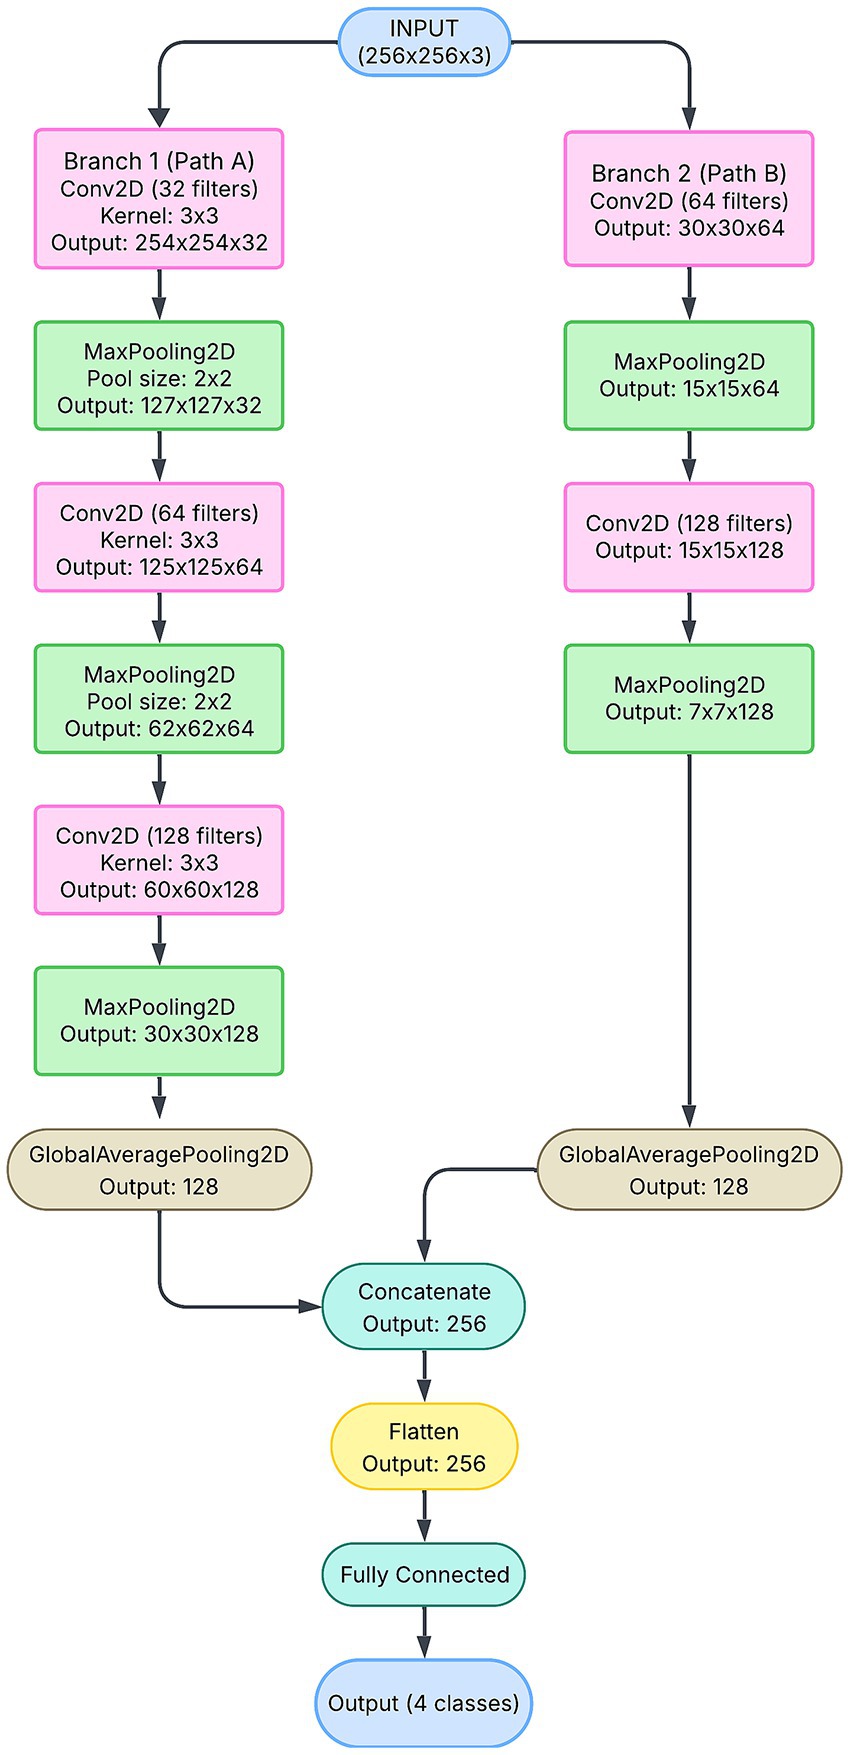
Figure 8. Two-branch CNN model diagram chart.
However, the intermediate complexity of the 2-branch model presents challenges. The model struggles to balance feature extraction capacity with generalization, as reflected in its unstable validation accuracy and loss curves (Figures 7B,E). The lack of a third branch to diversify feature learning pathways results in redundant or insufficient feature representations. The validation accuracy of the 2-branch model varied, which indicated the difficulty in trading feature diversity and parameter efficiency. Problems with the two-branch model are due to a lack of diversity in pathways. It could not adequately separate the feature space for our four-class problem and caused errors in distinguishing between classes, leading to inconsistent validation performance. This limitation is particularly evident in the confusion matrix, where the model misclassifies overlapping categories such as “Significant Hypermetropia” and “Insignificant Refractive Error.”
The 2-branch architecture also exhibits a higher tendency to overfit compared to the 1-branch model. Although its parameter count (∼3.8\sim 3.8 ∼ 3.8 million) is significantly lower than that of the 1-branch CNN, the model’s instability suggests that additional pathways or regularization strategies are necessary to fully realize its potential. Thus, while the 2-branch model demonstrates improvement over the 1-branch model in theory, its practical performance falls short due to architectural limitations. Our 3-branch model overcomes this by concatenating at different scales of features, and a steady validation accuracy of 98.66% and test accuracy of 91% are achieved in this way. The suboptimal performance of the two-branch model highlights the challenges associated with intermediate architectural designs. Although the two-branch model incorporates additional complexity compared to the one-branch model, its limited capacity to diversify feature extraction results in overfitting and unstable validation performance. This limitation is evident in its fluctuating validation loss and low classification metrics. The inability to consistently separate classes with overlapping characteristics, such as “Significant Hypermetropia” and “Insignificant Refractive Error,” further underscores the need for more sophisticated architectural strategies.
The 3-branch CNN represents the most advanced architecture in this study, leveraging three independent feature extraction pipelines (Figure 9). Each branch processes the input image at different resolutions, capturing multi-scale features that are critical for accurately classifying refractive errors. For example, one branch may focus on fine-grained details, such as the edges of the red reflex, whereas another may capture broader patterns, such as symmetry and orientation. The outputs of all three branches are concatenated and passed through dense layers to obtain a comprehensive feature representation.
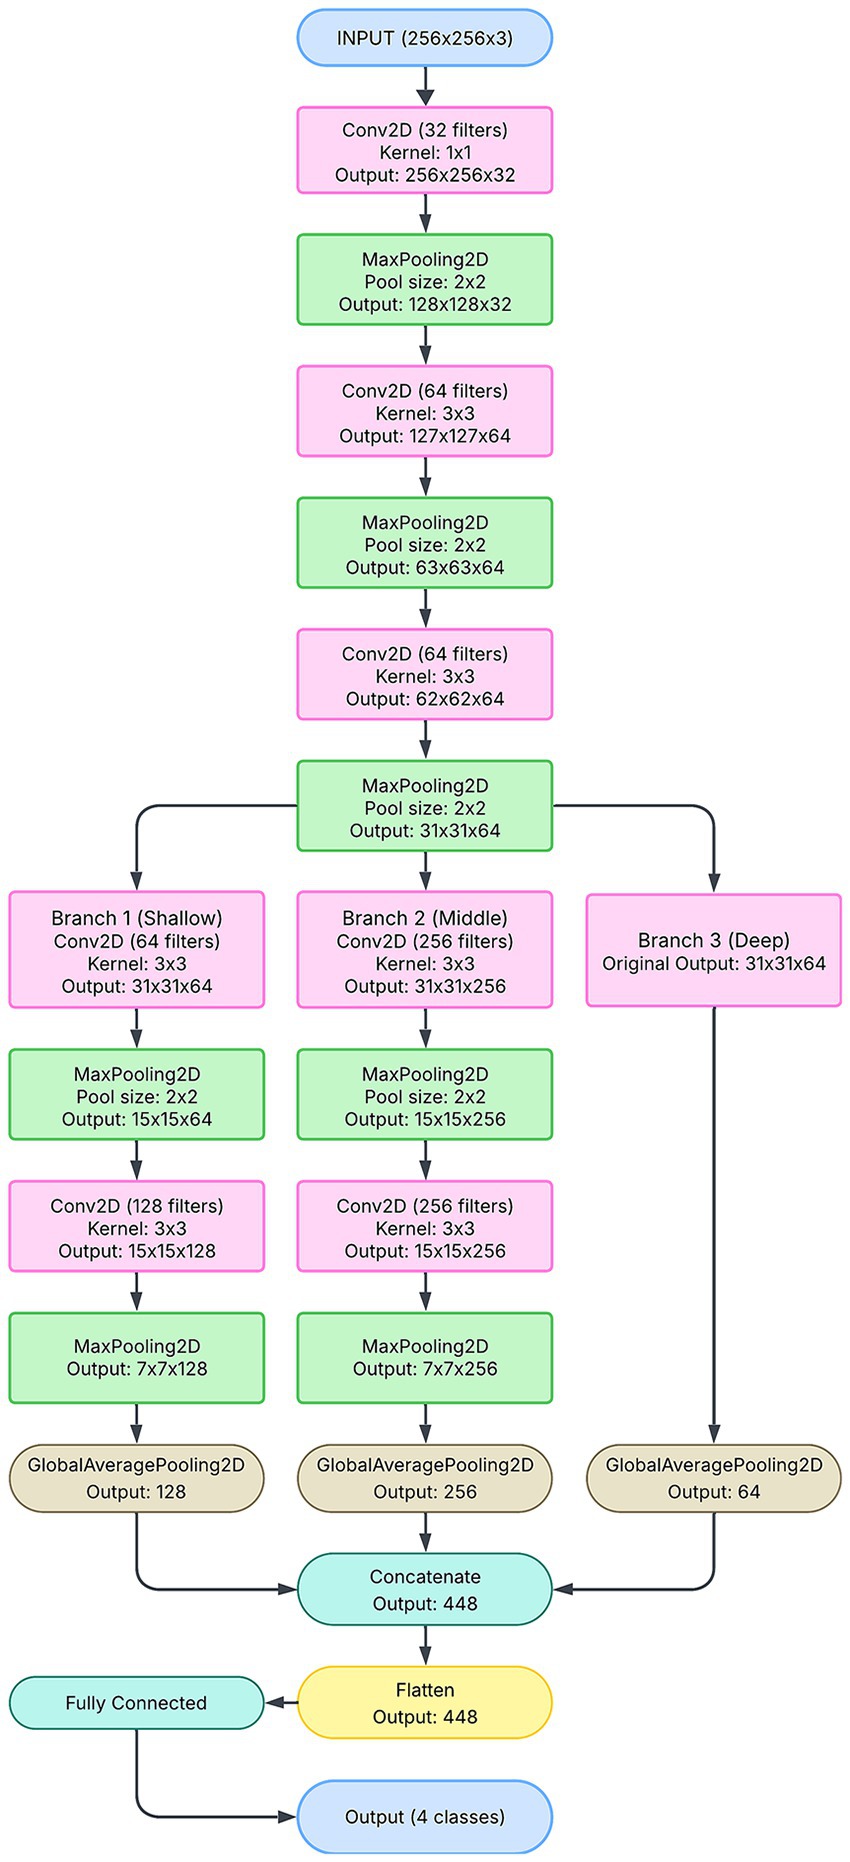
Figure 9. Three-branch CNN model diagram chart.
This architecture demonstrates superior performance, as evidenced by its smooth training and validation accuracy curves (Figure 7C) and consistently low loss (Figure 7F). The 3-branch CNN achieves the highest precision (96%) and recall (98%) for critical classes such as “Significant Myopia,” reflecting its ability to handle complex and overlapping patterns. The high area under the curve (AUC) score of 0.9896 further underscores its robust classification capabilities.
Furthermore, the multi-branch design mitigates overfitting by ensuring that each branch learns unique, complementary features. This diversity enhances generalization, making the model more reliable across unseen data. Despite its higher parameter count (∼274,000\sim 274,000∼274,000), the 3-branch CNN achieves a balance between complexity and performance, solidifying its role as the optimal architecture for this application. Its success highlights the importance of multi-scale feature extraction in deep-learning models for medical imaging.
Figure 7 shows the accuracy and loss of each CNN model used in this study. The one-branch model ran 20 epochs with a batch size of 32, achieving a training accuracy of 0.9970 and a training loss of 0.0146. The validation accuracy of the one-branch model is 0.9760, and its validation loss is 0.0800. The two-branch model ran 100 epochs with a batch size of 32 and used EarlyStopping, which means that the training is stopped when validation accuracy is not improved after 20 epochs. The two-branch model achieved a training accuracy of 0.9742 and a training loss of 0.0738. The validation accuracy of the two-branch model is 0.9688, and its validation loss is 0.1137. These results show that the performance of the two-branch model is lower than that of the one-branch model. However, the accuracy is improved and the loss is decreased with the three-branch model. The three-branch model ran 100 epochs with a batch size of 32 and used EarlyStopping. The three-branch model achieved training accuracy of 0.9992 and training loss of 0.0035. The validation accuracy of the three-branch model is 0.9866, and its validation loss is 0.0762. Thus, this study shows that the three-branch model achieves the optimum performance.
Architectural strengths of the 3-branch model
The 3-branch CNN model exhibits significant architectural advantages, leveraging its multi-pathway design to process input images at varying resolutions. This approach ensures simultaneous capture of both fine-grained features (e.g., subtle differences in red reflex patterns) and broader spatial structures (e.g., pupil orientation). The superior performance of the 3-branch model, achieving a validation accuracy of 98.66% and a test accuracy of 91%, highlights its robustness in generalizing across complex, multi-class refractive error datasets. The model mitigates information loss by integrating diverse feature representations through its branches, ensuring that patterns unique to each class are effectively learned. This is particularly crucial for medical applications where misclassifications can have significant implications.
Additionally, the smooth convergence of training and validation loss in the 3-branch model, as shown in Figure 7F, underscores its stability and resistance to overfitting. Unlike the one-branch model, which underwits due to limited feature extraction capacity, and the two-branch model, which suffers from unstable performance, the 3-branch model strikes an optimal balance between architectural complexity and generalization. These findings solidify the importance of multi-branch architectures in high-stakes classification tasks. The image in Figure 10 provides an excellent conceptual diagram of a multi-branch CNN architecture designed for analyzing pupillary red reflex patterns for refractive error classification. The proposed model leverages three distinct branches, each specialized in extracting different levels of features from the input image, resulting in a more robust and comprehensive analysis.
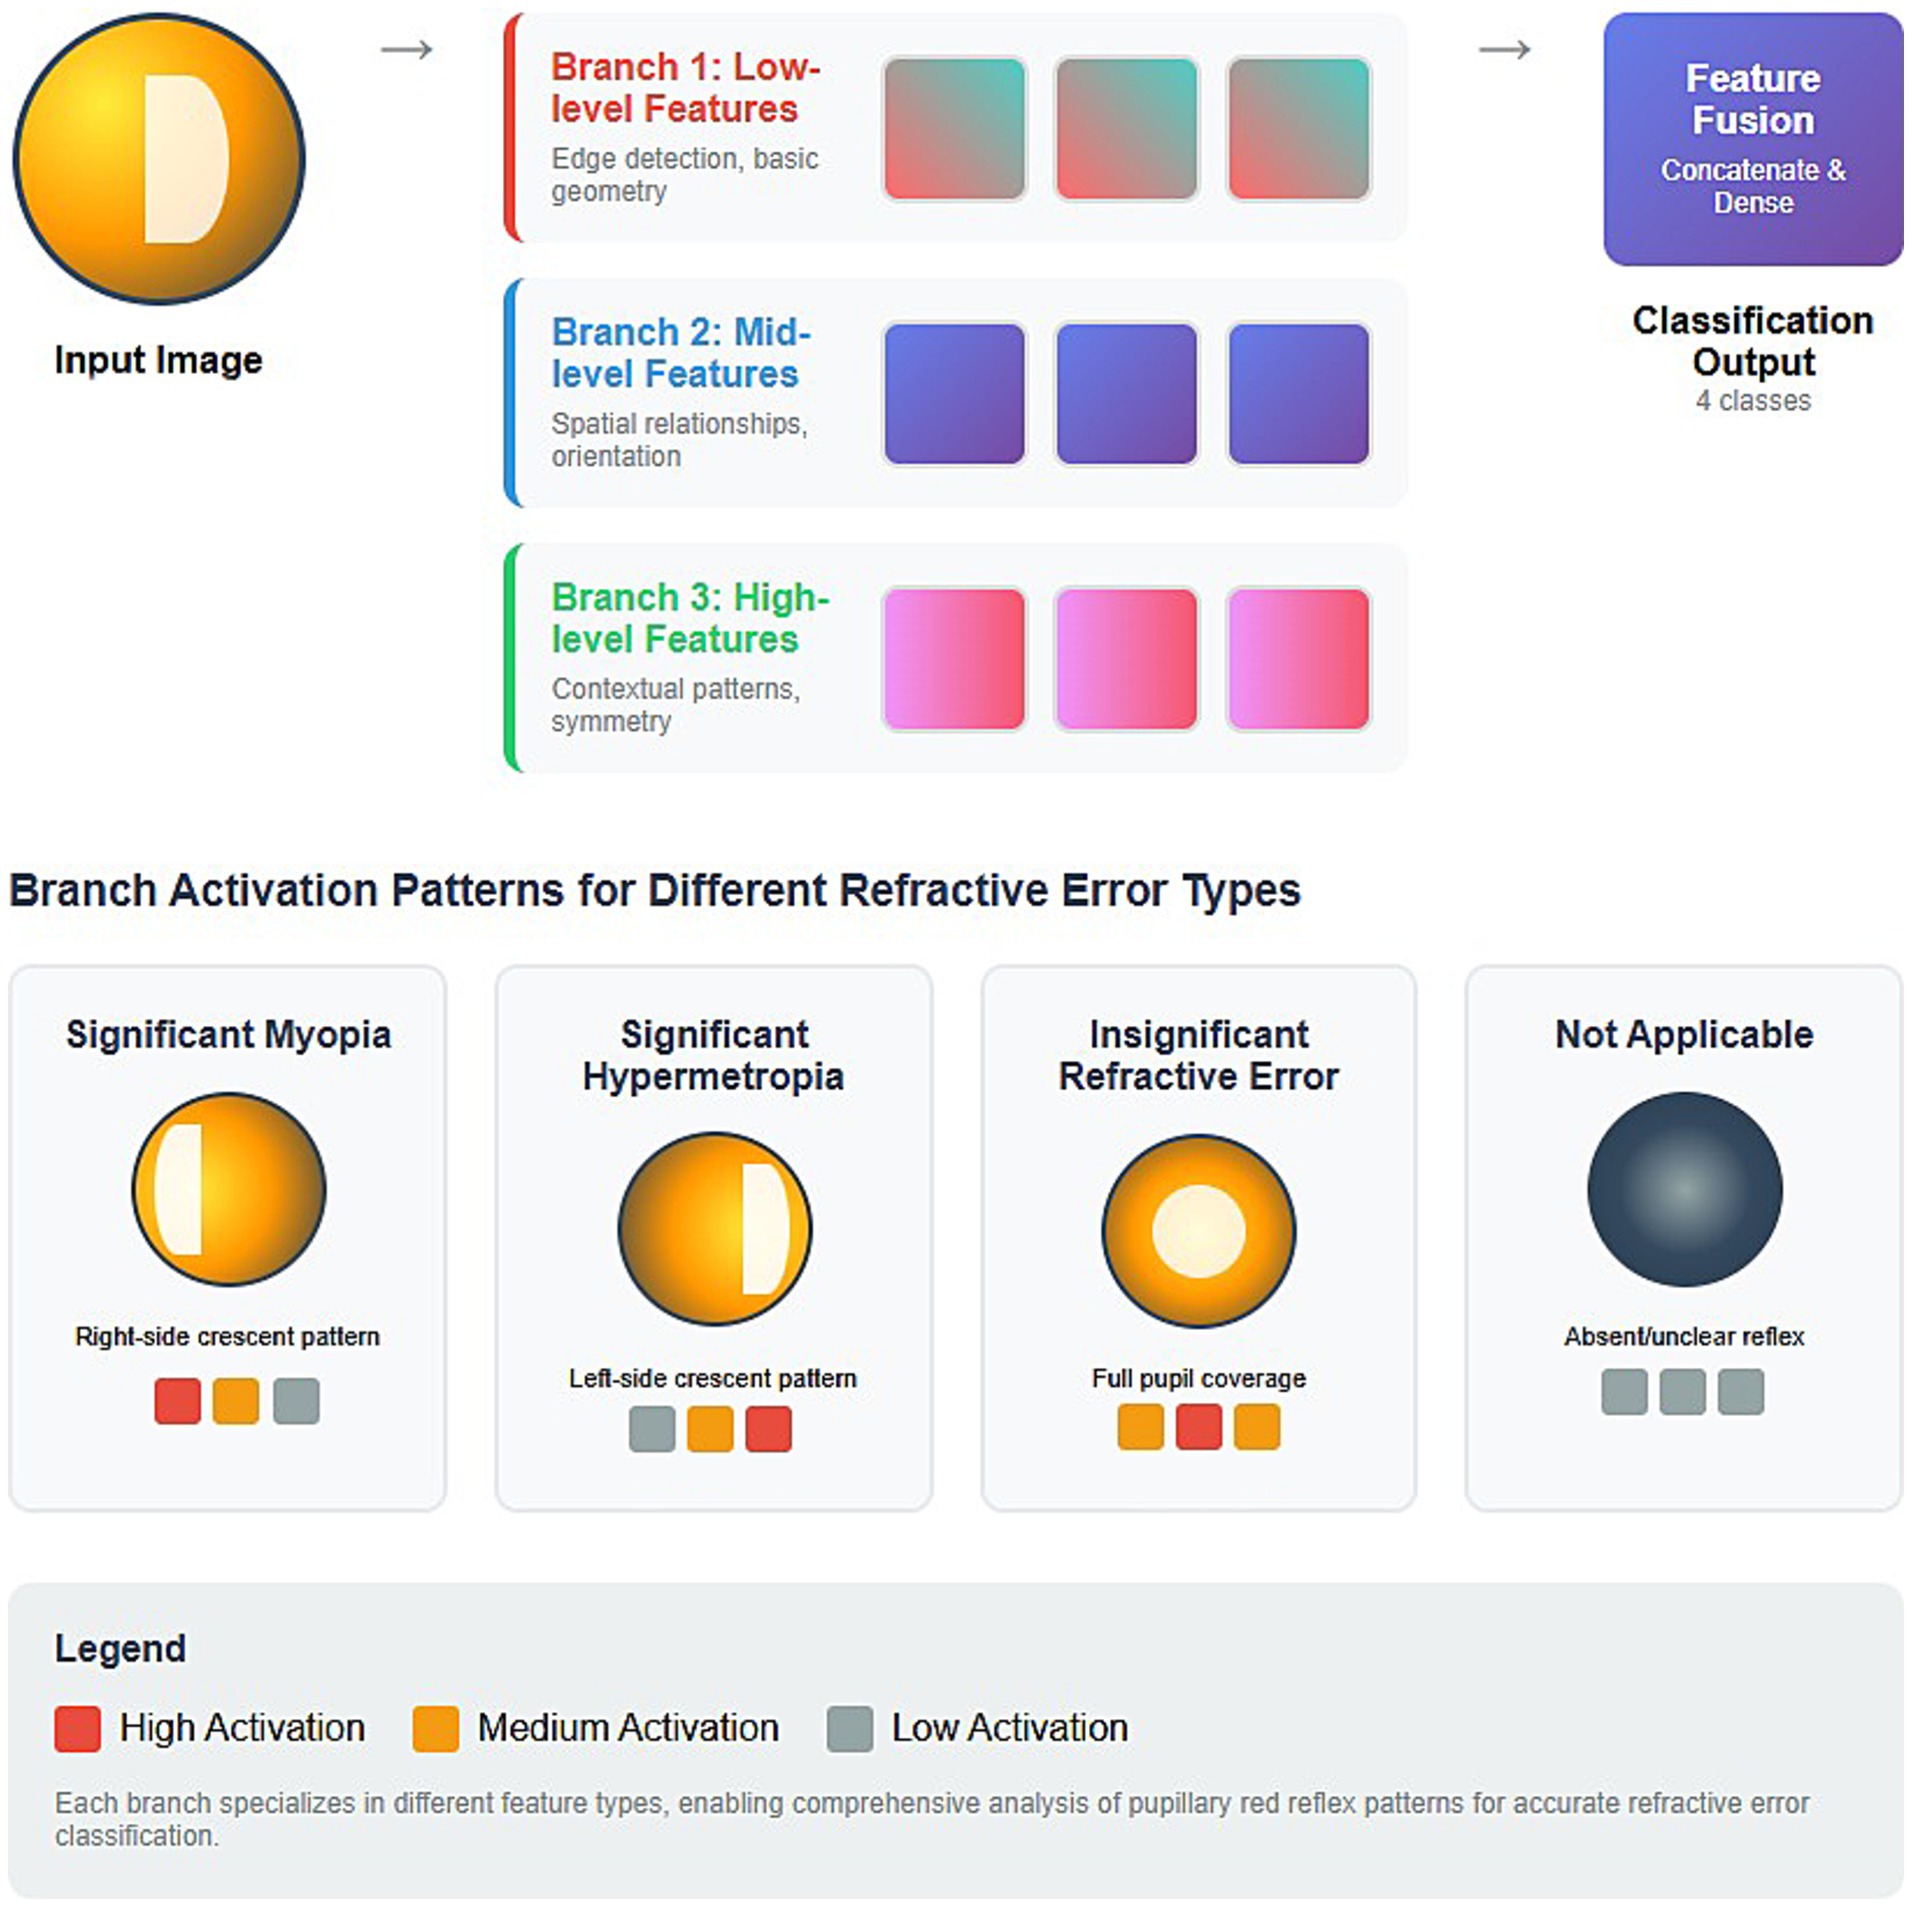
Figure 10. Conceptual diagram of a multi-branch CNN architecture designed for analyzing pupillary red reflex patterns for refractive error classification.
The architecture consists of an initial input image stage, followed by three parallel processing branches (Branch 1, Branch 2, Branch 3) that are then fed into a Feature Fusion stage, culminating in the Classification Output. Branch 1 captures the fundamental, primitive visual characteristics in the red reflex image and focuses on low-level features such as edge detection and basic geometry. For red reflex analysis, this branch is crucial for delineating the pupil boundaries, identifying the edges of any crescent patterns, and potentially localizing the red reflex. It provides foundational structural information. The associated colored blocks (i.e., red, orange, gray) would represent conceptual activations. High activation (red) occurs when strong edges or basic geometric forms are detected. Branch 2 focuses on mid-level features, such as spatial relationships and orientation. This branch helps identify patterns indicative of specific refractive errors, such as the orientation of a crescent in the red reflex. Branch 3 focuses on high-level features such as contextual patterns and symmetry. This branch integrates information from a wider range of receptive fields to better understand overarching visual themes. This branch is vital for distinguishing subtle differences between types of refractive error that may not be obvious from isolated edges or local orientations. Recognizing the gestalt of the red reflex, such as a “full pupil coverage” for insignificant refractive error or the distinct “crescent patterns” for myopia/hypermetropia, is helpful.
After each branch has extracted its specialized features, their outputs are combined in the Feature Fusion stage, which is achieved through concatenate and fully connected dense layers. The final output of the model is the classification output, which indicates one of 4 classes. The model achieves a more comprehensive understanding of the pupillary red reflex by fusing the insights from all three branches. This integrated approach allows us to make more accurate and nuanced refractive error classifications, leveraging the strengths of each specialized feature extractor.
Grad-CAM is a crucial tool for model interpretability and to understand the features driving our multi-branch CNN predictions. Visualizing regions of importance is paramount for a medical application like refractive error detection, because it provides transparency and builds trust in the model’s decision-making process. The Grad-CAM heatmaps illustrate the regions of an image that are most important for the model’s classification of refractive errors. These illustrations provide an understanding of why a deep learning model makes a certain refractive error prediction. These Grad-CAM visualizations are essential because they validate model behavior and visually confirm that the multi-branch CNN focuses on the diagnostically relevant features (crescent position, full reflex) that are traditionally used by clinicians in photorefraction, rather than spurious correlations. The Grad-CAM heatmaps show red and yellow areas, which indicate regions of high activation that strongly influenced the model’s decision for the predicted class. These areas are the “hotspots” where the CNN is focused. The Grad-CAM heatmaps also show blue and green areas, which indicate regions of low or no activation, indicating that these areas were less influential for refractive error class prediction.
The original image in Figure 11A shows a pupillary red reflex with a prominent crescent of light, primarily on the right side of the pupil, denoting a significant myopia class. The rest of the pupil appears relatively dark or has a very dim reflex. The Grad-CAM heatmap in Figure 11B displays a strong red/yellow activation, precisely concentrated over this right-sided crescent. This indicates that the model relies heavily on the presence, shape, and intensity of this right-sided crescent for its classification. The original image in Figure 11C features a distinct crescent of light, predominantly on the left side of the pupil, denoting a significant class of hypermetropia. Similar to Figure 3A, the remainder of the pupil is less illuminated. The Grad-CAM heatmap in Figure 11D exhibits a strong red/yellow activation, which is concentrated over the left-sided crescent. This indicates that the model’s decision is strongly driven by the characteristics of this left-sided reflex. The heatmap shows that the model’s attention aligns with this key diagnostic feature. The original image in Figure 11E shows a “Total Red Reflex,” where the red reflex appears to fill nearly the entire pupillary area, indicating a more diffuse and uniform light reflection, denoting an insignificant refractive error class. The Grad-CAM heatmap in Figure 11F shows a broad red/orange activation spread across almost the entire pupillary area, closely matching the extent of the total red reflex. This demonstrates that the model uses the overall presence and distribution of the red reflex across the pupil rather than focusing on a specific crescent. The original image in Figure 11G shows the pupil area with a dark or absent/unclear red reflex, and some reflections or artifacts might be present, but no clear red glow fills the pupil or forms a distinct crescent. This image quality might fall into the “not applicable” or “unclassifiable” category. The Grad-CAM heatmap in Figure 11H shows very scattered and relatively low-intensity (yellow/blue) activations, primarily around the pupil edges or over reflections/artifacts, with no strong, coherent red hotspot over the central pupillary area. This indicates that the model is struggling to find distinct, meaningful red reflex patterns or is focusing on subtle cues that indicate an unclassifiable image. The diffused and less intense heatmap indicates the absence of clear patterns for the other refractive error types in the model learned.
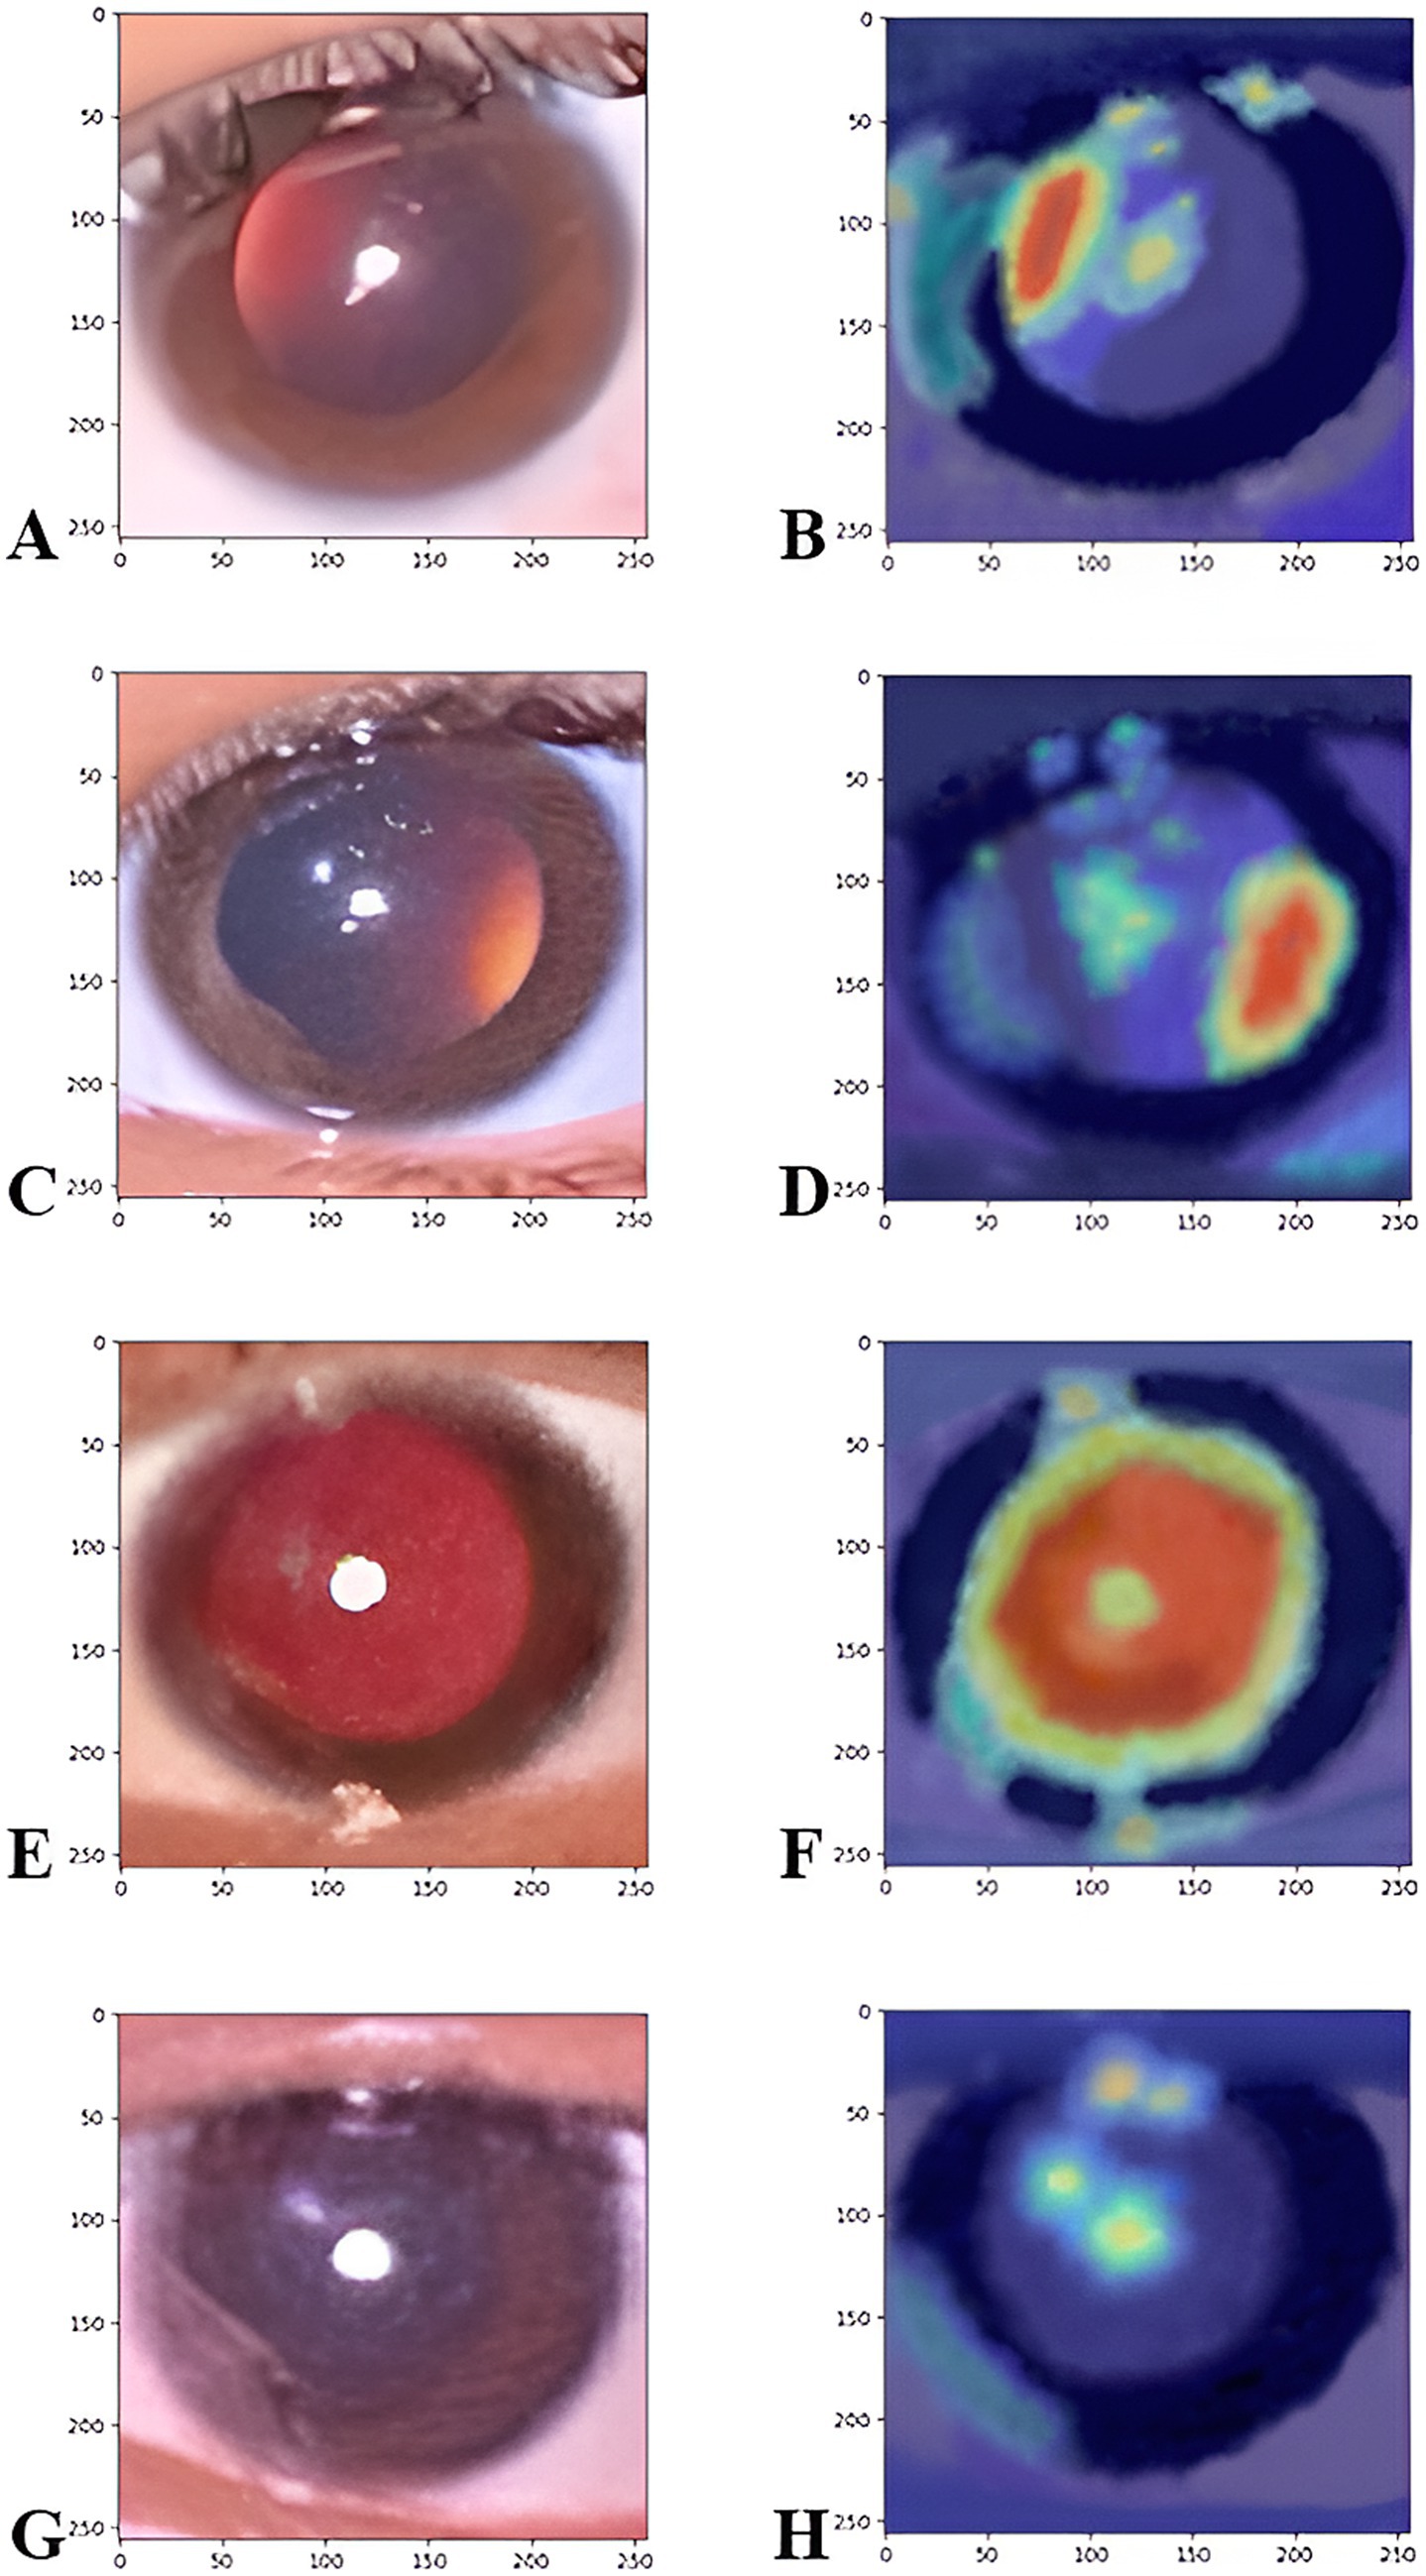
Figure 11. The Grad-CAM heatmaps illustrate the corneal image regions that most significantly contributed to the prediction. Figures on the left side refer to the original images of the significant myopia class (A), the significant hypermetropia class (C), insignificant refractive error class (E), and the not applicable class (G). The figure on the right side refers to the heat map of the myopic class (B), the hypermetropic class (D), insignificant refractive error class (F), and not applicable classes (H), which captures important features for classifying refractive error, particularly the crescent region in the pupil.
Comparative analysis of model performance
The comparative results across the one-branch, two-branch, and three-branch models emphasize the interplay between model complexity and generalization. The one-branch model although stable (Figures 7A,D), demonstrates lower accuracy and higher loss due to its inability to learn intricate patterns. In contrast, the two-branch model shows significant instability in validation performance (Figures 7B,E), with fluctuating validation accuracy and failure to converge. This instability indicates that the intermediate complexity of the two-branch model lacks the structural diversity required to effectively separate overlapping classes, such as “Insignificant Refractive Error” and “Significant Hypermetropia.”
Theoretically, a standard monolithic architecture like ResNet can be adapted for multi-class classification. The decision to employ a multi-branch architecture was deliberate and was fundamentally driven by the inherent complexity and multi-faceted nature of ophthalmic image analysis for refractive error detection, especially in a smartphone-based setting. This specific multi-branch CNN architecture was chosen after an initial design process in which standard architectures, including CNNs with a single pathway, were tested and offered insufficient performance in terms of learning for distinguishing subtle differences in pupillary red reflex patterns. A single-stream CNN may struggle to learn and fuse these disparate features simultaneously.
Although pre-trained models such as ResNet are retrained to serve as feature extractors, they are not designed with our specific classification task in mind. Refractive error diagnosis requires a holistic assessment of various visual cues, and smartphone-based imaging for diagnostic purposes is inherently prone to noise sources and artifacts (e.g., motion blur, uneven illumination, reflections). A monolithic network forces all features through the same convolutional layers, potentially leading to a suboptimal trade-off. For example, some features may be diluted, or the network may struggle to learn highly discriminative representations for all relevant cues.
Previous studies have developed CNN models for detecting refractive errors in pupillary red reflex images. However, the accuracy of those models is lower than that of our model. A study by Kriangsakdachai et al. (2022) developed a pre-trained CNN model, DenseNet and EfficientNet, for the detection of abnormal red reflex due to refractive error. The model performance has an accuracy of 72.25%, sensitivity of 75.5%, and specificity of 0.69%. The model in this study only classified the class into normal and abnormal cases and did not classify the type of refractive error. The dataset was retrieved from the 322 images captured using an iPhone X or iPhone 7. Another study by Linde et al. (2023) developed a pretrained CNN model, Inception-v3 and EfficientNet, to differentiate myopic and non-myopic eyes. Images of 357 patients were captured with a nun IR fundus camera attached to an Android smartphone. The model achieved 75% accuracy but did not achieve the target as a primary screening tool. A Study in the Korean population by Chun et al. (2019) showed higher accuracy of the pretrained CNN model, ResNet-18, with an overall test accuracy of 81.6%. The model classifies six types of refractive errors based on the dioptric power interval. The dataset in this study is also quite small in size (305 images captured with LGM-X800K smartphone from 164 patients), and the age range of the patients involved is also narrow and limited to a young age (mean age 4.32 years, SD 1.87 years, range 6 months to 8 years). The 3-branch model developed in our study had superior precision (96%) and recall (98%) for critical classes such as “Significant Myopia” compared with the pretrained model, highlighting its ability to handle challenging scenarios where patterns overlap or are subtle. The confusion matrix (Figure 5, Left) further demonstrates the model’s ability to minimize misclassifications across all classes, solidifying its position as the optimal architecture for this application.
A multi-branch CNN allows dedicated branches to specialize in extracting relevant features from specific regions or visual information types in the input image. Each branch can be optimized using appropriate filter sizes, receptive fields, and feature maps to best capture the nuances of its designated input. The multi-branch approach specifically addresses the need to simultaneously capture features at different scales. This characteristic is particularly important for crescent-shaped red reflex patterns that mainly differ in orientation and position rather than in general appearance. The multi-branch CNN design facilitates the fusion of these specialized feature representations at a later stage of the network (e.g., concatenation layer followed by fully connected layers). This allows the model to learn complex, non-linear relationships between these different types of information, leading to a more accurate and comprehensive diagnosis than relying on a single, undifferentiated feature set.
Limitations
Despite its strong performance, the proposed model has certain limitations:
1. Ethnic diversity in dataset: The training dataset predominantly comprised images from Malay ethnicity, which may limit the model’s generalizability to other populations. Future studies should incorporate images from diverse ethnic groups to broaden the dataset and encompass a broader range of populations. This can be achieved through multi-center research initiatives. Additionally, to improve external validity, stratified sampling during model development and thorough subgroup analyses across different ethnic groups should be implemented during validation. These approaches will contribute to the generalizability of our results.
2. Resolution constraints: Although the 72 × 72 pixel resolution was computationally efficient, it may have led to the loss of finer details in the corneal images. Higher-resolution inputs could further improve the model performance, particularly for challenging classes. We tested the model performance using 224 × 224 pixel images, which are substantially higher than our original 72 × 72 resolution. This higher resolution can better capture subtle red reflex morphologies, contributing to our improved test accuracy of 92.91% (vs. the previous 91%). However, despite the improved performance gain, this led to increasing computational demands. The higher resolution also led to longer training times due to the limitations of our computational resources. Efficient training times with lower image resolution are preferred over a slight increase in test accuracy using higher image resolution at the cost of higher computational effort.
3. Class imbalance: Although the dataset was balanced by augmentation, real-world applications may still encounter skewed distributions. Dynamic re-weighting techniques during training could address this issue.
4. Specific device usage. The specific iPhone 6s used in this study may possess unique image settings, camera characteristics, and light source eccentricity that could influence algorithm performance. The iPhone 6s had a flashlight source position at the left side of the camera lens, with a light source eccentricity (distance of the light source from the edge of the camera aperture) of approximately 6 mm. The images in the dataset were taken in the portrait orientation; thus, the crescent-shaped red reflex was positioned in the horizontal meridian (Figures 3A,B). In smartphone types where the flashlight is positioned above or below the camera lens (Nokia Lumia 800 or Samsung Galaxy S3), if the image is taken in the portrait orientation, the crescent-shaped red reflex is positioned in the vertical orientation (Figure 12) (Colicchia et al., 2015). The image should be taken in landscape orientation to produce the crescent-shaped red reflex, which is positioned in the horizontal meridian. Therefore, if the image collection procedure is standardized, the algorithm will continue to produce valid and reliable results and is expected to be more resilient to minor variations in image acquisition, regardless of the type of smartphone.
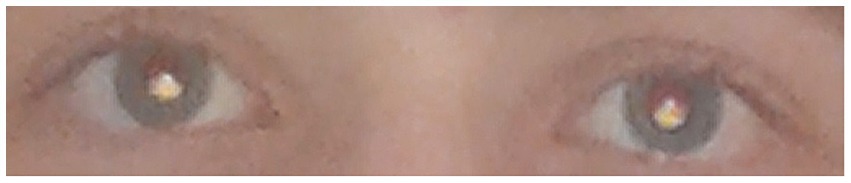
Figure 12. In myopic eyes, the crescent-shaped red reflex is located in the inferior part of the pupil. The images were captured using a Samsung Galaxy S3 smartphone with the light source positioned below the camera lens (Colicchia et al., 2015). Reprinted from Colicchia et al.(2015), with the permission of AIP Publishing.
Recommendations and future directions
The findings emphasize that architectural complexity alone does not guarantee better performance. The integration of diverse and complementary feature extraction pathways, as seen in the 3-branch model, is critical for achieving robust classification in complex datasets. Future studies should focus on refining multi-branch designs to further enhance generalization and stability. Future directions should also focus on expanding the dataset to include images from diverse ethnicities, age groups, and lighting conditions to ensure the fairness of the model in a global population. The use of the model with higher-resolution input images could be beneficial because the influence of subtle variations in the pupillary red reflex is crucial for differentiating more complex classes. Deploying the model on smartphones through lightweight frameworks like TensorFlow Lite will provide a cost-effective tool for real-time predictions and could be a solution to a vision screening at the community level, as it will be much more feasible. Moreover, advanced explainability tools, such as Grad-CAM, should be introduced to generate visual representations of decision-making processes to enhance clinician and patient trust. Future studies may consider hybrid architectures that exploit the benefits of convolutional layers along with attention mechanisms, such as transformers that enhance the capacity of the model to classify overlapping or complex refractive error categories. These improvements will make the proposed solution scalable, reliable, and clinically usable. Finally, future plans to test the model in a real-world environment, particularly in school-aged children, are crucial. The choice for a pilot test in the school-aged children population is due to the high prevalence of uncorrected refractive errors globally, particularly among Indonesian children, which is approximately 12% (Mahayana et al., 2017; Halim et al., 2020). Validating algorithms using external test datasets and in practical environments with diverse demographics is crucial to ensure their generalizability and applicability in clinical practice before implementation.
Conclusion
The integration of CNN models with smartphone-based image acquisition systems offers a scalable and cost-effective refractive error screening solution. The model’s performance demonstrates its potential to replace or complement traditional methods that rely on specialized equipment and trained professionals. The model effectively bridges the gap between professional diagnostic tools and accessible, smartphone-based solutions by automating the classification of refractive errors. Therefore, this approach could significantly expand access to eye care in resource-limited settings. By harnessing smartphone technology, this methodology fills the void between the gold standard in diagnostic imaging and currently scalable and low-cost solutions for widespread vision screening.
Data availability statement
The raw data supporting the conclusions of this article will be made available by the authors, without undue reservation.
Ethics statement
The studies involving humans were approved by The Ethics Committee of the Faculty of Public Health Universitas Indonesia (Ket-541/UN2.F10.D11/PPM.00.02/2024). The studies were conducted in accordance with the local legislation and institutional requirements. Written informed consent for participation in this study was provided by the participants’ legal guardians/next of kin. Written informed consent was obtained from the individual(s), and minor(s)’ legal guardian/next of kin, for the publication of any potentially identifiable images or data included in this article.
Author contributions
MS: Conceptualization, Data curation, Formal analysis, Funding acquisition, Investigation, Methodology, Project administration, Resources, Software, Supervision, Validation, Visualization, Writing – original draft, Writing – review & editing. HP: Software, Methodology, Data curation, Investigation, Writing – review & editing, Conceptualization, Validation, Visualization, Supervision, Writing – original draft, Formal analysis. SH: Writing – review & editing, Conceptualization, Supervision, Validation. KS: Supervision, Writing – review & editing, Conceptualization, Validation. NM: Writing – review & editing, Supervision, Validation, Conceptualization.
Funding
The author(s) declare that financial support was received for the research and/or publication of this article. This study received funding from the Lembaga Pengelola Dana Pendidikan (LPDP) through a research grant (No. PD2592024110600195).
Acknowledgments
The author would like to thank Lembaga Pengelola Dana Pendidikan (LPDP), Sabang Merauke Eye Center Hospital, and LPPM Universitas Andalas for supporting this study.
Conflict of interest
The authors declare that the research was conducted in the absence of any commercial or financial relationships that could be construed as a potential conflict of interest.
Generative AI statement
The authors declare that no Gen AI was used in the creation of this manuscript.
Publisher’s note
All claims expressed in this article are solely those of the authors and do not necessarily represent those of their affiliated organizations, or those of the publisher, the editors and the reviewers. Any product that may be evaluated in this article, or claim that may be made by its manufacturer, is not guaranteed or endorsed by the publisher.
References
Abadi, M., Barham, P., Chen, J., Chen, Z., Davis, A., and Dean, J. (2016). Tensor flow: a system for large-scale machine learning. Proceedings of the 12th USENIX conference on Operating Systems Design and Implementation, 265–83. doi: 10.48550/arXiv.1605.08695
Bradley, A. P. (1997). Use of the area under the ROC curve in the evaluation of machine learning algorithms. Pattern Recogn. 30, 1145–1159. doi: 10.1016/S0031-3203(96)00142-2
Braverman, R. (2007). Diagnosis and treatment of refractive errors in the pediatric population. Curr. Opin. Ophthalmol. 18, 379–383. doi: 10.1097/ICU.0b013e328244dfed
Cao, H., Cao, X., Cao, Z., Zhang, L., Han, Y., and Guo, C. (2022). The prevalence and causes of pediatric uncorrected refractive error: pooled data from population studies for global burden of disease (GBD) sub-regions. PLoS One 17:e0268800. doi: 10.1371/journal.pone.0268800
Chun, J., Kim, Y., Shin, K., Han, S., Oh, S., Chung, T.-Y., et al. (2019). A deep-learning-based prediction of refractive error using smartphone-captured photorefraction images: model development and validation study. JMIR Med. Inform. 8, e16225. doi: 10.2196/16225
Cochrane, G., du Toit, R., and Mesurier, R. (2010). The management of refractive errors. BMJ 340:c1711. doi: 10.1136/bmj.c1711
Colicchia, G., Wiesner, H., and Zollman, D. (2015). Photorefraction of the eye. Phys. Teach. 53, 103–105. doi: 10.1119/1.4905810
Cooper, C. D., Bowling, F. G., Hall, J. E., Colville, D. J., Dortmans, R. J., Munch, J., et al. (1996). Photoscreener instrument evaluation in a childhood population. 1. The Otago photoscreener and Dortmans videophotorefractor. Aust. N. Z. J. Ophthalmol. 24, 347–355. doi: 10.1111/j.1442-9071.1996.tb01606.x
Do, C.-w., Chan, L. Y., Kwok, O.-l., Lai, L. H., Lee, P. H., Ngai, G., et al. (2022). Using a smartphone camera to detect refractive error among schoolchildren: a simple model to address cost-related barriers for refractive error detection. Invest. Ophthalmol. Vis. Sci. 63:2819 – A0149.
Donahue, S. P. (2009). “Screening for pediatric ophthalmologic disorders” in Pediatric ophthalmology: Current thought and a practical guide. eds. M. E. Wilson, R. A. Saunders, and R. H. Trivedi (Leipzig, Germany: Springer-Verlag Berlin Heidelberg), 61–70.
Fu, E., Yang, Z., Leong, H., Ngai, G., Do, C. W., and Chan, L. Exploiting active learning in novel refractive error detection with smartphones (2020). Proceedings of the 28th ACM international conference on multimedia. 2775–2783.
GBD 2019 Blindness and Vision Impairment Collaborators (2021). Causes of blindness and vision impairment in 2020 and trends over 30 years, and prevalence of avoidable blindness in relation to VISION 2020: the right to sight: an analysis for the global burden of disease study. Lancet Glob. Health 9, e144–e160. doi: 10.1016/S2214-109X(20)30489-7
Halim, A., Suganda, R., Sirait, S. N., Memed, F. K., Syumarti Rini, M., et al. (2020). Prevalence and associated factors of uncorrected refractive errors among school children in suburban areas in Bandung, Indonesia. Power. Med. 7:1737354. doi: 10.1080/2331205X.2020.1737354
Hashemi, H., Fotouhi, A., Yekta, A., Pakzad, R., Ostadimoghaddam, H., and Khabazkhoob, M. (2018). Global and regional estimates of refractive error prevalence: systematic review and meta-analysis. J. Curr. Ophthalmol. 30, 3–22. doi: 10.1016/j.joco.2017.08.009
Heaton, J., Goodfellow, I., Bengio, Y., and Courville, A. (2018). Deep learning. Genetic Programming and Evolvable Machines. 19, 305–7. doi: 10.1007/s10710-017-9314-z
Holden, B. A. (2007). Uncorrected refractive error: the major and most easily avoidable cause of vision loss. Community Eye Health 20, 37–39.
Ik, Z. Q., Lau, S. L., and Chan, J. B., editors. Mobile cataract screening app using a smartphone. 2015 IEEE Conference on e-Learning, e-Management and e-Services (IC3e); (2015) 24–26.
Ioffe, S., and Szegedy, C.. Batch normalization: accelerating deep network training by reducing internal covariate shift. Proceedings of the 32nd international conference on international conference on machine learning-volume 37; Lille, France: JMLR.org; (2015). p. 448–456.
Keskinbora, K., and Güven, F. (2020). Artificial intelligence and ophthalmology. Turk. J. Ophthalmol. 50, 37–43. doi: 10.4274/tjo.galenos.2020.78989
Kingma, D., and Ba, J.. Adam: a method for stochastic optimization. International conference on learning representations. (2014).
Kiu, L. Y., Kwok, O. -l., Leung, H. -c., Chan, D. N., Tang, W. -c., Li, H. Y., et al. (2024). Enhancing myopia screening in the community: exploring the potential of smartphone photorefraction. Invest. Ophthalmol. Vis. Sci. 65:608.
Kriangsakdachai, S., Ayudhya, S., Kusakunniran, W., Ayudhya, W., Chantrasagul, C., Manasboonpermpool, R., et al. Anomaly detection in red reflex images using deep learning approaches (2022). 1–6 p.
Krizhevsky, A., Sutskever, I., and Hinton, G. (2012). Imagenet classification with deep convolutional neural networks. Adv. Neural Inf. Process. Syst. 25, 1097–1105. doi: 10.1145/3065386
Latif, J., Xiao, C., Imran, A., and Tu, S. Medical imaging using machine learning and deep learning algorithms: a review. 2nd International conference on computing, mathematics and engineering technologies (iCoMET).pp. 1–5. IEEE. (2019)
LeCun, Y., Bengio, Y., and Hinton, G. (2015). Deep learning. Nature 521, 436–444. doi: 10.1038/nature14539
Lim, J. S., Hong, M., Lam, W. S. T., Zhang, Z., Teo, Z. L., Liu, Y., et al. (2022). Novel technical and privacy-preserving technology for artificial intelligence in ophthalmology. Curr. Opin. Ophthalmol. 33, 174–187. doi: 10.1097/ICU.0000000000000846
Linde, G., Chalakkal, R., Zhou, L., Huang, J. L., O'Keeffe, B., Shah, D., et al. (2023). Automatic refractive error estimation using deep learning-based analysis of red reflex images. Diagnostics (Basel) 13:2810. doi: 10.3390/diagnostics13172810
Ma, S., Guan, Y., Yuan, Y., Tai, Y., and Wang, T. (2020). A one-step and streamlined children vision screening solution based on smartphone imaging for resource-limited areas: design and evaluation. JMIR Mhealth Uhealth 8:e18226. doi: 10.2196/18226
Mahayana, I. T., Indrawati, S. G., and Pawiroranu, S. (2017). Prevalence of uncorrected refractive error in urban, suburban, exurban and rural primary school children in Indonesian population. Int. J. Ophthalmol. 10, 1771–1776. doi: 10.18240/ijo.2017.11.21
Martinez-Perez, C., Alvarez-Peregrina, C., Villa-Collar, C., and Sánchez-Tena, M. (2022). Application of artificial intelligence to ophthalmology and optometry: a citation network analysis. J. Optom. 15, S82–S90. doi: 10.1016/j.optom.2022.06.005
Ng, W. Y., Zhang, S., Wang, Z., Ong, C. J. T., Gunasekeran, D. V., Lim, G. Y. S., et al. (2021). Updates in deep learning research in ophthalmology. Clin. Sci. (Lond.) 135, 2357–2376. doi: 10.1042/CS20210207
Pan, C.-W., Zheng, Y.-F., Anuar, A. R., Chew, M., Gazzard, G., Aung, T., et al. (2013). Prevalence of refractive errors in a multiethnic Asian population: the Singapore epidemiology of eye disease study. Invest. Ophthalmol. Vis. Sci. 54, 2590–2598. doi: 10.1167/iovs.13-11725
Panda, S., and Kumar Dhaka, R. (2022). Application of artificial intelligence in medical imaging, 195–202.
Powers, D., and Ailab,. (2011). Evaluation: from precision, recall, and F-measure to ROC, informedness, markedness, and correlation. J. Mach. Learn. Technol. 2, 2229–3981. doi: 10.48550/arXiv.2010.16061
Prechelt, L. (2000). Early stopping—but when? Lect. Notes Comput. Sci 1524, 55–69. doi: 10.1007/3-540-49430-8_3
Rahi, J. S., Solebo, A. L., and Cumberland, P. M. (2014). Uncorrected refractive error and education. BMJ 349:g5991. doi: 10.1136/bmj.g5991
Resnikoff, S., Pascolini, D., Mariotti, S. P., and Pokharel, G. P. (2008). Global magnitude of visual impairment caused by uncorrected refractive errors in 2004. Bull. World Health Organ. 86, 63–70. doi: 10.2471/BLT.07.041210
Rs, R., Cogswell, M., Das, A., Vedantam, R., Parikh, D., and Batra, D. (2020). Grad-CAM: visual explanations from deep networks via gradient-based localization. Int. J. Comput. Vis. 618–626. doi: 10.1007/s11263-019-01228-7
Shorten, C., and Khoshgoftaar, T. M. (2019). A survey on image data augmentation for deep learning. J. Big Data 6:60. doi: 10.1186/s40537-019-0197-0
Simonyan, K., and Zisserman, A.. (2014). Very deep convolutional networks for large-scale image recognition. ar Xiv:1409.556 p [Preprint]. Available online at: https://ui.adsabs.harvard.edu/abs/2014arXiv1409.1556S (accessed September 01, 2014).
Syauqie, M., Hastono, S. P., and Siregar, K. N. (2025).Revealing the inherent properties of pupillary red reflex in refractive errors by smartphone imaging: a study in Indonesia’s population. Optics Continuum, 4, 1519–33. doi: 10.1364/OPTCON.559949
Varadarajan, A. V., Poplin, R., Blumer, K., Angermueller, C., Ledsam, J., Chopra, R., et al. (2018). Deep learning for predicting refractive error from retinal fundus images. Invest. Ophthalmol. Vis. Sci. 59, 2861–2868. doi: 10.1167/iovs.18-23887
Wang, Z., Kempen, J., and Luo, G. (2024). Using smartphones to enhance vision screening in rural areas: pilot study. JMIR Form. Res. 8:e55270. doi: 10.2196/55270
Watts, P., Walker, K., and Beck, L. (1999). Photoscreening for refractive errors in children and young adults with severe learning disabilities using the MTI photoscreener. Eye (Lond.) 13, 363–368.
Keywords: refractive error detection, vision screening, artificial intelligence, convolutional neural network, smartphone, red reflex, photorefraction
Citation: Syauqie M, Patria H, Hastono SP, Siregar KN and Moeloek NDF (2025) Deep learning for vision screening in resource-limited settings: development of multi-branch CNN for refractive error detection based on smartphone image. Front. Comput. Sci. 7:1576958. doi: 10.3389/fcomp.2025.1576958
Edited by:
Shuo Li, Western University, CanadaReviewed by:
Pranay Goel, Indian Institute of Science Education and Research, Pune, IndiaSanat Phatak, KEM Hospital Research Centre, India
Copyright © 2025 Syauqie, Patria, Hastono, Siregar, and Moeloek. This is an open-access article distributed under the terms of the Creative Commons Attribution License (CC BY). The use, distribution or reproduction in other forums is permitted, provided the original author(s) and the copyright owner(s) are credited and that the original publication in this journal is cited, in accordance with accepted academic practice. No use, distribution or reproduction is permitted which does not comply with these terms.
*Correspondence: Muhammad Syauqie, bS5zeWF1cWllQG1lZC51bmFuZC5hYy5pZA==