Abstract
A Smartphone is an important electronic device used by people of all ages. Excessive usage of smartphones among children can lead to various mental and physical problems. Hence, we believe that a control mechanism, if introduced, can help provide suitable content to users based on their age group. Our work focuses on detecting the age of the user based on their smartphone usage habits. To accomplish this, most of the previous work has collected datasets from users either in constrained or non-constrained environments. But in our work, we have collected data from both environments, and we were able to identify a generalized model to handle both environments’ data. To fill this research gap, we have collected our dataset while performing tasks such as typing, swiping, tapping, zooming, and measuring finger size. In a constrained environment, users must hold the phone either in their hands or on a table to finish the tasks. Whereas in a non-constrained environment, users are permitted to move freely while performing tasks. To achieve superior performance on both constrained and non-constrained data, we extracted some new statistical features, followed by Minimum Redundancy Maximum Relevance (mRMR) feature selection to select an appropriate set of features; the optimal feature count was identified using the cross-validation methods. We have used an ensemble classifier for classification, which takes a vote on the predictions of XGBoost, Random Forest (RF), and support vector machine (SVM). In our work, we have achieved 98.66% accuracy in constrained environments and 91.93% in non-constrained environments.
1 Introduction
Smartphones have become an essential device in today’s world, embraced by people of all ages, from children to adults (Anshari et al., 2016; Deshpande et al., 2025). Although smartphones are widely used, excessive usage causes sleep disorders, attention deficit disorder, anxiety, depression, and various cognitive challenges, especially among children and students (Thomée et al., 2011; Wacks and Weinstein, 2021). After the COVID-19 pandemic, the utilization of mobile phones in the educational environment has become more essential than before (Werling et al., 2021). As a result, children are using smartphones more than usual. Therefore, it becomes very necessary to control excessive mobile phone usage among them. Some restrictions can be achieved by managing access to specific apps and websites. The most commonly used phone restriction methods are shown in Figure 1. Password protection, app control, direct control, remote management, and time-based restrictions are not suitable for all times because users can bypass them, and these methods are not suitable for all age groups. Therefore, implementing age-based restrictions is a very viable solution to address these challenges (Abbaspur-Behbahani et al., 2022).
Figure 1
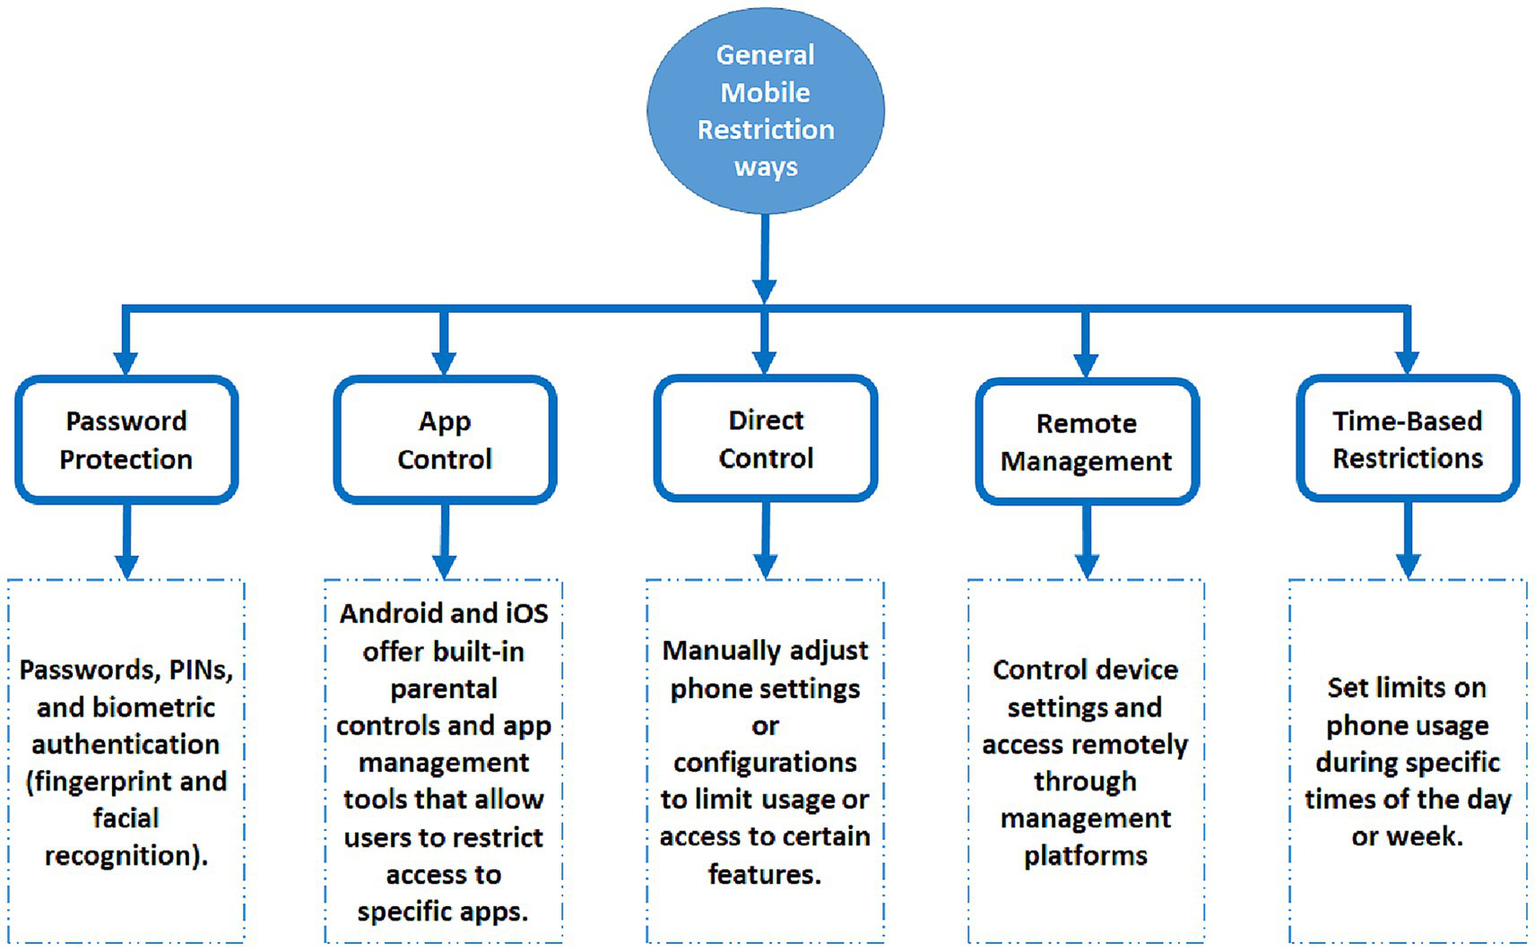
Most commonly used phone restriction methods.
The effectiveness of access controls can be increased by implementing an automatic age detection mechanism that offers wanted sites and app restrictions based on a user’s age. Although many methods are used, especially methods like face recognition, the age detection method using the user’s mobile touch data is the most popular (Hernandez-Ortega et al., 2017; Nguyen et al., 2019; Hossain and Haberfeld, 2020). Generally, when a user interacts with a mobile device, it generates touch data (representing user interactions on the screen) and sensor data (data collected from sensors, such as accelerometers and gyroscopes). To accomplish this, many existing works collect users’ touch and sensor data by performing tapping, swiping, zooming, and typing tasks either in constrained (Chen, 2023) or non-constrained (Zanlorensi et al., 2022) environments. In the constrained environment, users were required to complete the tasks while holding the phone in their hands or placing it on a table. Whereas in a non-constrained environment, users are allowed to move freely while performing tasks. Many studies have utilized touch (Vatavu et al., 2015; Li et al., 2021), sensor data (Hernandez-Ortega et al., 2017; Davarci et al., 2017; Yu et al., 2019), and a combination of touch-sensor (Nguyen et al., 2019; Cheng et al., 2020) data for age detection. Most of the works use individual tactile datasets for age classification, although some literature uses one or two tactile datasets combined with sensor datasets.
Most of the previous works collected datasets either in constrained or non-constrained environments; among these works, the majority focused on constrained environments only. In our proposed work, we have collected data across both constrained as well as non-constrained environments to create the dataset. Many previous works used raw datasets or statistical features to classify age using machine learning (Al-Zuabi et al., 2019; Tolosana et al., 2021). A machine learning model built with data in one environment only tries to achieve excellent performance on the same environment data, but its performance drops significantly on other environment data. Therefore, the model to be developed should achieve significant performance in both environments. To achieve optimal performance even in a non-constrained environment, we have utilized an effective feature extraction and feature selection method.
Existing works utilized individual type, tap, swipe, and a combination of these individual tasks for analysis. These analysis data may be touch, sensor, or both touch and sensor data. Here we have examined the performance of all individual tasks, and a combination of tap-swipe tasks on touch-only, sensor-only, and touch-sensor data. In this work, constrained environment data is considered for training and testing, while non-constrained data is used for validation. To achieve the best performance on non-constrained data, we have utilized effective feature extraction methods for all individual tasks. The details of feature extraction methods are discussed in Section 3.3. In the feature extraction method, we have used different methods for touch-based feature extraction and windowing methods for sensor-based feature extraction. Additionally, to improve the system’s performance, mRMR feature selection was utilized; however, mRMR needs a fixed feature count specification.
This fixed feature count specification may limit overall system performance. Because these specific counts apply to all tasks, there is a chance of eliminating or including unwanted features, which would degrade system performance. To prevent this in our proposed work, we used an mRMR (Ramírez-Gallego et al., 2017) feature selection algorithm with cross-validation (Peng et al., 2005) to determine the optimal feature count for each task. Following feature selection, classification was performed using an ensemble classifier. The ensemble classifier combines XGBoost, SVM, and Random Forest models. Apart from the feature extraction and feature selection methods, to improve validation performance, we have used an ensemble classifier.
In this study, we investigated the constrained and non-constrained environment performance of each task, and the combination of tap-swipe in touch, sensor, and touch-sensor category feature sets. Furthermore, we have linked our performance investigation to energy consumption on smartphones. Generally, energy consumption analysis of smartphones is essential because they are battery-powered devices. In this study, we use the smartphone’s mobile data to determine the age of the user. Smartphones typically process and capture data using both touch- and sensor-based technologies. Touch-based technologies are mostly activated only during user interaction, whereas sensor-based technologies typically remain in active mode continuously. As a result, touch-based tasks consume less energy than sensor-based tasks.
The study’s main contributions are summarized as follows:
Previous studies have focused on collecting and evaluating mobile data in a constrained or non-constrained environment. Users can use mobile devices in both environments, so it is clear that there is a significant limitation in previous research focusing on either environment. Considering this limitation, we collected our dataset from approximately 624 users across two environments, and no previous work has collected this much data. In the majority of work-collected datasets, two to three tasks are performed, but in this work, five distinct tasks are performed to attain optimal performance in both environments, especially non-constrained environments.
Instead of using raw datasets or a limited number of statistical features in touch category analyses, we extracted effective features to improve performance in non-constrained environment data. In addition to improving performance in sensor-category datasets, we used an overlap windowing method on sensor records.
The majority of the feature selection work utilized a fixed count of features for each task. It may reduce both individual and overall task performance. To address these issues, we utilized the mRMR feature selection algorithm with cross-validation to determine the optimal feature count.
We have analyzed features extracted from swipe, zoom, and finger task features that work well in constrained environments but suffer in non-constrained environments because they are difficult to perform. However, tap-type task features work well in both environments.
The remainder of the paper is structured as follows: Section 2 goes over related work. Section 3 discussed details of the proposed methodology and dataset collection. Section 4 discussed the results and discussion, and Section 5 discussed the conclusion and future work.
2 Related works
The smartphone is utilized in various applications such as user age detection, user authentication, human activity recognition (Sunny et al., 2015), gender detection, Health monitoring activity, etc. It was accomplished by smartphone special features and mobile touch data. In conventional smartphone user identification/authentication mechanisms are based on PINS, passwords, and biometric authentication are used to protect the smartphone user’s privacy (Alqarni et al., 2020). In human activity recognition methods, smartphone sensor data, such as accelerometers, compasses, and gyroscopes, were utilized (Sunny et al., 2015). In health monitoring activity, sensors can be utilized to measure several health parameters, such as HR variability (HRV), Respiratory Rate (RR), Heart Rate (HR), and health conditions such as eye diseases and skin diseases (Majumder and Deen, 2019).
2.1 User’s age detection using smartphone usage
In this study, we focus on user age detection, one of the smartphone applications that uses touch and sensor-based data to detect the user’s age (Chen and Shen, 2017). Touch data refers to the data gathered during a user’s interaction with a mobile screen, while sensor data refers to the data collected from the mobile device’s sensors, such as accelerometers and gyroscopes (motion or orientation) during user interaction with the mobile device. To detect user age based on mobile touch data, a lot of work has been proposed recently (Roy et al., 2022; Alqarni et al., 2020). Most of the existing works collected datasets in constrained or non-constrained environments, some works did not specify environmental details, and they collected a below than 300 users’ records. So, we collected our dataset, which has approximately 624 user records from both environments, to analyze the performance of both environments. The details of our dataset are discussed in Section 3.1. The majority of the works focused solely on touch-based data user detection, others used sensor-based data, and a few works used both touch and sensor data.
2.1.1 Touch-based age detection
A study (Hossain and Haberfeld, 2020) created an Android app to collect tapping task data for age classification from 262 users aged 6 to 51 using tablets and phones. Phones and tablets have the highest classification accuracy at 73.63 and 82.28%, respectively. Vatavu et al. (2015) collected touch-based data from 89 children aged 3 to 6 using smartphones and tablets achieved user age classification results of 86.5%. To classify user age groups, 50 users were asked to provide gesture-based features on their (AL-Showarah et al., 2016). It demonstrates that accuracy increased when combining more features. Swipe behavior-based authentication was used, and the dataset was collected from 54 users (Ali et al., 2021). The optimal features were selected, and 5 machine learning algorithms were used. The random forest achieved the optimal performance in terms of F1 score. Aside from age classification, Guarino et al. (2022) collected data from 147 users for user gender classification; it has more than 9,500 samples for users.
2.1.2 Sensor-based age detection
In sensor-based analysis, Davarci et al. (2017) collected a dataset from 200 users by performing tap tasks and achieved 92.5% accuracy. It utilized Discrete Fourier Transform (DFT) and Discrete Cosine Transform (DCT) for feature extraction. Yu et al. (2019) collected sensor data from 84 users to detect user age, gender, and personality traits. According to Nguyen et al. (2019), Cheng et al. (2020) used accelerometer sensor data to determine the child’s age. One limitation of these studies is that they only used sensor data from young children and did not include touch data. In Nguyen et al. (2019), a motion sensor dataset from 100 users was used to differentiate adults and children, and achieved 96% accuracy on Random Forest. Aside from age detection, many studies used sensor (Jain and Kanhangad, 2016; Meena and Sarawadekar, 2020; Singh et al., 2019) data to detect gender.
2.1.3 Touch-sensor-based age detection
According to Cheng et al. (2020) recommended iCare, a system that can automatically and effectively recognize child users while they use smartphones. iCare captures age information by recording touch data and finger information, extracting hand geometry, and hand stability features (via gyroscope and accelerometer). They experimented on 100 people, 62 of whom were children and 38 of whom were adults. According to the results, iCare can accomplish 96.6% accuracy for child detection with a single swipe on the screen, and 98.3% accuracy with three consecutive swipes.
Most research works use raw datasets for classification, and some studies use statistical features to improve the classification performance. In sensor-based analysis, some studies have converted time-domain signals into frequency-domain signals using Discrete Wavelet Transform (DWT), DCT, and Fast Fourier Transform (FFT; Davarci et al., 2017). Then statistical features were extracted for the frequency domain signal. Those works only considered two or three tasks for age detection, whereas our work considered five different tasks. To achieve optimal performance, we extracted some additional features. Some of the features we extracted are inspired by previous work (Cheng et al., 2020), while others are new to this work, particularly the swipe and finger size-related features tasks. Furthermore, we introduce a strategy to improve sensor-based data performance by splitting the sensor record into windows, and for each window, we extract average statistical features.
In addition, some works used feature selection for age detection. The study Nguyen et al. (2019) utilized random forest to select the top 50 and top 20 features from tape and stroke sensor data. Some work utilized K-best and filter-based feature selection. However, existing feature selection work has limitations. Fixed feature count selection is the primary disadvantage of these feature selection methods. To avoid these study Ruiz-Garcia et al. (2024) and Acien et al. (2019) employed sequential forward selection to select the best subset of features. Although sequential forward selection is a simple and user-friendly method for feature selection, it does have some drawbacks. The computationally intensive nature and risk of missing globally optimal feature subsets limit its usefulness in complex scenarios. However, mRMR (Gao et al., 2020) offers a more sophisticated approach that may result in enhanced performance. The ability of mRMR to account for both feature redundancy and relevance makes it a more effective feature selection method for complex scenarios. However, mRMR requires additional support to select the optimal feature set; therefore, in this work, we use the cross-validation method to select the optimal feature set for each task. The majority of the existing work focused on either a constrained or non-constrained environment, but in this study, we focus on both environments. To achieve optimal performance in both environments, we have employed the proposed feature extraction method and mRMR, along with a cross-validation feature selection method.
3 Proposed methodology
Our proposed methodological framework consists of four major parts, as follows: (1) Dataset collection, (2) data cleaning process, (3) effective feature extraction, (4) mRMR with cross-validation feature selection, and (5) ensemble classifier. The general block diagram of our proposed methodology is shown in Figure 2. In the dataset collection phase, we have collected both constrained and non-constrained environment data by performing different tasks, including tapping, typing, zooming, swiping, and measuring the finger size of all five fingers. Additionally, we collected the respective sensor data of these tasks. We manually reviewed missing value records and removed these unnecessary data records in the data cleaning process. After the data cleaning process, touch and sensor-based features were extracted by using the proposed feature extraction mechanisms. To select the optimal feature set, mRMR feature selection was used, and an ensemble classifier was employed for classification.
Figure 2
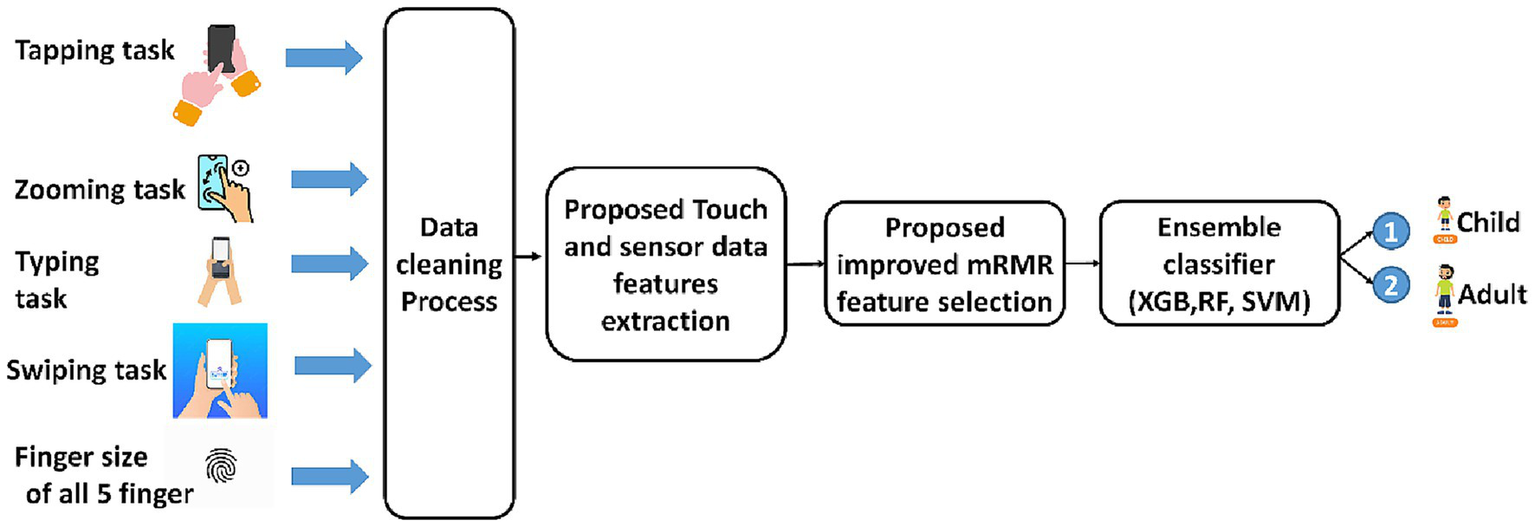
General block diagram of the proposed framework.
3.1 Dataset collection
In our work, we collected our dataset on both constrained and non-constrained environments by performing five different types of tasks, such as tapping, typing, zooming, swiping, and measuring the finger size of all five fingers. By collecting datasets from both environments, our work slightly differs from other traditional works. In a constrained environment, users must hold the phone either in their hands or on a table to finish the tasks. Whereas in a non-constrained environment, users are allowed to move freely while performing tasks.
For dataset collection purposes, we used the Samsung Galaxy M31, Samsung Galaxy M30 devices for dataset collection. We developed an app called “In_House,” with the help of C# language (Sung et al., 2014), which includes different tasks that the user must finish, such as Tap, Swipe, Type, and Zoom Tasks. Figure 3 shows the app layout of the different task dataset collection. The participants in this research are citizens of Chennai and its surrounding areas, a metropolitan area in the state of Tamil Nadu, India. We stated in the very first step of the app that we do not collect any personal data except age, and the dataset collected is only for research purposes. While completing each task, this app records touch data as well as corresponding sensor data. Lastly, it records each user’s finger size. In this work, we detected user age by three different categories: touch-category, sensor-category, and touch-sensor category. In the touch-category, age detection was performed solely using touch recordings of those tasks, whereas in the sensor-category, it was performed solely using sensor recordings of those tasks.
Figure 3
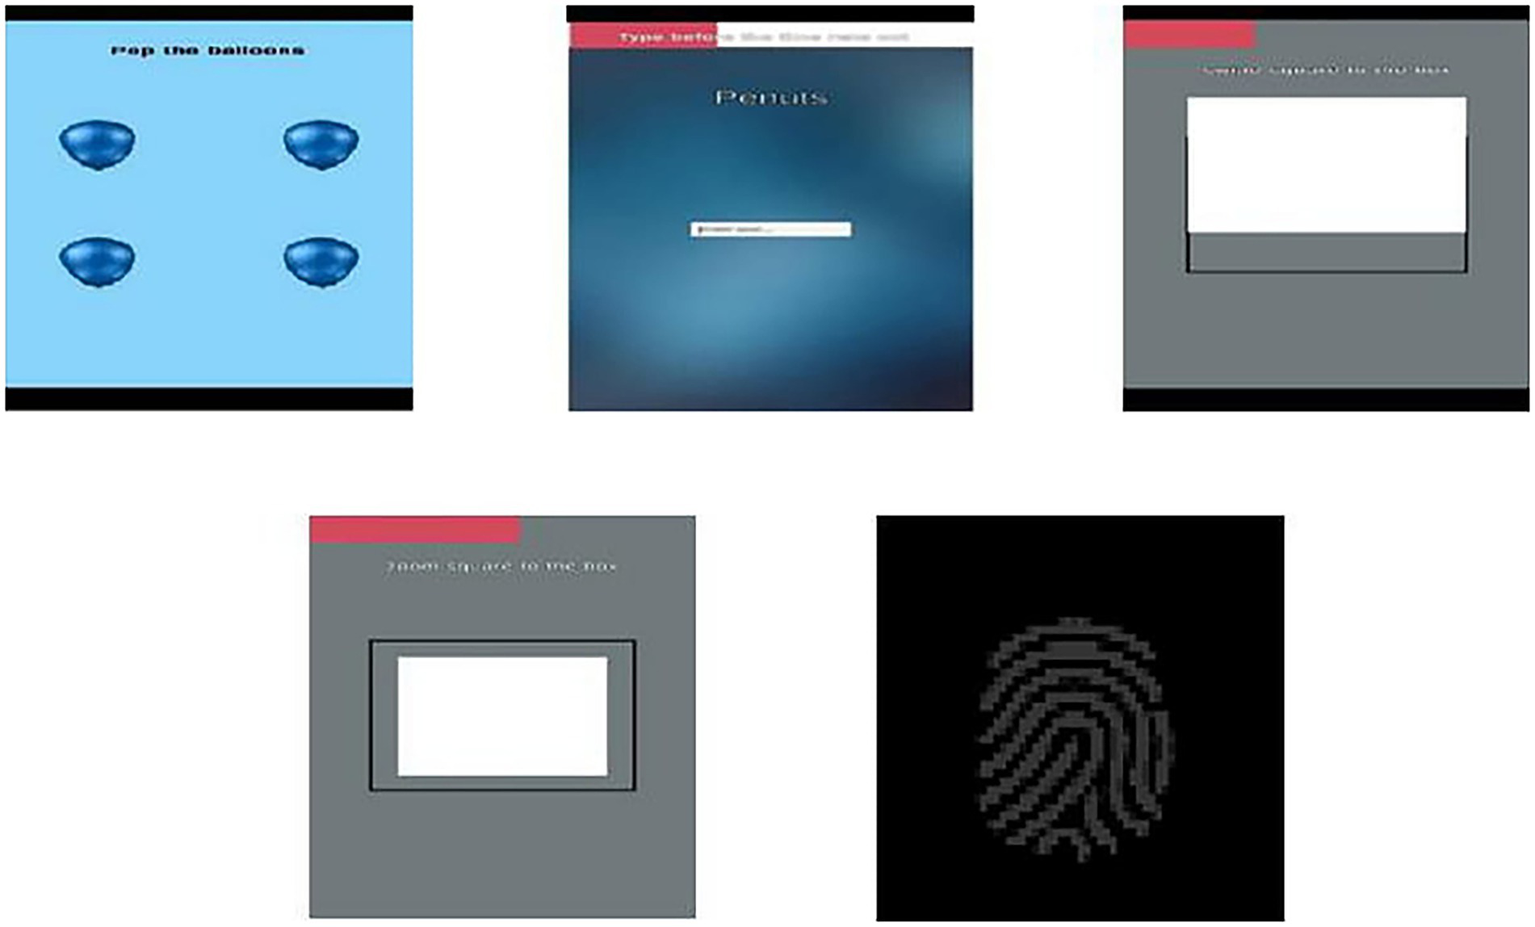
Dataset collection of different tasks (tap, type, swipe, zoom, and finger size).
In the touch-sensor category, age detection was performed using both touch and sensor records. Figure 4 represents user distribution based on age group. We recorded a dataset from children aged 3 to 14 years old and adults aged 15 to 70 years old with their permission. Each user performed the tasks of tapping, typing, zooming, and swiping five times. The full details of our novel dataset were discussed in Sait et al. (2023). Table 1 indicates the dataset’s count details. Figure 5 shows the distribution of two classes, such as child and adult. Class adult contains 199 samples, whereas class child contains 249 samples. This represents a relatively balanced dataset, with class adult taking up approximately 44.4% of the total data and class child taking up 55.6%. Most of the previous work (Sait, 2023; Hossain and Haberfeld, 2020) collects a maximum of 300 user records for analysis; however, we collected approximately 624 users, with 448 entries from constrained environments and 176 from non-constrained environments.
Figure 4
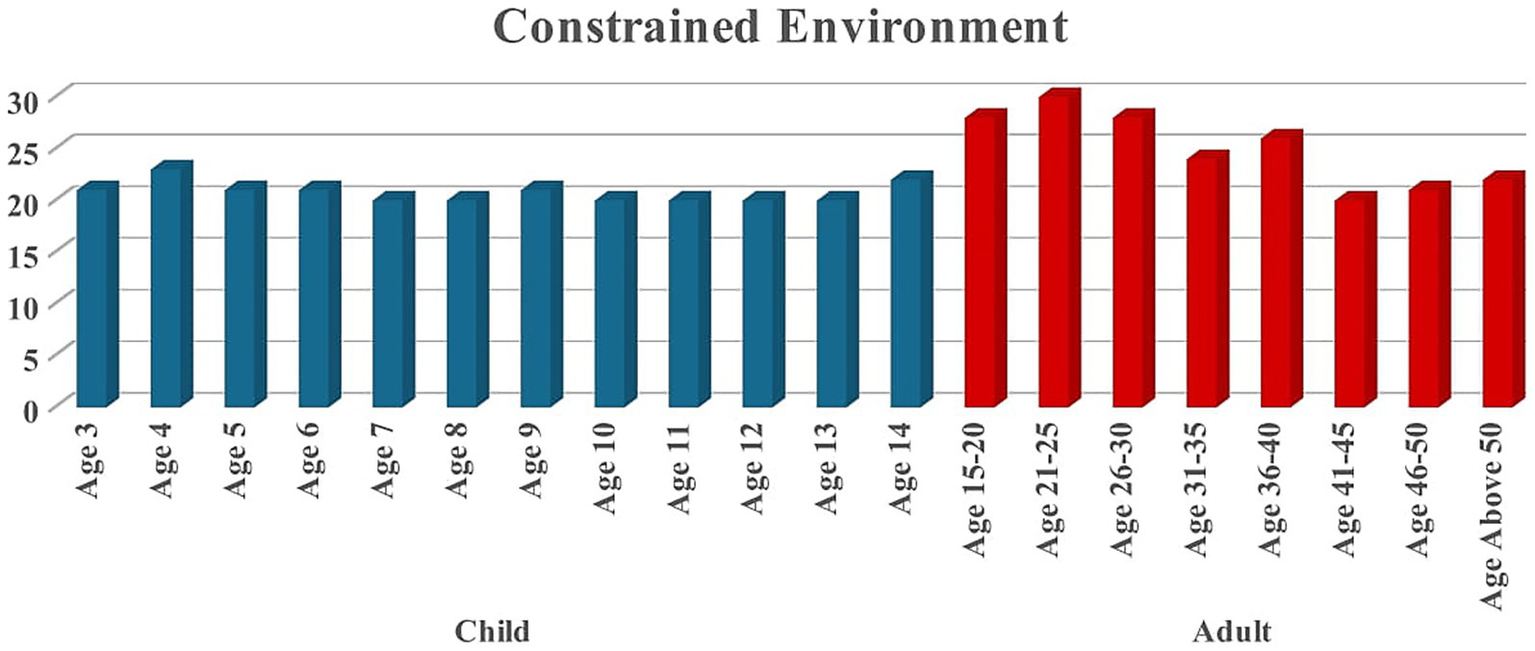
User distribution based on age groups.
Table 1
| S. No | Number of users in the Constrained Environment | Number of users in Non-constrained Environment |
|---|---|---|
| Adult | 199 | 96 |
| Child | 249 | 80 |
| Total | 448 | 176 |
| 624 | ||
Dataset user count details.
Figure 5
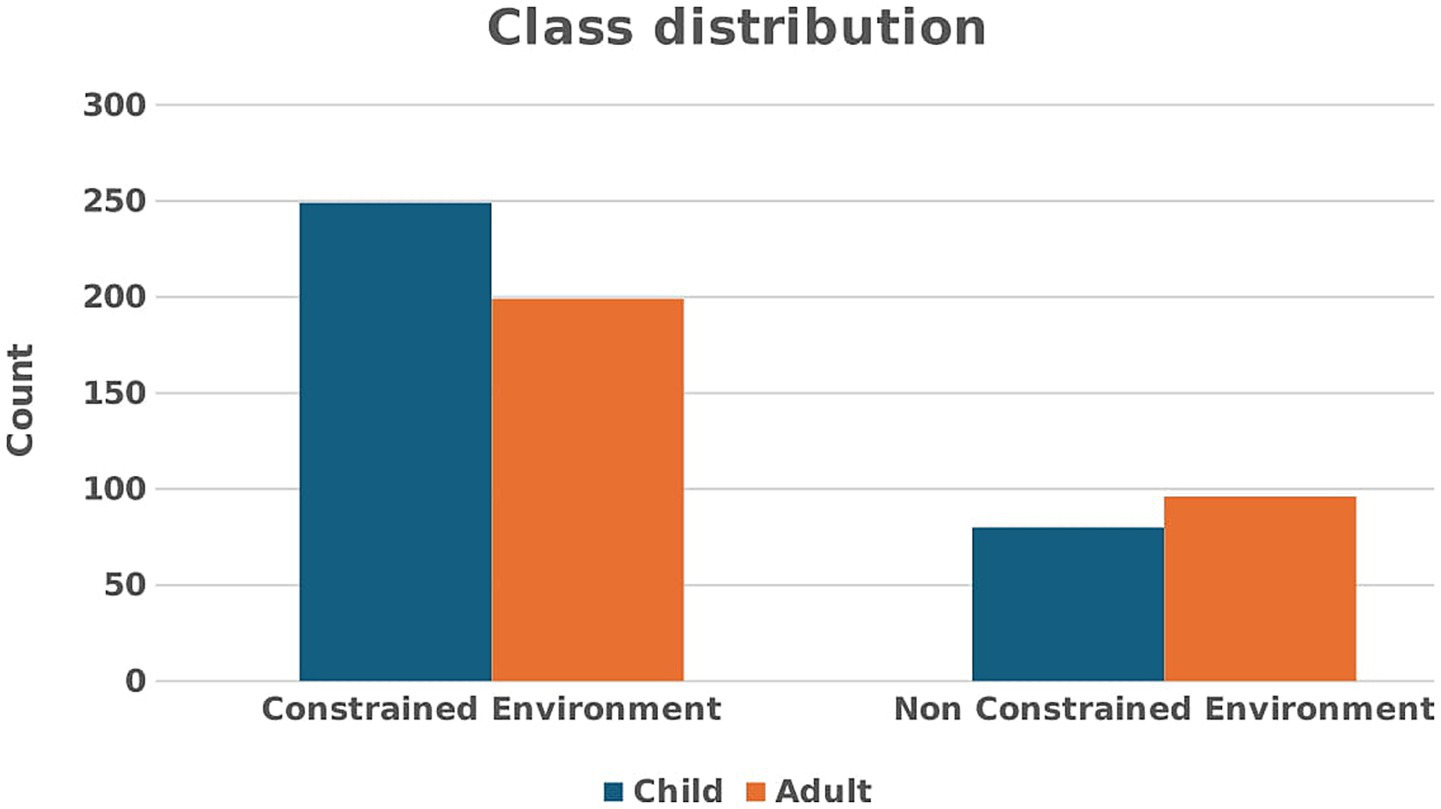
Class distribution for both environments.
Table 2 indicates the total number of average samples for each task in the constrained and non-constrained environments. For the tap and finger tasks, each user has 20 and 5 samples, respectively. However, for the swipe, type, and zoom tasks, a user’s sample may vary depending on user interaction, so we calculated the average sample per user for these tasks. For the swipe, type, and zoom tasks, we get 329, 19, and 311 average samples per user, respectively. We get the number of samples per task by multiplying the average number of samples per user by the total number of users. (i.e., number of constrained environment users: 448 * number of samples per task (for type task-19) = 8,512). For all tasks, we achieve 426,816 samples.
Table 2
| Task | Average sample per user | Number of average samples in a constrained environment | Number of average samples in a non-constrained environment | Total |
|---|---|---|---|---|
| Tap | 20 | 8,960 | 3,520 | 12,480 |
| Swipe | 329 | 147,392 | 57,904 | 205,296 |
| Type | 19 | 8,512 | 3,344 | 11,856 |
| Zoom | 311 | 139,328 | 54,736 | 194,064 |
| Finger | 5 | 2,240 | 880 | 3,120 |
Number of average samples for all tasks.
3.2 Data cleaning process
After data collection, the raw dataset may contain some missing values. Especially in the swipe task, most of the value records are missing from the child user records. We manually reviewed all task records and removed the particular user record from all tasks if we determined any one of them had an empty record. The cleaned data records were used for the following feature extraction process.
3.3 Proposed effective features extraction methods (PEFE)
Extracting effective features from these cleaned data records is necessary to obtain improved performance in both environments, as we have considered non-constrained environment data for validation purposes. Most of the prior works utilized a raw dataset or a traditional statistical feature extraction method. To improve performance in both environments, we extracted some new features here. Touch-category and sensor-category feature extraction methods are discussed as follows.
3.3.1 Touch-category features extraction
In touch-category feature extraction, some features are inspired by other work, and some features are extracted as new in this paper, especially finger size-related features.
3.3.1.1 Tapping
The features obtained from the tapping task are as follows: the time taken for each of the five attempts, mean time of all five attempts, variance time of all five attempts, sum of the time taken for all attempts, an average of the finger size, variance of finger size, Euclidean distance (Alsuhibany and Almuqbil, 2021), Manhattan distance (Zhang et al., 2020), and Mean Square Error (MSE) between balloon and touch positions for each of the five attempts, standard deviations for the X and Y positions of the 1st tap touch and balloon across all 5 attempts (Cheng et al., 2020), relative start position for touch X, relative stop position for touch Y, relative start position for balloon X, and relative stop position for balloon Y across all attempts (Cheng et al., 2020). A total of 49 features were extracted from tapping records. Table 3 provides an overview of the tap-related extracted features.
Table 3
| Features | Description |
|---|---|
| F1–F5 | Time taken for 1st,2nd, 3rd, 4th and 5th tap |
| F6 | Mean time of all 5 attempts |
| F7 | Variance time of all 5 attempts |
| F8 | Sum of the time taken for all 5 attempts |
| F9 | Average of finger size for all 5 attempts |
| F10 | Variance of finger size for all 5 attempts |
| F11–F15 | Euclidean distance between balloon and touch position—1st,2nd, 3rd, 4th and 5th tap |
| F16–F20 | Manhattan distance between balloon and touch position—1st,2nd, 3rd, 4th and 5th tap |
| F21–F25 | MSE between balloon and touch position—1st,2nd, 3rd, 4th and 5th tap |
| F26 | Standard deviations touch start position for all tap |
| F27 | Standard deviations touch stop position for all tap |
| F28 | Standard deviations balloon start position for all tap |
| F29 | Standard deviations balloon stop position for all tap |
| F30–F34 | Relative start touch position for all 5 taps |
| F35–F39 | Relative stop touch position for all 5 taps |
| F40–F44 | Relative start balloon position for all 5 taps |
| F45–F49 | Relative stop balloon position for all 5 taps |
A tap extracted features.
3.3.1.2 Swiping
The features attained from the swiping task are as follows: the mean time for each of the five attempts, mean time of all five attempts, variance time of all five attempts, an average of fingers size, variance of fingers size, relative start positions for touch X and touch Y, as well as the relative stop positions for touch X and touch Y across all attempts; extracting statistical features (mean, standard deviation, variance, minimum, maximum, data range, quartiles, and interquartile range) for finger distance and image position; compute direct end-to-end distance for finger distance and image position (Cheng et al., 2020). Additionally, the user’s touch X and Y position values are converted to the frequency domain using the DCT, and respective statistical features are extracted. A total of 75 features were extracted from the records. DCT or DFT was only used for sensor-based analyses in earlier work (Davarci et al., 2017). In this work, we have employed DCT to enhance the swipe touch-based performance. Details of the extracted swipe features are listed in Table 4.
Table 4
| Features | Description |
|---|---|
| F1–F5 | Time taken for 1st,2nd, 3rd, 4th and 5th swipe |
| F6 | Mean time of all 5 attempts |
| F7 | Variance time of all 5 attempts |
| F8 | Sum of the time taken for all 5 attempts |
| F9 | Average of finger size for all 5 attempts |
| F10 | Variance of finger size for all 5 attempts |
| F11–F15 | Relative start touch position of X for all 5 swipes |
| F16–F20 | Relative stop touch position of X for all 5 swipes |
| F21–F25 | Relative start touch position of Y for all 5 swipes |
| F26–F30 | Relative stop touch position of Y for all 5 swipes |
| F31 | Direct end-to-end distance for finger distance and image position |
| F32–F42 | Statistical features (Mean, standard deviation, variance, minimum, maximum, data range, quantities (3), interquartile range, and skewness) of the user’s touch X position values, which are converted to the frequency domain using the Discrete Cosine Transform |
| F43–F53 | Statistical features (Mean, standard deviation, variance, minimum, maximum, data range, quantities (3), interquartile range, and skewness) of the user’s touch Y position values, which are converted to the frequency domain using the Discrete Cosine Transform |
| F54–F64 | Statistical features (Mean, standard deviation, variance, minimum, maximum, data range, quantities (3), interquartile range, and skewness) for finger distance |
| F65–F75 | Statistical features (Mean, standard deviation, variance, minimum, maximum, data range, quantities (3), interquartile range, and skewness) for image position |
A swipe extracted features.
3.3.1.3 Zooming
Similar to the tapping task, time and finger features were extracted, but in this task, we extracted two fingers. In zooming tasks, statistical features such as mean, standard deviation, variance, minimum, maximum, data range, quartiles, and interquartile range were computed for the following records: initial distance, change in distance, finger 1’s X and Y position, and finger 2’s X and Y position. A total of 78 features were extracted. The extracted zoom features are summarized in Table 5.
Table 5
| Features | Description |
|---|---|
| F1–F5 | Time taken for 1st,2nd, 3rd, 4th and 5th zoom |
| F6 | Mean time of all 5 attempts |
| F7 | Variance time of all 5 attempts |
| F8 | Sum of the time taken for all 5 attempts |
| F9 | Average of finger size 1 across all 5 attempts |
| F10 | Variance of finger size 1 across all 5 attempts |
| F11 | Average of finger size 2 across all 5 attempts |
| F12 | Variance of finger size 2 across all 5 attempts |
| F13–F23 | Statistical features (Mean, standard deviation, variance, minimum, maximum, data range, quantities (3), interquartile range, and skewness) for the initial distance |
| F24–F34 | Statistical features (Mean, standard deviation, variance, minimum, maximum, data range, quantities (3), interquartile range, and skewness) for the change distance |
| F35–F45 | Statistical features (Mean, standard deviation, variance, minimum, maximum, data range, quantities (3), interquartile range, and skewness) for finger 1’s X position |
| F46–F56 | Statistical features (Mean, standard deviation, variance, minimum, maximum, data range, quantities (3), interquartile range, and skewness) for finger 1’s Y position |
| F57–F67 | Statistical features (Mean, standard deviation, variance, minimum, maximum, data range, quantities (3), interquartile range, and skewness) for finger 2’s X position |
| F68–F78 | Statistical features (Mean, standard deviation, variance, minimum, maximum, data range, quantities (3), interquartile range, and skewness) for finger 2’s Y position |
A zoom extracted features.
3.3.1.4 Typing
The typing features are: time taken for each word to complete the typing, mean and variance time of all attempts, overall mean typing time, between each target word and user input: the Levenshtein (Palin et al., 2019) distance, MSE, accuracy, and Root Mean Square Error (RMSE) are calculated. A total of 40 features were extracted. Table 6 shows the details of the type extracted features.
Table 6
| Features | Description |
|---|---|
| F1–F5 | Time taken to type all letters in the 1st, 2nd,3rd,4th and 5th words |
| F6–F10 | Mean time per letter to complete 1st, 2nd,3rd,4th and 5th words |
| F11–F15 | Variance of typing time (1st, 2nd,3rd,4th and 5th words) |
| F16 | Overall mean typing time |
| F17–F21 | Levenshtein distance between the target string and the typed string (all 5 words) |
| F22–F26 | MSE between the target string and the typed string (all 5 words) |
| F27–F31 | RMSE between the target string and the typed string (all 5 words) |
| F32–F36 | Accuracy between the target string and the typed string (all 5 words) |
| F37 | Average Levenshtein distance between the target string and the typed string of all 5 words |
| F38 | Average MSE between the target string and the typed string of all 5 words |
| F39 | Average RMSE between the target string and the typed string of all 5 words |
| F40 | Average accuracy between the target string and the typed string of all 5 words |
A type extracted features.
3.3.1.5 Finger size
It has only 5 records; from these 5 records, we have extracted 37 features. In prior work, finger-related feature extraction got less attention (Chen et al., 2019). In this work, we extracted new finger size-related features described in Table 7. As a result, finger-sized data attains some significant performance in a constrained environment.
Table 7
| Features | Description |
|---|---|
| F1 | Mean of all fingers. |
| F2 | Mean of thumb and index finger. |
| F3 | Mean of the ring index middle finger. |
| F4 | Sum of all fingers. |
| F5 | Sum of thumb and index finger. |
| F6 | Sum of the ring index middle finger. |
| F7–F17 | Standard deviation, variance, minimum, maximum, data range, quantities (3), interquartile range, skewness, and kurtosis of all finger raw data. |
| F18–F21 | Ratios for the thumb finger to the rest of the fingers. |
| F22–F25 | Ratios for the index finger to the rest of the fingers. |
| F26–F29 | Ratios for the middle finger to the rest of the fingers. |
| F30–F33 | Ratios for the ring finger to the rest of the fingers. |
| F34–F37 | Ratios for the little finger to the rest of the fingers. |
A new finger size extracted features.
3.3.2 Sensor-category feature extraction
Generally, in sensor-based feature extraction, statistical features are extracted from all sensor records. However, in this work, we split the records (roll, pitch, and yaw) into certain overlapping windows to improve sensor-based data performance. Each task has a different number of entries because some tasks take a long time, such as typing, swiping, and zooming, while others, such as finger and tap, take less time. So, we have assigned a number of windows as 20 and an overlapping window size of 50% of the window size. The window size is computed by dividing the total length of the record by the number of windows. The average of each window’s statistical features was extracted and utilized for the next feature selection process. Here, both time and frequency domain features were extracted. The feature details are given below:
Time domain statistical features: After splitting the records into a window, the statistical features such as Average, RMS, standard deviation, variance, minimum, maximum, and average deviation were extracted for roll, pitch, and yaw (Cheng et al., 2020).
Frequency domain statistical features: In the frequency domain, the roll, Pitch, and raw were converted as magnitude (Davarci et al., 2017) by using Equation 1. Following that, the magnitude signal was converted to a frequency domain signal using DCT. Finally, statistical features such as mean, standard deviation, variance, minimum, maximum, data range, quartiles, and interquartile range were extracted from this frequency domain signal.
We have four sensor readings, including attitude, gravity, unbiased rotation rate, and user acceleration. Each reading generates 32 features. Overall, we have 128 (32 × 4) sensor features per task.
3.4 Feature selection
To improve the classifier’s performance, an mRMR (Gao et al., 2020) feature selection algorithm was implemented, because it effectively balances relevance and redundancy, which are key aspects of feature selection. Unlike simple filter techniques that merely assess the relationship between each feature and the target, mRMR chooses relevant features that are highly correlated with the target/class label and eliminates redundant features, which degrade the performance of the model. Compared to wrapper approaches such as Recursive Feature Elimination (RFE), mRMR is computationally more economical and prevents overfitting because it does not train models repeatedly during the selection procedure. Additionally, unlike embedded approaches such as Lasso, which are model-dependent and may disregard nonlinear dependencies, mRMR is model-independent and captures complex nonlinear relationships through mutual information. Table 8 represents the extracted feature count details for all tasks. Due to the high dimensionality of the extracted features, the machine learning algorithm may perform poorly when combining touch and sensor data. Some existing work also used a feature selection algorithm; however, they selected the top 10 or 20 fixed features. Setting specific feature counts for feature selection may reduce individual task performance. This limitation is avoided by selecting the appropriate feature count for each task. To achieve this, we utilized mRMR with a cross-validation (Peng et al., 2005) feature selection algorithm to select the optimal feature count for all individual tasks. The steps for mRMR with CV feature selection are as follows:
Determine successive subsets of features such that subset of . The next important features based on is added to to obtain Where is the function of mRMR. It relies on mutual information and measures the dependency between two variables, such as maximum relevance and minimum redundancy.
Relevance(D): It computes mutual information between each feature and the corresponding target class. It measures how closely each feature is related to the target.
Redundancy(R): Redundancy assesses the amount of information overlap between a candidate feature and the previously selected feature subset.
Finally, calculate the highest mRMR score by computing the mRMR score using
For each , Repeat step 3
Perform mRMR feature selection, perform 10-fold cross-validation on selected data using RF, and save the scores and selected features.
Determine the highest score, the corresponding feature set, and the feature count considered as the optimal feature set and feature count.
Table 8
| Task | Feature type | |||||
|---|---|---|---|---|---|---|
| Touch-category | Sensor-category | Touch-sensor-category | ||||
| Feature extracted | Feature selected | Feature extracted | Feature selected | Feature extracted | Feature selected | |
| Finger | 37 | 30 | 128 | 110 | 165 | 140 |
| Type | 40 | 28 | 128 | 54 | 168 | 82 |
| Swipe | 70 | 58 | 128 | 117 | 198 | 175 |
| Zoom | 78 | 73 | 128 | 94 | 206 | 167 |
| Tap | 49 | 35 | 128 | 67 | 177 | 102 |
| Tap and Swipe | 119 | 93 | 256 | 184 | 455 | 277 |
Details of the number of features extracted and selected for each feature type for each task.
Figure 6 represents the flow chart of mRMR with cross-validation feature selection. It begins with determining successive subsets of features such that subset of using mRMR ( feature selection algorithm. The next important feature based on is added to to obtain . Perform mRMR feature selection on the selected feature set. Then perform tenfold cross-validation on selected features using RF and save the score. The entire process iterated from minimum (1) to the length of n (maximum count −− number of extracted features in each task). Finally, determine the highest score, the corresponding feature set, and the feature count considered as the optimal feature set and feature count.
Figure 6
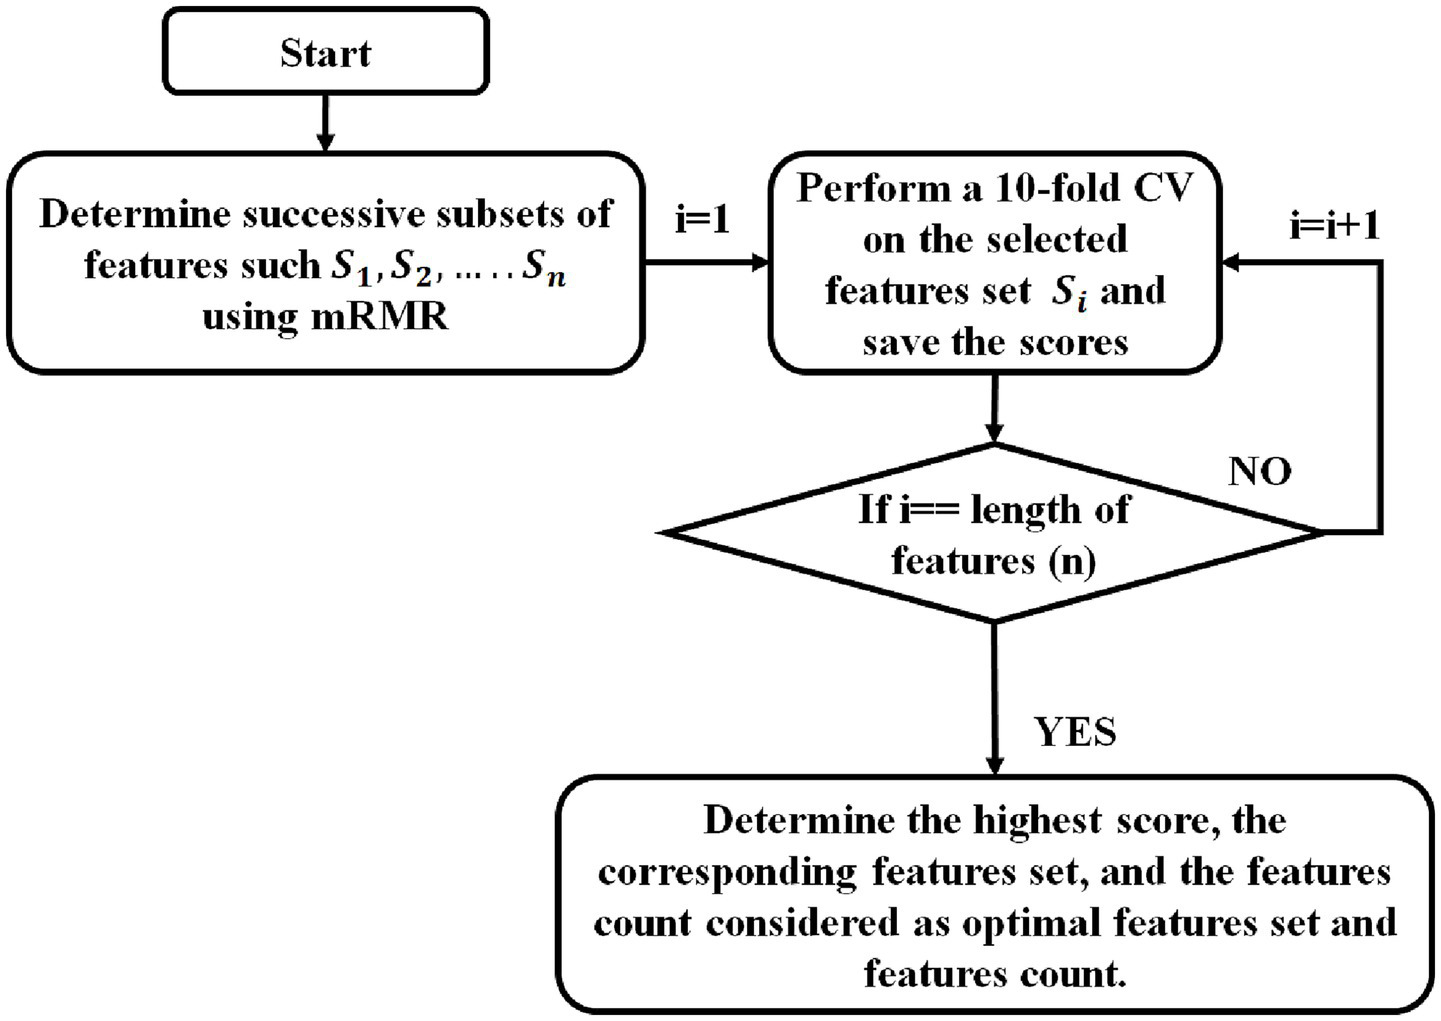
Flow chart of mRMR with cross-validation feature selection.
3.5 Ensemble classifier
Following the feature selection process, an ensemble classifier was employed to perform binary classification, where the data samples were categorized into adult and child based on their features. The ensemble learning model employed a soft voting approach, which combines the predicted probabilities of Support Vector Machine (SVM; Hossain and Haberfeld, 2020), Random Forest (RF; Shafique and Hato, 2017), and XGBoost (XGB; Mane et al., 2023) to determine the final class. SVM is excellent at handling high-dimensional feature spaces and offers significant generalization capabilities, making it suitable for difficult decision boundaries. XGB, a gradient boosting approach, excels at learning complex patterns and improving prediction accuracy through continuous learning with optimized loss functions. RF is noise-resistant, avoids overfitting by bootstrap aggregation, and effectively captures non-linear correlations. The ensemble balances accuracy, robustness, and generalization by combining margin-based, bagging-based, and boosting-based classifiers. Hyperparameter tuning was utilized to enhance the machine learning performance.
4 Results and discussion
In this work, classification accuracy has been used as a measure of the performance, as the data is balanced. We analysed the performance of individual tasks such as tap, type, swipe, zoom, finger size, and the combination of tap and swipe. To attain optimal performance, we extracted touch and sensor-category statistical features. Then, we used mRMR with a Cross-validation feature selection algorithm to select the optimal feature set.
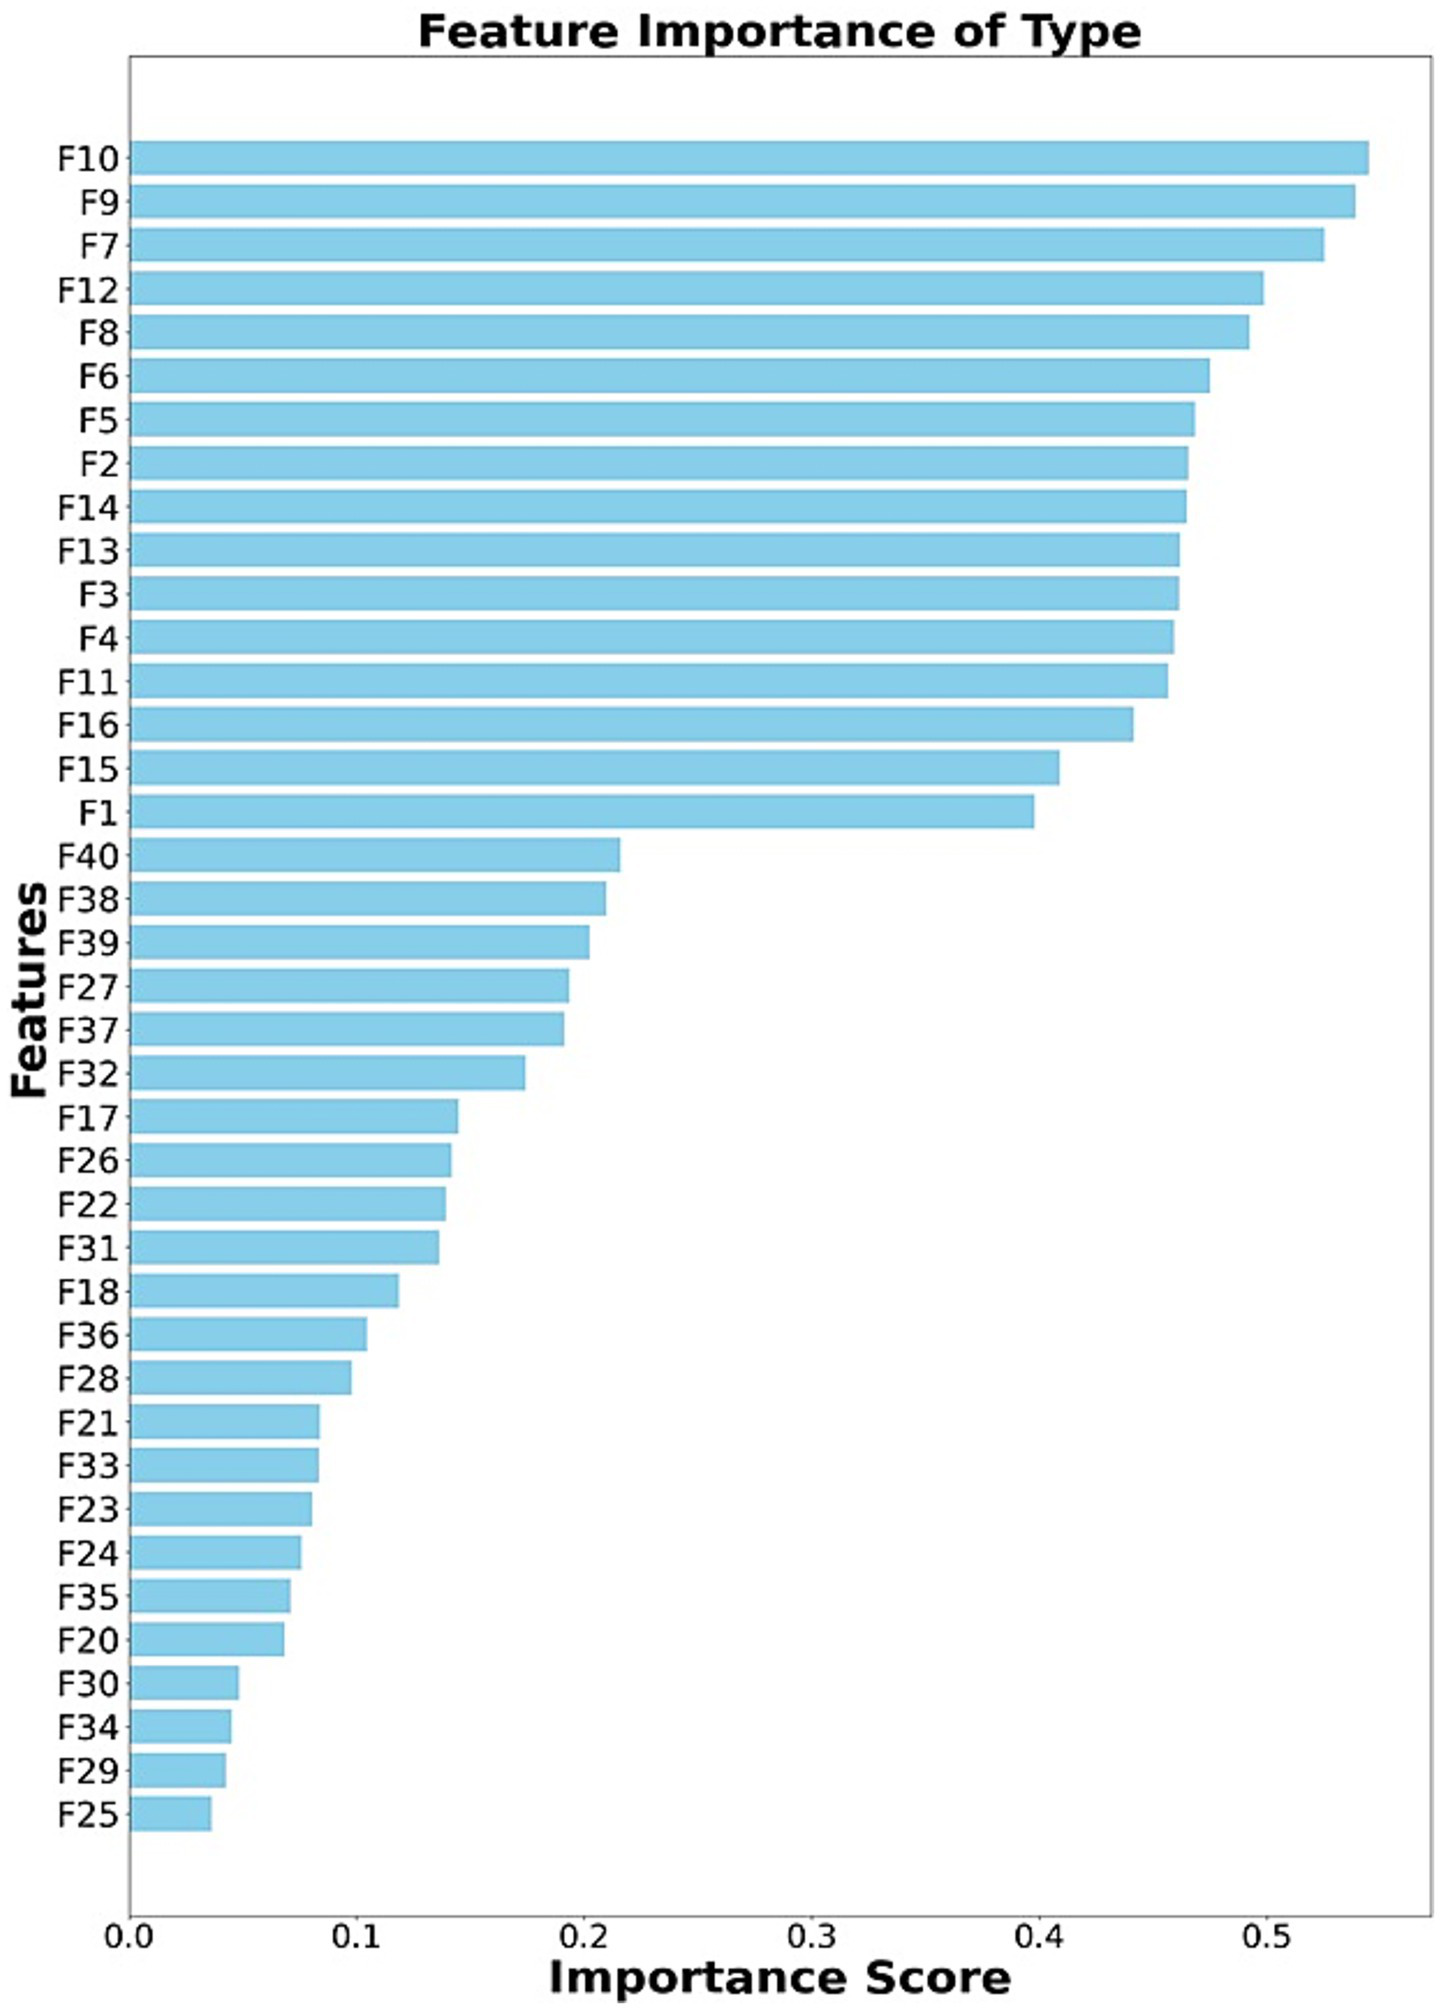
Figures 7–11 present the rankings of selected features for tap, swipe, type, zoom, and finger size data. This figure illustrates the ranking of feature subsets according to their influence on the performance of the classifier. Higher-ranked features contribute more to the model’s predictions. Table 8 represents the extracted feature count and selected feature count details for all kinds of tasks and feature categories. We utilized ensemble classifiers for classification with the Optuna hyperparameter optimization framework. To achieve stable performance, we repeated the experiments 10 times and calculated the mean of the accuracies. The constrained environment’s features are divided into 80% training and 20% testing; all non-constrained environment features were used as test data to obtain the performance in a non-constrained environment. Hyperparameter tuning was performed using Optuna with a maximum of 50 trials per classifier. Table 9 indicates the hyperparameters and search space of each classifier. The optimal configuration was chosen based on the highest validation accuracy.
Figure 7
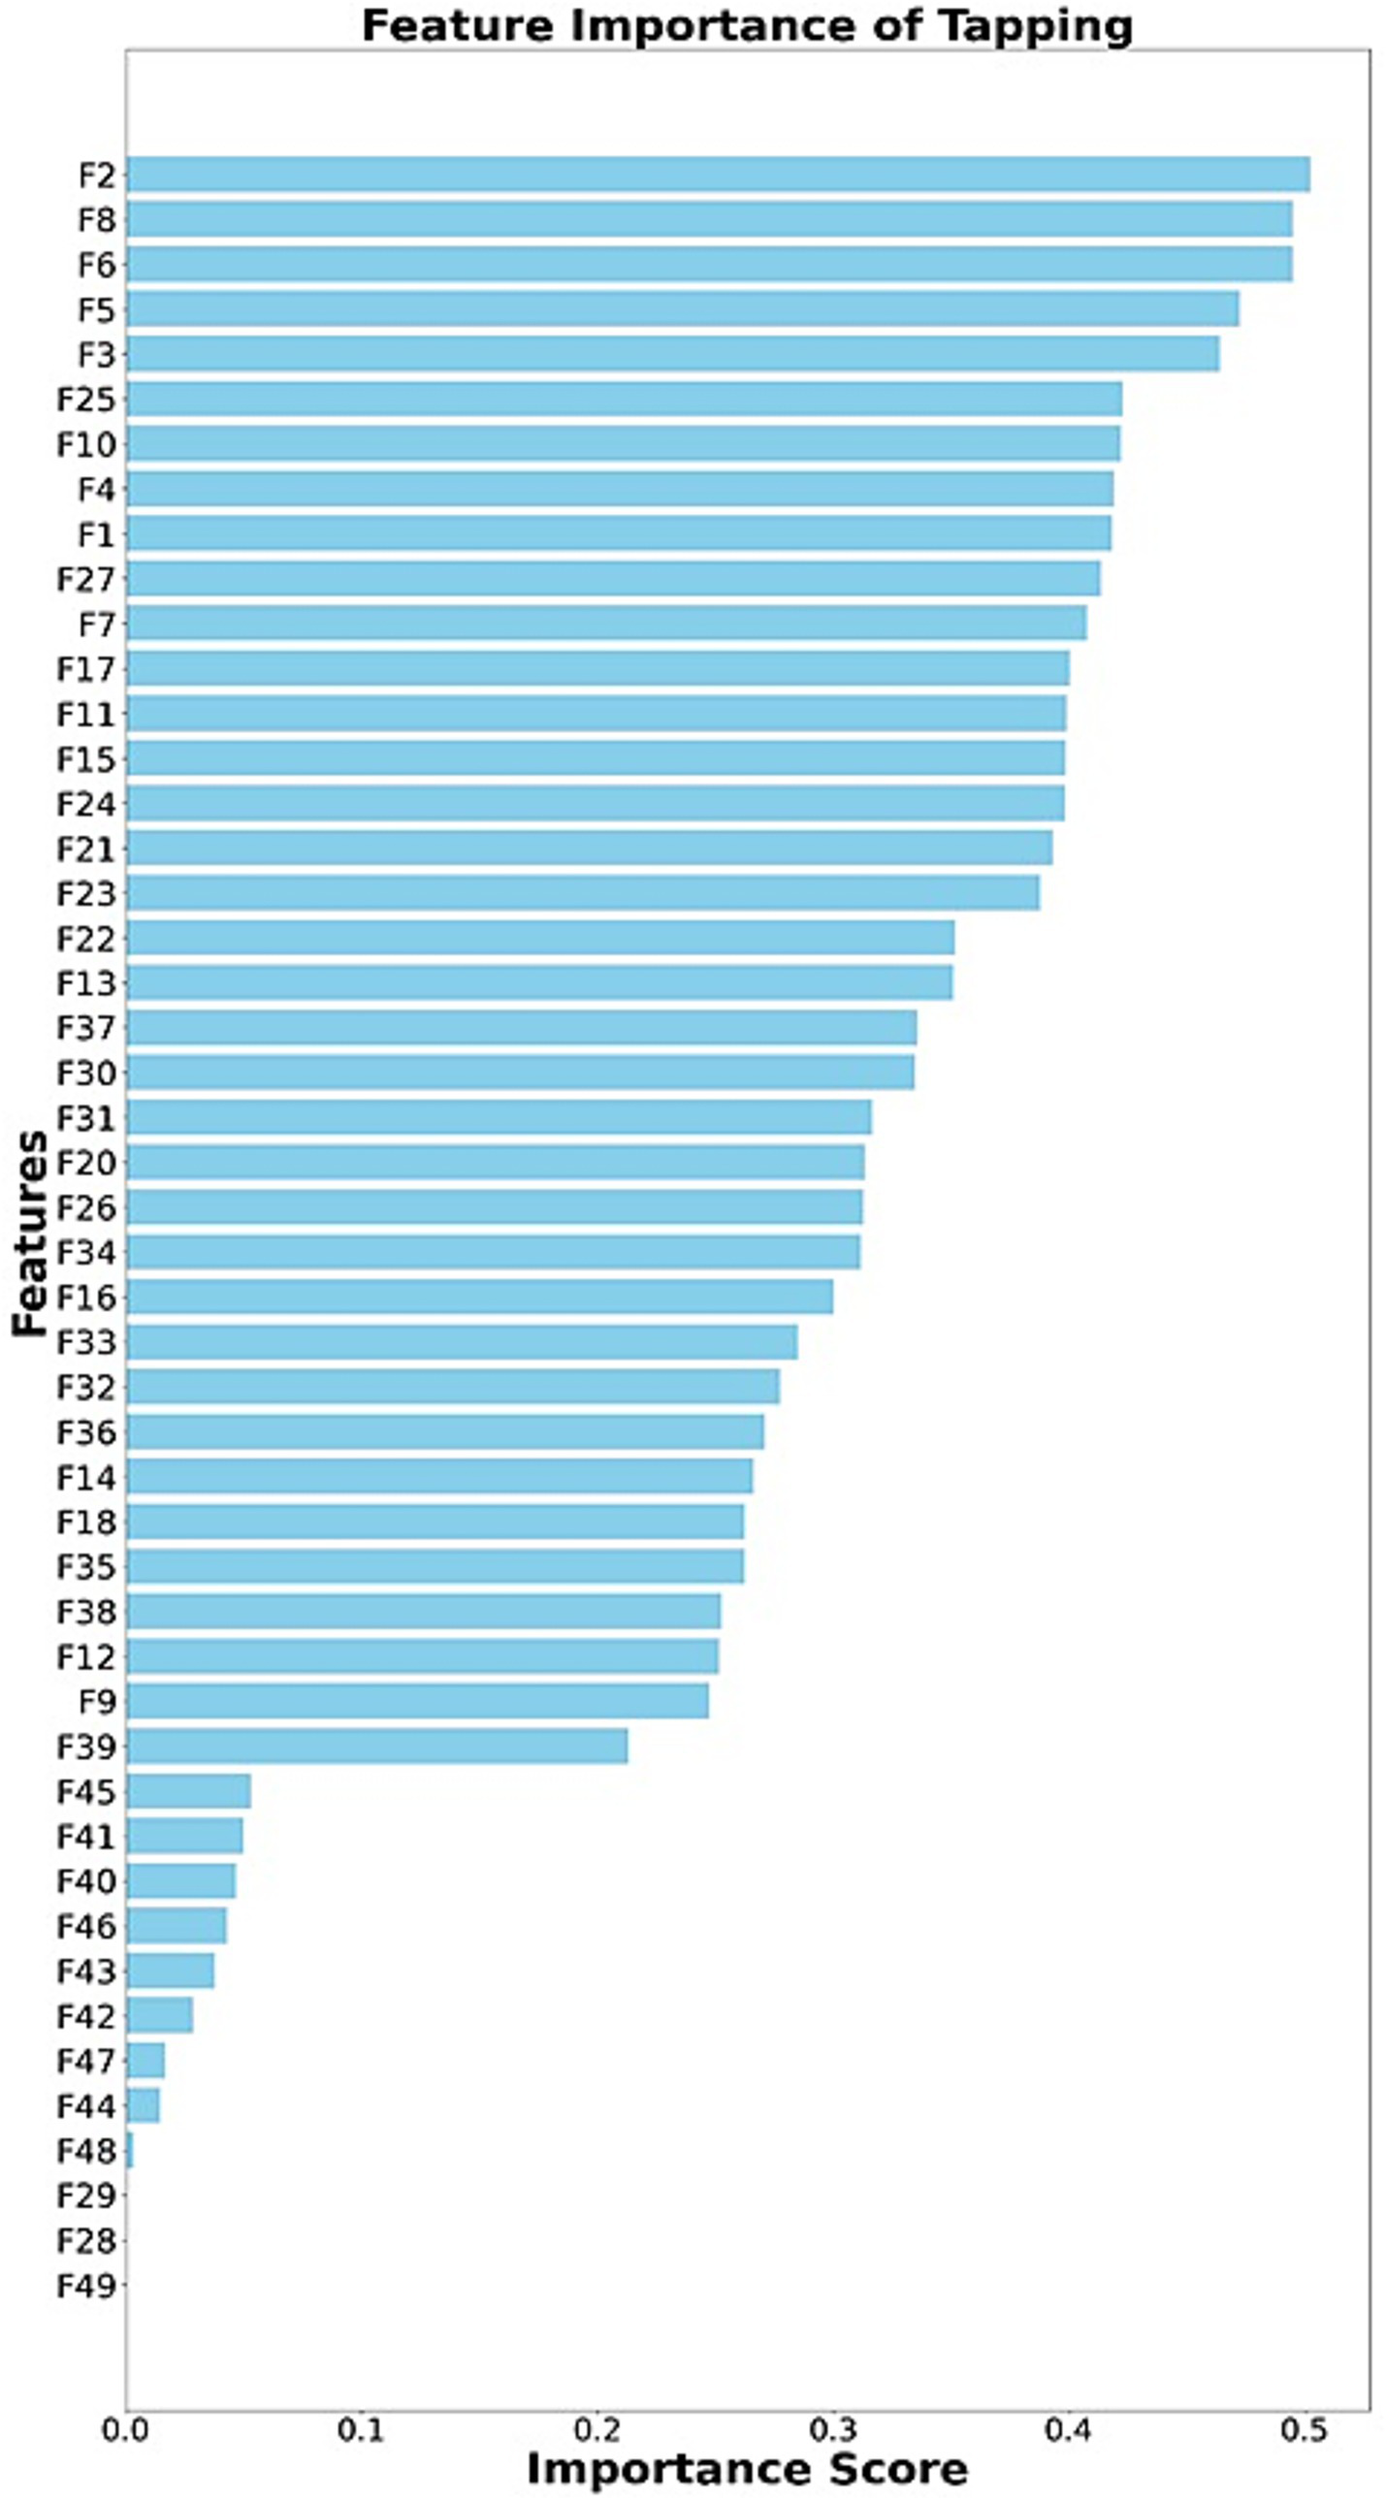
Ranking of selected features (tapping).
Figure 8
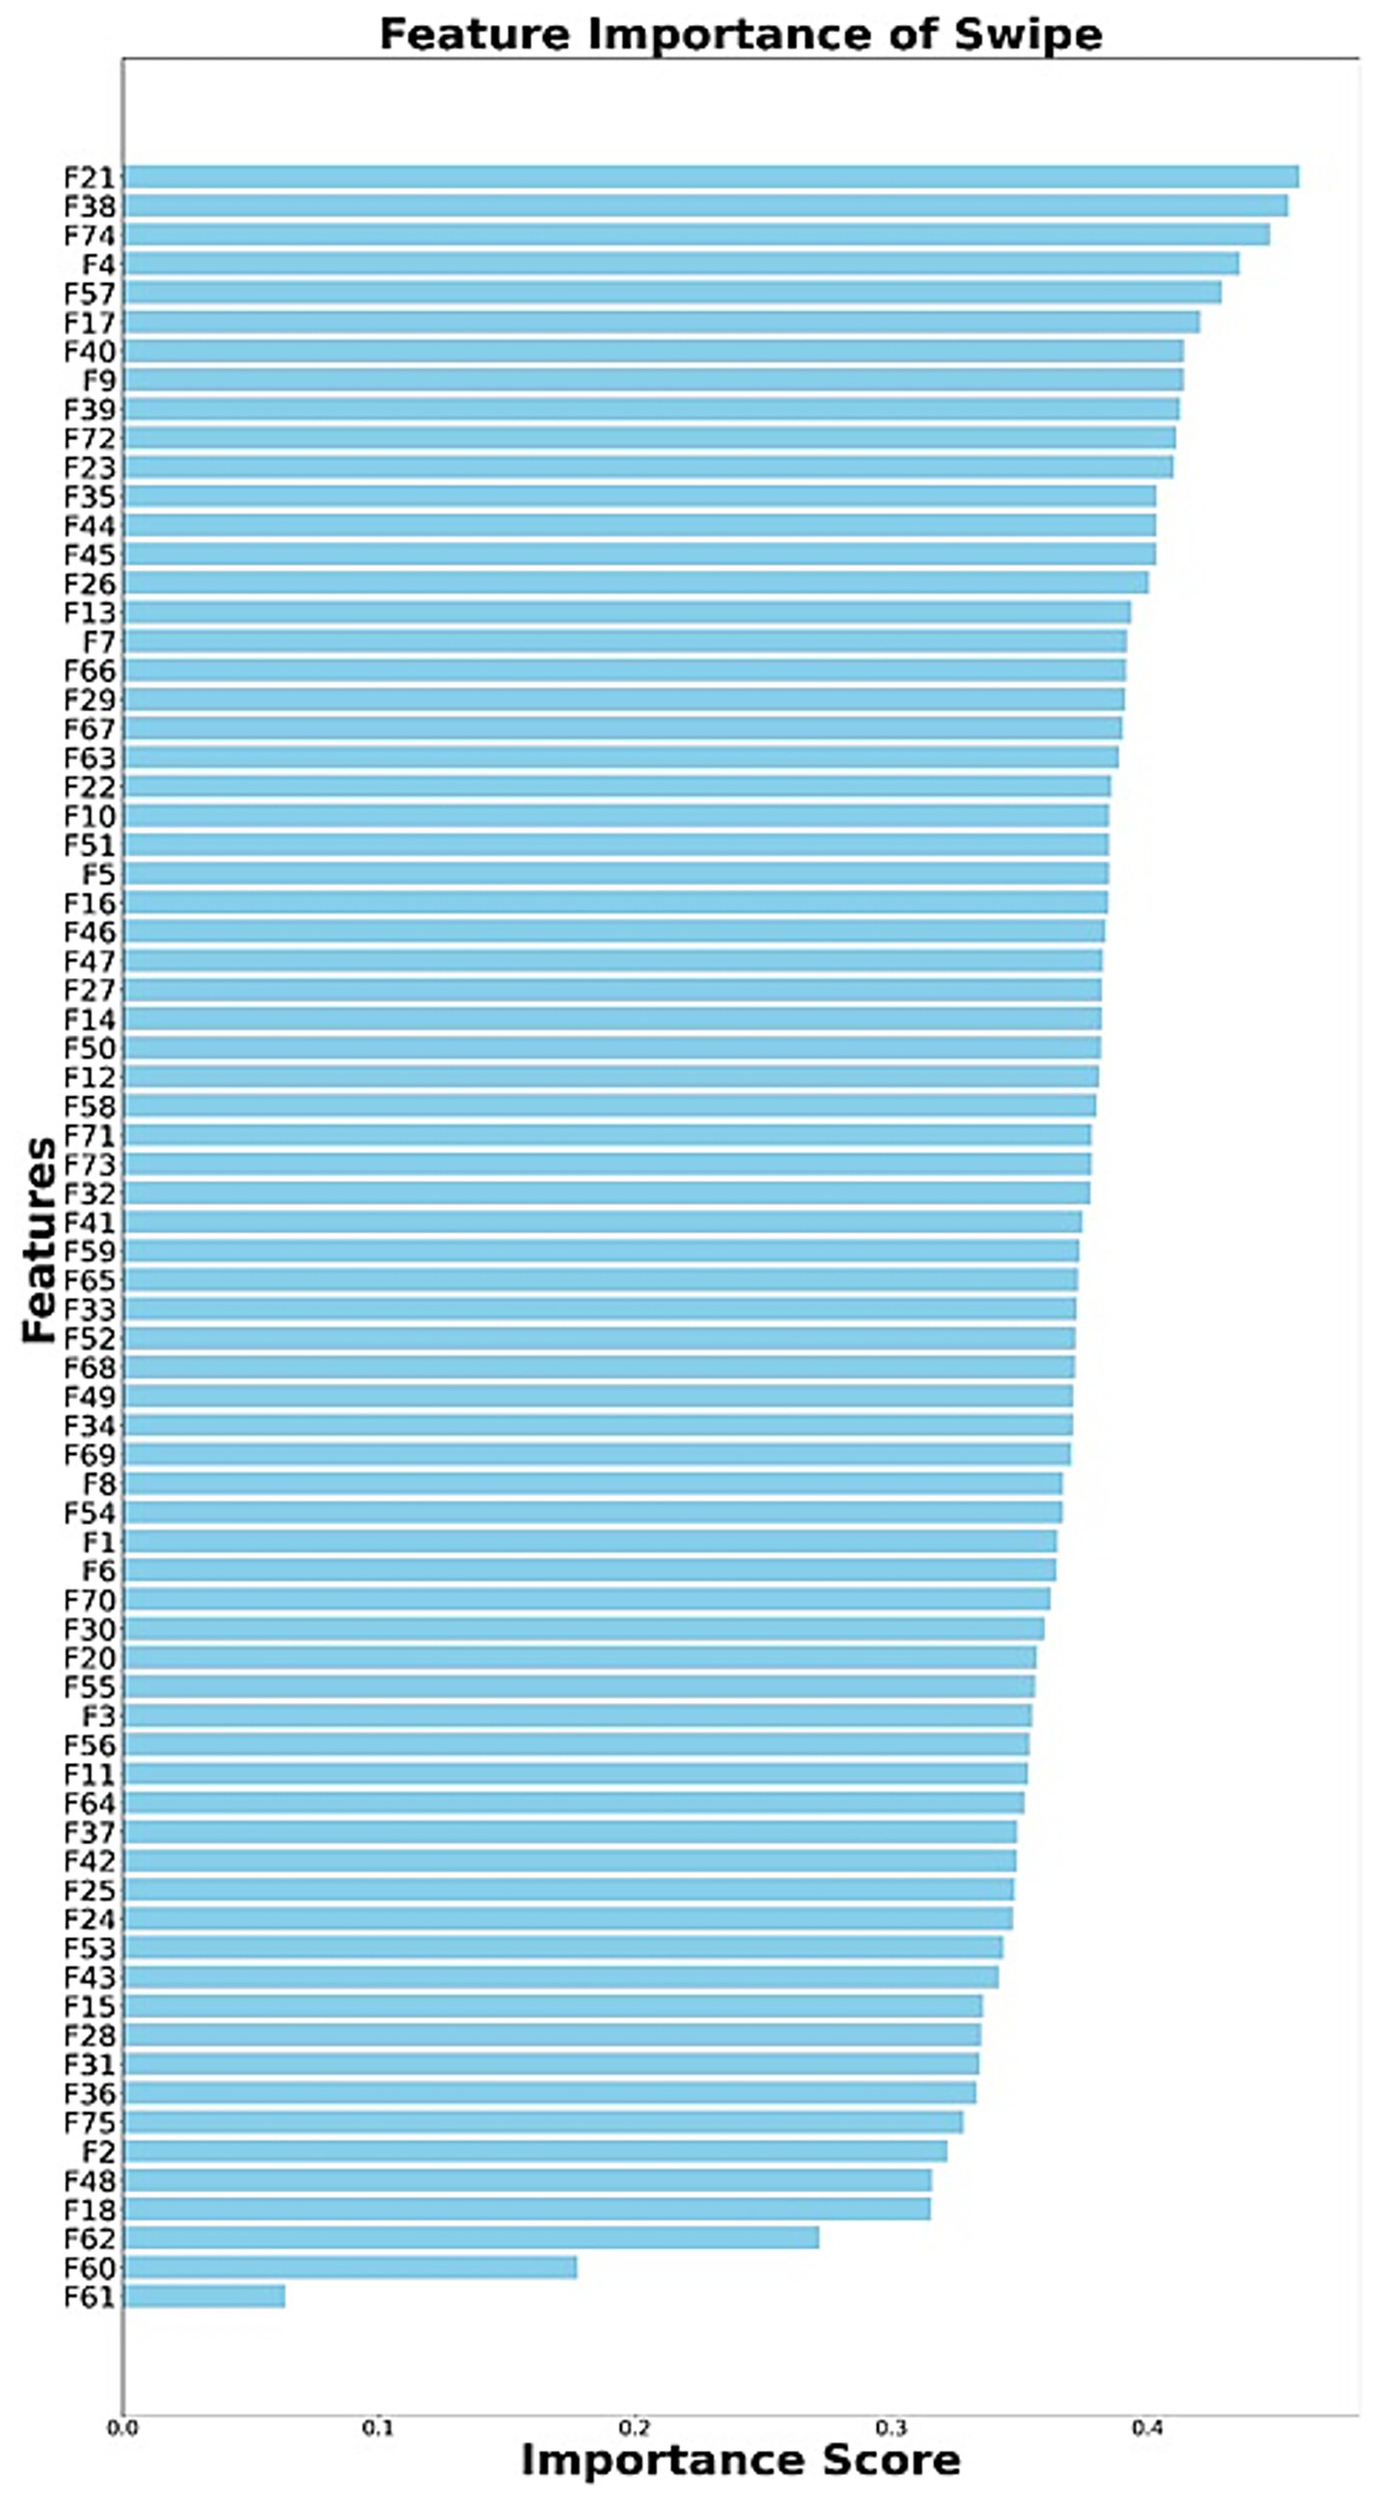
Ranking of selected features (swipe).
Figure 9
Ranking of selected features (type).
Figure 10
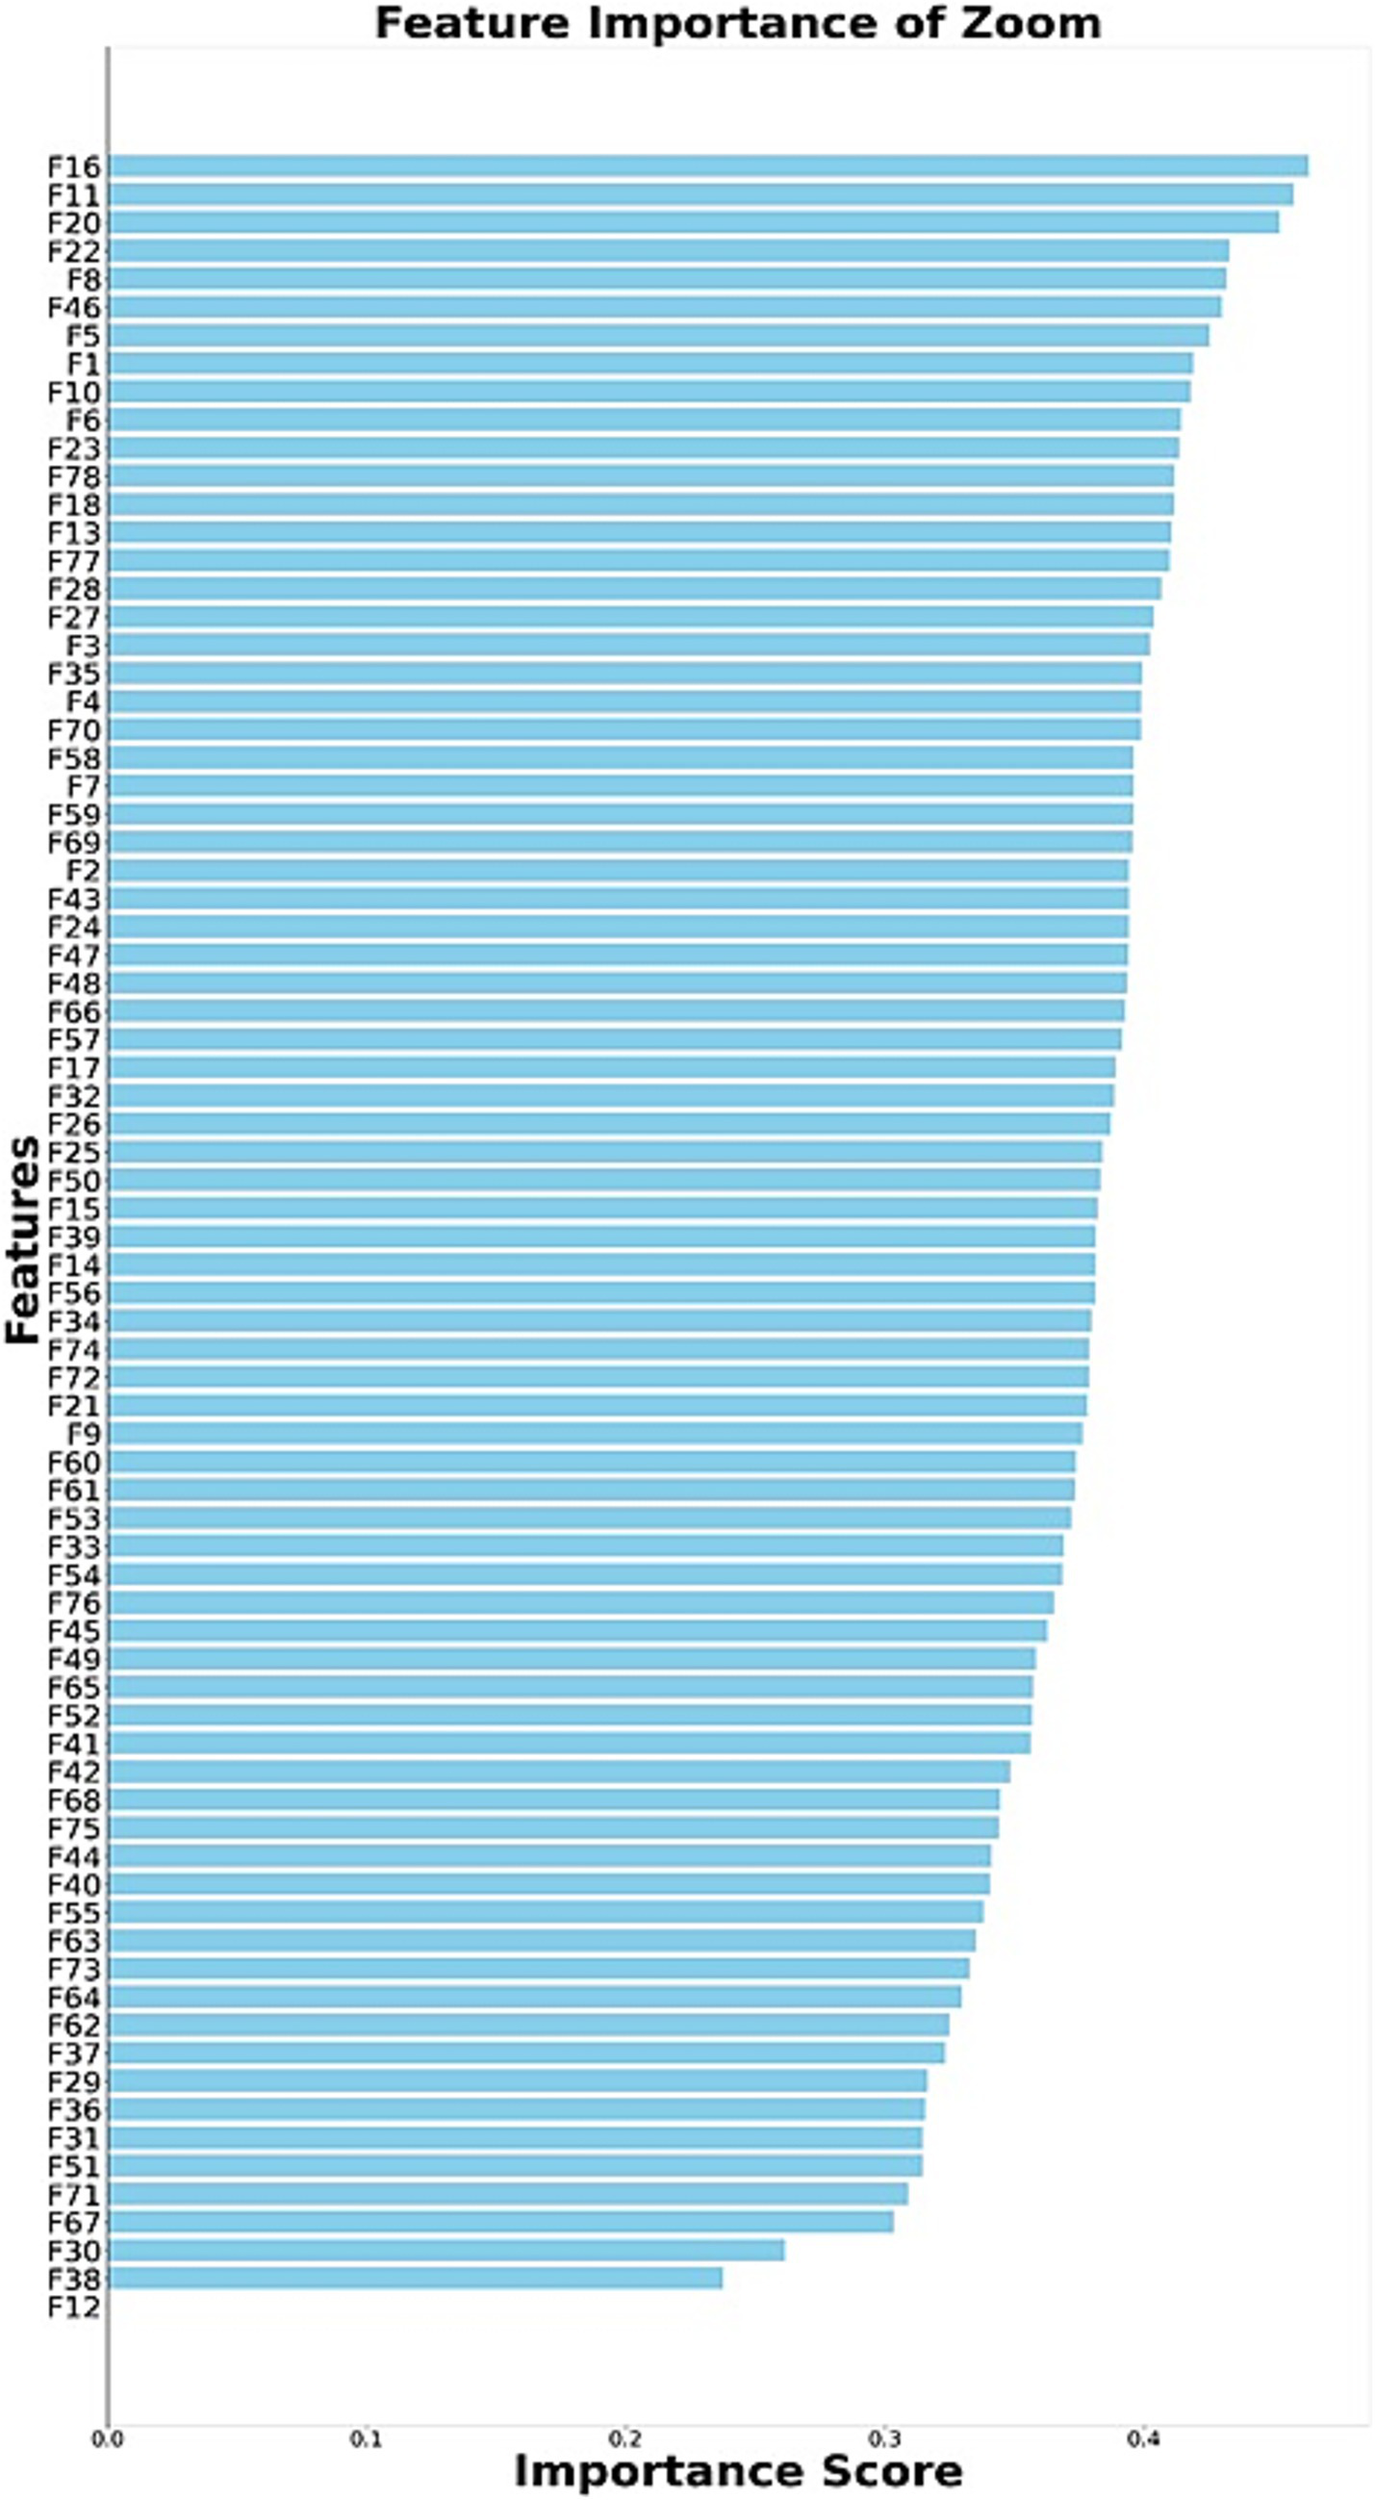
Ranking of selected features (zoom).
Figure 11
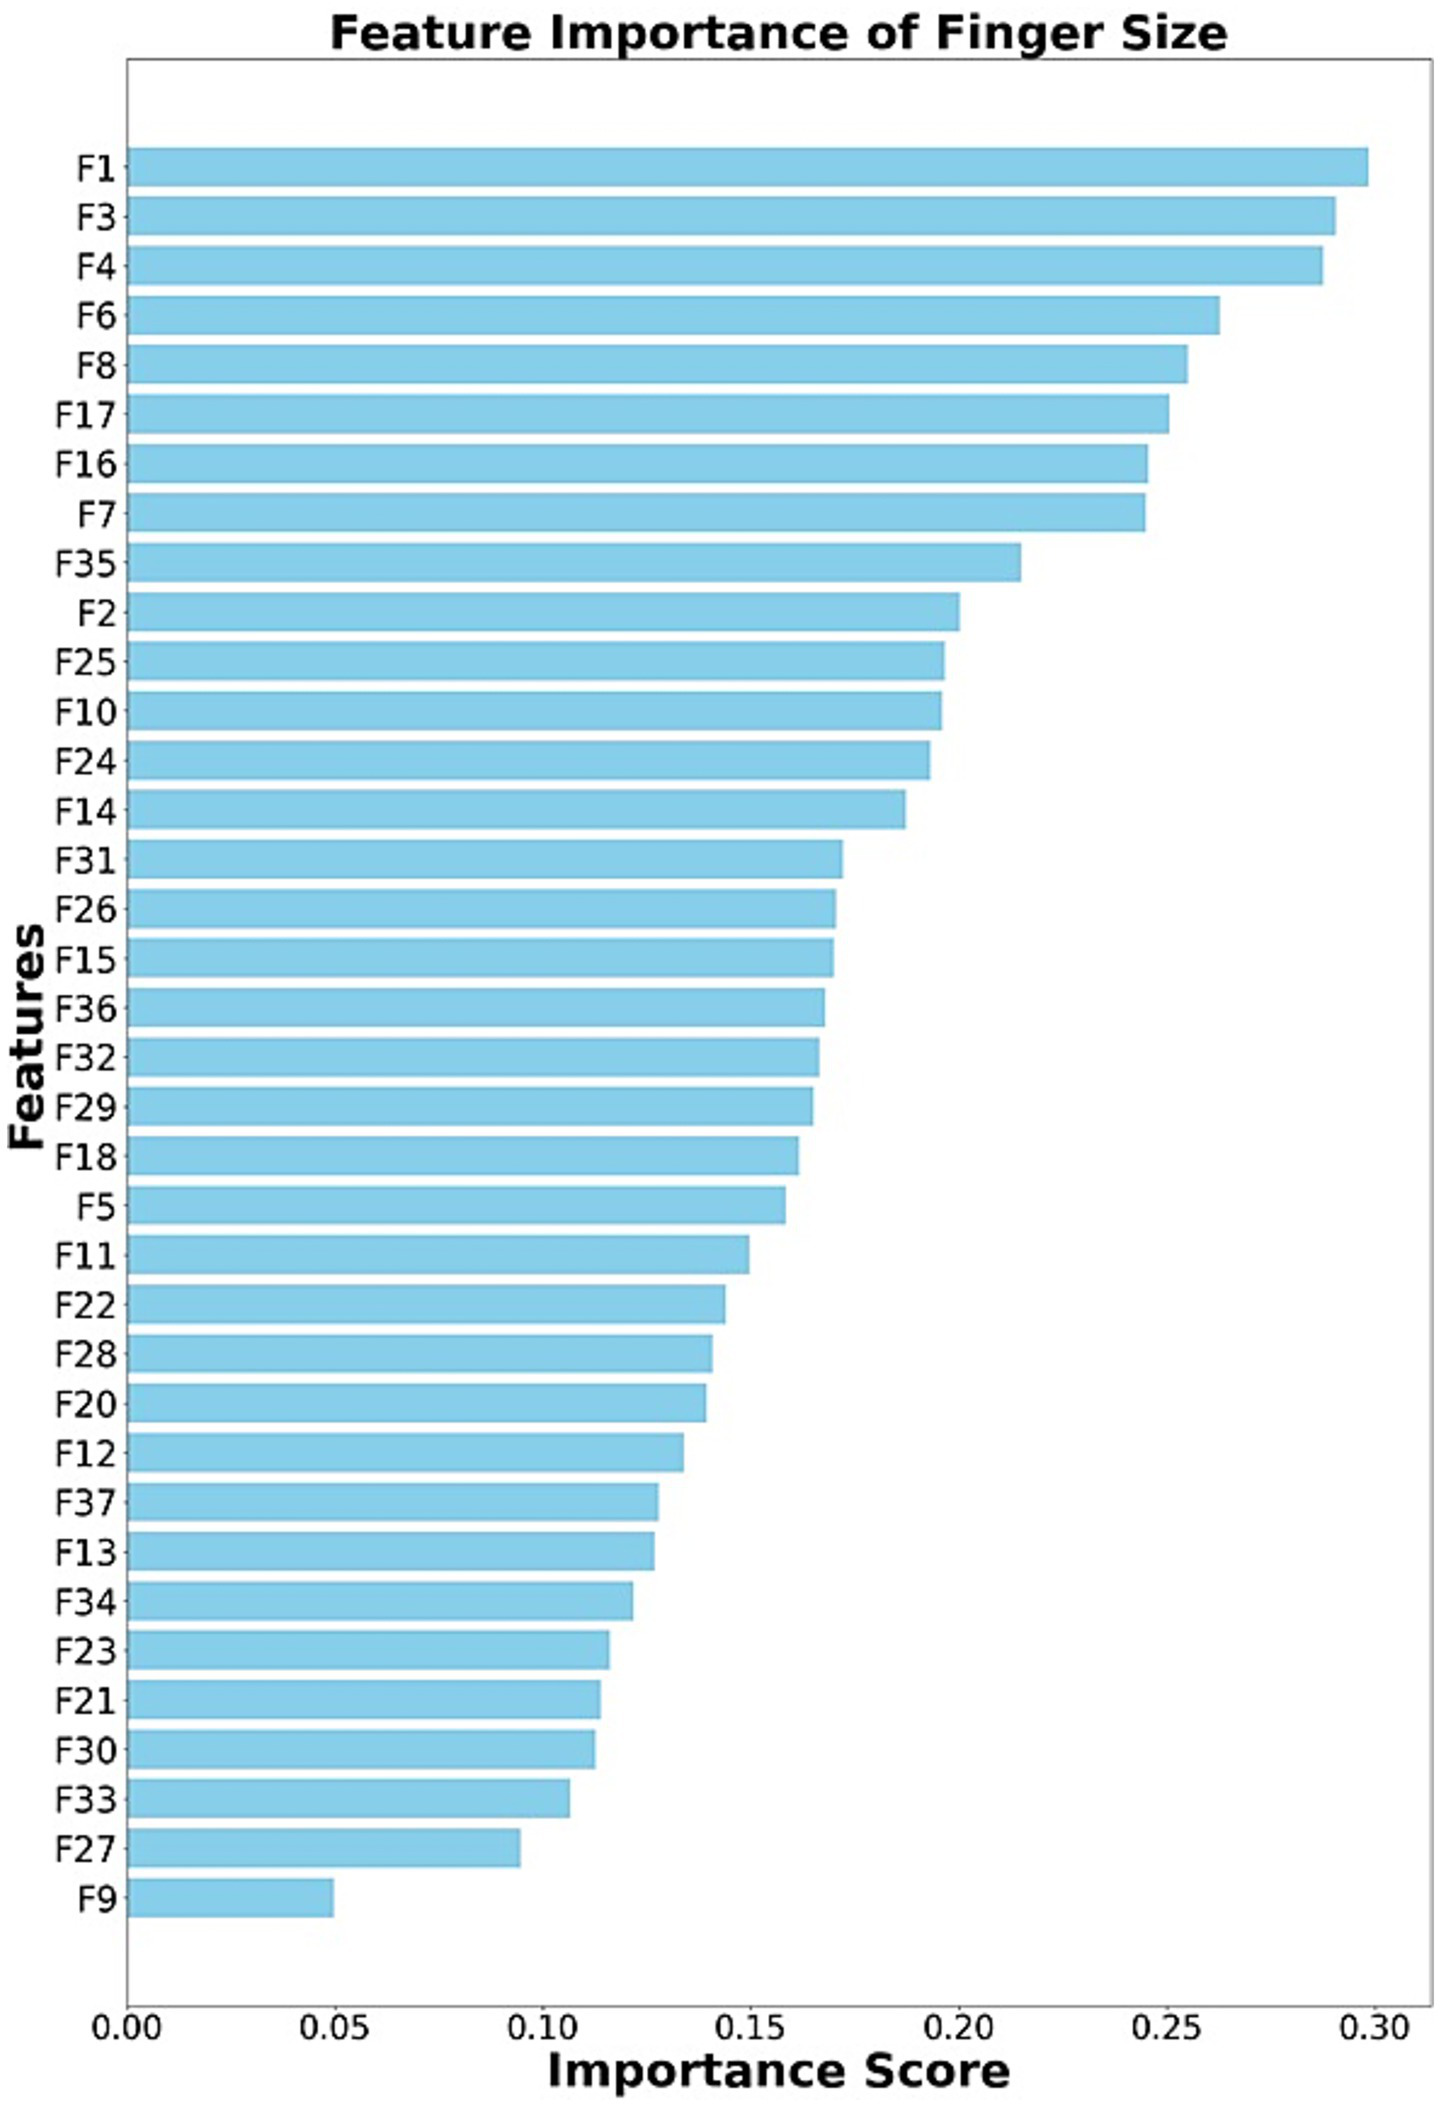
Ranking of selected features (finger size).
Table 9
| Classifiers | Hyperparameter | Form | Searching ranges |
|---|---|---|---|
| RF | n_estimators | Integers | [100 ~ 1,000] |
| max_depth | Integers | [3 ~ 15] | |
| min_samples_split | Integers | [2 ~ 10] | |
| SVM | C | Real numbers | [0.001 ~ 100] |
| Gamma | Real numbers | [0.0001 ~ 1] | |
| Kernel | Categorical | [linear, rbf] | |
| XGB | n_estimators | Integers | [100 ~ 1,000] |
| max_depth | Integers | [3 ~ 15] | |
| learning_rate | Real numbers | [0.001–0.3] |
The hyperparameters and search space of various classifiers.
4.1 Constrained and non-constrained environments’ analysis
In both constrained and non-constrained environments, we have analyzed the performance of all individual tasks, such as tap, type, swipe, zoom, and finger size, and the combination of tap-swipe tasks. Table 10 compares the classification mean accuracy, precision, recall, F1 score, AUC, and standard deviation for different feature categories (i.e., touch, sensor, and both) and tasks under constrained environments.
Table 10
| Method | Task | Accuracy | Precision | Recall | F1 score | AUC score | Std |
|---|---|---|---|---|---|---|---|
| Touch | Tap | 97.66 | 97.11 | 98.63 | 97.83 | 98.57 | 0.014 |
| Swipe | 95.22 | 94.39 | 97.27 | 95.76 | 93.98 | 0.017 | |
| Type | 95.88 | 97.27 | 95.42 | 96.29 | 96.69 | 0.017 | |
| Zoom | 96.69 | 94.53 | 98.05 | 96.24 | 93.58 | 0.018 | |
| Finger | 95.66 | 93.83 | 98.77 | 96.22 | 94.3 | 0.014 | |
| Tap-Swipe | 98.66 | 97.65 | 99.12 | 98.79 | 99.15 | 0.014 | |
| Sensor | Tap | 95.77 | 95.62 | 97.1 | 96.32 | 96.57 | 0.019 |
| Swipe | 88.01 | 84.08 | 96.1 | 89.59 | 86.23 | 0.033 | |
| Type | 94.66 | 98.07 | 92.06 | 94.92 | 96.73 | 0.0247 | |
| Zoom | 94.66 | 94.59 | 95.95 | 95.21 | 98.78 | 0.0309 | |
| Finger | 95.44 | 94.62 | 97.49 | 96 | 93.58 | 0.0175 | |
| Tap-Swipe | 95.55 | 94.61 | 97.86 | 96.19 | 94.19 | 0.0172 | |
| Touch-Sensor | Tap | 96.22 | 95.45 | 98 | 96.69 | 93 | 0.0193 |
| Swipe | 95 | 93.57 | 97.56 | 95.47 | 94.68 | 0.0142 | |
| Type | 97.55 | 96.17 | 99.61 | 97.84 | 95.94 | 0.0129 | |
| Zoom | 95.11 | 94.11 | 97.45 | 95.74 | 96.23 | 0.0166 | |
| Finger | 95.77 | 94.48 | 97.89 | 96.13 | 96.15 | 0.0221 | |
| Tap-Swipe | 98 | 96.75 | 99.82 | 98.25 | 95.71 | 0.0129 |
Performance analysis of constrained environment touch, sensor, and touch-sensor category evaluation in terms of mean accuracy, precision, recall, F1 score, AUC, and standard deviation (Std).
In a constrained environment, the tap-swipe task achieved 98.66% accuracy, outperforming other tasks such as tap (97.66%), swipe (95.22%), type (95.88%), zoom (96.69%), and finger size (95.66%) on touch-category features. However, in sensor-category, tap task (95.77%) attained higher accuracy than the other tasks (swipe-88.01%, type-94.66%, zoom-94.66%, finger size-95.44%, tap-swipe-95.55%). Whereas in touch-sensor category, tap-swipe achieved 98% higher accuracy than other tasks (tap-96.22%, swipe-95%, type-97.55%, zoom-95.11%, finger size-95.77%). For a constrained environment, it is observed that touch category features are marginally better than individual sensor and touch-sensor category features on the whole.
Table 11 compares the classification mean accuracy, precision, recall, F1 score, AUC, and standard deviation for different feature categories (i.e., touch, sensor, and both) and tasks under non-constrained environments. For a non-constrained environment, the tap-swipe task yielded improved accuracy of 91.93% over the other task (tap-88.86%, type-90.9%, swipe-66.98%, zoom-79.54%, finger size-74.43%). Whereas in sensor-category, type task accomplished a higher accuracy of 90.9% when compared to other tasks (tap-61.02%, swipe-65.28%, zoom-49.20%, finger size-59.48%, tap-swipe-64.37). Similarly, in touch-sensor category, the type task attained a higher accuracy of 90.11% when compared to other tasks (tap-80.9%, swipe-80.34%, zoom-82.89%, finger size-65.39%, tap-swipe-82.67). For non-constrained environments, touch and touch-sensor category features perform better than sensor category features.
Table 11
| Method | Task | Accuracy | Precision | Recall | F1 score | AUC score | Std |
|---|---|---|---|---|---|---|---|
| Touch | Tap | 88.86 | 95.33 | 80.25 | 86.85 | 85.31 | 0.033 |
| Swipe | 66.98 | 66.45 | 52.89 | 57.7 | 79.58 | 0.075 | |
| Type | 90.9 | 99.20 | 80.58 | 88.88 | 90.85 | 0.023 | |
| Zoom | 79.54 | 69.27 | 99.12 | 81.76 | 84.37 | 0.045 | |
| Finger | 74.43 | 69.3 | 80.68 | 74.13 | 74.89 | 0.044 | |
| Tap-Swipe | 91.93 | 87.62 | 96.12 | 91.41 | 95.31 | 0.037 | |
| Sensor | Tap | 61.02 | 62.11 | 26.75 | 37.07 | 54.79 | 0.055 |
| Swipe | 65.28 | 64.71 | 55.5 | 59.29 | 63.64 | 0.055 | |
| Type | 90.9 | 99.95 | 80.92 | 88.88 | 90.12 | 0.045 | |
| Zoom | 49.2 | 32.22 | 13.25 | 18.13 | 44.79 | 0.0702 | |
| Finger | 59.48 | 56.33 | 44.75 | 48.92 | 68.85 | 0.0601 | |
| Tap-Swipe | 64.37 | 67.05 | 50 | 55.07 | 69.47 | 0.0753 | |
| Touch-Sensor | Tap | 80.9 | 99.95 | 58 | 73.41 | 78.75 | 0.0045 |
| Swipe | 80.34 | 77.72 | 80.92 | 77.79 | 75.41 | 0.0142 | |
| Type | 90.11 | 100 | 78.25 | 87.79 | 90.12 | 0.0052 | |
| Zoom | 82.89 | 89.2 | 72.25 | 78.77 | 76.04 | 0.0681 | |
| Finger | 65.39 | 66.49 | 48.75 | 55.59 | 73.54 | 0.0666 | |
| Tap-Swipe | 82.67 | 95.44 | 65.5 | 77.33 | 70.1 | 0.0594 |
Performance analysis of non-constrained environment touch, sensor, and touch-sensor category evaluation in terms of mean accuracy, precision, recall, F1 score, AUC, and standard deviation (Std).
In the case of a non-constrained environment, the model performs less well than in a constrained environment. Possibly because participants, both adults and children, find it difficult to perform these tasks, leading to an overlap in the characteristics of both adult and child data. An exception to this is the type of features for which good performance is obtained in the non-constrained environment. This may be attributed to the fact that the participants sit down and remain standing while performing a typing task, even in a non-constrained environment. For both constrained and non-constrained environments, the standard deviation of performance is low, indicating stability of the results. From the results, it may be noted that touch features give only marginally better performance, while having a lower energy requirement. Figure 12 shows the confusion matrix for the tap-swipe task (Touch Category) on constrained and non-constrained environments, illustrating the classification performance across two different classes, such as adult and child. In the tap-swipe task (Touch Category), the classifier effectively prevents misclassification of children as adults, with only a small number of exceptions. We used the Google Colab platform for developing and training our models, using Python 3.10 and an NVIDIA Tesla T4 GPU. The average training time of the ensemble model was approximately 150 s, while the inference time per sample is substantially smaller, usually on the order of milliseconds, indicating the model’s potential for real-time applications.
Figure 12
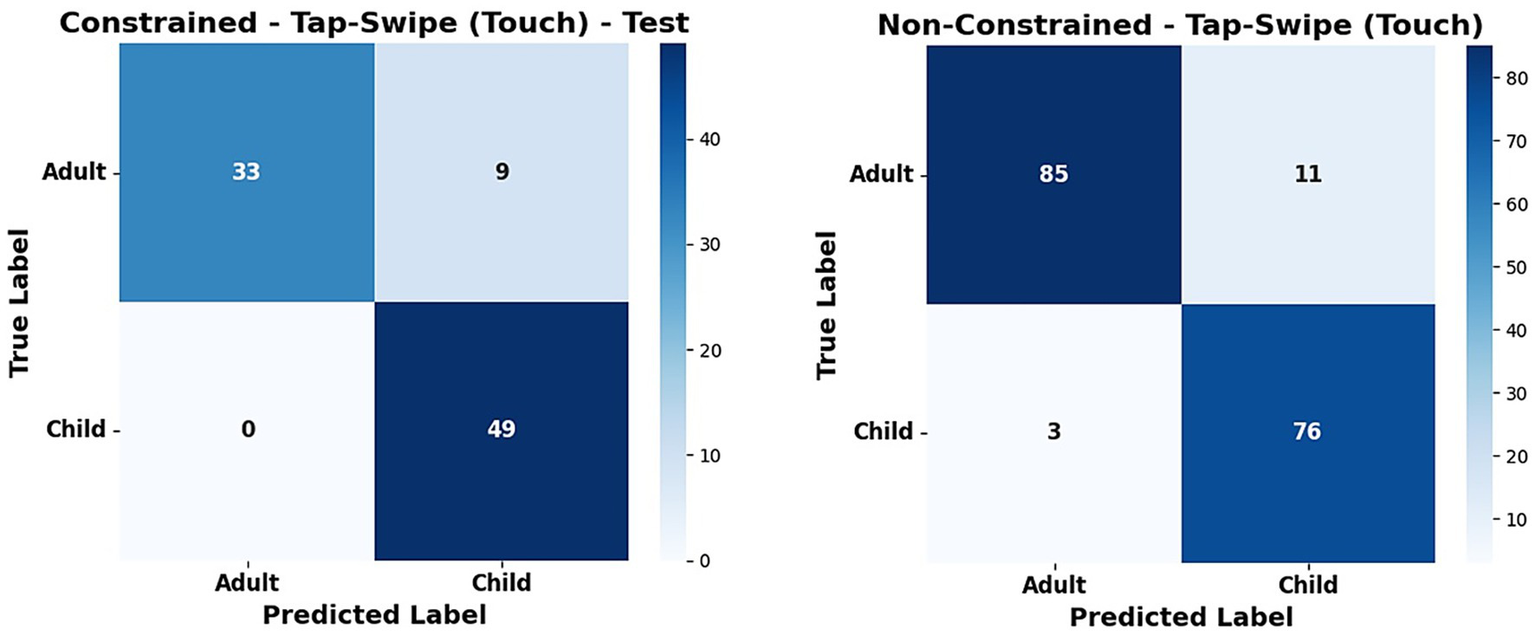
Confusion matrix of constrained and non-constrained environment (tap-swipe task-touch category).
4.2 Performance analysis of base classifiers and state-of-the-art methods
This section provides a performance analysis of the ensemble classifier model by comparing it to individual base classifiers and state-of-the-art techniques from the existing literature. Table 10 shows the comparative analysis of the ensemble classifier with its base classifier in terms of mean accuracy in a constrained environment (Touch category). As shown in Table 12, when compared to the baseline classifiers (XGB, SVM, and RF), the ensemble classifier consistently achieves better results on all individual tasks and combinations of tap-swipe task. XGBoost succeeds at discovering complicated patterns due to its boosting method, which iteratively improves weak learners. Random Forest is more resilient to noise and is capable of capturing non-linear correlations in the data. SVM works effectively for high-dimensional data; however, it may suffer when working with noisy data, as its decision boundaries may become less efficient in these situations. This result shows that integrating the predictive strengths of individual models improves classification accuracy. Additionally, we utilized paired t-tests to compare the performance of each classifier on the swipe task (Touch category). The results show that EC vs. XGB (p = 0.010), EC vs. SVM (p = 0.022), and EC vs. RF (p = 0.018) exhibit statistically significant differences in classifier performance.
Table 12
| classifier’s | Tap | Swipe | Type | Zoom | Finger size | Tap-Swipe |
|---|---|---|---|---|---|---|
| XGB | 96.00 | 95.11 | 94.66 | 96.22 | 93.22 | 98.11 |
| SVM | 91.06 | 94.78 | 90.44 | 92.62 | 95.43 | 86.08 |
| RF | 96.44 | 94.88 | 94.77 | 95 | 87.11 | 97.44 |
| Ensemble classifier (EC) | 97.66 | 95.22 | 95.88 | 96.69 | 95.66 | 98.66 |
Comparative analysis of ensemble classifier and base classifiers in terms of mean accuracy (constrained-environment-touch only).
As shown in Table 13, our proposed strategy outperforms various state-of-the-art strategies on both touch and sensor categories. Previous strategies had some drawbacks. Study (Hossain and Haberfeld, 2020) utilized only three features (finger size, hold time, pressure of finger) for classification, while another study (Guarino et al., 2022) extracted many features but did not use feature selection and a robust classifier like an ensemble classifier.
Table 13
| Touch Only | Accuracy |
|---|---|
| Hossain and Haberfeld (2020) | 82.28% (Tap) |
| Guarino et al. (2022) | 72% (Tap) |
| PEFE+ mRMR+EC (Proposed method) | 97.66% (Tap) |
| Sensor Only | |
| Davarci et al. (2017) | 92.5% (Tap) |
| PEFE+ mRMR+EC (Proposed method) | 95.77 (Tap) |
Comparative performance of our method with state-of-the-art approaches (accuracy).
4.3 Ablation study on touch category feature extraction
In this task, we focused on extracting touch-based features rather than sensor-based features. In particular, we extracted some new useful features in the swipe and finger size task. So, we have taken an ablation study on both the swipe and finger size tasks. Table 14 represents the ablation study performance of Swipe and Finger size task touch category features. In the finger size task, we extracted 37 features, and the details of all features are displayed in Table 7. We extracted potential features in our work because finger size feature extraction got less attention in previous work. From the results, our method (with feature selection) achieved the highest accuracy of 95.66%. When considering all features (without feature selection), we achieved 93.79% accuracy, while the finger size features F1–F17, F7–F17, and F18–F37 achieved 94.12, 84.11, and 90.78% accuracy, respectively.
Table 14
| Task | Features | Mean accuracy |
|---|---|---|
| Finger Size Touch Category Features | Finger Feature (F1–F17) (see Table 7) | 92.12% |
| Finger Feature (F7–F17) | 84.11% | |
| Finger Feature (F18–F37) | 90.78% | |
| All Finger features (F1–F37) | 93.79% | |
| PEFE+ mRMR+EC (Proposed method) | 95.66% | |
| Swipe Touch Category Features | All Swipe features, except statistical features of the user’s touch X and Y position values, which are converted to the frequency domain using the Discrete Cosine Transform (DCT) (53 Features) | 93.67% |
| Only statistical features of the user’s touch X and Y position values, which are converted to the frequency domain using the Discrete Cosine Transform (DCT) (22 features) | 94.35% | |
| All Swipe features (75 features) | 95.20% | |
| PEFE+ mRMR+EC (Proposed method) | 95.22% |
Ablation study on swipe and finger size task touch category features.
On the other hand, in the swipe task, we extracted 75 features, and it was discussed in section 3.3.1. We added new statistical features of the user’s touch X and Y position values, which are converted to the frequency domain (user’s touch X and Y position values) using the Discrete Cosine Transform (DCT). An accuracy of 93.67% was achieved without using these features, whereas incorporating only these features resulted in an improved accuracy of 94.35%. Considering all features provided an accuracy of 95.20%, whereas our proposed strategy achieved a higher accuracy of 95.22%.
5 Conclusion
In this study, we proposed and analyzed a framework for providing age-appropriate content with the help of a smartphone’s touch and sensor dataset, which was collected by performing 5 different tasks in constrained and non-constrained environments to detect the user’s age. Instead of focusing on a single environment, we have focused on both environments, as users may use a mobile in both environments; this makes our work different from other traditional methods that use specifically constrained or non-constrained data only for age detection. We have utilized effective feature extraction methods to enhance both environments’ performances. Notably, rather than extracting statistical features from specific full sensor records, we divided the particular sensor record into overlapping windows and extracted average statistical features. Following feature extraction, the mRMR feature selection method was used with a cross-validation method to automatically select the optimal feature set for each different task for classification purposes. Finally, an ensemble classifier was trained for classification; it consists of XGBoost, SVM, and RF classifiers. In this study, we analyzed the individual task and the combination of tap-swipe task performance in both environments via touch-category, sensor-category, and touch-sensor-category features analysis.
According to the findings, in a constrained environment, a combination of the tap-swipe task outperforms other individual task features. In contrast, the tap-swipe task on the touch category (91.93%), the type task on the sensor (90.9%), and the touch-sensor category (90.11%) only achieved the highest accuracy in non-constrained environments. We found the typing task outperformed other individual tasks due to the ability to easily differentiate users by speed and accuracy of typing words in both environments. In a real-time scenario, mobile touch-based tasks use less energy than sensor-based tasks. When comparing their performance in terms of energy consumption, any touch-based task was sufficient to achieve optimal performance while using less energy in a constrained environment. However, in a non-constrained environment, the touch-category tap-swipe and task only perform well in achieving 91.93 and 90.9% accuracy.
We comprehend that our user age detection framework may raise concerns regarding potential privacy and fairness issues. Hence, when collecting the datasets, we carefully followed ethical guidelines by obtaining informed consent from each participant. Only anonymized touch interaction information (tapping, swiping, and typing patterns) was collected, without any personally identifiable information. On the other hand, in the future, implementing responsible AI practices for detecting user age will include key factors such as obtaining consent for data access while installing or accessing the applications, and encrypting data before storing it to maintain confidentiality. Performance-wise, responsible AI should reduce the misclassification rate. While there may not be much impact if an adult is misidentified as a child, it can lead to unwanted access. But if a child is misclassified as an adult, it can lead to unintended access to age-inappropriate content for the child.
Statements
Data availability statement
The datasets presented in this study can be found in online repositories. The names of the repository/repositories and accession number(s) can be found in the article/supplementary material.
Ethics statement
The studies involving humans were approved by SRM Institute of Science and Technology, Kattankulathur. KidZee School, Guduvanchery. The studies were conducted in accordance with the local legislation and institutional requirements. Written informed consent for participation in this study was provided by the participants’ legal guardians/next of kin.
Author contributions
HN: Formal analysis, Methodology, Resources, Visualization, Writing – original draft. SS: Supervision, Validation, Writing – review & editing.
Funding
The author(s) declared that financial support was not received for this work and/or its publication.
Conflict of interest
The author(s) declared that this work was conducted in the absence of any commercial or financial relationships that could be construed as a potential conflict of interest.
Generative AI statement
The author(s) declared that Generative AI was not used in the creation of this manuscript.
Any alternative text (alt text) provided alongside figures in this article has been generated by Frontiers with the support of artificial intelligence and reasonable efforts have been made to ensure accuracy, including review by the authors wherever possible. If you identify any issues, please contact us.
Publisher’s note
All claims expressed in this article are solely those of the authors and do not necessarily represent those of their affiliated organizations, or those of the publisher, the editors and the reviewers. Any product that may be evaluated in this article, or claim that may be made by its manufacturer, is not guaranteed or endorsed by the publisher.
References
1
Abbaspur-BehbahaniS.MonagheshE.HajizadehA.FehrestiS. (2022). Application of mobile health to support the elderly during the COVID-19 outbreak: a systematic review. Health Policy Technol.11:100595. doi: 10.1016/j.hlpt.2022.100595,
2
AcienA.MoralesA.FierrezJ.Vera-RodriguezR.Hernandez-OrtegaJ. (2019). Active detection of age groups based on touch interaction. IET Biomet.8, 101–108. doi: 10.1049/iet-bmt.2018.5003
3
AliA. B. A.PonnusamyV.SangodiahA.AlroobaeaR.JhanjhiN. Z.GhoshU.et al. (2021). Smartphone security using swipe behavior-based authentication. Intell. Autom. Soft Comput.29, 571–585. doi: 10.32604/iasc.2021.015913
4
AlqarniM. A.ChauhdaryS. H.MalikM. N.Ehatisham-ul-HaqM.AzamM. A. (2020). Identifying smartphone users based on how they interact with their phones. Hum.-Cent. Comput. Inf. Sci.10:7. doi: 10.1186/s13673-020-0212-7
5
AL-ShowarahS.AL-JawadN.SellahewaH. (2016). User-age classification using touch gestures on smartphones.
6
AlsuhibanyS. A.AlmuqbilA. S. (2021). Analyzing the effectiveness of touch keystroke dynamic authentication for the Arabic language. Wirel. Commun. Mob. Comput.2021:9963129. doi: 10.1155/2021/9963129
7
Al-ZuabiI. M.JafarA.AljoumaaK. (2019). Predicting customer’s gender and age depending on mobile phone data. J. Big Data6:18. doi: 10.1186/s40537-019-0180-9
8
AnshariM.AlasY.HardakerG.JaidinJ. H.SmithM.AhadA. D. (2016). Smartphone habit and behavior in Brunei: personalization, gender, and generation gap. Comput. Hum. Behav.64, 719–727. doi: 10.1016/j.chb.2016.07.063
9
ChenW. (2023). Exploring digital natives' mobile addiction syndrome in Taiwan: psychological issues and beyond. Inf. Technol. People36, 1326–1355. doi: 10.1108/ITP-08-2021-0633
10
ChenX.LiZ.WangY.LiuJ. (2019). Effect of fruit and hand characteristics on thumb–index finger power-grasp stability during manual fruit sorting. Comput. Electron. Agric.157, 479–487. doi: 10.1016/j.compag.2019.01.032
11
ChenY.ShenC. (2017). Performance analysis of smartphone-sensor behavior for human activity recognition. IEEE Access5, 3095–3110. doi: 10.1109/ACCESS.2017.2676168
12
ChengY.JiX.LiX.ZhangT.MalebaryS.QuX.et al. (2020). Identifying child users via touchscreen interactions. ACM Trans. Sen. Netw.16, 1–25. doi: 10.1145/3403574
13
DavarciE.SoysalB.ErgulerI.AydinS. O.DincerO.AnarimE. (2017). “Age group detection using smartphone motion sensors.” In 2017 25th European Signal Processing Conference (EUSIPCO). pp. 2201–2205. IEEE.
14
DeshpandeU. U.ShanbhagS.KotiR.ChateA.DeshpandeS.PatilR.et al. (2025). Computer vision and AI-based cell phone usage detection in restricted zones of manufacturing industries. Front. Comput. Sci.7:1535775. doi: 10.3389/fcomp.2025.1535775
15
GaoW.HuL.ZhangP. (2020). Feature redundancy term variation for mutual information-based feature selection. Appl. Intell.50, 1272–1288. doi: 10.1007/s10489-019-01597-z
16
GuarinoA.LettieriN.MalandrinoD.ZaccagninoR.CapoC. (2022). Adam or eve? Automatic users’ gender classification via gestures analysis on touch devices. Neural Comput. & Applic.34, 18473–18495. doi: 10.1007/s00521-022-07454-4
17
Hernandez-OrtegaJ.MoralesA.FierrezJ.AcienA. (2017). “Predicting age groups from touch patterns based on neuromotor models” in 8th international conference of pattern recognition systems (ICPRS 2017) (Stevenage UK: IET), 6.
18
HossainM. S.HaberfeldC. (2020). “Touch behavior based age estimation toward enhancing child safety.” In 2020 IEEE International Joint Conference on Biometrics (IJCB). pp. 1–8. IEEE.
19
JainA.KanhangadV. (2016). “Investigating gender recognition in smartphones using accelerometer and gyroscope sensor readings.” In 2016 international conference on computational techniques in information and communication technologies (ICCTICT). pp. 597–602. IEEE.
20
LiW.MengW.FurnellS. (2021). Exploring touch-based behavioral authentication on smartphone email applications in IoT-enabled smart cities. Pattern Recogn. Lett.144, 35–41. doi: 10.1016/j.patrec.2021.01.019
21
MajumderS.DeenM. J. (2019). Smartphone sensors for health monitoring and diagnosis. Sensors19:2164. doi: 10.3390/s19092164,
22
ManeS.MandhanK.BapnaM.TerwadkarA. (2023). “Child detection by utilizing touchscreen behavioral biometrics on Mobile” in International conference on information, communication and computing technology (Singapore: Springer Nature Singapore), 227–244.
23
MeenaT.SarawadekarK. (2020). “Gender recognition using in-built inertial sensors of smartphone.” In 2020 IEEE Region 10 Conference (TENCON). pp. 462–467. IEEE.
24
NguyenT.RoyA.MemonN. (2019). Kid on the phone! Toward automatic detection of children on mobile devices. Comput. Secur.84, 334–348. doi: 10.1016/j.cose.2019.04.001
25
PalinK.FeitA. M.KimS.KristenssonP. O.OulasvirtaA. (2019). “How do people type on mobile devices? Observations from a study with 37,000 volunteers.” In Proceedings of the 21st international conference on human-computer interaction with mobile devices and services. pp. 1–12.
26
PengH.LongF.DingC. (2005). Feature selection based on mutual information criteria of max-dependency, max-relevance, and min-redundancy. IEEE Trans. Pattern Anal. Mach. Intell.27, 1226–1238. doi: 10.1109/TPAMI.2005.159,
27
Ramírez-GallegoS.LastraI.Martínez-RegoD.Bolón-CanedoV.BenítezJ. M.HerreraF.et al. (2017). Fast-mRMR: fast minimum redundancy maximum relevance algorithm for high-dimensional big data. Int. J. Intell. Syst.32, 134–152. doi: 10.1002/int.21833
28
RoyS.SinhaD.RoyU. (2022). Identifying age group and gender based on activities on touchscreen. Int. J. Biomet.14, 61–82. doi: 10.1504/IJBM.2022.119559
29
Ruiz-GarciaJ. C.HojasC.TolosanaR.Vera-RodriguezR.MoralesA.FierrezJ.et al. (2024). Children age group detection based on human–computer interaction and time series analysis. Int. J. Doc. Anal. Recognit.27, 603–613. doi: 10.1007/s10032-024-00462-1
30
SaitS. Y. (2023). “User’s age detection using smartphone motion sensor data.” In 2023 Global Conference on Information Technologies and Communications (GCITC). pp. 1–4. IEEE.
31
SaitS. Y.MantavalamS.RastogiA. (2023). “Touch and motion sensor data collection on smart devices in constrained and unconstrained environments.” In 2023 international conference on next generation electronics (NEleX). pp. 1–5. IEEE.
32
ShafiqueM. A.HatoE. (2017). Classification of travel data with multiple sensor information using random forest. Transp. Res. Proc.22, 144–153. doi: 10.1016/j.trpro.2017.03.021
33
SinghS.ShilaD. M.KaiserG. (2019). “Side channel attack on smartphone sensors to infer gender of the user.” In Proceedings of the 17th Conference on Embedded Networked Sensor Systems. pp. 436–437.
34
SungK.ChangJ. K. W.ZhuR.PavleasJ. (2014). Learn 2D game development with C#: For iOS, android, windows phone, Playstation Mobile and more. New York, United States: Apress.
35
SunnyJ. T.GeorgeS. M.KizhakkethottamJ. J.SunnyJ. T.GeorgeS. M.KizhakkethottamJ. J. (2015). Applications and challenges of human activity recognition using sensors in a smart environment. IJIRST Int. J. Innov. Res. Sci. Technol2, 50–57.
36
ThoméeS.HärenstamA.HagbergM. (2011). Mobile phone use and stress, sleep disturbances, and symptoms of depression among young adults-a prospective cohort study. BMC Public Health11:66. doi: 10.1186/1471-2458-11-66,
37
TolosanaR.Ruiz-GarciaJ. C.Vera-RodriguezR.Herreros-RodriguezJ.Romero-TapiadorS.MoralesA.et al. (2021). Child-computer interaction: recent works, new dataset, and age detection. IEEE Trans. Emerg. Top. Comput.1. doi: 10.1109/TETC.2022.3150836
38
VatavuR. D.AnthonyL.BrownQ. (2015). “Child or adult? Inferring smartphone users’ age group from touch measurements alone” in IFIP conference on human-computer interaction (Cham: Springer International Publishing), 1–9.
39
WacksY.WeinsteinA. M. (2021). Excessive smartphone use is associated with health problems in adolescents and young adults. Front. Psychol.12:669042. doi: 10.3389/fpsyt.2021.669042,
40
WerlingA. M.WalitzaS.GrünblattE.DrechslerR. (2021). Media use before, during and after COVID-19 lockdown according to parents in a clinically referred sample in child and adolescent psychiatry: results of an online survey in Switzerland. Compr. Psychiatry109:152260. doi: 10.1016/j.comppsych.2021.152260,
41
YuZ.XuE.DuH.GuoB.YaoL. (2019). Inferring user profile attributes from multidimensional mobile phone sensory data. IEEE Internet Things J.6, 5152–5162. doi: 10.1109/JIOT.2019.2897334
42
ZanlorensiL. A.LarocaR.LucioD. R.SantosL. R.BrittoA. S.Jr.MenottiD. (2022). A new periocular dataset collected by mobile devices in unconstrained scenarios. Sci. Rep.12:17989. doi: 10.1038/s41598-022-22811-y,
43
ZhangX.YinY.XieL.ZhangH.GeZ.LuS. (2020). TouchID: user authentication on mobile devices via inertial-touch gesture analysis. Proc. ACM Interact. Mobile Wearable Ubiquitous Technol.4, 1–29. doi: 10.1145/3432192,
Summary
Keywords
constrained and non-constrained environments, ensemble classifier, mRMR, sensor data, touch data, user age detection
Citation
Faheem NH and Sait SY (2026) Classification of smartphone users as adult or child in both constrained and non-constrained environments using mRMR-based feature selection and an ensemble classifier. Front. Comput. Sci. 7:1663987. doi: 10.3389/fcomp.2025.1663987
Received
11 July 2025
Revised
26 October 2025
Accepted
03 December 2025
Published
06 January 2026
Volume
7 - 2025
Edited by
Laura Belli, University of Parma, Italy
Reviewed by
Armin Mazinani, University of Parma, Italy
Daniele Antonucci, University Hospital of Parma, Italy
Sujni Paul, Higher Colleges of Technology, United Arab Emirates
Updates
Copyright
© 2026 Faheem and Sait.
This is an open-access article distributed under the terms of the Creative Commons Attribution License (CC BY). The use, distribution or reproduction in other forums is permitted, provided the original author(s) and the copyright owner(s) are credited and that the original publication in this journal is cited, in accordance with accepted academic practice. No use, distribution or reproduction is permitted which does not comply with these terms.
*Correspondence: Saad Yunus Sait, saady@srmist.edu.inNikhat H. Faheem, faheemnikhat2612@gmail.com
Disclaimer
All claims expressed in this article are solely those of the authors and do not necessarily represent those of their affiliated organizations, or those of the publisher, the editors and the reviewers. Any product that may be evaluated in this article or claim that may be made by its manufacturer is not guaranteed or endorsed by the publisher.