 Luis Alberto Holgado-Apaza1*
 Dany Dorian Isuiza-Perez1
 Nelly Jacqueline Ulloa-Gallardo1Yban Vilchez-Navarro1
 Ruth Nataly Aragon-Navarrete2
 Wilian Quispe Layme3Marleny Quispe-Layme4
 Danger David Castellon-Apaza1
 Remo Choquejahua-Acero5Jaime Cesar Prieto-Luna1
- 1Departamento Académico de Ingeniería de Sistemas e Informática, Universidad Nacional Amazónica de Madre de Dios, Puerto Maldonado, Peru
- 2Departamento Académico de Ecoturismo, Universidad Nacional Amazónica de Madre de Dios, Puerto Maldonado, Peru
- 3Departamento Académico de Educación, Universidad Nacional Amazónica de Madre de Dios, Puerto Maldonado, Peru
- 4Departamento Académico de Contabilidad y Administración, Universidad Nacional Amazónica de Madre de Dios, Puerto Maldonado, Peru
- 5Departamento Académico de Ingeniería Estadística e Informática, Universidad Nacional del Altiplano-Puno, Puno, Peru
School principals encounter contemporary demands that impact their job satisfaction and leadership effectiveness. Despite the significance of this issue, there is limited research on satisfaction predictors for these professionals, particularly using machine learning approaches. This study identified key predictors of job satisfaction among Peruvian school principals by applying an ensemble of feature selection methods and evaluating five machine learning algorithms (Random Forest, Decision Trees-CART, Histogram-Based Gradient Boosting, XGBoost, and LightGBM) with data from the 2018 National Survey of Directors. The principal variables identified included satisfaction with salary, geographic location of the educational institution, relationships with students and teachers, workplace climate, student learning achievements, and job benefits. Economic factors proved important, such as gross and net income, and the minimum monthly amount required to meet household needs. Time-related aspects also exerted influence, including hours dedicated to training, time spent on administrative and/or teaching duties outside working hours, travel time to and from the Local Educational Management Unit (UGEL), duration of stays at the UGEL, and commuting time from principal residence to the educational institution. The Histogram-Based Gradient Boosting algorithm, optimized with Bayesian techniques and trained with data balanced through Random Oversampling, achieved a balanced accuracy of 0.63 on a test set with real-world class distribution. When using Generative Adversarial Networks to balance only the training set, better results were obtained in recall (0.74), precision (0.72), and F1 score (0.70). SHAP analysis revealed that economic factors primarily influenced dissatisfied principals, while interpersonal factors were more important for highly satisfied principals, suggesting a hierarchical pattern of needs. The findings could inform strategies to enhance principals' job satisfaction and strengthen data-driven educational policies.
1 Introduction
Job satisfaction is crucial to staff well-being and retention (Dicke et al., 2020). Keeping employees satisfied fosters productivity, creativity, and innovation and helps prevent job turnover, which is particularly critical in high-pressure roles such as school principals (Hoo et al., 2024). In recent decades, the role of school principals has undergone a significant increase in demands and complexity, intensifying the inherent challenges of the position (Darmody and Smyth, 2016). This satisfaction affects their well-being and promotes leadership capable of creating an optimal learning environment, fostering healthy social interactions, and enabling effective intellectual development among students (Robinson et al., 2008; Liu and Bellibas, 2018; Leithwood and Jantzi, 2008).
According to statistics from the National Teacher and Principal Survey (NTPS) of the National Center for Education Statistics (NCES) in the United States, 34% of principals reported not feeling the same enthusiasm as when they started their careers, 24% stated they would leave their positions if they found better compensation and 17% admitted to considering not attending school due to fatigue (NCES, 2024). Similarly, 41.4% of school principals in Finland experienced high levels of stress, 35.9% reported moderate stress, and 22.7% reported low stress (Upadyaya et al., 2021). These findings reflect that, even in developed countries, school principals face significant challenges in achieving job satisfaction. Despite available resources and policies, workload and stress negatively affect their well-being and performance, suggesting that essential gaps still exist in the support necessary for these educational leaders to maintain high levels of satisfaction in their roles.
Several international studies have identified key factors that influence school principals' job satisfaction, employing conventional analytical methodologies. In the Irish context, Darmody and Smyth (2016) analyzed data from 898 primary schools using linear regression, establishing associations between personal characteristics, working conditions, school context, and teacher climate with principals' professional satisfaction. Subsequently Liu and Bellibas (2018), applying structural equation modeling to data from the Teaching and Learning International Survey (TALIS) across 32 OECD member countries, identified that social interaction among staff, school safety, human resources, staff autonomy, and mutual respect constitute significant predictors of leadership satisfaction. In Australia, Horwood et al. (2022), utilizing a difference-in-differences econometric model with data from 5,082 principals collected between 2011 and 2016, found a causal relationship between greater principal autonomy and job satisfaction. More recently, Kaufman et al. (2022) longitudinal study with 1,000 K-12 public school principals in the United States, using exploratory factor analysis, demonstrated that resource scarcity and teacher shortages consistently predict leadership dissatisfaction and turnover intention. Finally, Reid and Creed (2023) showed that time dedicated to administrative tasks outside traditional school hours significantly influences American principals' job satisfaction.
While these studies have advanced our understanding of principal satisfaction, existing research presents significant methodological limitations. The traditional statistical approaches employed-linear regression (Darmody and Smyth, 2016), structural equation modeling (Liu and Bellibas, 2018), econometric models (Horwood et al., 2022), factor analysis (Kaufman et al., 2022)—have limited capacity to detect complex non-linear relationships and interactions among multiple predictor variables. This restriction is particularly relevant in the multidimensional phenomenon of job satisfaction, where relationships between variables rarely follow simple linear patterns. These methodological limitations, combined with the scarcity of specific studies in the Peruvian context, reveal a critical knowledge gap that must be addressed.
This knowledge gap is particularly pronounced in the specific case of Peru, where there is a notable absence of research analyzing the predictive factors of job satisfaction among school principals, particularly with nationally representative data. The only available official source, the National Survey of Public Basic Education Institution Principals (ENDI) conducted by the Ministry of Education, reports that 11.6% of Peruvian school principals express dissatisfaction with their roles (MINEDU, 2022), but without delving into the underlying causal factors. Given the crucial importance of these leaders for the effective functioning of the educational system, this research gap indicates an urgent need to identify the determinants of their job satisfaction.
To address these methodological and contextual limitations, machine learning (ML) emerges as a particularly suitable approach for understanding school principals' job satisfaction. With the growing volume of data generated globally, ML has become an effective tool for extracting insights and gaining deep knowledge from complex datasets. Unlike conventional statistical methods, machine learning techniques possess an inherent capacity to detect complex patterns and non-linear relationships in multidimensional datasets. This advantage is especially valuable for analyzing complex psychosocial phenomena such as job satisfaction, where multiple factors interact in ways that linear models cannot adequately capture.
The potential of ML is supported by recent research demonstrating its effectiveness in related domains, including the prediction of employee job satisfaction across various sectors (Kim et al., 2024; Gupta et al., 2023; Celbiş et al., 2023; Choi and Choi, 2022). In the educational field specifically, ML has been successfully applied to diverse objectives, such as predicting academic performance (Pallathadka et al., 2023; Rajendran et al., 2022; Xu et al., 2019; Yıldvz and Börekci, 2020), forecasting university student dropout rates (Kabathova and Drlik, 2021; Oqaidi et al., 2022; Park and Yoo, 2021; Del-Águila-Castro, 2024), detecting learning difficulties (Hussain et al., 2019), and identifying factors affecting teacher job satisfaction (Holgado-Apaza et al., 2023; McJames et al., 2023; Yoo and Rho, 2020). Additionally, ML feature selection methods allow for more robust identification of the most relevant predictors among hundreds of potential variables, offering a deeper and more nuanced understanding of factors influencing professional satisfaction.
Despite this promising application of ML in education, the specific application of these techniques to analyze school principals' job satisfaction remains unexplored, particularly in the Peruvian context where nationally representative data is available. This gap presents a significant opportunity to leverage advanced analytical techniques to elucidate the complex factors influencing job satisfaction among this critical group within the educational system and to develop predictive models that can anticipate their satisfaction levels, thereby informing more effective interventions in the sector.
In this context, we address the following research questions: (1) What are the key predictors of job satisfaction among Peruvian school principals? and (2) Which machine learning algorithm demonstrates the highest predictive performance for school principals' job satisfaction in Peru?
To address these questions, we establish the following objectives:
• Identify the key predictors of job satisfaction among school principals in basic education institutions in Peru, based on data from the 2018 National Survey of Directors of Public and Private Educational Institutions (ENDI-2018).
• Implement a feature selection approach that combines filter, embedded, and wrapper methods to identify the most relevant and reliable predictors.
• Determine the most suitable algorithms for predicting job satisfaction in this group of professionals by evaluating their performance using commonly applied metrics in similar studies.
This research is justified primarily by the critical influence school principals exert on educational outcomes, with studies by Bao (2024) and Dutta and Sahney (2022) demonstrating that principal effectiveness significantly impacts school climate, teacher performance, and student achievement. Despite this pivotal role, factors affecting job satisfaction among Peruvian school principals remain significantly understudied, creating a knowledge gap particularly relevant given Peru's recent educational reforms and evolving leadership challenges in the national education system (Saavedra and Gutierrez, 2020). The current literature lacks comprehensive analyses of satisfaction predictors specific to the Peruvian context, where principals face unique administrative demands, resource constraints, and socio-educational complexities that may differ substantially from those in more extensively researched educational systems. Additionally, utilizing machine learning techniques in this area marks a methodological advancement that can uncover intricate relationships that traditional statistical methods may miss.
The remainder of this document is organized as follows: Section 2 presents the literature review; Section 3 describes the materials and methods used; Section 4 exposes the results obtained; Section 5 analyzes and discusses the findings; Section 6 addresses the managerial implications; and, finally, Section 7 presents the study's conclusions.
2 Literature review
2.1 Job satisfaction of school principals and factors influencing it
Job satisfaction lacks a universally accepted definition, but research has identified two fundamental components: affective and cognitive (Liu and Bellibas, 2018). The most influential conceptualization comes from Locke (1976), who adopted an emotional perspective, defining it as “a pleasurable or positive emotional state resulting from the appraisal of one's job or job experiences” (p. 1300). The cognitive aspect of job satisfaction emerges from a more conscious evaluation process of job characteristics and their comparison with a known standard or level of expectations (Moorman, 1993; Pujol-Cols and Dabos, 2018).
Building upon these conceptualizations, we can define school principals' job satisfaction as the extent to which they experience positive emotional states arising from their appraisal of their leadership roles, as well as the perceived alignment between organizational demands and their personal values, goals, and achievement expectations.
The factors that influence job satisfaction have been conceptualized from various theoretical perspectives that provide a framework for understanding this phenomenon across different professional contexts. According to Maslow (1987), job satisfaction emerges when five levels of human needs are progressively satisfied: physiological needs, linked to basic working conditions; security needs, related to professional stability; social needs, encompassing interpersonal relationships in the work environment; esteem needs, manifested through professional recognition; and self-actualization needs, expressed through development opportunities and meaningful work. Furthermore, Herzberg (1966)'s theory distinguishes two categories of factors that influence job satisfaction: hygiene factors, which include interpersonal relationships, salary, administrative policies, supervision, and working conditions; and motivational factors, which encompass elements such as professional advancement, the nature of work, personal growth, responsibility, recognition, and achievement (Alshmemri et al., 2017).
The literature on factors specifically influencing school principals' job satisfaction reveals a multidimensional landscape encompassing both contextual elements and personal characteristics. The environment in which the principal's leadership function develops constitutes a fundamental element in this dynamic. Derlin and Schneider (1994) identified that geographical location, particularly the distinction between urban and rural settings, impacts satisfaction. Darmody and Smyth (2016) expanded this understanding, demonstrating that general working conditions and organizational climate also determine the satisfaction of primary school principals in Ireland.
Factors related to workload and professional environment constitute critical determinants of leadership satisfaction. Wang et al. (2018) demonstrated that the intensity of administrative burden, professional recognition, job demands, external educational policies, and relationships with teachers and unions directly influence the job satisfaction of Canadian primary and secondary school principals. Using data from the 2013 Teaching and Learning International Survey (TALIS), Liu and Bellibas (2018) complemented this analysis, highlighting the importance of positive social interaction, institutional security, the degree of autonomy granted to staff, the implemented management model and the availability of financial resources.
In the realm of organizational resources, Kaufman et al. (2022) has highlighted how the scarcity of material and human resources, particularly the lack of teaching staff, negatively affects the job satisfaction of American school principals. These findings are consistent with previous studies such as that of Collie et al. (2020), which, in its analysis of data from 22 countries of the Organisation for Economic Co-operation and Development (OECD), identified that staff shortages and institutional climate are significant predictors of school principals' job satisfaction across diverse educational and cultural contexts.
Finally, individual characteristics also significantly modulate school principals' job satisfaction. Ashraf (2018), also using data from TALIS 2013, demonstrated that variables such as gender and accumulated experience in educational leadership positions constitute significant predictors of job satisfaction among these professionals.
2.2 ML and its applications in studying school principals' job satisfaction
ML is a subdiscipline of artificial intelligence that focuses on developing algorithms and models that allow computers to learn and make predictions based on data (Samuel, 1959). These techniques provide valuable tools for analyzing complex patterns in satisfaction studies that might not be obvious through conventional statistical approaches.
The literature review identifies only two studies specifically focused on predicting school principals' job satisfaction using advanced data analysis techniques. The pioneering work of Talingting (2019) applied data mining techniques to predict the job satisfaction of 157 school administrators in the Philippines. Their research compared three predictive algorithms, finding that C4.5 achieved the highest accuracy (80.89%), followed by Naïve Bayes (74.52%) and KNN (71.97%).
Meanwhile, Dadaczynski et al. (2019) employed a predictive approach to investigate the determinants of job satisfaction among 1,026 German school principals and vice-principals. Their stepwise linear regression analysis identified decision latitude (autonomy) and self-efficacy as the strongest predictors of school principals' job satisfaction.
These studies demonstrate the applicability of predictive algorithms for analyzing school leaders' job satisfaction; however, they present significant limitations. First, they focus on applying individual algorithms without exploring ensemble approaches that integrate various feature selection techniques. Second, they utilize datasets that are relatively small or not nationally representative. These limitations reveal a significant gap in the research literature on school principals' job satisfaction.
To date, no studies have been found that combine advanced ML techniques with feature selection methods using nationally representative data, such as those available in the Peruvian context. To address this gap, we implement an ensemble feature selection approach validated by multiple ML algorithms to identify precisely the key factors influencing school principals' job satisfaction.
3 Materials and methods
This study analyzes data from the 2018 National Survey of Directors of Public and Private Educational Institutions (ENDI-2018), conducted by the Educational Statistics Unit of Peru's Ministry of Education, to identify the most reliable predictors of job satisfaction among Peruvian school principals. We implemented an ensemble approach that combines multiple feature selection techniques, integrating filter, wrapper, and embedded methods. The selected predictors were then used to train and validate five state-of-the-art machine learning algorithms, optimizing the predictive models' performance and generalization capacity. Figure 1 illustrates our methodological workflow, which comprises four sequential phases: (1) data extraction, (2) data cleaning and preprocessing, (3) feature selection, and (4) model training and validation. Each of these phases is described in detail below.
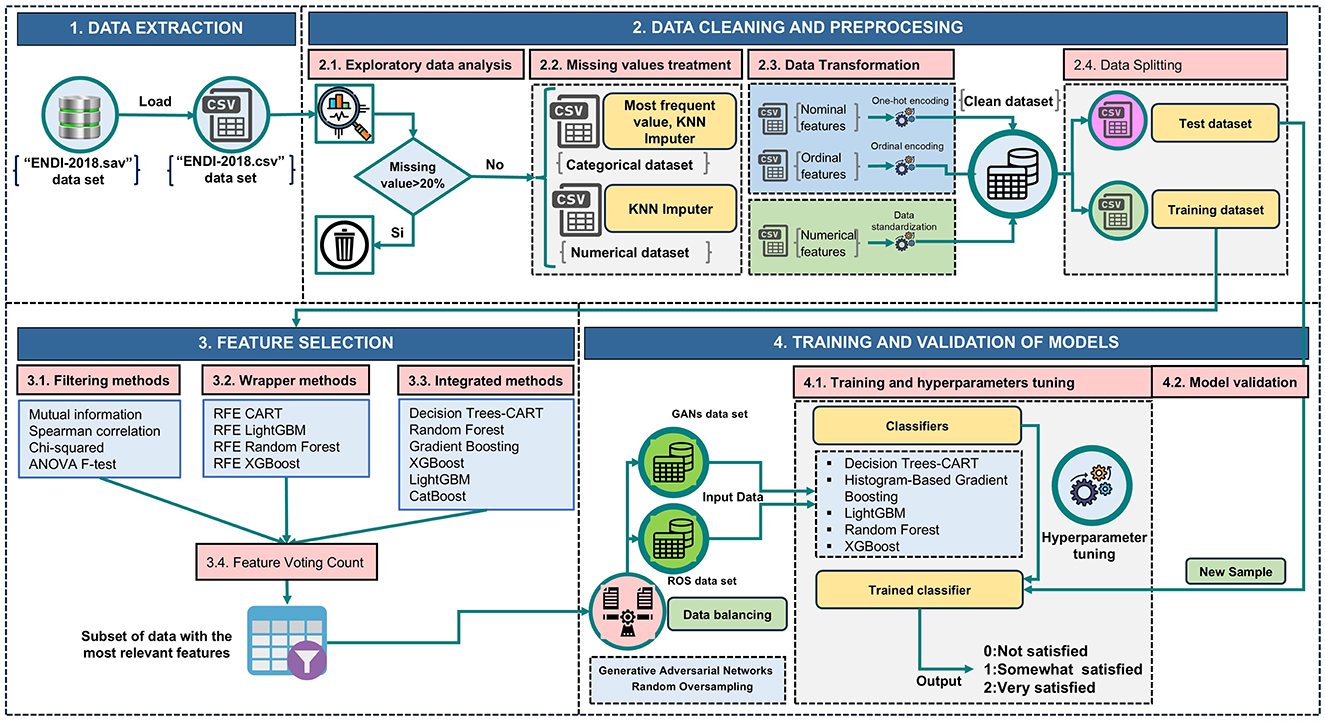
Figure 1. Proposed framework to identify key predictors of job satisfaction among Peruvian school principals.
3.1 Data extraction
We obtained data from the ENDI-2018 available on the website of the Educational Statistics Unit of Peru's Ministry of Education (MINEDU, 2024). This survey provides detailed information about school principals from public and private institutions in urban and rural areas across all 24 regions of Peru, including the Constitutional Province of Callao. The data encompasses institutional resources, working conditions, professional values, educational policies, professional development, sociodemographic, and economic characteristics, as well as professional perceptions and aspirations. The survey was implemented between October and November 2018 using a one-stage independent probabilistic sampling design for each department. The resulting dataset comprises 4,368 school principals and 739 variables.
For our target variable, we utilized responses to the question “How satisfied are you with your current position at this educational institution?” (coded as P908_9 in the ENDI-2018 dataset). This self-reported measure is a categorical ordinal variable on a Likert scale with three levels: 0 representing “not satisfied,” 1 representing “satisfied,” and 2 representing “very satisfied.” This measurement provides a comprehensive assessment of school principals' overall job satisfaction, integrating various dimensions of their professional experience. The construction and validation of this measurement instrument were conducted by Peru's Ministry of Education following standardized survey methodology to ensure reliability and validity across the national educational system.
Regarding our methodological approach, Table 1 summarizes the subset of the most relevant predictors for school principals' job satisfaction identified through our feature selection process. Table 2 presents the optimal hyperparameters identified during the experimental process. The comprehensive data dictionary of key variables for predicting school principals' job satisfaction in Peru is provided in Table 3, which includes their coding, description, and measurement scale.
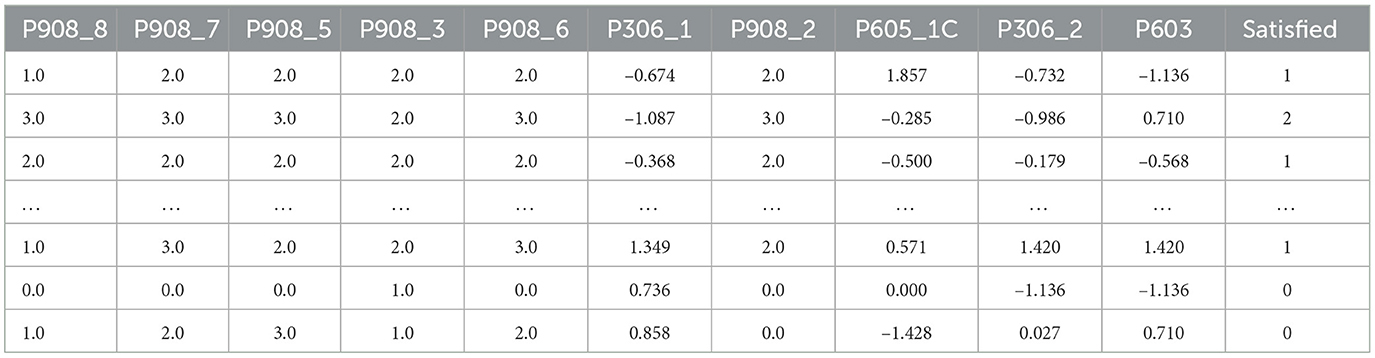
Table 1. Subset of the most relevant predictors for school principals' job satisfaction.
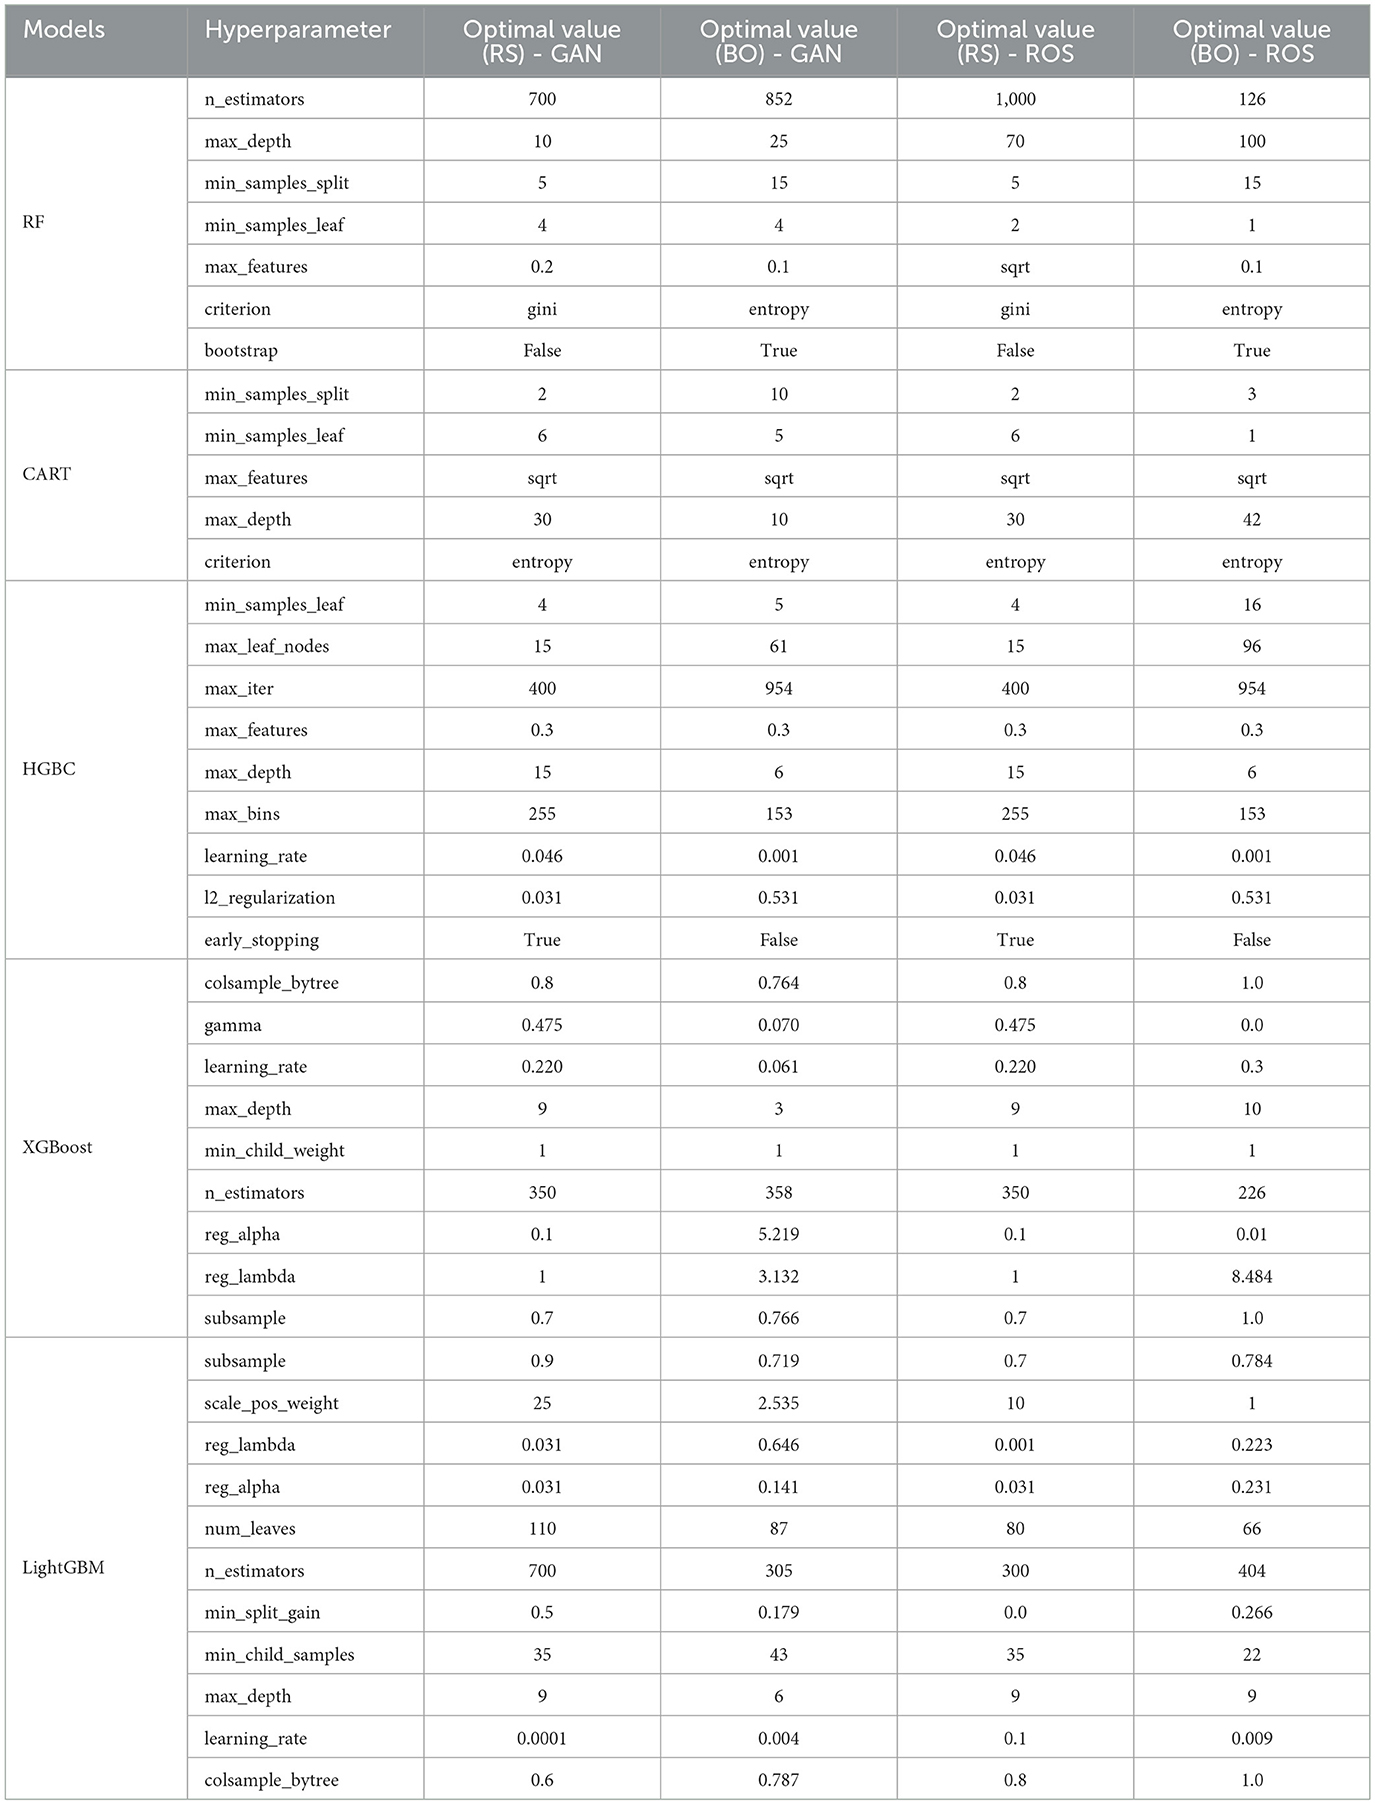
Table 2. Optimal hyperparameters identified during the experimental process.
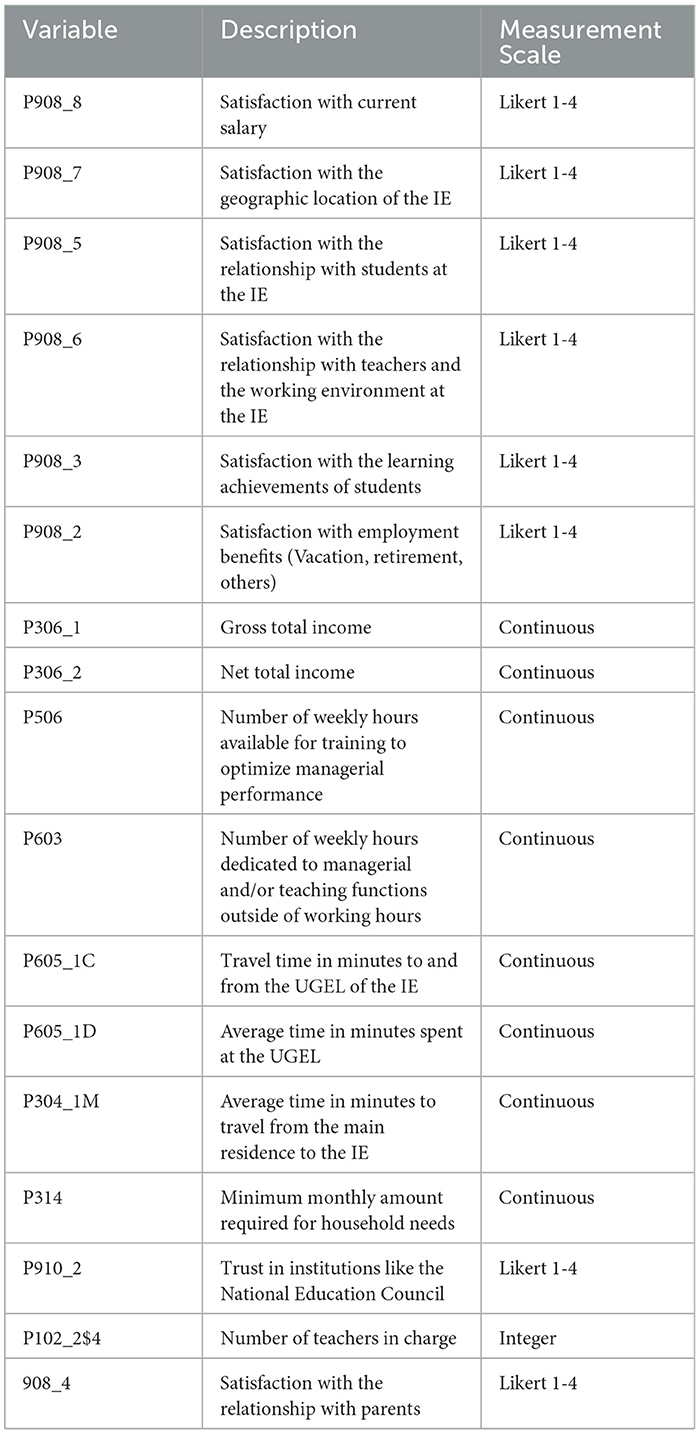
Table 3. Data dictionary of key variables for predicting school principals' job satisfaction in Peru.
3.2 Data cleaning and pre-procesing
Data cleaning and preprocessing are essential stages in preparing datasets for analysis. These processes involve identifying and correcting inconsistencies to ensure data quality (Maharana et al., 2022). Omitting these crucial steps can significantly compromise the reliability and accuracy of analytical models, leading to unreliable results (Holgado-Apaza et al., 2024; Alam and Yao, 2019). Furthermore, data quality directly impacts the generalization capability of predictive models. Industry estimates indicate that data preprocessing typically consumes 50% to 80% of the total time in data science projects (Maharana et al., 2022; Wang and Wang, 2020). The following sections describe the specific data cleaning and preprocessing procedures implemented in this study.
3.2.1 Exploratory data analysis
Exploratory Data Analysis (EDA) is an essential initial stage in data science projects aimed at understanding and evaluating the dataset's quality. This process involves exploring distributions, identifying outliers, detecting anomalies, and visualizing key patterns without making prior assumptions about the data (Komorowski et al., 2016; Chatfield, 1986). Additionally, EDA allows for intuitive data manipulation and visualization, facilitating the generation of preliminary insights and laying the foundation for building robust analytical models. Figure 2 presents representative graphs generated during this task.
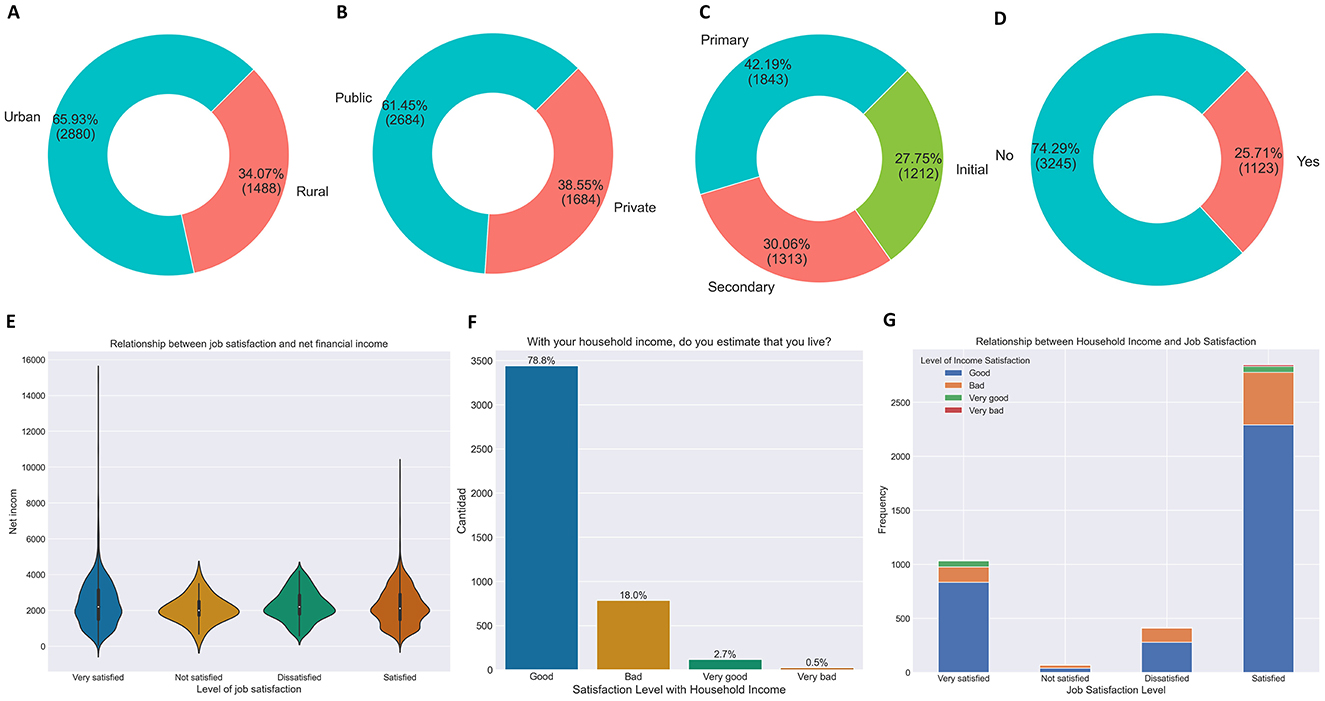
Figure 2. Exploratory data analysis: Sample of representative graphs. (A) Distribution by location. (B) Distribution by management. (C) Distribution by level. (D) Secondary occupation. (E) Relationship between net income and job satisfaction. (F) Perception of quality of life by household income. (G) Relationship between household income and job satisfaction level.
3.2.2 Missing values treatment
Missing data is a common challenge in real-world datasets and can negatively impact the performance of most ML algorithms if not appropriately handled (Shadbahr et al., 2023). For this reason, it is essential to address missing values before analyzing the data, as ignoring or omitting them can result in biased or poorly informed analysis (Emmanuel et al., 2021).
In this study, we excluded columns with more than 20% missing values. Our decision to establish this specific threshold is grounded in specialized literature, where various studies in educational and psychological contexts suggest that acceptable tolerance for missing data ranges between 15% and 20% (Enders, 2003; Dong and Peng, 2013; Emmanuel et al., 2021; Memon et al., 2023; Khan et al., 2024). This process resulted in a dataset with 244 columns. Of these, 21 variables were numerical, 146 nominal, and 77 ordinal.
We applied KNN Imputation to handle missing values for numerical and ordinal categorical variables, as this method has demonstrated good performance in previous studies (Memon et al., 2023; Li et al., 2024; Jadhav et al., 2019). For nominal categorical variables, we implemented a simple imputation approach, replacing missing values with the mode (Emmanuel et al., 2021). Figure 3 presents a visualization of the variables before and after imputation.
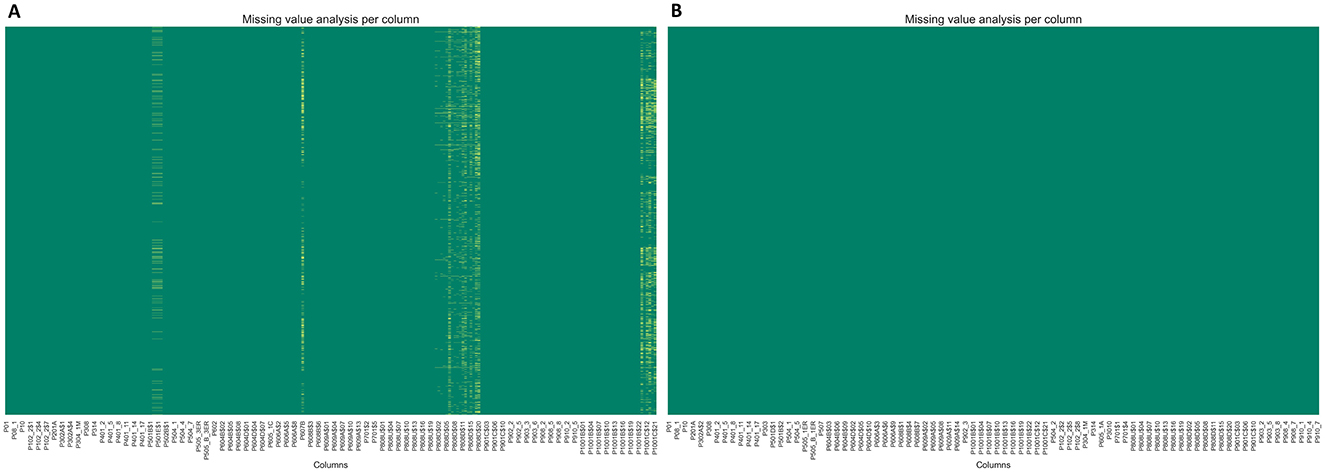
Figure 3. Handling missing values. (A) Shows some features with missing values before the imputation process. (B) Displays the features without missing values after the imputation process. Yellow indicates missing data, while green represents present data.
3.2.3 Data transformation
In real-world datasets, approximately 40% of features are categorical (Kosaraju et al., 2023). Converting these categorical features into numerical representations, a process known as “categorical encoding,” constitutes a crucial step in data preprocessing. This transformation is essential because most ML models demonstrate superior performance when operating with numerical rather than categorical data (Kosaraju et al., 2023).
This study implemented specific techniques to process both categorical and numerical variables. For nominal categorical variables, we applied One-Hot Encoding, which transforms each category into a binary column indicating the presence or absence of that category in each observation (Zhang et al., 2022). This procedure was executed using the get_dummies() function from Python's pandas library. For ordinal categorical variables, we employed ordinal encoding, assigning an ordered numerical value to each category to preserve its natural order (Yuan et al., 2023). This task was performed using the OrdinalEncoder class from the sklearn.preprocessing module, part of Python's scikit-learn library (Pedregosa et al., 2011).
As the numerical variables contained outliers, we addressed them using a two-step approach. First, we scaled the data using the RobustScaler class from the sklearn.preprocessing module, as this method is resistant to extreme values. Additionally, we treated outliers using the interquartile range (IQR) technique, identifying outliers as values falling outside the range defined by Equation 1.
where IQR = Q3−Q1. Here, Q1 and Q3 represent the first and third quartiles, while LTV (Lower Threshold Value) and UTV (Upper Threshold Value) denote the lower and upper limits, respectively. We replaced identified outliers with the median of each variable to minimize their impact on subsequent models. After completing this task, we obtained a clean dataset with 4,368 rows and 491 columns.
In Figure 4A, the boxplot illustrates the data distribution in its original scale. Figure 4B presents the data after scaling, allowing for better visualization of the outliers. Finally, Figure 4C shows the boxplot of the features after the outlier treatment process.
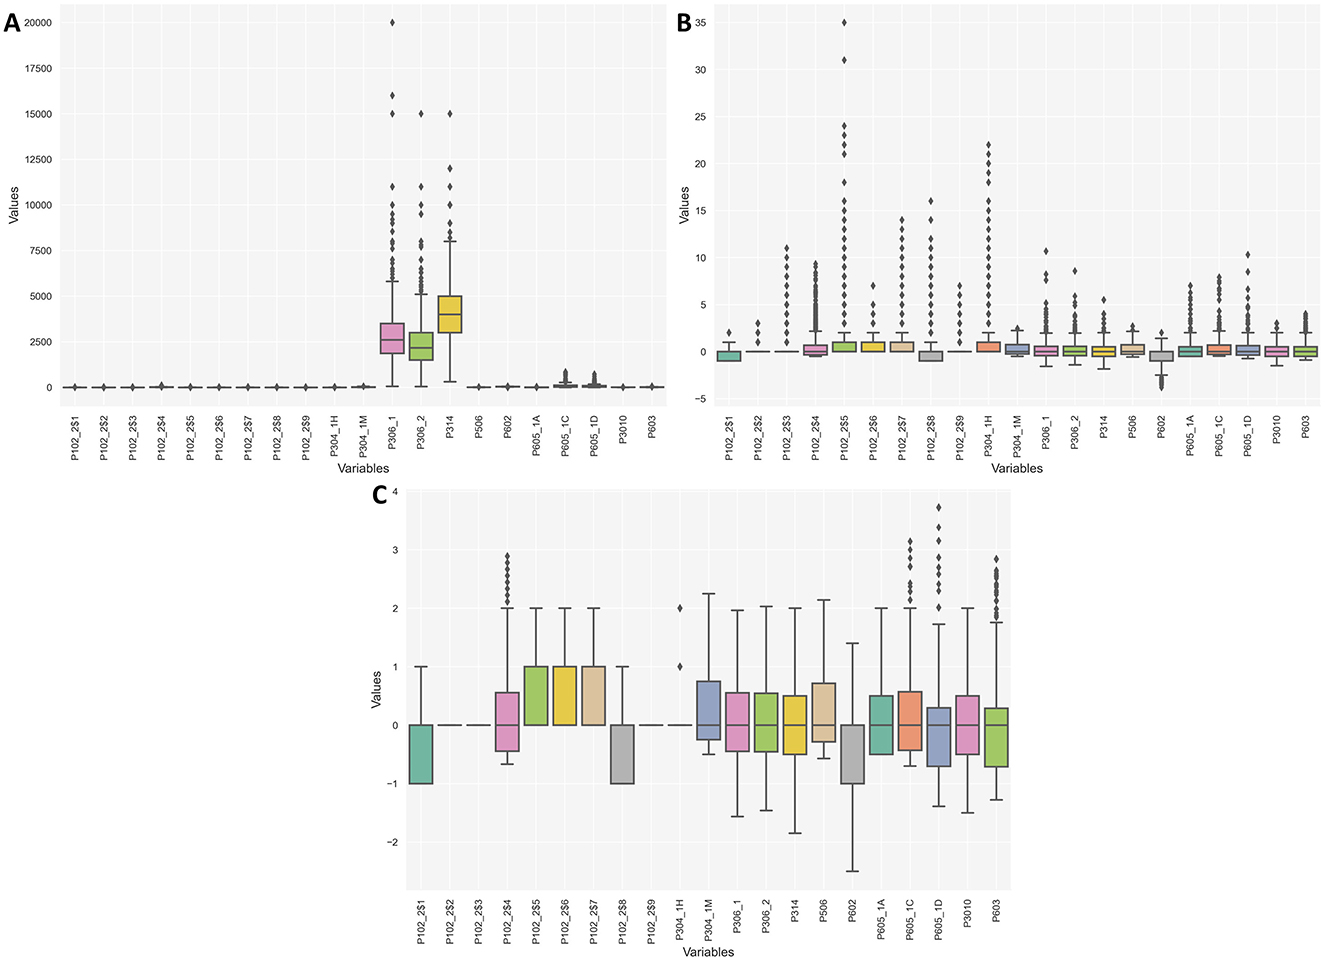
Figure 4. Outlier Treatment. (A) Displays the presence of outliers in the features on their normal scale. (B) shows the presence of outliers in the features after the scaling process. (C) illustrates the distribution of numerical features after outlier treatment.
3.2.4 Data splitting
An essential aspect of data science projects is dividing the dataset into two parts: training and testing. The training set estimates model parameters, while the testing set remains isolated during training and is used to evaluate model performance. In this study, we divided the dataset using an 80:20 ratio (80% for training and 20% for testing), a standard approach widely employed in similar research (Nikhil et al., 2024; Hanić et al., 2024). Due to class imbalance in the target variable “Job satisfaction of school principals,” we implemented data balancing techniques to prevent model bias. Without balancing, models typically show good performance in classifying the majority class but inferior performance in minority classes. To achieve more equitable evaluation (Mduma, 2023; Batista et al., 2004), we employed Random Oversampling (ROS) and Generative Adversarial Networks (GANs). Figure 5 illustrates the data distribution before and after the balancing process.
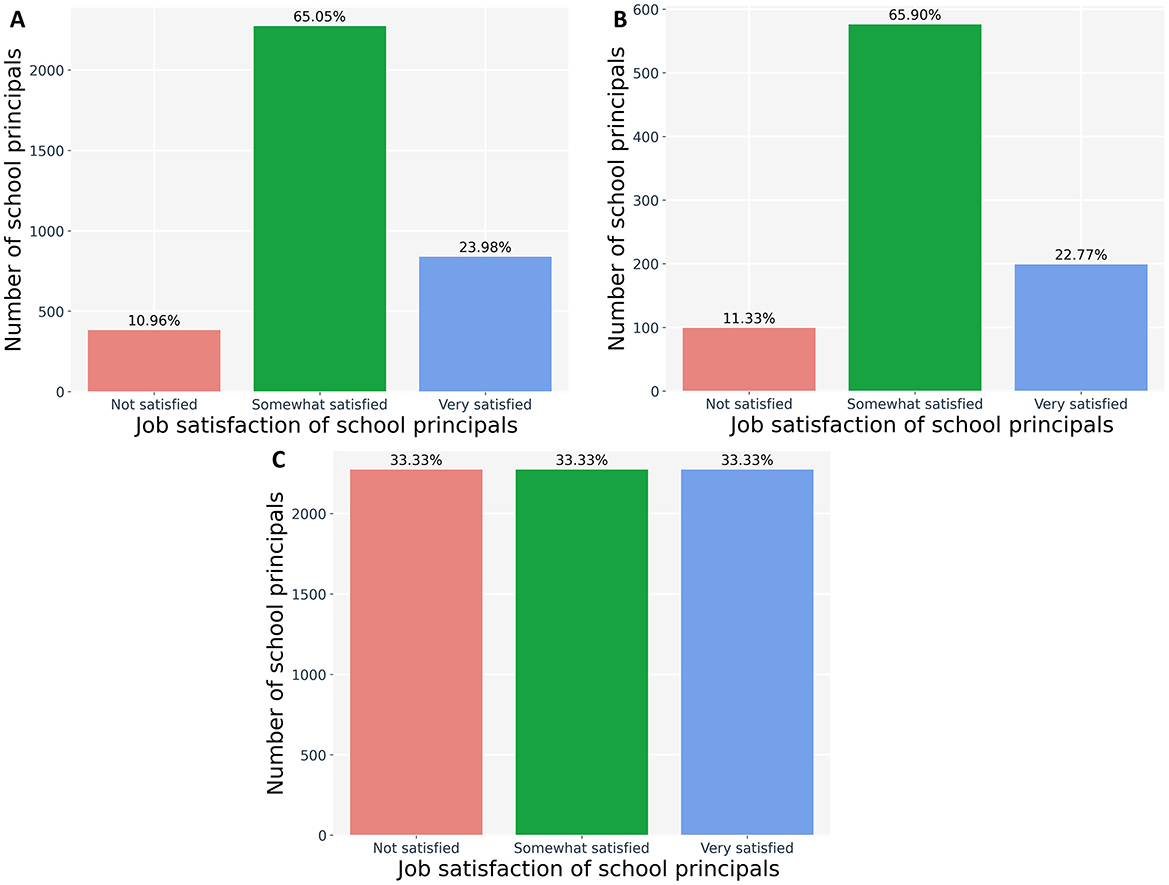
Figure 5. Distribution of job satisfaction of Peruvian school principals. (A) Distribution in the training dataset before balancing. (B) Distribution in the test dataset. (C) Distribution in the training dataset after balancing.
3.3 Feature selection
One of the main challenges in building an accurate predictive machine learning (ML) model with high-dimensional data is overcoming the curse of dimensionality (Pudjihartono et al., 2022). Training models directly on such data can lead to overfitting, where the model performs well on the training set but fails to generalize to new or real-world data.
Feature selection addresses this issue by identifying and retaining the most relevant subset of features while discarding irrelevant or redundant ones. This process reduces data dimensionality, improves model performance, lowers the risk of overfitting, speeds up processing, and enhances result interpretability (Chandrashekar and Sahin, 2014; Htun et al., 2023).
Three feature selection methods are most frequently employed: filter, wrapper, and embedded methods (Pudjihartono et al., 2022; Noroozi et al., 2023; Chourib et al., 2022). In this research, to identify the most reliable variables for predicting Peruvian school principals' job satisfaction, we implemented our feature selection approach exclusively on the training dataset, after the data splitting step mentioned earlier. This sequential approach ensures that information from the test set does not leak into the feature selection process, which would invalidate performance metrics during evaluation. Our ensemble feature selection methodology integrated results from four filter methods, four wrapper method variants, and five embedded methods.
3.3.1 Filtering methods
Filter methods assess the importance of predictor variables individually without considering potential interactions. These methods employ statistical techniques to quantify relationships between each input variable and the target variable, generating scores that enable variable ranking by relevance (Htun et al., 2023). Variables with the lowest scores are systematically eliminated, retaining only those meeting predefined inclusion criteria (Htun et al., 2023; Zhang et al., 2023). In this study, we applied four filter methods: chi-squared test, Spearman correlation, mutual information, and ANOVA F-test. Notably, these approaches operate independently of predictive models, effectively identifying significant predictors prior to model construction.
3.3.1.1 Chi-square
The chi-square test is a statistical method used to assess whether there is a significant relationship between two categorical variables (Cherrington et al., 2019). In the context of feature selection, this technique allows for selecting features highly dependent on the target variable. Equation 2 shows the formula for calculating this value.
where: c denotes the degrees of freedom, Oi represents the observed values, and Ei represents the expected values.
3.3.1.2 Mutual information
MI is a metric that quantifies the association between two variables, capturing both linear and non-linear relationships. It represents the amount of information one random variable provides about another (Vergara and Estévez, 2014). The greater the mutual information between (X) and (Y), the lower the uncertainty of (X) when (Y) is known, and vice versa (Cardona and Velásquez Henao, 2006). In machine learning, an MI value of zero indicates total independence between (X) and (Y), while a value greater than zero suggests the existence of a relationship between a feature and the target variable. Equation 3 presents the formal definition for calculating this metric.
where p(x(i), y(j)) represents the joint probability of x(i) and y(j), and p(x(i)) and p(y(j)) are their marginal distributions.
3.3.1.3 Analysis of variance (ANOVA F-test)
A parametric statistical test that evaluates whether the means of two or more groups originate from the same distribution by measuring the relationship between variances using an (F)-statistic. ANOVA aids in feature selection by identifying predictors significantly related to the target variable (Raufi and Longo, 2024). Equation 4 presents the formula for calculating the statistic's scores.
where MSB represents the between-group variance, and MSW represents the within-group variance, calculated using Equations 5, 6, respectively.
In this study, we employed the SelectKBest class from the scikit-learn library in Python to implement feature selection methods. Spearman's correlation was the sole exception, calculated using the spearmanr function from the scipy stats module. Figure 6 displays the fifteen most relevant characteristics for predicting school principals' job satisfaction, as identified by the filtering methods.
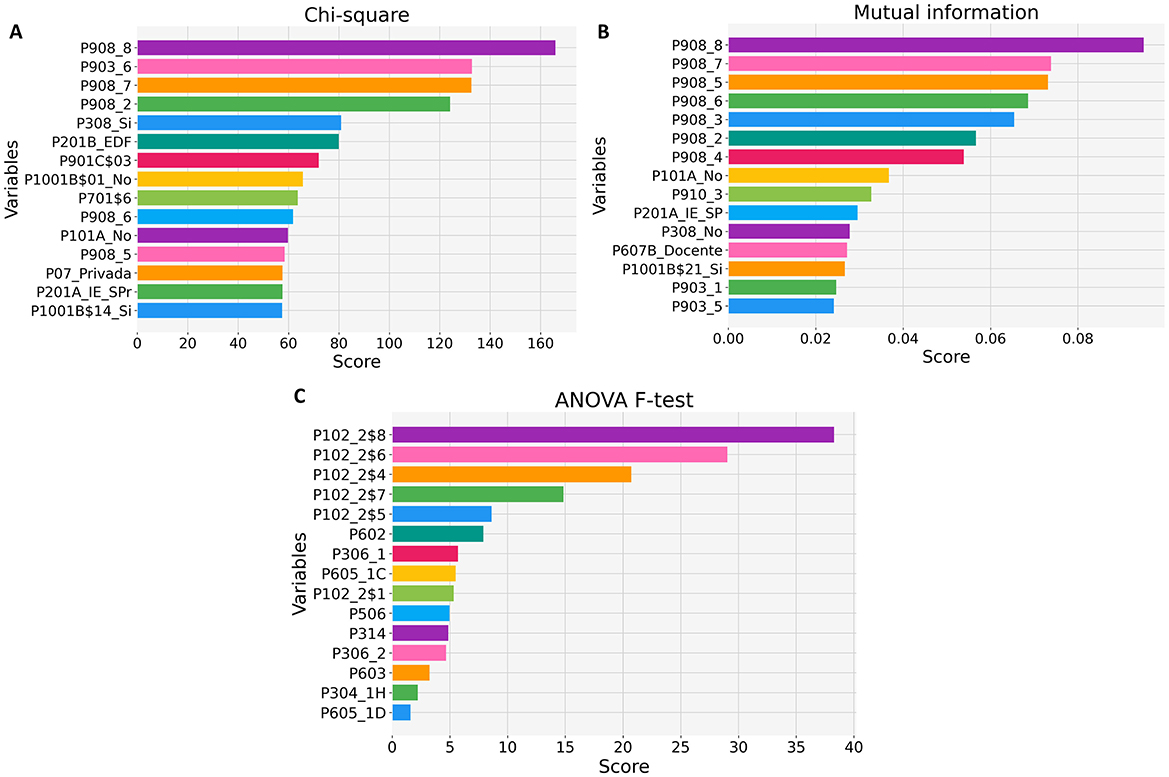
Figure 6. Feature selection for predicting school principals' job satisfaction using filter methods. (A) Chi-square test scores. (B) Mutual Information scores. (C) ANOVA F-test scores.
3.3.1.4 Spearman's correlation coefficient (ρ)
This method quantifies the strength and direction of the monotonic relationship between two variables (Jiang et al., 2024). Its calculation is represented by Equation 7.
where D denotes the difference between the ranks of corresponding values in two variables, and N represents the total number of observations in the dataset. Figure 7 illustrates the correlation matrix for the 15 variables most strongly correlated with the target variable.
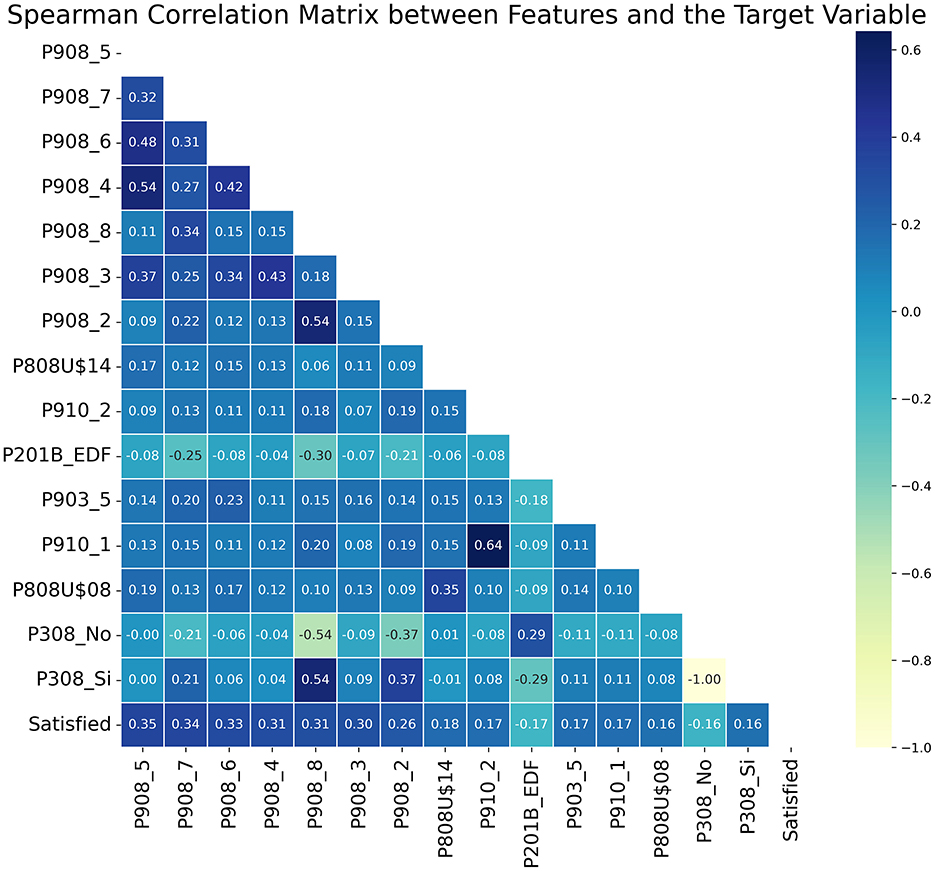
Figure 7. Matrix of Correlations: The fifteen most correlated features with the target variable.
The selection of filter methods was carefully adapted to data types and their statistical properties. For categorical predictors, we employed the chi-square test due to its demonstrated effectiveness in evaluating independence between categorical variables and the target class (Bahassine et al., 2020). Continuous numerical variables were assessed using the ANOVA F-test, which optimally detects mean differences across satisfaction levels (Brownlee, 2020). Mutual information was universally applied to all variable types given its unique ability to capture both linear and non-linear dependencies without distributional assumptions (Pudjihartono et al., 2022). Spearman correlation was specifically used after numerical transformation of ordinal data, as it appropriately handles rank-based relationships while maintaining robustness to monotonic non-linearities.
3.3.2 Wrapper methods
Wrapper methods select feature subsets by evaluating model performance across different feature combinations (El Aboudi and Benhlima, 2016). This approach systematically generates candidate feature subsets, trains models, and assesses their performance. The most suitable subset is then identified based on the model's predictive accuracy. In this research, we employed Recursive Feature Elimination (RFE) in conjunction with four machine learning algorithms: CART, LightGBM, Random Forest, and XGBoost to identify the most performant features. Figure 8 illustrates the feature selection results obtained from these methods.
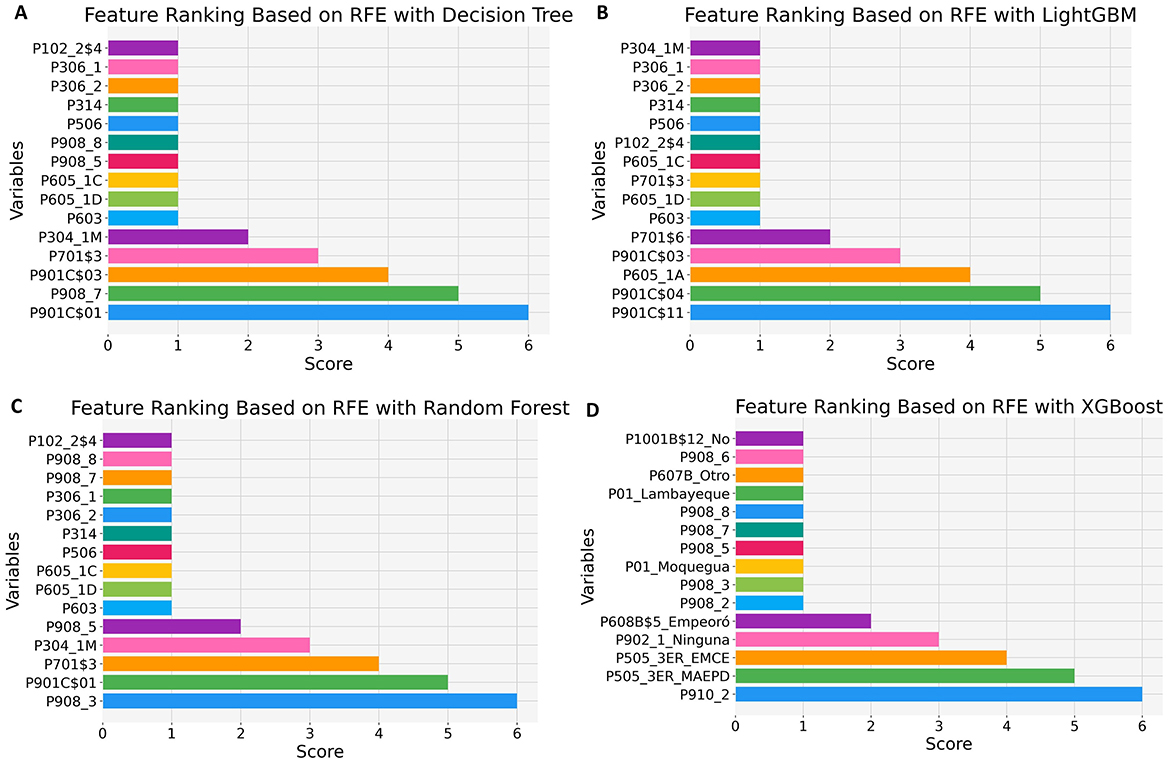
Figure 8. Feature selection using wrapper methods. (A) RFE with CART. (B) RFE with LightGBM. (C) RFE with Random Forest. (D) RFE with XGBoost. In the RFE method, each feature is assigned a relevance score, where a value of 1 represents the most important feature, and higher values indicate lower importance.
3.3.3 Integrated methods
Integrated methods perform feature selection directly within the machine learning algorithm, incorporating this process into the model's training phase. During training, the model adjusts its internal parameters and evaluates the importance or weight of each feature based on its contribution to overall performance. This approach simultaneously identifies the most relevant features and optimizes classification accuracy (Pudjihartono et al., 2022; Mohtasham et al., 2024). In this study, we implemented integrated methods using robust algorithms, including CART, Random Forest, Gradient Boosting, XGBoost, LightGBM, and CatBoost. Figure 9 presents the feature selection results obtained from these algorithms.
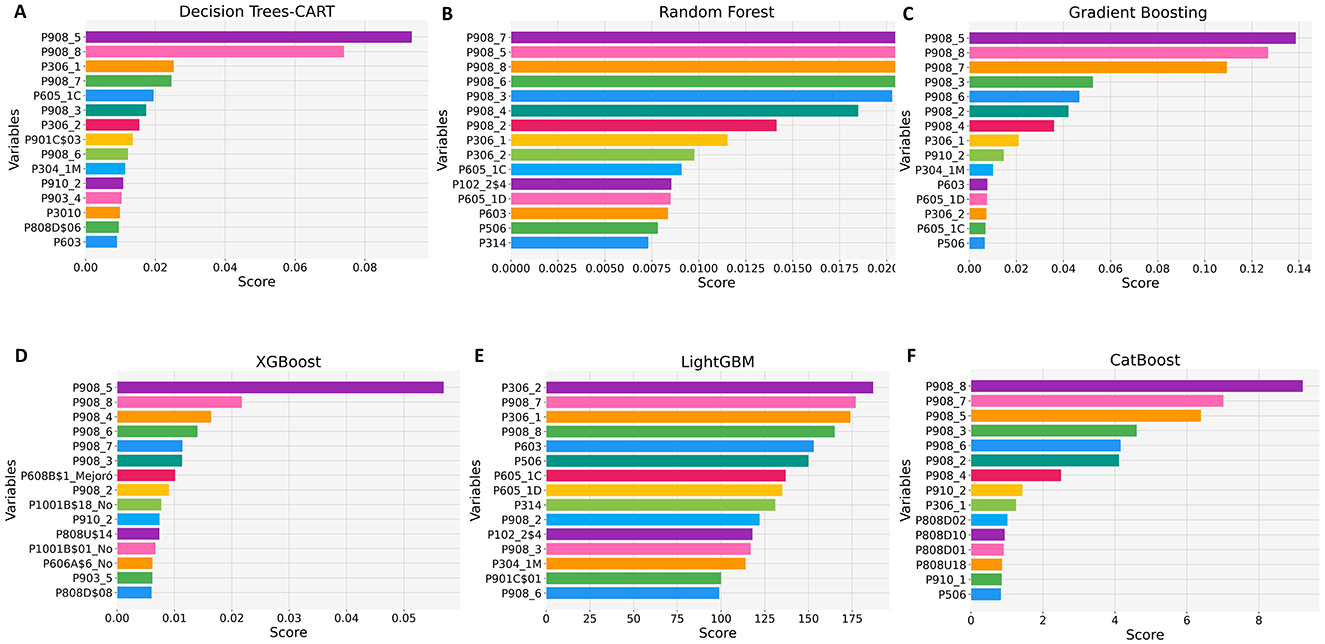
Figure 9. Feature selection using integrated methods. (A) CART. (B) Random Forest. (C) Gradient Boosting. (D) XGBoost. (E) LightGBM. (F) CatBoost.
3.4 Feature voting count
In this approach, each basic feature selection method independently identifies the most relevant features (Alotaibi and Alotaibi, 2021). Subsequently, each feature is evaluated across the ensemble of selection methods using a majority voting system. Features selected by at least two different selection methods are considered chosen by the global method.
The application of this technique reduced the dataset to the 29 most relevant features out of a total of 491 columns, optimizing the prediction of school principals' job satisfaction. To build parsimonious classification models, we identified the optimal number of features from these 29 before proceeding to the training and validation phase. Using the Random Forest algorithm, we analyzed each variable's contribution across seven key metrics: accuracy, balanced accuracy, F1 score, precision, recall, Cohen's Kappa, and Jaccard score. Figure 10 shows the model's performance evolution as variables are sequentially added in order of importance (voting criterion). Notably, the model achieves the highest values across all evaluated metrics by including only the top ten features (up to the variable P603: “Number of hours per week dedicated to administrative and/or teaching functions outside working hours”).
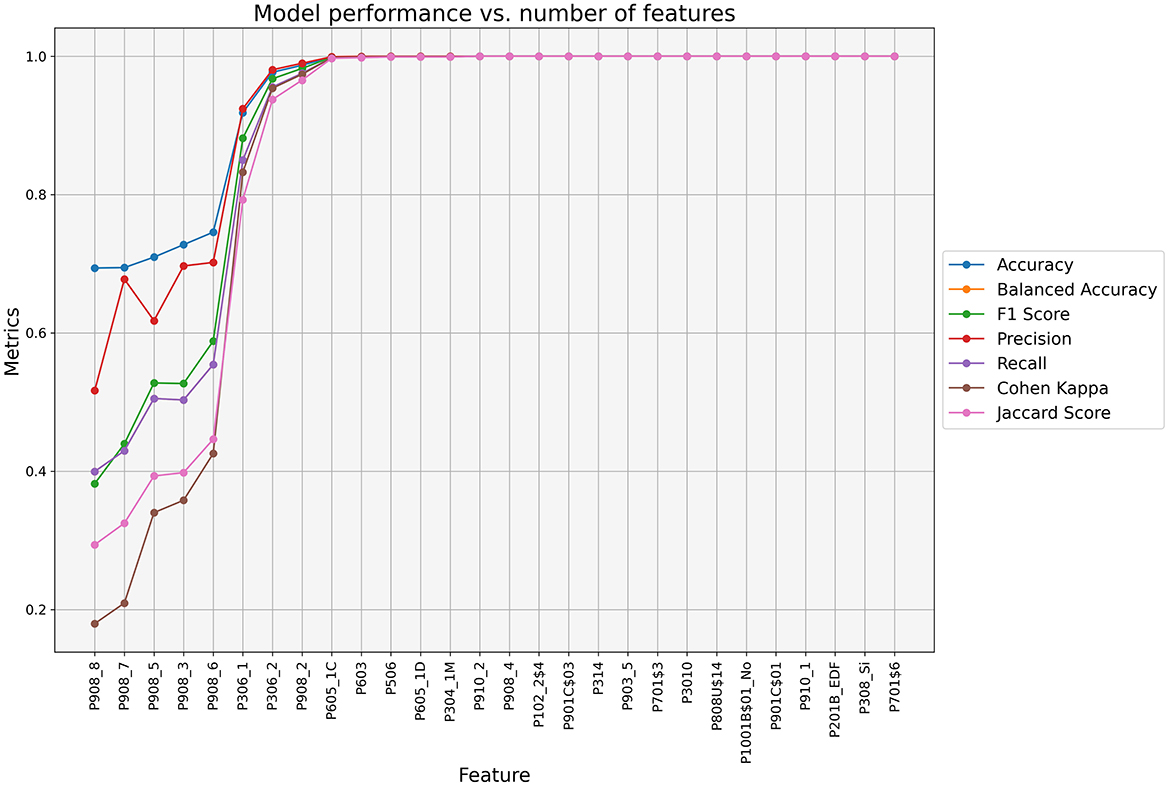
Figure 10. Cumulative contribution of the selected features to the Random Forest model performance in predicting school principals' job satisfaction.
Table 1 presents a summary of the dataset subset with the most relevant features selected to predict the job satisfaction of Peruvian school principals. This dataset consists of 4,368 instances and 11 features, with 80% used to train the models and the remaining 20% reserved for testing. Of the 11 features, 10 are predictor variables, and one is the target variable (“Satisfied”). The latter takes three values: 0, indicating “dissatisfied;” 1, representing “somewhat satisfied;” and 2, meaning “very satisfied.” We show the data dictionary for these variables in Table 3.
3.5 Training and validation of models
We trained and validated the models using Anaconda Navigator 2.6.0, a platform designed to manage environments and packages for data science, machine learning, analysis, and visualization projects. Within this environment, we used Scikit-learn for data preprocessing, feature selection, model training, and evaluation. Additionally, we utilized Matplotlib and R's ggplot2 for data visualization. The experiments were conducted on a computer with a 12th-generation Intel(R) Core(TM) i5-12450H processor with a clock speed of 2.50 GHz, 40 GB of RAM, and the 64-bit Windows 11 Home operating system.
3.6 Training and hyperparameter tuning
To identify the most suitable model for our problem, we trained the algorithms RF, CART, HistGradientBoostingClassifier (HGBC), XGBoost, and LightGBM on the training dataset. Hyperparameter tuning plays a crucial role in this process, as it involves evaluating multiple combinations of model hyperparameters (Alberto et al., 2024). The optimal combination, denoted as h*, is selected based on its performance on a specific dataset.
This process is mathematically formalized in Equation 8, which defines h* as the model configuration that minimizes the loss function L:
where h denotes a model configured with a specific set of hyperparameters, Θ is the dataset used to evaluate h, and L(h, Θ) quantifies the loss (or error) of model h on dataset Θ.
There are various hyperparameter optimization methods, each with advantages and limitations depending on the context and available resources. Among the most notable are Grid search (GS), Random search (RS), Bayesian optimization (BO), and approaches based on evolutionary algorithms, such as genetic algorithms or evolutionary strategies. In this study, we conducted hyperparameter tuning using two widely recognized approaches: Random Search and Bayesian Optimization. Both methods were implemented with 5-fold cross-validation k = 5 and a total of 50 iterations to ensure robust evaluation of model performance.
Random search selects hyperparameter combinations randomly within a predefined space, allowing exploration of diverse configurations at a lower computational cost than Grid search (Monica and Agrawal, 2024). Bayesian optimization, conversely, adopts a more sophisticated approach, using probabilistic models to identify promising regions within the search space, thereby reducing unnecessary iterations and improving efficiency in identifying optimal hyperparameters (Wu et al., 2019).
Table 2 summarizes the optimal hyperparameter values obtained through optimization for each method, using training datasets balanced with both Random Oversampling and Generative Adversarial Networks.
3.7 Model validation
To evaluate the effectiveness and predictive capability of the developed models, we used 20% of the data exclusively reserved for testing. The evaluation was based on the confusion matrix and its derived metrics: accuracy, balanced accuracy, recall, precision, F1 score, Cohen's Kappa coefficient, and Jaccard score. These metrics provide a comprehensive view of the models' performance, considering both the balance in classification and their ability to handle imbalanced classes.
3.7.1 Confusion matrix
A confusion matrix is a tabular representation used to evaluate the performance of a classifier. In this matrix, rows correspond to the true labels of the instances, and columns represent the predicted labels by the model (Heydarian et al., 2022). For multiclass classifiers, the construction of the matrix is mathematically defined in Equation 9.
where M(r, c) represents the number of instances classified as class c when the true class is r, n denotes the total number of instances in the dataset, I(.) is an indicator function that returns 1 if the condition is true and 0 otherwise, yi represents the true label of instance i, ȳi is the label predicted by the model for instance i, and q indicates the total number of classes in the problem.
Figure 11 presents a confusion matrix for a classification problem with three classes (A, B, and C). The elements AA, BB, and CC correspond to the true positives (TP) of classes A, B, and C, respectively, which means the samples were correctly classified. However, AB represents the samples of class A that were incorrectly classified as class B, and AC represents those misclassified as class C, corresponding to class A's false negatives. Therefore, the false negatives of class A (FNA) are calculated as the sum of AB and AC (FNA = AB+AC), including all samples of class A that were misclassified as B or C.
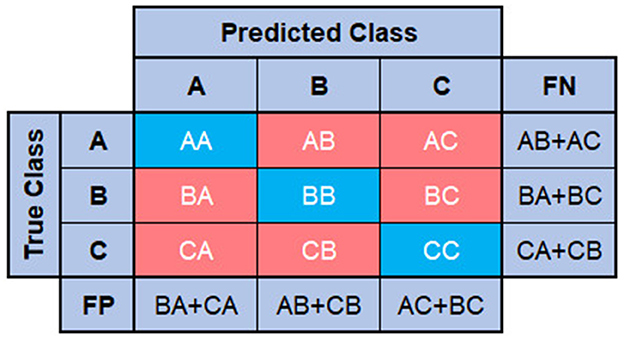
Figure 11. Confusion matrix for three-class classification.
In general terms, the false negatives of any class are obtained by summing the errors present in the row corresponding to that class. Meanwhile, the false positives of a predicted class are calculated by summing all errors in its column. For example, false positives of class A (FPA) are determined as the sum of BA and CA (FPA = BA+CA).
3.7.2 Accuracy
Accuracy represents the proportion of correct classifications relative to the total number of examples evaluated in a dataset. It provides an overall measure of model performance by capturing both true positive and true negative predictions. Equation 10 demonstrates the calculation of this metric.
3.7.3 Balanced accuracy
Balanced Accuracy is defined as the average recall (sensitivity) obtained for each class, offering a more nuanced assessment of model performance, particularly in scenarios with imbalanced datasets. Unlike traditional accuracy, this balanced accuracy metric accounts for the proportion of correctly classified instances within each class, mitigating potential bias from class imbalance. Equation 11 illustrates the calculation of this balanced accuracy.
where q denotes the total number of classes, and Recalli represents the recall for class i, computed as:
3.7.4 Precision
Precision is a metric that quantifies the proportion of true positives (TP) relative to the total number of cases classified as positive (Khan et al., 2023). In this research, we implemented Weighted Precision, which calculates individual precision for each class and subsequently weights these values proportionally to the number of examples within each class. This approach reflects the model's overall performance, considering the imbalance in the number of examples across classes. Equation 13 provides the formula for calculating this precision value.
where q represents the total number of classes, ni is the number of instances in class i, and Precisioni corresponds to the precision of class i, which is calculated using the formula presented in Equation 14.
3.7.5 Weighted recall
Weighted Recall is a widely used metric in multiclass classification problems. It is calculated by evaluating the individual recall for each class and weighting it according to the proportion of instances that the class represents in the dataset. This approach provides a measure that reflects the model's overall performance, taking into account potential imbalances in the class distribution, making it particularly suitable for imbalanced datasets. Equation 15 shows the formula used to calculate this metric.
where q represents the total number of classes, ni is the number of instances in class i, and Recalli is the recall of class i, which is calculated using the formula presented in Equation 12.
3.7.6 F1 score
The F1 score represents the harmonic mean between precision and recall, providing a balanced performance measure (Angeioplastis et al., 2025). The F1 score can be computed either as: (1) a macro-average that treats all classes equally, ignoring class imbalance; or (2) a weighted average that accounts for class distribution by weighting each class's contribution proportionally to its sample size. In this research, we employed the weighted F1 score, calculated as shown in Equation 16.
where q denotes the total number of classes, , with ni representing the number of instances in class i, and N the total number of instances across all classes. The class-specific F1 score for class i is calculated using Equation 17.
3.7.7 Cohen Kappa coefficient
The Cohen's Kappa coefficient is a classification model evaluation metric that measures the agreement between predictions and true labels, adjusting for chance-level agreement. Unlike metrics such as precision or recall, this Kappa coefficient is robust to class imbalances, making it particularly valuable in domains with unequal class distributions. Equation 18 describes its calculation.
where Po is the proportion of agreement between the model's predictions and the actual labels, and Pe is the proportion of agreement expected by chance.
3.7.8 Jaccard similarity
Jaccard similarity is a metric commonly used to assess the degree of similarity between the set of predicted labels and the set of true labels in a classification task. It is defined as the ratio between the size of the intersection and the size of the union of both sets. A Jaccard similarity score of 1 indicates complete agreement between the predicted and actual sets, while a score of 0 denotes no shared elements. Equation 19 presents its formulation in the context of classification performance evaluation.
where |A∩B| denotes the number of elements common to both sets and |A∪B| represents the total number of unique elements present in either set.
4 Results
The results presented in this section were obtained by evaluating various metrics applied to both the training and test datasets. The metrics considered include the confusion matrix, accuracy, balanced accuracy, recall, F1-Score, precision, Cohen's Kappa coefficient, and the Jaccard index.
Figure 12 presents the most important features for predicting school principals' job satisfaction, identified through a voting count across fourteen feature selection methods applied exclusively to the training dataset. The bars in the figure represent the frequency with which each feature was selected as important by different methods during the training process.
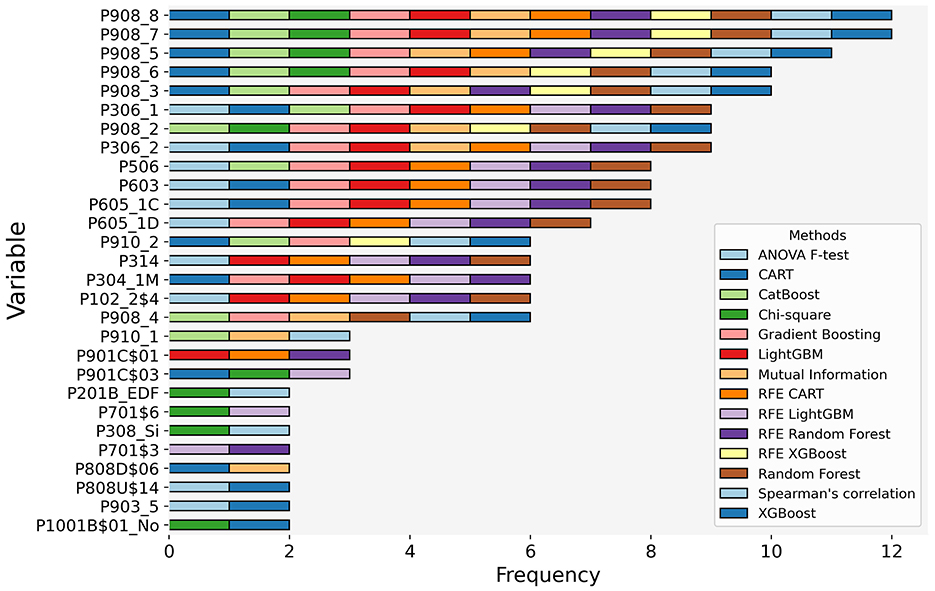
Figure 12. Vote count of the most relevant features for predicting school principals' job satisfaction.
According to the results presented in Figure 12, the most relevant variables for predicting school principals' job satisfaction, consistently identified by most feature selection methods, encompass multiple dimensions of job satisfaction. These include satisfaction with salary (P908_8), the geographical location of the educational institution (P908_7), relationships with students (P908_5), relationships with teachers and workplace climate (P908_6), as well as students' learning achievements (P908_3). Additionally, satisfaction with the employment benefits offered by the job (P908_2) was also highlighted as a key factor.
In economic terms, the gross and net income of the school leader (P306_1, P306_2) emerged as significant predictors. Similarly, variables related to time spent outside regular working hours on job-related activities and logistical aspects proved to be determinants. These variables include the weekly hours dedicated to training (P506), leadership and/or teaching duties performed outside regular hours (P603), travel time to the UGEL (P605_1C), the average duration of stays at the UGEL (P605_1D), and commuting time from home to the educational institution (P304_1M).
Other relevant predictors include the minimum monthly amount required to cover household needs (P314), trust in institutions such as the National Education Council (P910_2), the number of teachers under their supervision (P102_2$4), and satisfaction with relationships with parents (P908_4). For better interpretation, Table 3 provides a data dictionary that describes each variable considered.
Figure 13 presents the performance metrics of the Histogram-Based Gradient Boosting model optimized through Bayesian hyperparameter search, comparing two data balancing strategies: Random Oversampling (Figure 13A) and Generative Adversarial Networks (Figure 13B). The results demonstrate that when trained using GAN-balanced data, the algorithm achieved higher overall performance metrics compared to Random Oversampling.
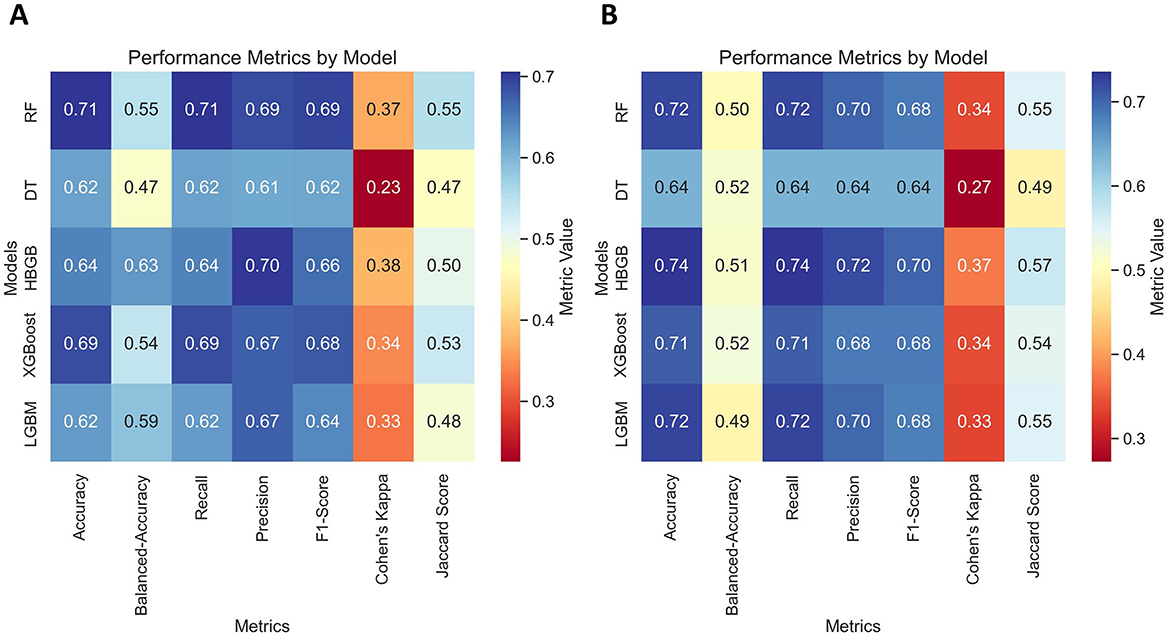
Figure 13. Comparison of metrics evaluated on the test dataset of the Histogram-Based Gradient Boosting models using Bayesian optimization and data balancing techniques. (A) Random Oversampling. (B) Generative Adversarial Networks.
Examining specific metrics, the GAN-balanced model attained accuracy and recall values of 0.74, indicating it correctly identified 74% of all instances and 74% of positive cases across all classes. Additionally, precision reached 0.72, meaning 72% of its positive predictions were correct, accounting for the relative weight of each class. The balanced accuracy of 0.51, while lower than with Random Oversampling (0.63), reflects the trade-off between improved overall accuracy and class-specific performance.
The GAN-trained model also demonstrated consistent performance across other relevant metrics: an F1-score of 0.70, Cohen's kappa coefficient of 0.37, and Jaccard score of 0.57. These values suggest an appropriate balance between precision and recall, with the kappa coefficient indicating moderate improvement over random classification.
Figure 14 displays the confusion matrices for the test dataset of models optimized through Bayesian hyperparameter search, comparing two data balancing strategies: Random Oversampling (Figure 14A) and Generative Adversarial Networks (Figure 14B).
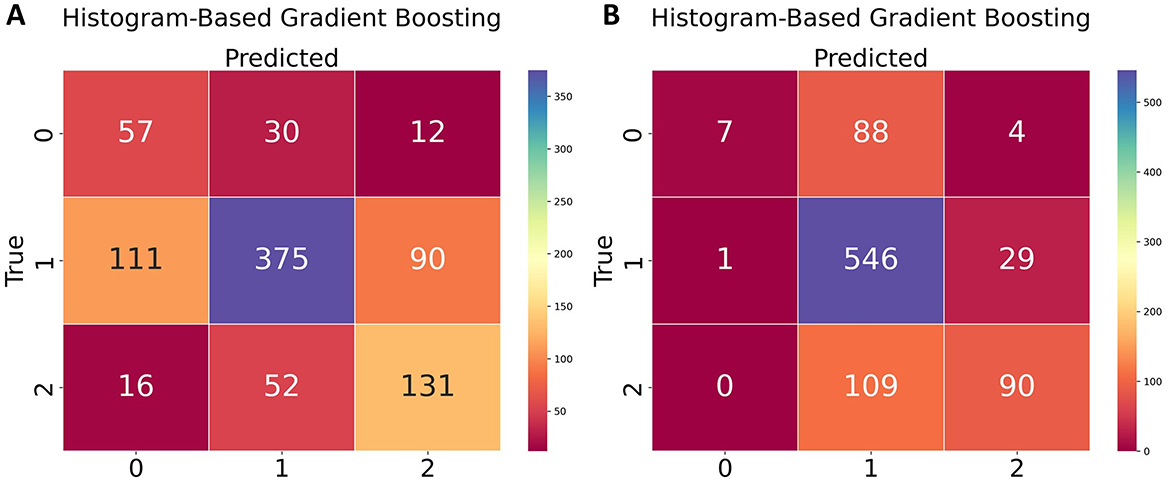
Figure 14. Confusion matrices of the Histogram-Based Gradient Boosting models using Bayesian optimization and data balancing techniques. (A) Random Oversampling. (B) Generative Adversarial Networks.
The results indicate that for class 0 (dissatisfied school principals), the Histogram-Based Gradient Boosting model achieved its best performance when trained with Random Oversampling, correctly identifying 57 true positives. For class 1 (satisfied school principals), the model trained with Generative Adversarial Networks data balancing correctly identified 546 true positives. Similarly, for class 2 (highly satisfied school principals), the model correctly identified 131 true positives when trained using the Random Oversampling technique, while with GANs it achieved 90 true positives.
Figure 15 presents the SHAP analysis of key predictors of school principals' job satisfaction using the Histogram-Based Gradient Boosting model. The visualizations compare dissatisfied principals (Class 0, top row) with highly satisfied principals (Class 2, bottom row). Figures 15A, D show SHAP decision plots with individual prediction explanations; Figures 15B, E display mean absolute SHAP value bar graphs indicating global feature importance; and Figures 15C, F present SHAP summary plots showing feature value distributions and impact directionality.
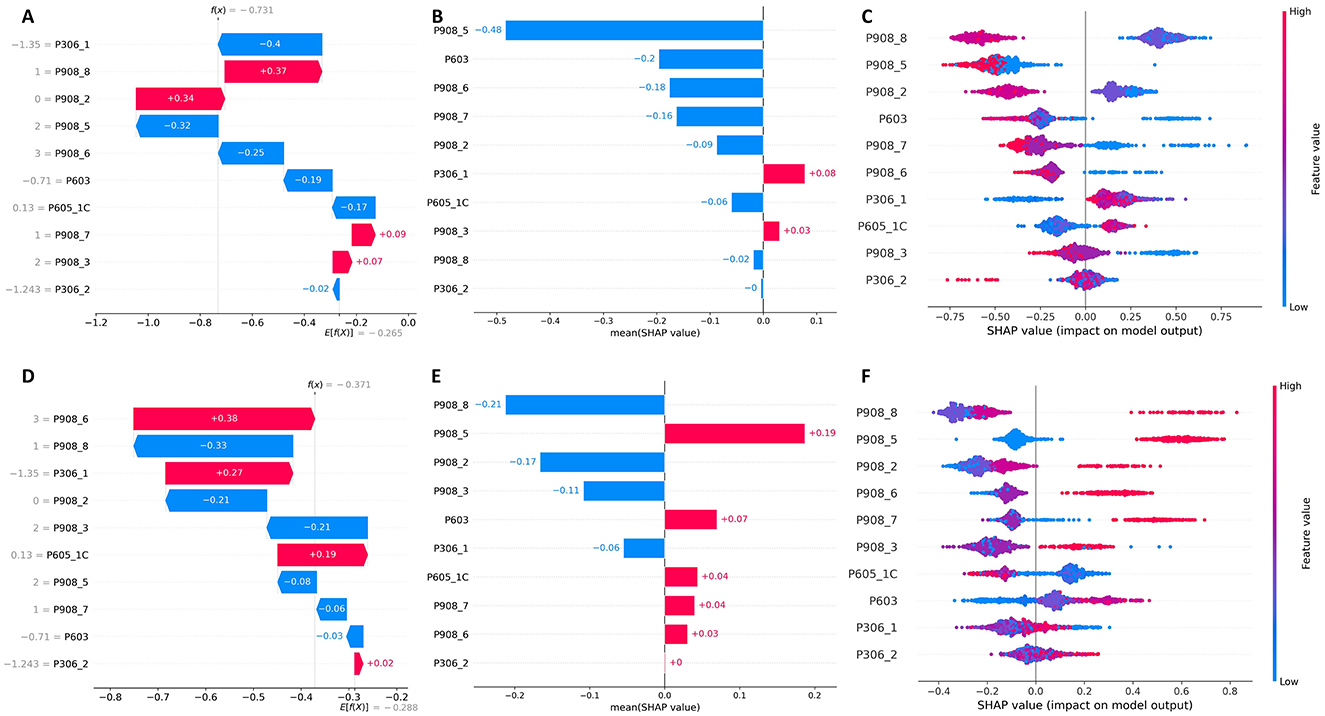
Figure 15. SHAP analysis of job satisfaction predictors. Top row: Dissatisfied principals (Class 0). Bottom row: Highly satisfied principals (Class 2). (A, D) SHAP decision plots, (B, E) Mean absolute SHAP values, (C, F) SHAP summary plots.
For dissatisfied school principals (Figure 15A), economic factors dominate the predictive model. Gross income (P306_1) exhibits the strongest negative influence (–0.4), indicating that lower income substantially increases dissatisfaction probability. Salary satisfaction (P908_8) demonstrates a positive impact (+0.37) when present. Notably, satisfaction with student relationships (P908_5) and teacher relationships (P908_6) show negative impacts (–0.32 and –0.25 respectively), suggesting these relational factors become less salient when economic needs are unmet.
For highly satisfied school principals (Figure 15B), interpersonal factors emerge as primary drivers. Satisfaction with teacher relationships and work environment (P908_6) demonstrates the strongest positive impact (+0.38), while satisfaction with student relationships (P908_5) shows a significant positive influence (+0.19). Low salary satisfaction (P908_8) appears as a negative predictor (-0.33), but gross income (P306_1) exhibits a positive contribution (+0.27) when present.
The SHAP importance graphs (Figures 15B, E) confirm these trends: while for dissatisfied principals, satisfaction with students (P908_5) and time spent outside working hours (P603) have greater global impact, for satisfied principals, salary satisfaction (P908_8) and satisfaction with students (P908_5) are the most influential factors.
The SHAP summary plots (Figures 15C, F) illustrate how low values of salary satisfaction (P908_8) consistently push predictions toward dissatisfaction, whereas high values of relational satisfaction contribute to predictions of high satisfaction. The behavior of P603 (hours worked outside regular schedule) is particularly notable, as its effect shifts from negative in dissatisfied administrators to slightly positive in satisfied ones, suggesting that the perception of workload may be moderated by overall job satisfaction.
5 Discussion
In recent years, school principals have faced a significant increase in the demands and complexity of their roles, which has amplified the challenges inherent to their positions. The job satisfaction of these leaders not only directly influences their well-being and plays a crucial role in promoting effective leadership capable of creating optimal learning environments, fostering healthy social interactions, and facilitating students' intellectual development. In this context, this study aimed to identify the main predictors of job satisfaction among school principals in basic education institutions in Peru.
It was found that working conditions and the work environment, represented by variables such as satisfaction with salary, satisfaction with relationships with students, teachers, and workplace climate, satisfaction with job benefits, satisfaction with students' learning achievements, and satisfaction with relationships with parents, have a direct impact on school principals' satisfaction. These variables reflect the immediate working environment of school principals, where salary, interpersonal relationships, workplace atmosphere, and educational outcomes play a fundamental role in their satisfaction. A positive work climate, where principals feel supported by teachers, students, and parents and adequate compensation, influences their motivation and job performance.
This finding aligns with the report by Darmody and Smyth (2016), who found that job satisfaction and occupational stress among Irish primary school principals were related to a complex set of personal characteristics, working conditions, school context, and teacher climate. Similarly, our results are consistent with Herzberg's motivation-hygiene theory, also known as the two-factor theory. Expressly, it confirms the role of hygiene factors in reducing job dissatisfaction.
According to Herzberg et al. (1959), hygiene factors are associated with external work conditions, such as salary, work environment, and interpersonal relationships, that surround the “performance” of work. While not generating satisfaction on their own, these factors prevent dissatisfaction by addressing the need to avoid unpleasantness in the work environment (Alshmemri et al., 2017). Therefore, the presence of these adequate conditions in the workplace can significantly contribute to improving the well-being of school principals, which is essential for strengthening the quality of educational management.
The relationship between satisfaction with student learning achievements and school principals' job satisfaction is a relatively understudied yet potentially significant aspect. According to Kılınç et al. (2024), principals' job satisfaction plays a crucial role in facilitating distributed leadership practices. These practices, in turn, strengthen teacher-student relationships, improving student academic performance. This perspective suggests that principals' job satisfaction may indirectly affect student learning achievements, underscoring its relevance as a variable of interest in educational contexts. Within our study, this variable emerges as a novel and significant predictor of school principals' job satisfaction, highlighting its importance for designing intervention strategies in the educational domain.
On the other hand, economic and financial factors, represented by the gross and net income variables of the principal and the minimum monthly amount required for the household, emerged as significant predictors of school principals' job satisfaction. These findings align with those reported by Iqbal et al. (2017), who demonstrated a significant relationship between the compensation offered by an organization and employee satisfaction in Pakistan. In the context of our study, the results suggest that economic aspects play a fundamental role in job satisfaction. School principals rely on their income to meet personal and family needs, so an adequate salary proportional to the position's responsibilities not only improves their overall well-being but also positively influences their workplace satisfaction.
The time spent outside working hours on job-related activities and logistical aspects, represented by variables such as the weekly time dedicated to training, time spent on principal or teaching duties outside of working hours, travel time to the UGEL (Local Education Management Unit), average time spent at the UGEL, and commuting time from home to the educational institution, can create an additional burden that negatively impacts school principals' job satisfaction. These findings align with those reported by Gautam et al. (2024), who identified a significant relationship between work-life balance and job satisfaction among nurses in Nepal. Furthermore, our findings are consistent with those of Bocean et al. (2023), who found that the balance or imbalance between work and personal life significantly affects professional and personal satisfaction among employees in Romanian organizations during the COVID-19 pandemic. This result highlights the importance of balancing professional responsibilities and personal needs to improve job satisfaction.
These findings can be explained by the multifaceted nature of educational leadership, where satisfaction emerges from the convergence of multiple domains. The influence of relationships with educational stakeholders reflects the social nature of school leadership, while economic factors highlight that principals require financial stability to perform effectively. Time-related factors reflect the unique demands of school principals' responsibilities, which often extend beyond traditional working hours and create tension between professional demands and personal well-being.
The superior performance of Histogram-Based Gradient Boosting stems from its ability to handle complex, non-linear relationships between diverse predictors and job satisfaction outcomes. Its efficient processing of both categorical and numerical variables, combined with robustness to imbalanced data distributions, made it better suited for modeling principal job satisfaction compared to other algorithms that might struggle with the complex patterns in our educational leadership data.
The significance of these findings for educational leadership research is threefold: they demonstrate the value of machine learning approaches in identifying predictors of principal satisfaction; they provide actionable targets for policy interventions across multiple domains; and they contribute to cross-cultural understanding of principal satisfaction by highlighting both universal and context-specific factors in the Peruvian educational system.
6 Managerial implications
Our findings provide important insights for educational policymakers and decision-makers seeking to improve school principals' job satisfaction. The identification of key predictors provides a reference point for specific interventions. Primarily, economic factors emerge as crucial “hygiene factors” (Herzberg, 1966) that must be adequately addressed before relational aspects can become effective motivators. Educational authorities should ensure appropriate remuneration and economic benefits, with particular attention to gross income levels. Concurrently, working conditions and the work environment, represented by variables such as satisfaction with student and teacher relationships, have a direct impact on leaders' satisfaction, suggesting that professional development programs should focus on strengthening these relational competencies.
Variables related to time invested in work activities outside regular hours and logistical aspects emerge as important predictors of dissatisfaction. Educational policies are needed that consider redistributing administrative tasks and prioritizing the assignment of leaders to schools relatively close to their homes when possible, especially in regions with geographical limitations such as the Peruvian Amazon. Promoting flexible schedules and reducing administrative burden could improve leaders' satisfaction and enhance their effectiveness in school management, with positive implications for the educational system as a whole, including student learning outcomes.
7 Conclusions
This study addressed a key knowledge gap by identifying predictors of job satisfaction among school principals in Peru. We utilized data from the 2018 National Survey of Directors of Public and Private Educational Institutions published by the Peruvian Ministry of Education, applying an ensemble approach to feature selection and evaluating five machine learning algorithms: Random Forest, Decision Trees-CART, Histogram-Based Gradient Boosting, XGBoost, and LightGBM.
Our analysis revealed three primary categories of predictors for principal job satisfaction. First, working conditions and work environment factors-including satisfaction with salary, relationships with students and teachers, workplace climate, job benefits, student learning achievements, and parent relationships-emerged as key predictors. Second, economic factors, such as gross and net income and minimum monthly household requirements, played a significant role. Third, time-related factors and job flexibility aspects, including training hours, tasks outside regular working hours, and travel times, were also determinant elements in predicting satisfaction.
Regarding methodological performance, the Histogram-Based Gradient Boosting algorithm, trained with data balanced through random oversampling and optimized with Bayesian optimization, achieved the highest balanced accuracy (0.63). This value falls below the optimal threshold of 1 because we deliberately maintained an imbalanced test set to reflect real-world class distributions and prevent information leakage. Additionally, when trained with GAN-balanced data, the model demonstrated strong performance across other metrics: recall (0.74), precision (0.72), F1-score (0.70), Cohen's Kappa coefficient (0.37), and Jaccard score (0.57), regardless of the hyperparameter tuning method.
Additionally, our SHAP analysis revealed important nuances in how predictors influence job satisfaction across different satisfaction levels. For dissatisfied principals, economic factors (particularly gross income) showed the strongest negative influence, while for highly satisfied principals, interpersonal factors (especially relationships with teachers and the work environment) emerged as primary positive drivers. This suggests that addressing principal satisfaction requires a hierarchical approach: first ensuring adequate economic conditions, then focusing on relational workplace factors. The analysis also uncovered interesting patterns regarding workload perception, as hours worked outside regular schedules had different effects depending on overall satisfaction levels, suggesting that the interpretation of workload may be moderated by general job satisfaction.
These findings provide both theoretical understanding of factors influencing principal job satisfaction and practical applications. Educational authorities can use this framework to design monitoring programs and targeted interventions to improve principal working conditions. Enhanced job satisfaction among school leaders can positively impact their leadership effectiveness, strengthen teacher performance, and ultimately benefit student learning outcomes.
7.1 Limitations of the study
Despite applying an ensemble of feature selection methods and state-of-the-art machine learning algorithms to reliably identify relevant predictors, this study has several limitations. First, data temporality represents a significant constraint. Although a more recent ENDI-2023 survey existed, we chose the ENDI-2018 survey for its rich variable set, potentially limiting applicability to current contexts as working conditions may have changed. Second, the scarcity of comparable studies in this specific domain hindered result contextualization, highlighting both the novelty of our approach and the need for additional theoretical frameworks and external validations. Third, the results' generalizability may be limited to the Peruvian educational context, as specific cultural, organizational, and political factors could restrict extrapolation to other countries or regions.
7.2 Future scope of this study
Future research could explore more sophisticated modeling approaches, including deep neural networks, to improve predictive accuracy for principal job satisfaction. Building on our initial SHAP analysis, more comprehensive applications of Explainable AI techniques could further elucidate the complex interactions between predictors and how their influence varies across different principal subgroups and contexts. Longitudinal studies would help understand how satisfaction evolves over time, especially during educational policy transitions. The relationship between principal satisfaction and student performance also warrants further investigation, as our findings suggest meaningful connections between these variables that could have significant implications for educational quality and outcomes.
Data availability statement
Publicly available datasets were analyzed in this study. This data can be found here: https://escale.minedu.gob.pe/uee/-/document_library_display/GMv7/view/5734924.
Author contributions
LH-A: Conceptualization, Data curation, Investigation, Methodology, Writing – original draft, Writing – review & editing. DI-P: Conceptualization, Investigation, Writing – original draft, Writing – review & editing. NU-G: Conceptualization, Investigation, Methodology, Writing – original draft, Writing – review & editing. YV-N: Conceptualization, Writing – original draft, Writing – review & editing. RA-N: Conceptualization, Investigation, Writing – original draft, Writing – review & editing. WQ: Investigation, Methodology, Project administration, Writing – original draft, Writing – review & editing. MQ-L: Methodology, Formal analysis, Validation, Writing – review & editing. DC-A: Conceptualization, Data curation, Investigation, Writing – original draft, Writing – review & editing. RC-A: Formal analysis, Project administration, Resources, Supervision, Validation, Visualization, Writing – original draft, Writing – review & editing. JP-L: Software, Validation, Visualization, Writing – original draft, Writing – review & editing.
Funding
The author(s) declare that no financial support was received for the research and/or publication of this article.
Conflict of interest
The authors declare that the research was conducted in the absence of any commercial or financial relationships that could be construed as a potential conflict of interest.
Generative AI statement
The author(s) declare that Gen AI was used in the creation of this manuscript. The author(s) acknowledge the use of generative AI solely for enhancing the fluency and clarity of the manuscript. All the analysis and conclusions presented are the author(s)' own work and responsibility.
Publisher's note
All claims expressed in this article are solely those of the authors and do not necessarily represent those of their affiliated organizations, or those of the publisher, the editors and the reviewers. Any product that may be evaluated in this article, or claim that may be made by its manufacturer, is not guaranteed or endorsed by the publisher.
References
Alam, S., and Yao, N. (2019). The impact of preprocessing steps on the accuracy of machine learning algorithms in sentiment analysis. Comput. Mathem. Organ. Theory 25, 319–335. doi: 10.1007/s10588-018-9266-8
Alberto, H. A. L., Nataly, A. N. R., Román, D. C. R., Raidith, R. R., Pierre, V. R., Miguel, V. C., et al. (2024). Evaluation of factors associated with the adoption of ICT in education using machine learning. Int. J. Data Netw. Sci. 8, 2563–2580. doi: 10.5267/j.ijdns.2024.5.002
Alotaibi, B., and Alotaibi, M. (2021). Consensus and majority vote feature selection methods and a detection technique for web phishing. J. Ambient Intell. Humaniz. Comput. 12, 717–727. doi: 10.1007/s12652-020-02054-3
Alshmemri, M., Shahwan-Akl, L., and Maude, P. (2017). Herzberg's two-factor theory. Life Sci. J. 14, 12–16.
Angeioplastis, A., Aliprantis, J., Konstantakis, M., and Tsimpiris, A. (2025). Predicting student performance and enhancing learning outcomes: a data-driven approach using educational data mining techniques. Computers 83:14. doi: 10.3390/computers14030083
Ashraf, M. (2018). Factors affecting school principals' job satisfaction. J. Econ. Insight 44, 41–58.
Bahassine, S., Madani, A., Al-Sarem, M., and Kissi, M. (2020). Feature selection using an improved Chi-square for Arabic text classification. J. King Saud Univ. 32, 225–231. doi: 10.1016/j.jksuci.2018.05.010
Bao, Y. (2024). The effect of principal transformational leadership on teacher innovative behavior: the moderator role of uncertainty avoidance and the mediated role of the sense of meaning at work. Front. Educ. 9:1378615. doi: 10.3389/feduc.2024.1378615
Batista, G. E. A. P. A., Prati, R. C., and Monard, M. C. (2004). A study of the behavior of several methods for balancing machine learning training data. ACM SIGKDD Explor. Newslet. 6, 20–29. doi: 10.1145/1007730.1007735
Bocean, C. G., Popescu, L., Varzaru, A. A., Avram, C. D., and Iancu, A. (2023). Work-life balance and employee satisfaction during COVID-19 pandemic. Sustainability 15:11631. doi: 10.3390/su151511631
Brownlee, J. (2020). Data preparation for machine learning: data cleaning, feature selection, and data transforms in Python. Machine Learning Mastery.
Cardona, C. A., and Velásquez Henao, J. D. (2006). Selección de características relevantes usando información mutua. DYNA: revista de la Facultad de Minas. Universidad Nacional de Colombia 73, 149–163.
Celbiş, M. G., Wong, P. H., Kourtit, K., and Nijkamp, P. (2023). Job satisfaction and the ‘great resignation': an exploratory machine learning analysis. Soc. Indic. Res. 170, 1097–1118. doi: 10.1007/s11205-023-03233-3
Chandrashekar, G., and Sahin, F. (2014). A survey on feature selection methods. Comput. Electr. Eng. 40, 16–28. doi: 10.1016/j.compeleceng.2013.11.024
Chatfield, C. (1986). Exploratory data analysis. Eur. J. Oper. Res. 23, 5–13. doi: 10.1016/0377-2217(86)90209-2
Cherrington, M., Thabtah, F., Lu, J., and Xu, Q. (2019). “Feature selection: filter methods performance challenges,” in 2019 International Conference on Computer and Information Sciences, ICCIS 2019. doi: 10.1109/ICCISci.2019.8716478
Choi, Y., and Choi, J. (2022). Job Satisfaction Prediction and Machine Learning Technique. Research Square. doi: 10.21203/rs.3.rs-1683972/v1
Chourib, I., Guillard, G., Farah, I. R., and Solaiman, B. (2022). Stroke treatment prediction using features selection methods and machine learning classifiers. IRBM 43, 678–686. doi: 10.1016/j.irbm.2022.02.002
Collie, R. J., Granziera, H., and Martin, A. J. (2020). School principals' workplace well-being: a multination examination of the role of their job resources and job demands. J. Educ. Admin. 58, 417–433. doi: 10.1108/JEA-04-2019-0075
Dadaczynski, K., Paulus, P., and Horstmann, D. (2019). The predictive value of individual and work-related resources for the health and work satisfaction of German school principals. Health Educ. J. 79, 225–236. doi: 10.1177/0017896919867118
Darmody, M., and Smyth, E. (2016). Primary school principals' job satisfaction and occupational stress. Int. J. Educ. Manag. 30, 115–128. doi: 10.1108/IJEM-12-2014-0162
Del-Águila-Castro, M. (2024). Intelligent systems and their application in the evaluation of university academic performance: a literature review in the South American context[Sistemas inteligentes y su aplicación en la evaluación del desempe no académico universitario: una revisión de. Rev. Cientifica Sistemas e Inf. 4:e671.
Derlin, R., and Schneider, G. T. (1994). Understanding job satisfaction: principals and teachers, urban and suburban. Sage J. 29, 63–88. doi: 10.1177/0042085994029001006
Dicke, T., Marsh, H. W., Parker, P. D., Guo, J., Riley, P., and Waldeyer, J. (2020). Job satisfaction of teachers and their principals in relation to climate and student achievement. J. Educ. Psychol. 112, 1061–1073. doi: 10.1037/edu0000409
Dong, Y., and Peng, C. Y. J. (2013). Principled missing data methods for researchers. Springerplus 2:222. doi: 10.1186/2193-1801-2-222
Dutta, V., and Sahney, S. (2022). Relation of principal instructional leadership, school climate, teacher job performance and student achievement. J. Educ. Admin. 60, 148–166. doi: 10.1108/JEA-01-2021-0010
El Aboudi, N., and Benhlima, L. (2016). “Review on wrapper feature selection approaches,” in Proceedings - 2016 International Conference on Engineering and MIS, ICEMIS 2016. doi: 10.1109/ICEMIS.2016.7745366
Emmanuel, T., Maupong, T., Mpoeleng, D., Semong, T., Mphago, B., and Tabona, O. (2021). A survey on missing data in machine learning. J. Big Data 8, 1–37. doi: 10.1186/s40537-021-00516-9
Enders, C. K. (2003). Using the expectation maximization algorithm to estimate coefficient alpha for scales with item-level missing data. Psychol. Methods 8, 322–337. doi: 10.1037/1082-989X.8.3.322
Gautam, P. K., Gautam, D. K., and Bhetuwal, R. (2024). Work-life balance, job satisfaction and turnover intentions among nurses. Int. J. Organ. Analy. 33, 538-557. doi: 10.1108/IJOA-09-2023-4002
Gupta, A., Chadha, A., Tiwari, V., Varma, A., and Pereira, V. (2023). Sustainable training practices: predicting job satisfaction and employee behavior using machine learning techniques. Asian Bus. Manag. 22, 1913–1936. doi: 10.1057/s41291-023-00234-5
Hanić, S., Bagić Babac, M., Gledec, G., and Horvat, M. (2024). Comparing machine learning models for sentiment analysis and rating prediction of vegan and vegetarian restaurant reviews. Computers 13:248. doi: 10.3390/computers13100248
Herzberg, F., Mausner, B., and Snyderman, B. (1959). The Motivation to Work. New York, NY: John Wiley & Sons.
Heydarian, M., Doyle, T. E., and Samavi, R. (2022). MLCM: multi-label confusion matrix. IEEE Access 10, 19083–19095. doi: 10.1109/ACCESS.2022.3151048
Holgado-Apaza, L. A., Carpio-Vargas, E. E., Calderon-Vilca, H. D., Maquera-Ramirez, J., Ulloa-Gallardo, N. J., Acosta-Navarrete, M. S., et al. (2023). Modeling job satisfaction of peruvian basic education teachers using machine learning techniques. Appl. Sci. 13:3945. doi: 10.3390/app13063945
Holgado-Apaza, L. A., Ulloa-Gallardo, N. J., Aragon-Navarrete, R. N., Riva-Ruiz, R., Odagawa-Aragon, N. K., Castellon-Apaza, D. D., et al. (2024). The exploration of predictors for peruvian teachers' life satisfaction through an ensemble of feature selection methods and machine learning. Sustainability 16:7532. doi: 10.3390/su16177532
Hoo, W. C., Arumanathan, S. R., Moosa, V., Ling, Z., and Prompanyo, M. (2024). Factors influencing job satisfaction in teaching online classes among academics in Malaysia. Pakistan J. Life Soc. Sci. 22, 1104–1125. doi: 10.57239/PJLSS-2024-22.2.0077
Horwood, M., Parker, P. D., Marsh, H. W., Guo, J., and Dicke, T. (2022). School autonomy policies lead to increases in principal autonomy and job satisfaction. Int. J. Educ. Res. 115:102048. doi: 10.1016/j.ijer.2022.102048
Htun, H. H., Biehl, M., and Petkov, N. (2023). Survey of feature selection and extraction techniques for stock market prediction. Finan. Innov. 9, 1–25. doi: 10.1186/s40854-022-00441-7
Hussain, M., Zhu, W., Zhang, W., Abidi, S. M. R., and Ali, S. (2019). Using machine learning to predict student difficulties from learning session data. Artif. Intell. Rev. 52, 381–407. doi: 10.1007/s10462-018-9620-8
Iqbal, S., Guohao, L., and Akhtar, S. (2017). Effects of job organizational culture, benefits, salary on job satisfaction ultimately affecting employee retention. Rev. Public Admin. Manag. 5, 1–7. doi: 10.4172/2315-7844.1000229
Jadhav, A., Pramod, D., and Ramanathan, K. (2019). Comparison of performance of data imputation methods for numeric dataset. Appl. Artif. Intell. 33, 913–933. doi: 10.1080/08839514.2019.1637138
Jiang, J., Zhang, X., and Yuan, Z. (2024). Feature selection for classification with Spearman's rank correlation coefficient-based self-information in divergence-based fuzzy rough sets. Expert Syst. Appl. 249:123633. doi: 10.1016/j.eswa.2024.123633
Kabathova, J., and Drlik, M. (2021). Towards predicting student's dropout in university courses using different machine learning techniques. Appl. Sci. 11:3130. doi: 10.3390/app11073130
Kaufman, J. H., Diliberti, M. K., and Hamilton, L. S. (2022). How principals' perceived resource needs and job demands are related to their dissatisfaction and intention to leave their schools during the COVID-19 pandemic. AERA Open 8:1234. doi: 10.1177/23328584221081234
Khan, A. E., Hasan, M. J., Anjum, H., Mohammed, N., and Momen, S. (2024). Predicting life satisfaction using machine learning and explainable AI. Heliyon 10:e31158. doi: 10.1016/j.heliyon.2024.e31158
Khan, M. A., Iqbal, S. A., Khan, M. S., and Hafez, M. G. (2023). Factor-bridging algorithm for the prediction of job satisfaction: developing country perspective. J. King Saud Univ. 35:101743. doi: 10.1016/j.jksuci.2023.101743
Kılınç, A. Ç, Polatcan, M., Turan, S., and Özdemir, N. (2024). Principal job satisfaction, distributed leadership, teacher-student relationships, and student achievement in Turkey: a multilevel mediated-effect model. Irish Educ. Stud. 43, 281–299. doi: 10.1080/03323315.2022.2061567
Kim, J., Chang, P. S., Yang, S. B., Choi, I., and Lee, B. (2024). A comparative analysis of job satisfaction prediction models using machine learning: a mixed-method approach. Data Technol. Applic. 59, 41-60. doi: 10.1108/DTA-10-2023-0697
Komorowski, M., Marshall, D. C., Salciccioli, J. D., and Crutain, Y. (2016). “Exploratory data analysis,” in Secondary Analysis of Electronic Health Records, 185–203. doi: 10.1007/978-3-319-43742-2_15
Kosaraju, N., Sankepally, S. R., and Mallikharjuna Rao, K. (2023). Categorical data: need, encoding, selection of encoding method and its emergence in machine learning models–a practical review study on heart disease prediction dataset using pearson correlation. Lecture Notes Netw. Syst. 551, 369–382. doi: 10.1007/978-981-19-6631-6_26
Leithwood, K., and Jantzi, D. (2008). Linking leadership to student learning: the contributions of leader efficacy. Sage J. 44, 496–528. doi: 10.1177/0013161X08321501
Li, J. H., Guo, S. X., Ma, R. L., He, J., Zhang, X. H., Rui, D. S., et al. (2024). Comparison of the effects of imputation methods for missing data in predictive modelling of cohort study datasets. BMC Med. Res. Methodol. 24, 1–9. doi: 10.1186/s12874-024-02173-x
Liu, Y., and Bellibas, M. S. (2018). School factors that are related to school principals' job satisfaction and organizational commitment. Int. J. Educ. Res. 90, 1–19. doi: 10.1016/j.ijer.2018.04.002
Locke, E. A. (1976). “The nature and causes of job satisfaction,” in Handbook of Industrial and Organizational Psychology, ed. M. D. Dunnette (Chicago, IL: Rand McNally), 1297–1349.
Maharana, K., Mondal, S., and Nemade, B. (2022). A review: data pre-processing and data augmentation techniques. Global Trans. Proc. 3, 91–99. doi: 10.1016/j.gltp.2022.04.020
McJames, N., Parnell, A., and O'Shea, A. (2023). Factors affecting teacher job satisfaction: a causal inference machine learning approach using data from TALIS 2018. Educ. Rev. 77, 381-405. doi: 10.1080/00131911.2023.2200594
Mduma, N. (2023). Data balancing techniques for predicting student dropout using machine learning. Data 8:49. doi: 10.3390/data8030049
Memon, S. M., Wamala, R., and Kabano, I. H. (2023). A comparison of imputation methods for categorical data. Inform. Med. Unlocked 42:101382. doi: 10.1016/j.imu.2023.101382
MINEDU (2022). Encuesta nacional a directores de instituciones educativas públicas de Educación Básica Regular ENDI remota 2021.
Mohtasham, F., Pourhoseingholi, M. A., Hashemi Nazari, S. S., Kavousi, K., and Zali, M. R. (2024). Comparative analysis of feature selection techniques for COVID-19 dataset. Sci. Rep. 14, 1–20. doi: 10.1038/s41598-024-69209-6
Monica and Agrawal P. (2024). “A survey on hyperparameter optimization of machine learning models,” in 2024 2nd International Conference on Disruptive Technologies, ICDT 2024, 11–15. doi: 10.1109/ICDT61202.2024.10489732
Moorman, R. H. (1993). The influence of cognitive and affective based job satisfaction measures on the relationship between satisfaction and organizational citizenship behavior. Hum. Relat. 46, 759–776. doi: 10.1177/001872679304600604
NCES (2024). National Teacher and Principal Survey - The 2023–24 National Teacher and Principal Survey (NTPS).
Nikhil, U. V., Pandiyan, A. M., Raja, S. P., and Stamenkovic, Z. (2024). Machine learning-based crop yield prediction in south india: performance analysis of various models. Computers 13:137. doi: 10.3390/computers13060137
Noroozi, Z., Orooji, A., and Erfannia, L. (2023). Analyzing the impact of feature selection methods on machine learning algorithms for heart disease prediction. Sci. Rep. 13, 1–15. doi: 10.1038/s41598-023-49962-w
Oqaidi, K., Aouhassi, S., and Mansouri, K. (2022). Towards a students' dropout prediction model in higher education institutions using machine learning algorithms. Int. J. Emer. Technol. Learn. 17, 103–117. doi: 10.3991/ijet.v17i18.25567
Pallathadka, H., Wenda, A., Ramirez-Asís, E., Asís-López, M., Flores-Albornoz, J., and Phasinam, K. (2023). Classification and prediction of student performance data using various machine learning algorithms. Mater. Today 80, 3782–3785. doi: 10.1016/j.matpr.2021.07.382
Park, H. S., and Yoo, S. J. (2021). Early dropout prediction in online learning of university using machine learning. JOIV 5, 347–353. doi: 10.30630/joiv.5.4.732
Pedregosa, F., Varoquaux, G., Gramfort, A., Michel, V., Thirion, B., Grisel, O., et al. (2011). Scikit-learn: machine learning in python. J. Mach. Learn. Res. 12, 2825–2830.
Pudjihartono, N., Fadason, T., Kempa-Liehr, A. W., and O'Sullivan, J. M. (2022). A review of feature selection methods for machine learning-based disease risk prediction. Front. Bioinform. 2:927312. doi: 10.3389/fbinf.2022.927312
Pujol-Cols, L. J., and Dabos, G. (2018). Satisfacción laboral: una revisión de la literatura acerca de sus principales determinantes. Estudios Geren. 34, 3–18. doi: 10.18046/j.estger.2018.146.2809
Rajendran, S., Chamundeswari, S., and Sinha, A. A. (2022). Predicting the academic performance of middle- and high-school students using machine learning algorithms. Soc. Sci. Human. Open 6:100357. doi: 10.1016/j.ssaho.2022.100357
Raufi, B., and Longo, L. (2024). Comparing ANOVA and powershap feature selection methods via shapley additive explanations of models of mental workload built with the theta and alpha EEG band ratios. BioMedInformatics 4, 853–876. doi: 10.3390/biomedinformatics4010048
Reid, D. B., and Creed, B. M. (2023). Visible at night: US school principal nontraditional work-hour activities and job satisfaction. Educ. Manag. Admin. Leader. 51, 1123–1140. doi: 10.1177/17411432211027645
Robinson, V. M., Lloyd, C. A., and Rowe, K. J. (2008). The impact of leadership on student outcomes: an analysis of the differential effects of leadership types. Sage J. 44, 635–674. doi: 10.1177/0013161X08321509
Saavedra, J., and Gutierrez, M. (2020). “Peru: a wholesale reform fueled by an obsession with learning and equity,” in Audacious Education Purposes: How Governments Transform the Goals of Education Systems, 153–180. doi: 10.1007/978-3-030-41882-3_6
Samuel, A. L. (1959). Some studies in machine learning using the game of checkers. IBM J. Res. Dev. 3, 210–229. doi: 10.1147/rd.33.0210
Shadbahr, T., Roberts, M., Stanczuk, J., Gilbey, J., Teare, P., Dittmer, S., et al. (2023). The impact of imputation quality on machine learning classifiers for datasets with missing values. Commun. Med. 3, 1–15. doi: 10.1038/s43856-023-00356-z
Talingting, R. E. (2019). A data mining-driven model for job satisfaction prediction of school administrators in DepEd Surigao del Norte division. Int. J. Adv. Trends Comput. Sci. Eng. 8, 556–560. doi: 10.30534/ijatcse/2019/34832019
Upadyaya, K., Toyama, H., and Salmela-Aro, K. (2021). School principals' stress profiles during COVID-19, demands, and resources. Front. Psychol. 12:731929. doi: 10.3389/fpsyg.2021.731929
Vergara, J. R., and Estévez, P. A. (2014). A review of feature selection methods based on mutual information. Neural Comput. Applic. 24, 175–186. doi: 10.1007/s00521-013-1368-0
Wang, F., Pollock, K., and Hauseman, C. (2018). School principals' job satisfaction: the effects of work intensification. Canadian J. Educ. Admin. Policy 185, 73–90.
Wang, X., and Wang, C. (2020). Time series data cleaning: a survey. IEEE Access 8, 1866–1881. doi: 10.1109/ACCESS.2019.2962152
Wu, J., Chen, X. Y., Zhang, H., Xiong, L. D., Lei, H., and Deng, S. H. (2019). Hyperparameter optimization for machine learning models based on bayesian optimization. J. Electr. Sci. Technol. 17, 26–40.
Xu, X., Wang, J., Peng, H., and Wu, R. (2019). Prediction of academic performance associated with internet usage behaviors using machine learning algorithms. Comput. Human Behav. 98, 166–173. doi: 10.1016/j.chb.2019.04.015
Yıldız, M., and Börekci, C. (2020). Predicting academic achievement with machine learning algorithms. J. Educ. Technol. Online Learn. 3, 372–392. doi: 10.31681/jetol.773206
Yoo, J. E., and Rho, M. (2020). Exploration of predictors for korean teacher job satisfaction via a machine learning technique, group MNET. Front. Psychol. 11:441. doi: 10.3389/fpsyg.2020.00441
Yuan, Q., Chen, K., Yu, Y., Le, N. Q. K., and Chua, M. C. H. (2023). Prediction of anticancer peptides based on an ensemble model of deep learning and machine learning using ordinal positional encoding. Brief. Bioinform. 24:bbac630. doi: 10.1093/bib/bbac630
Zhang, H., Zheng, G., Xu, J., and Yao, X. (2022). Research on the construction and realization of data pipeline in machine learning regression prediction. Mathem. Probl. Eng. 2022:7924335. doi: 10.1155/2022/7924335
Keywords: educational leadership, feature selection ensemble, job satisfaction, machine learning, Peruvian education, school principals
Citation: Holgado-Apaza LA, Isuiza-Perez DD, Ulloa-Gallardo NJ, Vilchez-Navarro Y, Aragon-Navarrete RN, Quispe Layme W, Quispe-Layme M, Castellon-Apaza DD, Choquejahua-Acero R and Prieto-Luna JC (2025) A machine learning approach to identifying key predictors of Peruvian school principals' job satisfaction. Front. Educ. 10:1580683. doi: 10.3389/feduc.2025.1580683
Received: 25 February 2025; Accepted: 17 April 2025;
Published: 09 May 2025.
Edited by:
Aloysius Sequeira, National Institute of Technology, Karnataka, IndiaReviewed by:
Jean-Baptiste M. B. Sanfo, University of Shiga Prefecture, JapanVadivel S. M., Vellore Institute of Technology (VIT), India
Copyright © 2025 Holgado-Apaza, Isuiza-Perez, Ulloa-Gallardo, Vilchez-Navarro, Aragon-Navarrete, Quispe Layme, Quispe-Layme, Castellon-Apaza, Choquejahua-Acero and Prieto-Luna. This is an open-access article distributed under the terms of the Creative Commons Attribution License (CC BY). The use, distribution or reproduction in other forums is permitted, provided the original author(s) and the copyright owner(s) are credited and that the original publication in this journal is cited, in accordance with accepted academic practice. No use, distribution or reproduction is permitted which does not comply with these terms.
*Correspondence: Luis Alberto Holgado-Apaza, bGhvbGdhZG9AdW5hbWFkLmVkdS5wZQ==