
- Institute of Animal Reproduction and Food Research of Polish Academy of Sciences, Olsztyn, Poland
Evidence that adult humans have functional brown adipose tissue has stirred interest in the possibility that the impressive effectiveness of induction of brown adipocytes to reduce obesity in mice may be translated to the human condition. A major focus recently on the identification of signaling and transcription factor that stimulate the induction of brown adipocytes has come from transgenic and gene KO models. However, these models have created a very complex picture of the regulatory mechanisms for brown fat induction. In this review insights into the critical regulatory pathways involved in brown adipocyte induction in the retroperitoneal fat depot of mice are described from quantitative trait locus (QTL) analysis of allelic variability determining Ucp1 levels and brown adipocyte induction in A/J vs. B6 mice. The key observation is that recombinant genotypes, found in recombinant inbred stains and backcross and intercross progeny, show transgressive variation for Ucp1 mRNA levels. These genetic crosses also show that the levels of Ucp1 mRNA are determined by interactions that control the levels of PPARα, PGC-1α, and type 2 deiodinase (DIO2) and that each factor is controlled by a subset of QTLs that also control Ucp1 expression. These results indicate that induction of Ucp1 in the retroperitoneal fat depot involves synergy between signaling and transcription factors that vary depending upon the environmental conditions. Inherent in this model is the idea that there is a high level of redundancy that can involve any factor with the potential to influence expression of the core factors, PPARα, PGC-1a, and DIO2.
Introduction
Approximately 20 transgenic/gene KO models have been described in the literature that increase the number of brown adipocytes in white fat depots and cause the transgenic mice to have increased resistance to diet-induced obesity (DIO;Kozak and Koza, 2010). Although the physiological basis for the resistance to obesity in many of these models is poorly described, the sheer numbers of transgenic models involved provide a compelling case for seriously considering a strategy to combat obesity in humans based upon an increase in brown adipocyte numbers. With the mouse genetic data and the rat pharmaceutical data as backdrops, new evidence that adult humans indeed have brown fat as discrete depots, detectable with PET imaging, has led to renewed efforts to identify mechanisms by which brown adipose tissue (BAT) can be induced in human tissues (Cypess et al., 2009; Van Marken Lichtenbelt et al., 2009; Virtanen et al., 2009). For this purpose it behooves us to review the information on BAT induction in the mouse to identify strategies that may be important for its induction in humans. This review will focus on insights that have come from the analysis of quantitative trait loci (QTL) that control variation in Ucp1 expression in the retroperitoneal white fat depot of A/J and C57BL/6J mice, in particular on the interaction of natural genetic variation with the environment in the control of Ucp1 and its utilization in reducing obesity. These genetic studies, together with what we know about the UCP1 function in the Ucp1−/− mice, indicate that simply reducing ambient temperature can significantly reduce adiposity in obese individuals.
Genetic Variation in Brown Adipose Tissue Induction: An Avenue to Reduced Obesity
It has long been known that the expression of BAT was highly variable among different species, reflecting their particular environmental, developmental, and physiological traits and requirements (Smith and Horwitz, 1969). What was not realized, until the past 10–15 years, was the rich genetic variation in BAT expression found within a species (Guerra et al., 1998), a variation that we have only begun to describe in mice and which will certainly be present in other species, including the human. Having described variation in BAT a longterm goal will be to determine the mechanism leading some animals to maximize this genetic trait of increased BAT that can be used to reduce fat stores. Current data indicate that some genetic constitutions make brown adipocyte induction in some individuals more responsive to the environment. Therefore, we need to determine when during development the capacity for modulation of BAT induction is maximal.
Interscapular Brown Adipose Tissue
In the mouse BAT first appears as a discrete tissue in the interscapular brown adipose tissue (iBAT) region at about 17 days of gestation (Houstek et al., 1988; Hirning et al., 1989; Giralt et al., 1990). Other discrete BAT depots are found on the top of the kidney in the axial region and in the thoracic cavity; however, when these discrete depots emerge developmentally in the mouse have not been reported to our knowledge (Cannon and Nedergaard, 2004). Following birth, iBAT continues to grow in size until about weaning by a mechanism that involves continued cell proliferation (Staszkiewicz et al., 2009). It has been reported that 65% of the nuclei of iBAT are labeled with BrdU in 10-day-old mice after injection with BrdU on days 3, 4, and 5. The size of iBAT at birth, its rate of growth postnatally and eventual size are identical between C57BL/6J and A/J mice (Xue et al., 2007), two strains which, as we will discuss below, show huge differences in brown adipocyte numbers in selective white fat depots and in their sensitivity to DIO.
Brown Adipocytes in White Fat Depots (wBAT)
The induction of brown adipocytes in white fat depots by exposing rats to the cold or treating them with the β3-adrenergic receptor agonist CL 316,243 has been described by several groups (Champigny et al., 1991; Himms-Hagen et al., 1994; Collins et al., 1997). However, the idea that inbred strains of mice vary in their induction of Ucp1 in the retroperitoneal fat depot and that this variable inductive response may account for the difference in DIO between A/J and C57BL/6J mice was first advanced by Surwit and coworkers (Collins et al., 1997). This idea suggested the exciting possibility that variant alleles for genes associated with Ucp1 expression and the brown adipocyte differentiation program are extant within the common inbred strains, thereby providing a genetic system to identify genes critical for the induction of brown adipocytes in white fat depots (Guerra et al., 1998). As we shall point out below, the genetic variation is restricted to the white fat depots and not observed in iBAT, a phenomenon that is largely recapitulated in the transgenic and gene KO models, that is, induction of brown adipocytes occurs in white fat depots of these transgenic models, but seldom in iBAT.
In the design of a QTL study to identify genes controlling brown fat induction, the selection of the fat depot becomes critical, because each fat depot has its own unique phenotype (Guerra et al., 1998). One is faced with the decision to select the white fat depot that one ascertains, with incomplete data, will be most amenable to analysis and most informative. First of all the iBAT in adult mice is not variable between A/J, B6, and 129/SvJ strains (Almind et al., 2007; Xue et al., 2007). However, large variations in levels of expression are found among tissues and each tissue varies independently among strains (Figure 1A). Among the visceral depots, gonadal fat shows large variation between strains, but the expression is low compared to that detected in the inguinal fat depot (Guerra et al., 1998). Mesenteric fat and retroperitoneal fat both have relatively high levels of expression and big differences between strains and they are therefore suitable for a QTL analysis. We selected the retroperitoneal fat for the QTL analysis because it is a fat depot also found in humans (the epididymal fat is not) and it is a well-defined tissue that can be more easily and rapidly excised from the mouse than mesenteric fat. Given these features of Ucp1 expression in different white fat depots, we cannot assume that the QTLs found associated with the control of Ucp1 mRNA levels in retroperitoneal fat are also controlling Ucp1 in other depots, especially the subcutaneous fat.
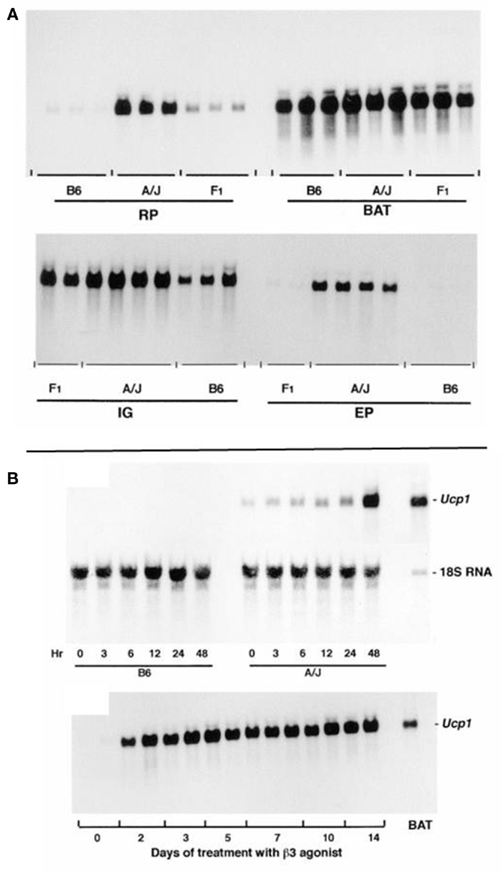
Figure 1. (A) The levels of Ucp1 mRNA in the retroperitoneal fat (RP), interscapular brown fat (BAT), inguinal fat (IG), and epididymal fat (EP) in total RNA isolated from A/J, B6, and (B6 × A/J) F1 mice are shown. Mice were treated with the β3-adrenergic agonist CL 316,243 for 7 days before isolation of RNA, at a time when induction of Ucp1 mRNA had reached a plateau. Ten microgram of RNA from BAT was analyzed and 15 μg from the other fat depots. (B) Northern blot analysis of total RNA. (Upper panel) The induction of Ucp1 mRNA in the retroperitoneal fat pad of B6 and A/J mice when placed in the cold at 5°C as indicated between 0 and 48 h. Total RNA was isolated from tissues pooled from three mice. Fifteen microgram of RNA was analyzed. (Lower panel) The induction of Ucp1 mRNA in the retroperitoneal fat pad after injection of the β3-adrenergic agonist, CL 316,243, once a day in the late afternoon at a dose of 1 mg/kg body wt. RNA (15 μg) from two mice was analyzed individually. A standard of 2.7 μg of interscapular brown fat RNA was included on the gel.
The time course for induction is similar for cold exposure and β3-adrenergic agonist treatment in RP fat with increases in Ucp1 mRNA evident by 3 h and stable maximal levels occurring in 48 h (Figure 1B). It is noteworthy that in A/J mice some Ucp1 mRNA can be detected at room temperature and induction following exposure to the cold occurs within 3 h.
Allelic Variation and Recombinant Inbred Strains of Mice
The phenotypes of obesity and thermogenesis affected by β-AR agonists and ambient temperature in A/J and B6 mice are complex. They involve up-regulation of Ucp1 and other molecular components of thermogenesis in existing brown adipocytes in the iBAT depot and de novo induction of new differentiated brown adipocyte populations in white adipose tissue; both of which are controlled in part by the sympathetic nervous system (Bartness and Bamshad, 1998). In addition, the phenotypes depend on variation in susceptibility to obesity at 23°C that exist between A/J and B6 mice and are likely to be independent of BAT thermogenesis (Seldin et al., 1994; Guerra et al., 1998). To unravel the genetic and molecular complexity of brown adipocyte induction in white fat depots and determine its role in energy balance and obesity we utilized two genetic tools; the A × B recombinant inbred (RI) strains and progeny from backcross and intercross matings between A/J and B6 mice and the RI strains (Koza et al., 2000). The A × B RI lines were formed by crossing A/J and B6 mice and intercrossing the resulting F1 progeny to establish an F2 population that were then brother–sister mated for a minimum of 20 generations to establish inbred lines (Bailey, 1971; Taylor, 1981). If a genetic trait is complex, that is, it is controlled by allelic variation at more than one gene, then alleles from each gene associated with the trait in the A/J and B6 parental strain will be fixed in new combinations in the different RI lines. Thus, each RI line with these novel recombinant chromosome patterns will provide potentially unlimited numbers of mice to establish the phenotypes determined by each gene or combinations of genes not present in the original parental lines. As shown in Figure 2, the levels of Ucp1 mRNA in the retroperitoneal fat depot of the parent A/J mice exposed to a 4°C ambient temperature for 1 week were 40 times higher than that found in B6 mice (Guerra et al., 1998); however, the novel recombination of alleles in the RI lines generated a continuum of lines of mice with levels of Ucp1 that at the lower extreme in A × B10 mice were slightly less than those observed in B6 mice and at the other extreme in A × B8 mice they were 2.5 times higher than that occurring in A/J mice (Figure 2A). The number of brown adipocytes in retroperitoneal fat of A × B8 mice approaches that detected in iBAT of B6 mice; however, despite having levels of Ucp1 mRNA similar to A × B8, A × B15 retroperitoneal fat has fewer brown adipocytes that can be detected with UCP1 immunohistology (Figure 2B). In addition to providing large numbers of mice with recombinant genotypes to establish phenotypes, comparisons of the strain distribution patterns of the levels of mRNA to the distribution of variant alleles of structural genes with allelic variation provided the first clues that several genes were involved in controlling induction of Ucp1 in white fat depots and preliminary assignment of the genes to specific chromosomes (Koza et al., 2000). The chromosomal linkage analysis of genes controlling Ucp1 induction will be discussed later with the QTL analysis of brown fat induction in intercross and backcross progeny.
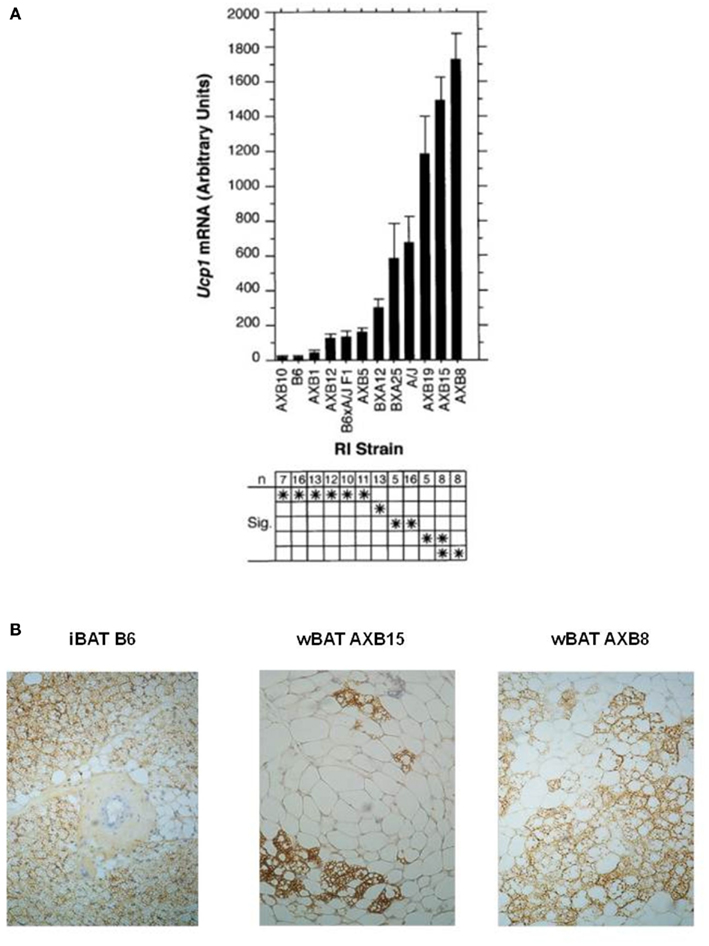
Figure 2. (A) Bar graph shows Ucp1 mRNA levels in the retroperitoneal fat pad from parental A/J, B6, F1 hybrid, and RI strains of mice derived from the parental mice. Mice were housed at 5°C in groups of two to three mice per pen for 7 days before the isolation of RNA. Induction in the cold is similar to that caused by a β3-adrenergic agonist. Data are presented as the mean ± SE. The number of animals (n) of each strain and the results of statistical analyses by ANOVA (Fisher’s PLSD test in Statview 4.1) are given in the lower chart. Strains sharing asterisks in a row are not significantly different from each other at P = 0.05. (B) UCP1 immunohistology of paraffin-embedded sections from interscapular brown fat (iBAT) and retroperitoneal fat (wBAT) from A × B8 and A × B15 mice demonstrates the organization of brown adipocytes into clusters that resemble fields of densely packed brown adipocytes characteristic of iBAT. The size of these regions in wBAT may be quite variable, depending upon the strength of the induction.
Genetic Variability in the Induction of Brown Fat and the Obese Phenotype
Two questions essential to the relationships between constitutive expression of iBAT and inducible levels of wBAT and susceptibility to DIO can be addressed with the RI lines. The first question is whether the potential for induction of brown adipocytes in white fat determines the development of obesity in the absence of adrenergic stimulation by cold exposure or β3-AR agonist treatment. In other words, does the constitutive level of Ucp1 mRNA, which in mice comes from the Ucp1 expressed in the discrete iBAT depots and does not show strain variation (Coulter et al., 2003; Almind et al., 2007; Xue et al., 2007), affect the development of obesity. Conceivably this might occur if a cafeteria-like diet directly induced thermogenesis through activation of iBAT Ucp1 as proposed by Rothwell and Stock (1979). Accordingly, parental A/J, B6, and six RI lines with variable levels of Ucp1 mRNA inducible in white fat were fed a high fat/high sucrose obesogenic diet for 18 weeks at an ambient temperature of 23°C to establish an obese state for each line (Figure 3A). Weight gain averaged from 11 g in A/J mice to 26 g in B6 mice as previously observed (Collins et al., 1997); however, A × B8 mice, which had the highest capacity to induce Ucp1 mRNA in white fat depots upon adrenergic stimulation, gained 24 g of fat, which was not significantly different than that observed for B6 mice, which had the lowest level of Ucp1 expression (Figure 3A; Guerra et al., 1998). This result indicates that in mice fed a high fat diet at 23°C, the capacity for induction of Ucp1/BAT by cold exposure in white fat had no impact on the development of DIO at normal ambient temperatures (23°C). One could argue that despite similarities in the levels of Ucp1 mRNA or protein in the iBAT of A/J and B6 mice, some unknown form of sympathetically mediated activation of iBAT-dependent diet-induced thermogenesis exists among A/J mice at 23°C to reduce DIO. However, the suppression of increased DIO in B6 Ucp1 KO mice, with no capacity for UCP1-dependent thermogenesis by a brown adipocyte, indicates that diet-induced thermogenesis by brown fat is not a factor that increases susceptibility to DIO at 23°C (Kozak, 2010).
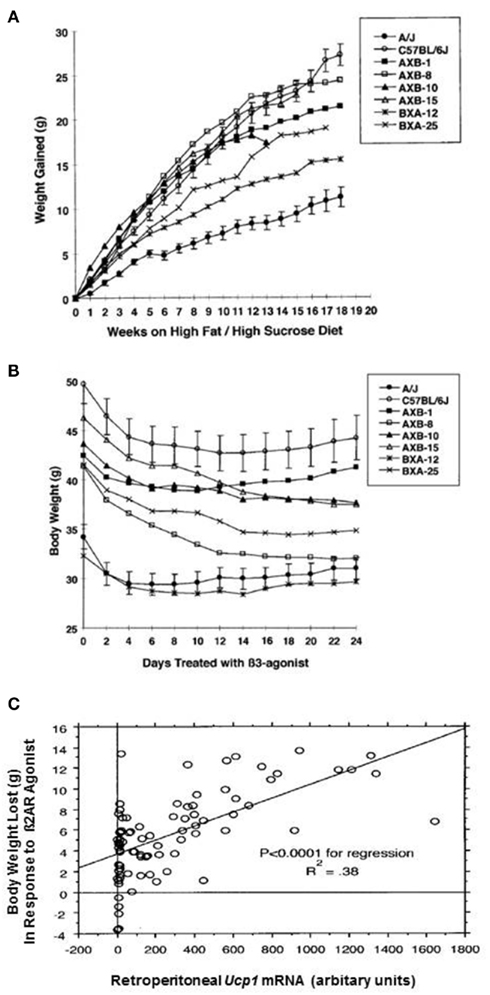
Figure 3. (A) Body weight gained by parental and RI strains fed a high fat/high sucrose diet (Research Diets 12331) starting at 7 week of age and continuing for 18 week. (B) After 18 week, mice continued to be fed the high fat/high sucrose diet and were also treated with the β3-adrenergic agonist, CL 316,243, as described (Guerra et al., 1998). Changes in body weight are shown. The mean ± SE for the B6 and A/J parental strains are shown, whereas only the means have been plotted for the RI stains. The number of mice in each group ranges from 9 to 12. (C) Regression analysis to evaluate the effects of Ucp1 mRNA in the retroperitoneal fat on body weight loss. P is an estimator of the significance of the regression. R2 is the coefficient of determination; it is the proportion of the dependent variable that is explained by the independent variable. N was 86.
The second question, whether variation in the induction of Ucp1 by adrenergic signaling has an impact on the obese state, was addressed in the second part of the experiment. Using the same eight lines of mice with variable levels of obesity, described in Figure 3A, were treated with the β3-AR agonist, CL 316,243, for 24 days while continuing to be fed the high fat diet (Figure 3B). All mice lost body weight, however, the amount of body weight lost depended upon the levels of Ucp1 mRNA that were induced in the white fat depots (Figures 3B,C; Guerra et al., 1998), that is, mice with higher levels of adrenergically induced Ucp1 mRNA in retroperitoneal fat lost more body weight. Thus, genetically determined variability in the induction of brown adipocytes in white fat depots by adrenergic stimulation is a significant factor in reducing obesity in response to adrenergic stimulation by exposure to cold or drugs. Accordingly, pharmaceuticals that are able to induce the number of brown adipocytes in discrete BAT depots or white fat depots could be an effective anti-obesity strategy.
Chromosomal Mapping of Genes Controlling BAT Induction by QTL Analysis
Given that there is probably no anti-obesity strategy in mice and rats that is as effective as the induction of brown adipocytes in white fat depots, identifying genes that could enhance the induction of brown adipocytes is an important goal. The analysis of the RI strains provided evidence that the induction of brown adipocytes in white fat upon adrenergic stimulation involved multiple genes; however, neither the number of genes nor their chromosomal location were able to be determined from analysis of strain distribution patterns alone (Koza et al., 2000). To identify the genes controlling brown adipocyte induction, we pursued a QTL analysis in which the primary phenotype was Ucp1 mRNA levels in retroperitoneal fat depots after 7 days at 5°C, initially measured by semi-quantitative Northern blots (Guerra et al., 1998) and later by quantitative RT-PCR with TaqMan probes using the ABI sequence detection system (Koza et al., 2000). Since there was a strong correlation between inducible Ucp1 mRNA and the content of brown adipocytes determined by immunostaining for UCP1 in the tissues of mice exposed to the cold (Guerra et al., 1998), the Ucp1 mRNA sub-phenotype is a reliable surrogate for brown adipocyte induction. The conversion of a white fat depot devoid of brown adipocytes to one rich in brown adipocytes requires the activation of brown fat specific adipogenesis, mitochondrial biogenesis, and increased innervation and vascularization (Cannon and Nedergaard, 2004). However, the most specific molecular marker change is the activation of Ucp1. Mice with an inactivated Ucp1 gene cannot tolerate an acute exposure to the cold because they have lost an important mechanism for thermogenesis (Enerback et al., 1997). Since the Ucp1 expression phenotype is near the end of a complex pathway from cold receptors on the surface of the skin to the processing of signals in the central nervous system that activate signaling and transcription factors in the adipocyte capable of being converted to a brown adipocyte, variable activity of any gene involved at any step of this complex process can be revealed by QTL analysis, if its effects on the levels of Ucp1 mRNA are sufficiently robust and precise. Indeed the expression for several genes [PPARα, type 2 deiodinase (DIO2), and PGC-1α] implicated in Ucp1 expression are highly variable in white fat of cold exposed mice and show highly significant correlations with Ucp1 expression (Coulter et al., 2003; Xue et al., 2005).
Based upon evidence that multilocular brown adipocytes in white fat depots were not labeled with BrdU in rats treated with the β3-AR agonist CL 316,243 (Himms-Hagen et al., 2000), we assumed that cell proliferation of a progenitor brown adipocyte does not occur in white fat depots of adult mice, unlike the cell proliferation that occurs in interscapular BAT during chronic cold exposure (Bukowiecki et al., 1982). Therefore, genes controlling the proliferation of adipocyte progenitors in white fat are assumed not to be involved in the induction of brown adipocytes in white fat during the first 7 days of adrenergic stimulation. Whether cell proliferation occurs following long term cold exposure is another question. This assumption is supported by the evidence on gene expression which showed that maximal levels of Pgc-1α mRNA are reached within 1 day of adrenergic stimulation and significant levels of Ucp1 mRNA can be detected in A/J mice within 3 h of being exposed to the cold (Coulter et al., 2003). Furthermore, changes in adipocyte morphology showing the emergence of a multilocular adipocyte from a unilocular adipocyte are consistent with the hypothesis that mature unilocular white adipocytes are directly converted to multilocular brown adipocytes (Cinti, 2002). If in fact brown adipocytes arise from mature white adipocytes, then it suggests that the brown adipocyte differentiation program is established during a window of postnatal adipose tissue development between 10 and 21 days of age when brown adipocytes transiently appear and then disappear (Xue et al., 2007). We postulate that since not all adipocytes look like brown adipocytes, this differentiation process has been implemented in selected adipocytes, which resemble mature white adipocytes under certain conditions, at weaning and in adults following adrenergic stimulation by a mechanism that rapidly initiates mitochondrial biogenesis and Ucp1 expression. Such a mechanism may not even involve further epigenetic modification of chromatin structure, but merely involve activation of PKA signaling and other mechanisms controlling cAMP levels. Viewed from this perspective the search for candidate genes controlling the induction of brown adipocytes becomes focused on genetic mechanisms determining the sub-population of white adipocytes in a white fat depot with a chromatin structure unique for brown adipocytes. The brown adipocytes in traditional white fat depots may be masquerading as white adipocytes until they are adrenergically stimulated. A research goal will be to identify the molecular basis of their chromatin structure that enables a rapid transcription of brown adipocyte specific genes. A component of such a mechanism could be RIP140 (Leonardsson et al., 2004; Christian et al., 2005).
The Backcross Model
The molecular analysis of Ucp1 regulation has not revealed any brown fat specific signaling or transcription molecules; however, a regulatory model in which brown fat specific expression is determined by a modular molecular mechanism is consistent with existing data (Hansen and Kristiansen, 2006; Kajimura et al., 2008). If an interactive molecular mechanism controls brown adipocyte induction in white fat, perhaps the interactive transgressive mechanism revealed by the analysis of RI lines and backcross and intercross progeny may be the manifestation of such a mechanism at the gene level.
Two cohorts of approximately 400 (A/J × B6) F1 backcross mice were generated to test the idea that the known transcription factors of Ucp1 were associated with Ucp1 induction phenotypes following 7 days in the cold. Mice in cohort 1 were fed a standard low fat chow (11.9 kcal% fat) diet from weaning to 8 weeks of age when the mice were exposed to cold at 5°C for 7 days. Mice in cohort 2 were fed a high fat diet containing 58 kcal% fat (Research Diets 12331) from weaning until the end of the cold exposure (mice were subjected to cold exposure at 5°C for 7 days at 8 weeks of age). The rationale behind conducting a QTL analysis of mice fed a high fat diet was to assess whether the genes controlling induction of Ucp1 were influenced by a cafeteria-like diet, thereby protecting the animal against DIO through increased thermogenesis (Rothwell and Stock, 1979; Cannon and Nedergaard, 2004).
Prior to analysis of gene expression in the backcross mice we assessed the variation in expression of genes implicated in Ucp1 transcription between A/J and B6 mice exposed to the cold for 7 days. Differences in expression between the mouse strains were too small for analysis in backcross mice (less than twofold) for the following genes: Pref1, Nfe2l2, SREBP-1c, PPARγ, PPARγ2, CEBP-α, CEBP-β, CEBP-δ, FoxC2, and β3-adrenergic receptor. Robust differences between B6 and A/J were found for PPARα, and Dio2 and modest variation for PGC-1α. In addition, the high fat diet showed variable increases in the expression of these latter genes (Table 1). The highly significant correlations were found between Ucp1 and Pgc-1α, Pparα and Dio2 (Coulter et al., 2003; Xue et al., 2005). In mice fed a low fat chow diet approximately 55% of the variance in Ucp1 levels is associated with the variance in Pgc-1α, but less (16%) in mice fed the high fat diet (Figure 4). Similar relationships were found between Ucp1 and Pparα and Dio2 (Xue et al., 2005). In addition, similar to the transgressive variation found for Ucp1 in the RI strains, novel allelic recombinations in the backcross progeny generated transgressive phenotypes for each of these genes critical to wBAT induction. The significance of this transgressive variation is that perturbations in the expression levels of these transcription factors through allelic variation underlying the QTLs, together with environmental factors, like diet and ambient temperature, will affect the induction of Ucp1 and wBAT. That a large number of transgenes and gene KOs affect wBAT induction through effects on PPARα, PGC-1α, and DIO2 becomes predictable.
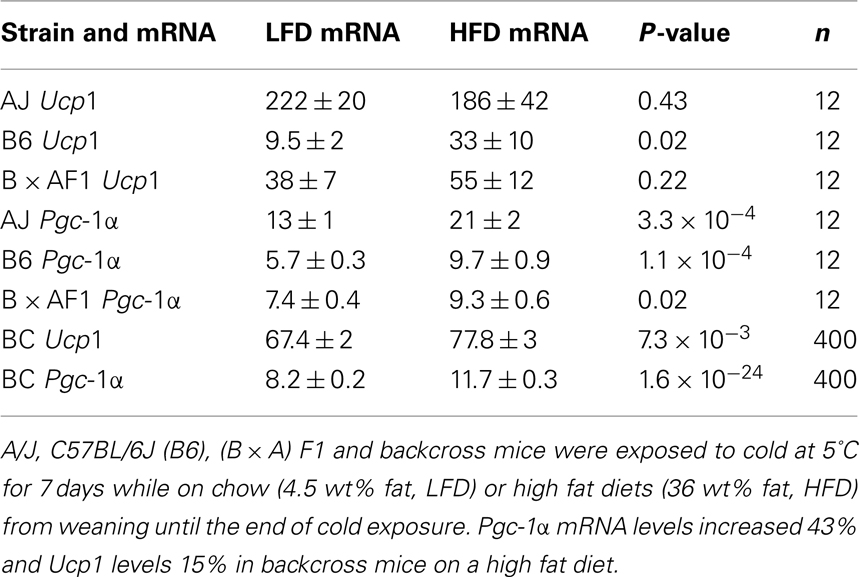
Table 1. Effects of a high fat diet on Pgc-1α and Ucp1 mRNA levels.
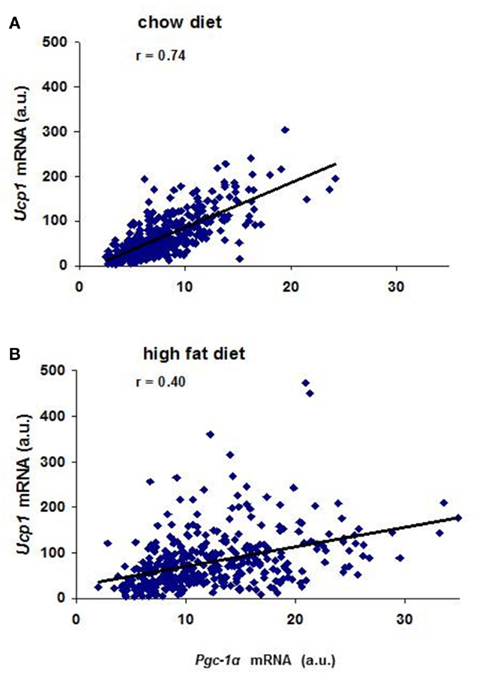
Figure 4. (A) Correlation between Pgc-1α and Ucp1 mRNA levels in mice fed a 4.5 wt% fat diet. Approximately 400 (B6 × A/J) F1 × A/J backcross males 8 weeks of age were exposed to 5°C for 7 days. (B) Correlation between Pgc-1α and Ucp1 mRNA levels in mice fed a 58-kcal% fat diet. Pgc-1α and Ucp1 mRNA levels were determined in 400 backcross animals maintained on a high fat diet from weaning to 8 weeks of age and then exposed to the cold for 7 days.
Using MIT markers chromosomal regions associated with levels of Ucp1, Pparα, Pgc-1α, and Dio2 mRNA in backcross progeny were mapped. The chromosomal linkage studies showed that QTLs on Chromosomes 2, 3, 8, and 19, which are associated with induction of Ucp1, were also associated, in part, with induction of Pparα, Pgc-1α, and Dio2. Furthermore, significant differences were observed for the core QTLs, defined as those controlling Ucp1 expression (Figure 5). In mice fed a high fat diet, Chromosomes 2, 3, 8, and 19 were associated with levels of Ucp1 and Pparα mRNA; however, unlike Ucp1 expression, not all QTLs were involved with the Pparα, Pgc-1α, and Dio2. These associations are shown in Figure 5, for backcross mice fed both the low and high fat diets. The complexity of QTLs is greater for mice fed the chow diet than the high fat diet. The identities of the genes in the QTLs which determine the expression phenotypes are not proven, though plausible candidates exist. The fact that the peak of the QTL on Chromosome 8 is very close to Ucp1 provides a candidate to account for variation in Ucp1 mRNA levels, but it would require a mechanism by which Ucp1 also regulates PPARα. Other genes under the peak of the Chromosome 8 QTL appear to be better candidates at this time. The QTL on Chromosome 15 lies close to the location of Pparα. Confirmation that Pparα was a one of the variant alleles could not be confirmed with the Pparα KO mouse (Xue et al., 2005). These linkage associations of Ucp1 and these transcription factors are consistent with transgressive variation and the synergy associated with Ucp1 induction. A change in the fat and carbohydrate content can change the levels of the transcription factors to select an alternative signaling and transcription factor for wBAT induction. A practical outcome of such a mechanism is that it enhances the range of drug targets for induction of wBAT.
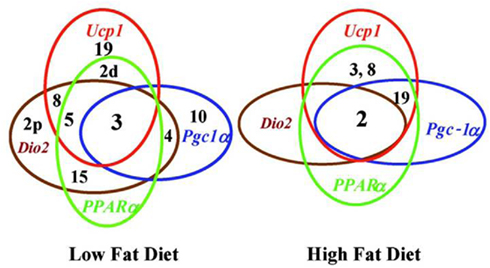
Figure 5. Venn diagrams for chromosomes and gene expression illustrate the overlap of selective chromosomes in regulating genes associated with the regulatory network controlling Ucp1 function. Diagram also underscores the profound effects of diet on genes associated with regulatory networks of Ucp1 expression. Numbers refer to chromosomes carrying QTLs and those enclosed within a circle indicate those QTL associated with regulation of the indicated gene.
Transgressive Variation: A Manifestation of Synergistic Interactions between QTLs and Transcription Factors and Signaling Molecules that Control Ucp1 Expression
Synergy in the expression of Ucp1 has been observed at two different levels, first at the level of interacting genes and second at the level of transcription and signaling factors implicated in Ucp1 expression. The strain distribution of Ucp1 mRNA levels in RP fat of cold exposed A × B and B × A RI mice provided clear evidence for the existence of transgressive variation for Ucp1 expression, that is, the production of offspring with phenotypes that exceed the parental extremes (Figure 2; Guerra et al., 1998; Koza et al., 2000). The novel combinations of alleles at several loci contributing to Ucp1 expression in RI strains result in higher levels than that which occurs in the A/J strain. The gene interactions determining transgressive variation have been observed in global studies of gene expression in mice and yeast but rarely analyzed for specific genes (Brem and Kruglyak, 2005; Shockley and Churchill, 2006).The first QTL analysis of the (B6 × A/J) F1 × A/J backcross mice identified Chromosomes 2, 3, 8, and 19 to be associated with Ucp1 expression and similar to the RI line data, the levels of Ucp1 in the backcross progeny had a range of expression that also showed transgressive variation, that is, they exceeded the levels of Ucp1 expression found in the A/J mice, approaching those found in A × B8 mice (Koza et al., 2000; Coulter et al., 2003). Positive effects on Ucp1 mRNA levels are associated with an A/J allele at the peak QTL on Chromosomes 2, 3, and 8, whereas the B6 allele on the QTL for Chromosome 19 was associated with elevated Ucp1. Accordingly, transgressive variation is based in part upon the interaction of a variant gene encoded by the B6 allele on Chromosome 19 with a variant gene on Chromosomes 2, 3, and/or 8 encoded by an A/J allele. Sixteen sets of mice with allelic assignments possible at Chromosomes 2, 3, 8, and 19 are rank ordered with respect to Ucp1 mRNA levels (Table 2). As predicted from the strain distribution pattern of the RI lines, A × B8, and seven other strains with levels that exceed A/J mice have A/J alleles at QTLs on Chromosomes 2, 3, and 8, but a B6 allele on Chromosome 19. This interpretation was further tested with an intercross of two RI lines, A × B8 and A × B10 that would assess the association of A/J and B6 alleles at the QTLs on Chromosomes 8 and 19. As shown in Figure 6A strong synergistic interactions elevate Ucp1 expression in mice homozygous for the A/J allele at D8Mit45 and homozygous for the B6 allele on Chromosome 19 near D19Mit86 (∼20 cM). Thus, an A/J allele at D19Mit86 shows dominance in suppressing the effects of an A/J allele near D8Mit45 at 40.5 cM (Figure 6B). The Chromosome 8 QTL affecting Ucp1 mRNA production is near the Ucp1 gene itself at 37.7 cM. It is possible that Ucp1 itself is structurally variable between A/J and B6 mice and that it directly interacts by a trans-mechanism with a gene located near D19Mit86. In our efforts to identity the QTLs, congenic lines were generated for QTLs on Chromosomes 8 and 19; however, lines carrying a single QTL failed to show differences in Ucp1 expression (L. P. Kozak, unpublished results).
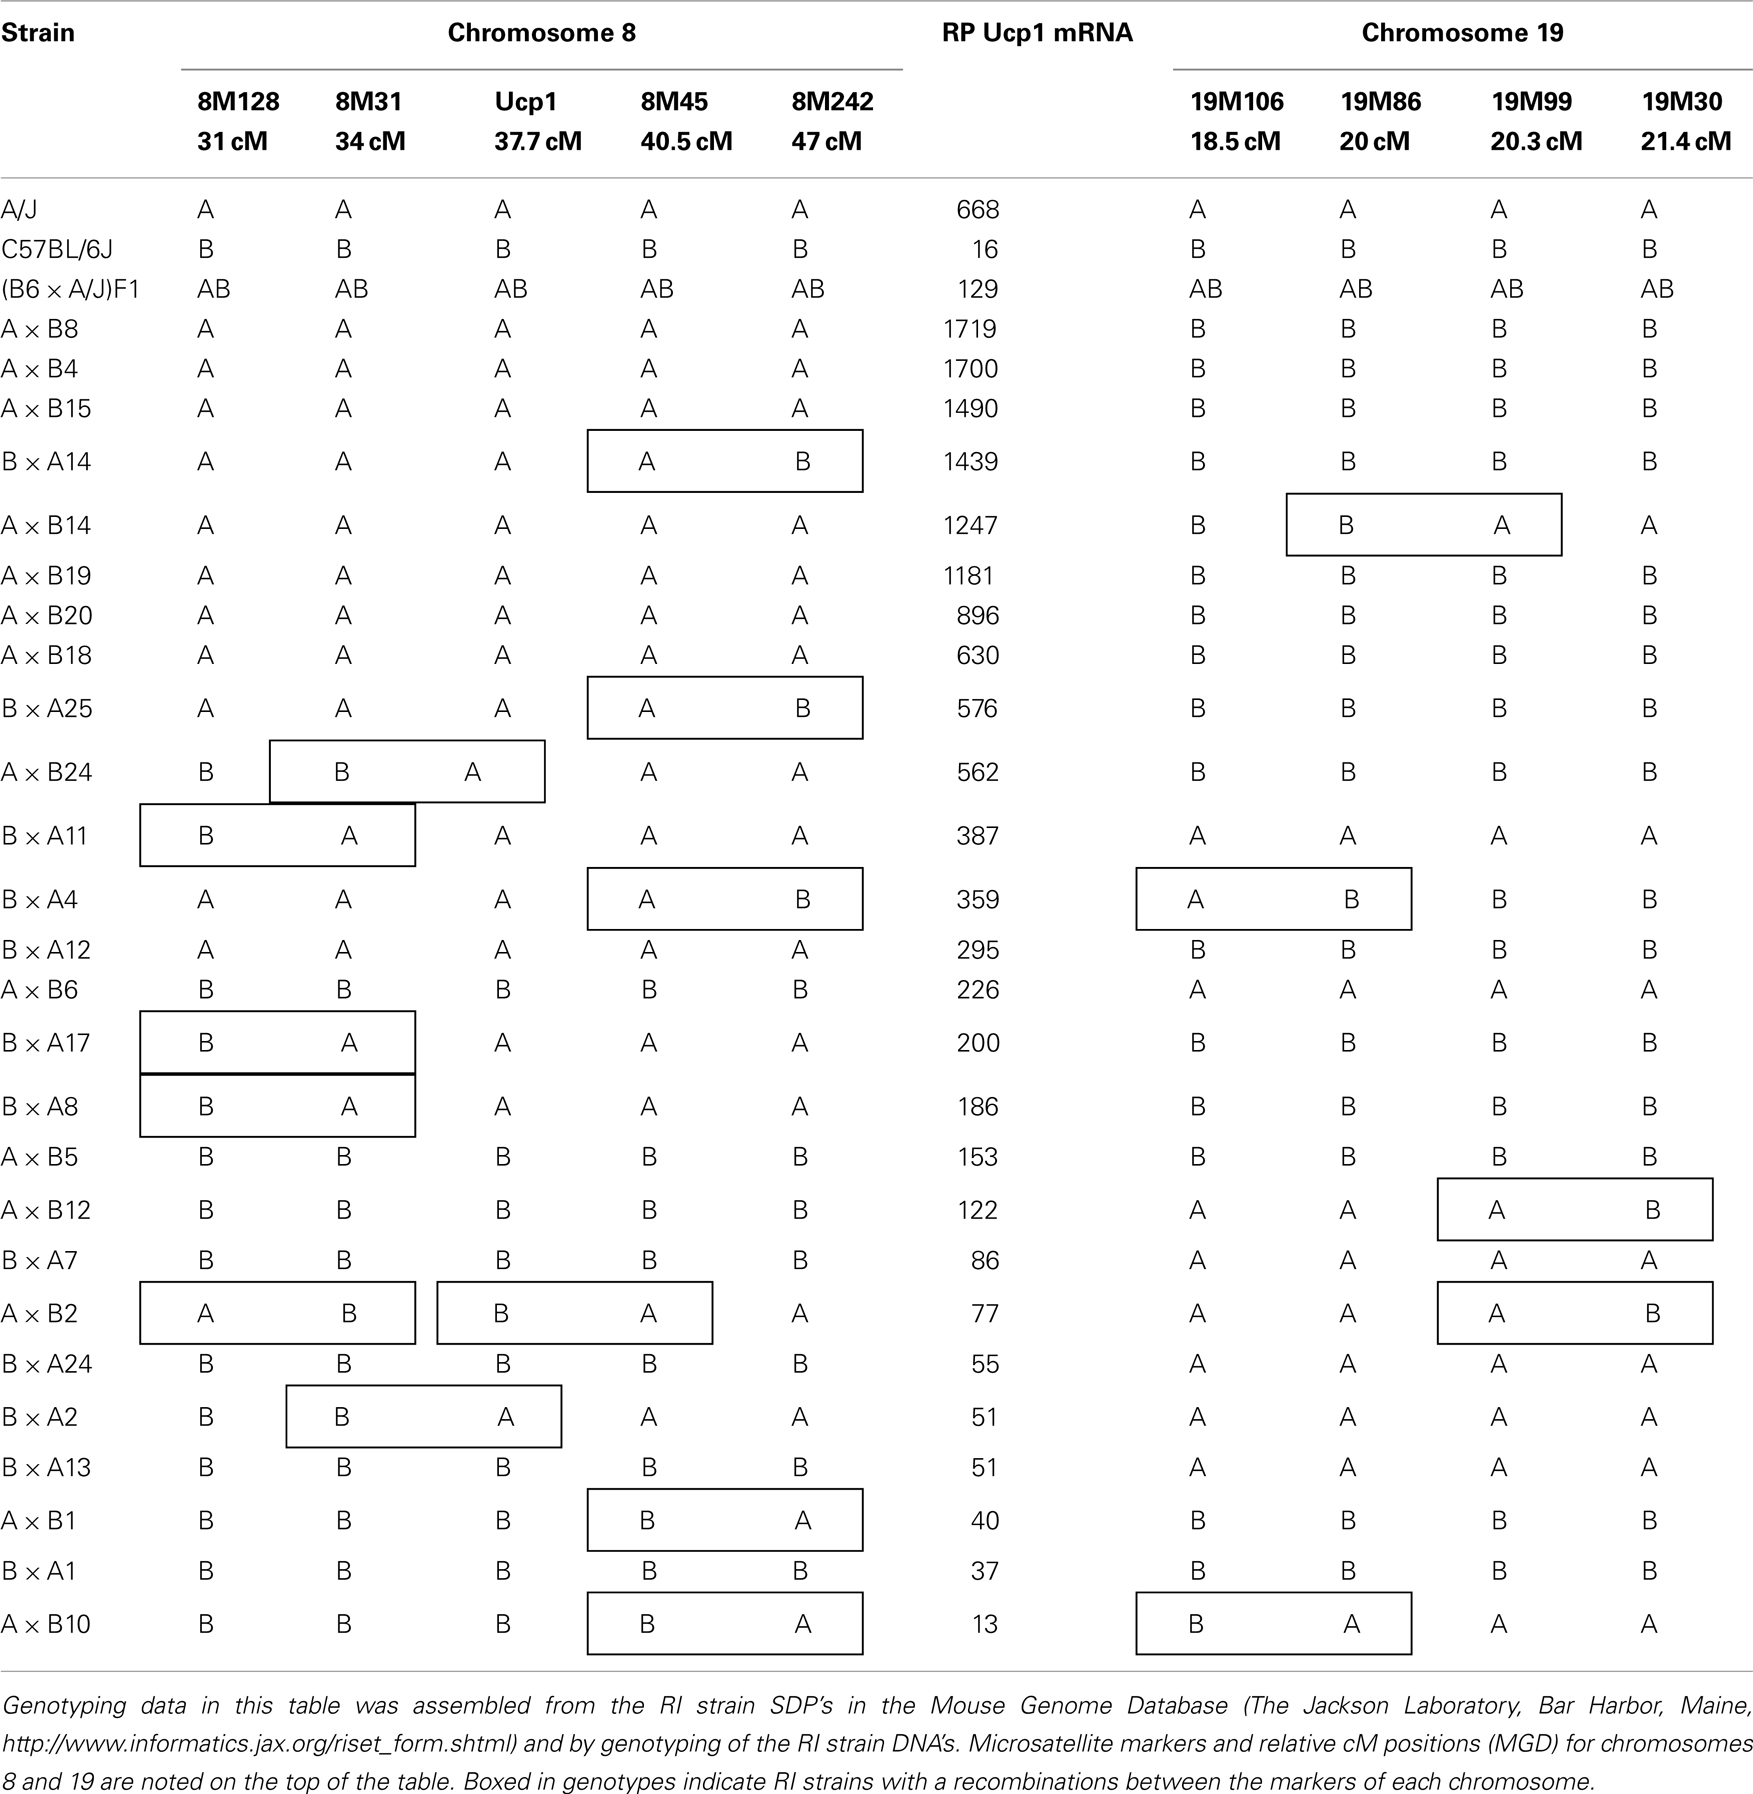
Table 2. Strain distribution pattern in RI lines in relationship to Ucp1 mRNA levels.
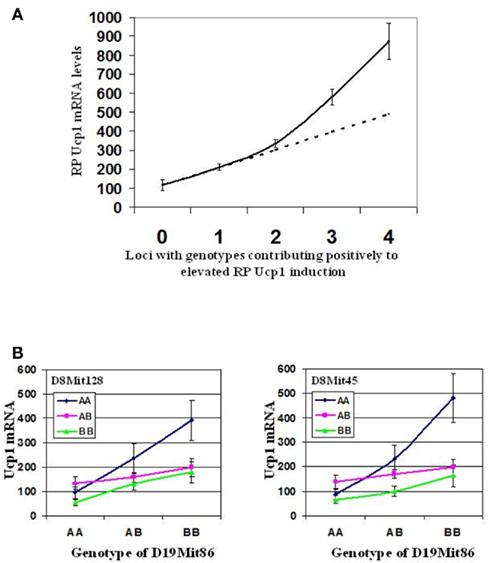
Figure 6. (A) Synergistic effect of Iba QTLs on retroperitoneal Ucp1 mRNA induction. This is a graphic representation demonstrating the complex epistatic and additive interactions between the four Iba loci. The solid line represents the experimental retroperitoneal fat (RP) Ucp1 mRNA induction levels in relationship to the number of positive contributing loci. The dashed line indicates the theoretical value if interactions between Iba loci were only additive. (B) Effect of interactions between loci near Ucp1 (D8Mit45, 40.5 cM; D8Mit128, 31 cM), and D19Mit86 (20 cM) on retroperitoneal fat Ucp1 mRNA induction in 286 intercross progeny from A × B10 and A × B8. Line interaction plots demonstrate a strong epistatic interaction between loci on chromosomes 8 and 19. This interaction appears to be stronger for D8Mit45, a locus nearer to Ucp1 than for D8Mit128, the major QTL defined in the (A/J × B6) F1 × A/J backcross. Interaction plot data was generated using Statview v.4.5.
We have shown how trans-acting genes on known chromosomes in a very specific QTL system controlling Ucp1 expression are giving rise to transgressive expression at the molecular level. Previously it was shown that the occurrence of spontaneous ovarian teratomas in RI strains was greater than that observed to occur between progenitor strains (Eppig et al., 1996). A genetic analysis of morphological traits of yeast has revealed a complex QTL system with transgressive variation which has been correlated with gene expression analysis to produced results similar to the regulation of Ucp1 and brown fat induction (Nogami et al., 2007). Others have conducted a methodological global gene expression analysis of liver and kidney with chromosome substitution strains between A/J and B6 mice to assess allelic effects on gene expression and found that allelic variation at several chromosomes affect expression of 4209 transcripts (Shockley and Churchill, 2006). Many of the transcripts had levels of expression that exceeded those found in the parental strains, suggestive of transgressive variation (Shockley and Churchill, 2006).
Evidence from backcross and intercross analyses indicated that interactions between a B6 allele on Chromosome 19 with an A/J allele on Chromosome 8 and possibly Chromosome 3 synergize to maximize expression of Ucp1. Since we also showed that these QTLs also determined variation in the levels of PPARα, PGC-1α, and Dio2 (Xue et al., 2005), we speculate that these transcription factors and signaling molecules, as well as others, interact synergistically to maximize the expression of Ucp1. An overview of the signaling and transcription pathways controlling Ucp1 expression is presented in Figure 7. Below each of the factors is a number that indicates the ratio of expression for that factor between A/J and B6 mice. It is apparent that all increases in expression are found for factors that lie downstream of PKA. There were no differences in expression for PKA or other factors that are upstream of PKA. Therefore, while retinoblastoma (Rb) and Foxc2 have been implicated in the induction of brown adipocytes in transgenic mice and cell cultures (Cederberg et al., 2001; Hansen et al., 2004), variations in their expression are not associated in determining the differences in the induction of Ucp1 in A/J and B6 mice. However, the key feature of this system for the control of Ucp1 is that while many regulatory components, known to have essential roles in Ucp1 expression, have elevated expression in A/J mice, relative to Ucp1 the differences in expression are very modest. For example, there is a four to fivefold difference in expression of the master regulator PGC-1α and other transcription factors between A/J and B6 mice, whereas Ucp1 is expressed 80-fold greater in A/J than B6 mice. The regulation of Ucp1 is determined by distinct sites for CREB, ATF2, PPARγ/PPARα, LXRα, TR, and interactions by several of the transcription factors with the co-activator PGC-1α (Cassard-Doulcier et al., 1993; Kozak et al., 1994; Sears et al., 1996; Puigserver et al., 1998; Hansen and Kristiansen, 2006; Kajimura et al., 2010). PGC-1α has been shown to be involved in the transcription of Ucp1 and additional aspects of mitochondrial biogenesis as co-activator with PPARγ/RXRα and TRβ in cell culture models (Puigserver et al., 1998). Similarly, mice with a targeted mutation for PPARα have no suppression of Ucp1 expression in liver or retroperitoneal fat (Kersten et al., 1999; Xue et al., 2005). Therefore, transcription factors with well-documented functions in Ucp1 transcription in vitro often turn out to be non-essential for its expression when inactivated by gene targeting in vivo (Kozak and Koza, 2010). This suggests that many of the sites for transcription of Ucp1 are in fact redundant and this redundancy involves not only the DNA regulatory motif; but, extends to the factors themselves. The redundancy facilitates the synergy by which many factors can participate in the determination of the expression of Ucp1. It becomes evident how the components of the environment, including diet and ambient temperature, exert their effects on Ucp1 through their actions on the factors modulating Ucp1 expression.
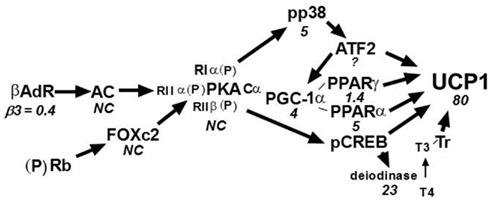
Figure 7. Signaling and transcription components of Ucp1 regulation. The number below each regulatory factor refers to the ratio of expression in A/J vs. B6 mice. Except for the β3-adrenergic receptor, expression is higher in B6 than A/J at either the mRNA or protein levels; however, these strain-dependent differences all occur downstream of PKA. Most important is that none of the strain-dependent differences for the regulatory factors approaches the difference observed for Ucp1 at either the mRNA or protein levels. This suggests that synergy among the regulatory pathways occurs with a changing cast of factors depending on the genotypes of Iba genes and environmental conditions. NC = No difference in expression between A/J and B6.
How does this molecular information on the structure and transcription of the Ucp1 gene relate to the read out of the brown fat genetic system as we have studied in A/J and B6 and the associated RI lines derived from these mice? A continuous variability occurs in which mRNA levels are positively correlated with PPARα, PGC-1α, and Dio2. We propose that this variability is determined by synergistically interacting genes within the QTLs on Chromosomes 2, 3, 8, and 19. Thus, the synergy acts at different levels, at one level on the expression of the transcription and signaling mechanism and at another level on the terminal product of the process, that is, on Ucp1 expression.
The Development of a Brown Adipocyte Lineage within White Fat Depots
Our QTL studies to identify genes controlling brown adipocytes in white fat depots revealed additional findings of significant interest. Some of these, such as the variable induction among white fat depots, were important from the perspective of selecting the best tissue to conduct the genetic experiment. For example, the differences between A/J and B6 mice was large for the interperitoneal fat depots, although the rank order of expression was retroperitoneal fat = mesenteric fat ≫ epididymal fat, while the difference between A/J and B6 mice was small in inguinal fat the level of expression was higher than even retroperitoneal fat (Guerra et al., 1998). However, a striking finding was that iBAT, while having the highest level of expression, showed no difference between A/J and B6 (Coulter et al., 2003; Xue et al., 2005). We reasoned that if the induction of brown adipocytes recapitulated early development and was based upon the same molecular mechanisms for all brown adipocytes, then if we analyzed gene and protein expression in brown fat during early development in utero and during suckling, Ucp1 in interscapular brown fat would be higher in the fetus of A/J compared to B6 mice. However, the analysis showed that at no time during development from the fetus in utero until 4 months of age were any strain-dependent differences detected in interscapular brown fat gene expression (Xue et al., 2007; Figure 8). In contrast, expression and histological analysis of retroperitoneal fat showed a transient induction of brown adipocytes between 10 and 30 days of age. Importantly, although brown adipocytes initially appeared in the retroperitoneal fat (we have since found that brown adipocytes are induced in the inguinal fat with essentially the same time course as retroperitoneal fat) of both A/J and B6 mice, the process was aborted in the B6 mice before the peak of brown adipocyte expression occurred at approximately 24 days of age (Xue et al., 2007). By 2 months of age the brown adipocytes have essentially disappeared from the white fat; however, if mice are exposed to an ambient temperature of 4°C the brown adipocytes are re-induced in A/J mice, but not B6 mice. This genetic variability, characteristic of brown adipocytes found in white fat depots, but not in interscapular brown fat, suggests that the developmental origins of brown adipocytes in interscapular fat are fundamentally different from the brown adipocytes that reside in white fat depots. A conclusion firmly established by the work with PRDM16 and the common progenitor origins for skeletal muscle and iBAT (Seale et al., 2007, 2008).A model of the development of BAT in iBAT and in white fat depots of inducible and non-inducible strain is illustrated in Figure 9.
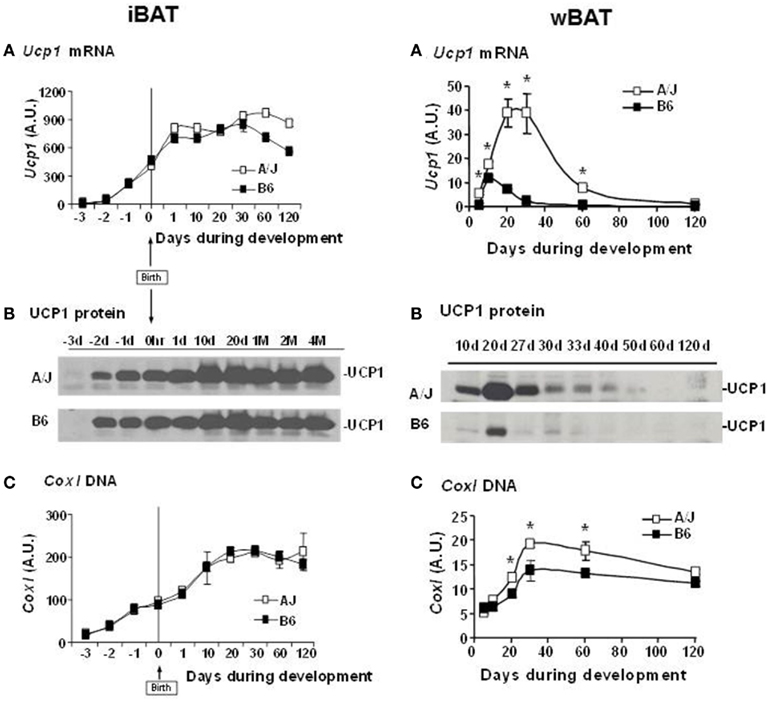
Figure 8. (A) Development of iBAT in A/J and B6. (A) Ucp1 mRNA, (B) UCP1 protein, and (C) mitochondrial DNA content in iBAT of A/J and B6 mice during perinatal and postnatal development. For Ucp1 mRNA, each time point gives the average value from 4 to 9 individual animals analyzed in duplicate and is expressed relative to cyclophilin. Cox1 mitochondrial DNA levels are expressed relative to the nuclear gene Ucp2 from the analysis of four mice in duplicate. (B). Induction of UCP1 in RP white fat depot in A/J and B6 during postnatal development. (A) Ucp1 mRNA, (B) UCP1 protein, and (C) mitochondrial DNA content in RP of A/J and B6 during postnatal development. *P < 0.05 vs. B6. Ucp1 mRNA and Cox1 DNA is based upon the analysis of three to six animals and Cox1 DNA of four mice per time point. Ucp1 mRNA is expressed relative to cyclophilin, while mitochondrial Cox1 DNA is reported relative to Ucp2.
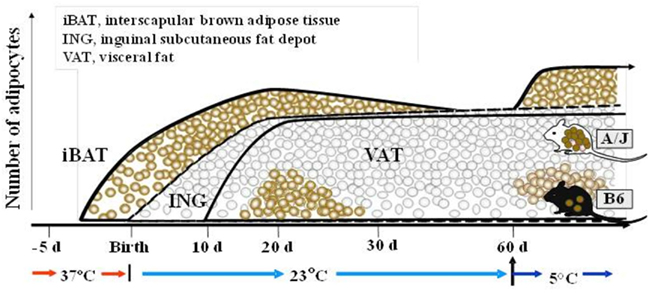
Figure 9. Developmental profiles illustrating the appearance of brown adipocytes in interscapular brown adipose tissue (iBAT) initially at about 4 days before birth. Although the inguinal fat depot (ING) first appears at birth, but the visceral fat (VAT) not until ∼10 days of age, brown adipocytes appear in both depots between 15 and 30 days of age. The induction of brown adipocyte at 20 days of age is higher in A/J than C57Bl/6J (B6) mice, and is induced by in adult animals by adrenergic stimulation in A/J mice, but not B6 mice. This genetic difference in the induction of brown adipocytes among white fat depots is not found in iBAT. This figure has been modified from that found in Xue et al. (2007).
The absence of genetic variability for a trait in a normal animal suggests that the trait is essential for survival of the animal through its function, in this case the presence of iBAT is essential for maintaining a body temperature at birth (Enerback et al., 1997). The newborn mouse, because of its small size and absence of hair, is particularly susceptible to a cold environment. Consequently, brown fat in the discrete depots in the interscapular region and around vital organs is fully functional at birth. On the other hand, brown adipocytes in white fat depots, which appear at ∼20 days of age, are probably not essential for the maintenance of body temperature and therefore more tolerant of genetic variability. Yet whether UCP1 is essential for survival is confounded by the neonatal pig. The pig has poor thermoregulation and no Ucp1 in its brown fat due to a deletion of exons 3–5 which occurred about 20 million years ago (Trayhurn et al., 1989; Berg et al., 2006), However, it manages to survive the cold stress of early development, indicating that in the absence of UCP1pigs adapt with alternative mechanisms of thermogenesis. It is interesting that UCP1-deficient mice can also survive the cold if they have a hybrid genetic background, suggesting the importance of novel allelic combinations that can lead to alternative mechanisms of thermogenesis (Hofmann et al., 2001; Anunciado-Koza et al., 2011).
Summary and Perspectives
The intent of this review is to provide a perspective on how to apply the discoveries and lessons of the study of the biology of brown fat in rodents to the upcoming investigations on brown fat in humans. The studies in mice indicate that induction of brown adipocytes in white fat depots is highly effective in reducing obesity when adrenergically stimulated. Because iBAT is relatively constant, we do not know how effective it may be in burning off excess calories when adrenergically stimulated. On the other hand the brown adipocytes which are induced in white fat depots by adrenergic stimulation show a rich potential for variable expression; a variation that has been effective in assessing the ability of brown adipocytes to burn off excess calories. Although we do not have the same depth of knowledge of the transcription and signaling pathways, which has been obtained for iBAT, nevertheless, we know that they can be effectively induced from mature white adipocytes by adrenergic signaling. In other words, simply conditioning the wBAT system by implementing a training program consisting of exposure to a reduced ambient temperature, analogous to physical exercise training, could be another useful weapon in the war against obesity.
Conflict of Interest Statement
The author declares that the research was conducted in the absence of any commercial or financial relationships that could be construed as a potential conflict of interest.
Acknowledgments
I thank the many post-doctoral and research associates who have worked with me on this fascinating biology during the past 30 years. This work was supported by the Foundation for Polish Science, programme WELCOME, no. WELCOME/2010-4/3 entitled ” Nutrition and ambient temperature during early development can reduce susceptibility to obesity ” financed by EU Structural Funds in Poland within the Innovative Economy Programme and REFRESH project (FP7-REGPOT-2010-1-264103).
References
Almind, K., Manieri, M., Sivitz, W. I., Cinti, S., and Kahn, C. R. (2007). Ectopic brown adipose tissue in muscle provides a mechanism for differences in risk of metabolic syndrome in mice. Proc. Natl. Acad. Sci. U.S.A. 104, 2366–2371.
Anunciado-Koza, R., Zhang, J., Ukropec, J., Bajpeyi, S., Koza, R. A., Rogers, R. C., Cefalu, W. T., Mynatt, R. L., and Kozak, L. P. (2011). Inactivation of the mitochondrial carrier SLC25A25 (ATP-Mg2+/Pi transporter) reduces physical endurance and metabolic efficiency in mice. J. Biol. Chem. 286, 11659–11671.
Bartness, T. J., and Bamshad, M. (1998). Innervation of mammalian white adipose tissue: implications for the regulation of total body fat. Am. J. Physiol. 275, R1399–R1411.
Berg, F., Gustafson, U., and Andersson, L. (2006). The uncoupling protein 1 gene (UCP1) is disrupted in the pig lineage: a genetic explanation for poor thermoregulation in piglets. PLoS Genet. 2, e129. doi:10.1371/journal.pgen.0020129
Brem, R. B., and Kruglyak, L. (2005). The lanscape of genetic complexity across 5,700 gene expression traits in yeast. Proc. Natl. Acad. Sci. U.S.A. 102, 1572–1577.
Bukowiecki, L., Collet, A. J., Follea, N., Guay, G., and Jahjah, L. (1982). Brown adipose tissue hyperplasia: a fundamental mechanism of adaptation to cold and hyperphagia. Am. J. Physiol. 242, E353–E359.
Cannon, B., and Nedergaard, J. (2004). Brown adipose tissue: function and physiological significance. Physiol. Rev. 84, 277–359.
Cassard-Doulcier, A. M., Gelly, C., Fox, N., Schrementi, J., Raimbault, S., Klaus, S., Forest, C., Bouillaud, F., and Ricquier, D. (1993). Tissue-specific and beta-adrenergic regulation of the mitochondrial uncoupling protein gene: control by cis-acting elements in the 5′- flanking region. Mol. Endocrinol. 7, 497–506.
Cederberg, A., Gronning, L. M., Ahren, B., Tasken, K., Carlsson, P., and Enerback, S. (2001). FOXC2 is a winged helix gene that counteracts obesity, hypertriglyceridemia, and diet-induced insulin resistance. Cell 106, 563–573.
Champigny, O., Ricquier, D., Blondel, O., Mayers, R. M., Briscoe, M. G., and Holloway, B. R. (1991). Beta 3-adrenergic receptor stimulation restores message and expression of brown-fat mitochondrial uncoupling protein in adult dogs. Proc. Natl. Acad. Sci. U.S.A. 88, 10774–10777.
Christian, M., Kiskinis, E., Debevec, D., Leonardsson, G., White, R., and Parker, M. G. (2005). RIP140-targeted repression of gene expression in adipocytes. Mol. Cell. Biol. 25, 9383–9391.
Cinti, S. (2002). Adipocyte differentiation and transdifferentiation: plasticity of the adipose organ. J. Endocrinol. Invest. 25, 823–835.
Collins, S., Daniel, K. W., Petro, A. E., and Surwit, R. S. (1997). Strain-specific response to beta 3-adrenergic receptor agonist treatment of diet-induced obesity in mice. Endocrinology 138, 405–413.
Coulter, A. A., Bearden, C. M., Liu, X., Koza, R. A., and Kozak, L. P. (2003). Dietary fat interacts with QTLs controlling induction of Pgc-1 alpha and Ucp1 during conversion of white to brown fat. Physiol. Genomics 14, 139–147.
Cypess, A. M., Lehman, S., Williams, G., Tal, I., Rodman, D., Goldfine, A. B., Kuo, F. C., Palmer, E. L., Tseng, Y. H., Doria, A., Kolodny, G. M., and Kahn, C. R. (2009). Identification and importance of brown adipose tissue in adult humans. N. Engl. J. Med. 360, 1509–1517.
Enerback, S., Jacobsson, A., Simpson, E. M., Guerra, C., Yamashita, H., Harper, M. E., and Kozak, L. P. (1997). Mice lacking mitochondrial uncoupling protein are cold-sensitive but not obese. Nature 387, 90–94.
Eppig, J. J., Wigglesworth, K., Varnum, D. S., and Nadeau, J. H. (1996). Genetic regulation of traits essential for spontaneous ovarian teratocarcinogenesis in strain LT/Sv mice: aberrant meiotic cell cycle, oocyte activation, and parthenogenetic development. Cancer Res. 56, 5047–5054.
Giralt, M., Martin, I., Iglesias, R., Vinas, O., Villarroya, F., and Mampel, T. (1990). Ontogeny and perinatal modulation of gene expression in rat brown adipose tissue. Unaltered iodothyronine 5′-deiodinase activity is necessary for the response to environmental temperature at birth. Eur. J. Biochem. 193, 297–302.
Guerra, C., Koza, R. A., Yamashita, H., Walsh, K., and Kozak, L. P. (1998). Emergence of brown adipocytes in white fat in mice is under genetic control. Effects on body weight and adiposity. J. Clin. Invest. 102, 412–420.
Hansen, J. B., Jorgensen, C., Petersen, R. K., Hallenborg, P., De Matteis, R., Boye, H. A., Petrovic, N., Enerback, S., Nedergaard, J., Cinti, S., Te Riele, H., and Kristiansen, K. (2004). Retinoblastoma protein functions as a molecular switch determining white versus brown adipocyte differentiation. Proc. Natl. Acad. Sci. U.S.A. 101, 4112–4117.
Hansen, J. B., and Kristiansen, K. (2006). Regulatory circuits controlling white versus brown adipocyte differentiation. Biochem. J. 398, 153–168.
Himms-Hagen, J., Cui, J., Danforth, E. Jr., Taatjes, D. J., Lang, S. S., Waters, B. L., and Claus, T. H. (1994). Effect of CL-316,243, a thermogenic beta 3-agonist, on energy balance and brown and white adipose tissues in rats. Am. J. Physiol. 266, R1371–R1382.
Himms-Hagen, J., Melnyk, A., Zingaretti, M. C., Ceresi, E., Barbatelli, G., and Cinti, S. (2000). Multilocular fat cells in WAT of CL-316243-treated rats derive directly from white adipocytes. Am. J. Physiol. Cell Physiol. 279, C670–C681.
Hirning, U., Schmid, P., Schulz, W. A., Kozak, L. P., and Hameister, H. (1989). In developing brown adipose tissue c-myc protooncogene expression is restricted to early differentiation stages. Cell Differ. Dev. 27, 243–248.
Hofmann, W. E., Liu, X., Bearden, C. M., Harper, M.-E., and Kozak, L. P. (2001). Effects of genetic background on thermoregulation and fatty acid-induced uncoupling of mitochondria in UCP1-deficient mice. J. Biol. Chem. 276, 12460–12465.
Houstek, J., Kopecky, J., Rychter, Z., and Soukup, T. (1988). Uncoupling protein in embryonic brown adipose tissue–existence of non thermogenic and thermogenic mitochondria. Biochim. Biophys. Acta 935, 19–25.
Kajimura, S., Seale, P., and Spiegelman, B. M. (2010). Transcriptional control of brown fat development. Cell Metab. 11, 257–262.
Kajimura, S., Seale, P., Tomaru, T., Erdjument-Bromage, H., Cooper, M. P., Ruas, J. L., Chin, S., Tempst, P., Lazar, M. A., and Spiegelman, B. M. (2008). Regulation of the brown and white fat gene programs through a PRDM16/CtBP transcriptional complex. Genes Dev. 22, 1397–1409.
Kersten, S., Seydoux, J., Peters, J. M., Gonzalez, F. J., Desvergne, B., and Wahli, W. (1999). Peroxisome proliferator-activated receptor alpha mediates the adaptive response to fasting. J. Clin. Invest. 103, 1489–1498.
Koza, R. A., Hohmann, S. M., Guerra, C., Rossmeisl, M., and Kozak, L. P. (2000). Synergistic gene interactions control the induction of the mitochondrial uncoupling protein (Ucp1) gene in white fat tissue. J. Biol. Chem. 275, 34486–34492.
Kozak, L. P., and Koza, R. A. (2010). The genetics of brown adipose tissue. Prog. Mol. Biol. Transl. Sci. 94, 75–123.
Kozak, U. C., Kopecky, J., Teisinger, J., Enerback, S., Boyer, B., and Kozak, L. P. (1994). An upstream enhancer regulating brown-fat-specific expression of the mitochondrial uncoupling protein gene. Mol. Cell. Biol. 14, 59–67.
Leonardsson, G., Steel, J. H., Christian, M., Pocock, V., Milligan, S., Bell, J., So, P. W., Medina-Gomez, G., Vidal-Puig, A., White, R., and Parker, M. G. (2004). Nuclear receptor corepressor RIP140 regulates fat accumulation. Proc. Natl. Acad. Sci. U.S.A. 101, 8437–8442.
Nogami, S., Ohya, Y., and Yvert, G. (2007). Genetic complexity and quantitative trait loci mapping of yeast morphological traits. PLoS Genet. 3, e31. doi:10.1371/journal.pgen.0030031
Puigserver, P., Wu, Z., Park, C. W., Graves, R., Wright, M., and Spiegelman, B. M. (1998). A cold-inducible coactivator of nuclear receptors linked to adaptive thermogenesis. Cell 92, 829–839.
Rothwell, N. J., and Stock, M. J. (1979). A role for brown adipose tissue in diet-induced thermogenesis. Nature 281, 31–35.
Seale, P., Bjork, B., Yang, W., Kajimura, S., Chin, S., Kuang, S., Scime, A., Devarakonda, S., Conroe, H. M., Erdjument-Bromage, H., Tempst, P., Rudnicki, M. A., Beier, D. R., and Spiegelman, B. M. (2008). PRDM16 controls a brown fat/skeletal muscle switch. Nature 454, 961–967.
Seale, P., Kajimura, S., Yang, W., Chin, S., Rohas, L. M., Uldry, M., Tavernier, G., Langin, D., and Spiegelman, B. M. (2007). Transcriptional control of brown fat determination by PRDM16. Cell Metab. 6, 38–54.
Sears, I. B., Macginnitie, M. A., Kovacs, L. G., and Graves, R. A. (1996). Differentiation-dependent expression of the brown adipocyte uncoupling protein gene: regulation by peroxisome proliferator-activated receptor gamma. Mol. Cell. Biol. 16, 3410–3419.
Seldin, M. F., Mott, D., Bhat, D., Petro, A., Kuhn, C. M., Kingsmore, S. F., Bogardus, C., Opara, E., Feinglos, M. N., and Surwit, R. S. (1994). Glycogen synthase: a putative locus for diet-induced hyperglycemia. J. Clin. Invest. 94, 269–276.
Shockley, K. R., and Churchill, G. A. (2006). Gene expression analysis of mouse chromosome substitution strains. Mamm. Genome 17, 598–614.
Staszkiewicz, J., Gimble, J., Cain, C., Dietrich, M., Burk, D., Kirk-Ballard, H., and Gawronska-Kozak, B. (2009). Flow cytometric and immunohistochemical detection of in vivo BrdU-labeled cells in mouse fat depots. Biochem. Biophys. Res. Commun. 378, 539–544.
Taylor, B. A. (1981). “Recombinant inbred strains,” in Genetic Variants and Strains of the Laboratory Mouse, ed. M. C. Green (New York: Gustav Fischer Verlag). 397–407.
Trayhurn, P., Temple, N. J., and Van Aerde, J. (1989). Evidence from immunoblotting studies on uncoupling protein that brown adipose tissue is not present in the domestic pig. Can. J. Physiol. Pharmacol. 67, 1480–1485.
Van Marken Lichtenbelt, W. D., Vanhommerig, J. W., Smulders, N. M., Drossaerts, J. M., Kemerink, G. J., Bouvy, N. D., Schrauwen, P., and Teule, G. J. (2009). Cold-activated brown adipose tissue in healthy men. N. Engl. J. Med. 360, 1500–1508.
Virtanen, K. A., Lidell, M. E., Orava, J., Heglind, M., Westergren, R., Niemi, T., Taittonen, M., Laine, J., Savisto, N. J., Enerback, S., and Nuutila, P. (2009). Functional brown adipose tissue in healthy adults. N. Engl. J. Med. 360, 1518–1525.
Xue, B., Coulter, A., Rim, J. S., Koza, R. A., and Kozak, L. P. (2005). Transcriptional synergy and the regulation of Ucp1 during brown adipocyte induction in white fat depots. Mol. Cell. Biol. 25, 8311–8322.
Keywords: Ucp1 mRNA, retroperitoneal fat depot, quantitative trait loci, transgressive variation, recombinant inbred strains of mice, backcross analysis, synergistic interaction of regulatory genes
Citation: Kozak LP (2011) The genetics of brown adipocyte induction in white fat depots. Front. Endocrin. 2:64. doi: 10.3389/fendo.2011.00064
Received: 18 August 2011;
Paper pending published: 15 September 2011;
Accepted: 12 October 2011;
Published online: 31 October 2011.
Edited by:
Patrick Seale, University of Pennsylvania, USAReviewed by:
Oh Yoen Kim, Yonsei University, South KoreaMartin Jastroch, Buck Institute for Research on Aging, USA
Copyright: © 2011 Kozak. This is an open-access article subject to a non-exclusive license between the authors and Frontiers Media SA, which permits use, distribution and reproduction in other forums, provided the original authors and source are credited and other Frontiers conditions are complied with.
*Correspondence: Leslie P. Kozak, Institute of Animal Reproduction and Food Research Polish Academy of Sciences, ul. Tuwima 10, 10-747 Olsztyn, Poland. e-mail:bC5rb3pha0BwYW4ub2xzenR5bi5wbA==