 Wenting X. Carroll1,2
 Nishan S. Kalupahana3 Suzanne L. Booker1,2 Nalin Siriwardhana4
 Monique LeMieux4
 Arnold M. Saxton1,2
 Naima Moustaid-Moussa4*
- 1Department of Animal Science, University of Tennessee, Knoxville, TN, USA
- 2Obesity Research Center, University of Tennessee, Knoxville, TN, USA
- 3Department of Physiology, Faculty of Medicine, University of Peradeniya, Peradeniya, Sri Lanka
- 4Nutritional Sciences Program, College of Human Sciences, Texas Tech University, Lubbock, TX, USA
Inflammatory adipokines secreted from adipose tissue are major contributors to obesity-associated inflammation and other metabolic dysfunctions. We and others have recently documented the contribution of adipose tissue renin-angiotensin system to the pathogenesis of obesity, inflammation, and insulin resistance. We hypothesized that adipocyte-derived angiotensinogen (Agt) plays a critical role in adipogenesis and/or lipogenesis as well as inflammation. This was tested using 3T3-L1 adipocytes, stably transfected with Agt-shRNA or scrambled Sc-shRNA as a control. Transfected preadipocytes were differentiated and used to investigate the role of adipose Agt through microarray and PCR analyses and adipokine profiling. As expected, Agt gene silencing significantly reduced the expression of Agt and its hormone product angiotensin II (Ang II), as well as lipid accumulation in 3T3-L1 adipocytes. Microarray studies identified several genes involved in lipid metabolism and inflammatory pathways which were down-regulated by Agt gene inactivation, such as glycerol-3-phosphate dehydrogenase 1 (Gpd1), serum amyloid A 3 (Saa3), nucleotide-binding oligomerization domain containing 1 (Nod1), and signal transducer and activator of transcription 1 (Stat1). Mouse adipogenesis PCR arrays revealed lower expression levels of adipogenic/lipogenic genes such as peroxisome proliferator activated receptor gamma (PPARγ), sterol regulatory element binding transcription factor 1 (Srebf1), adipogenin (Adig), and fatty acid binding protein 4 (Fabp4). Further, silencing of Agt gene significantly lowered expression of pro-inflammatory adipokines including interleukin-6 (IL-6), tumor necrosis factor-alpha (TNF-α), and monocyte chemotactic protein-1 (MCP-1). In conclusion, this study directly demonstrates critical effects of Agt in adipocyte metabolism and inflammation and further support a potential role for adipose Agt in the pathogenesis of obesity-associated metabolic alterations.
Introduction
Obesity is a major risk factor for life-threatening diseases in the United States and worldwide. Its comorbidities include hypertension, cardiovascular disease, stroke, type-2 diabetes mellitus (T2DM), and some types of cancer (Ouchi et al., 2011). In obese individuals, imbalanced secretion of pro- vs. anti-inflammatory adipokines from abnormally expanded adipose tissue and a shift in immune cell populations leads to the development of metabolic complications (Ouchi et al., 2011; Kalupahana and Moustaid-Moussa, 2012a). In the past decades, multiple studies (in vitro, in vivo, and clinical) indicated the critical role of the renin-angiotensin system (RAS) in the pathogenesis of obesity-associated health disorders. RAS is conventionally known as a group of hormones and enzymes (renin and angiotensin-converting enzyme: ACE) which regulate blood pressure and fluid balance. Angiotensinogen (Agt) is the only known precursor from which the hypertensive hormone angiotensin (Ang) II and other bioactive Ang peptides are generated. Ang II mainly functions through two G-protein coupled receptors, type 1 (AT1) and type 2 (AT2) receptors. In lean individuals, the liver is the major site for Agt production but RAS components are also expressed in white and brown adipose tissue, making them relevant to this work (Karlsson et al., 1998; Engeli et al., 2000; Galvez-Prieto et al., 2008). Angiotensinogen expression in general has been shown to be hormonally and nutritionally regulated as well as differentiation-dependent (Jones et al., 1997a; Siriwardhana et al., 2012). Specifically Agt is thought to be a late marker for adipocyte differentiation (Ailhaud et al., 2002), making it relevant to the current study.
Clinical studies showed that RAS blockade using ACE inhibitors or AT1 blockers improved the insulin sensitivity and lowered the incidence of T2DM in patients with hypertension or other cardiovascular diseases (Pollare et al., 1989). RAS blockade also increased the insulin sensitivity and improved adiposity in obese and diabetic rodent models (reviewed in Kalupahana and Moustaid-Moussa, 2012a). The metabolic effects of RAS were further confirmed in genetic animal models with systemic deletion of certain RAS components (Agt, renin, ACE, AT1a, or AT2 receptor) (reviewed in Kalupahana and Moustaid-Moussa, 2012a). In vitro studies showed that Ang II stimulated lipogenesis and secretion of pro-inflammatory adipokines in adipocytes (Jones et al., 1997b; Kalupahana et al., 2012).
In obese humans and rodents, adipose tissue is the major site for Agt production, which significantly increases Agt level in circulation (Van Harmelen et al., 2000; Boustany et al., 2004; Engeli et al., 2005). Our lab and others demonstrated that mice with Agt over-expression in adipose tissue developed obesity with adipocyte hypertrophy, concurrent with insulin resistance and increased expression of lipogenic and pro-inflammatory makers (Massiera et al., 2001a; Kalupahana et al., 2012). Most of these effects were rescued by deletion of AT2 receptor (Yvan-Charvet et al., 2009). The genetic mouse model with adipose-specific Agt gene knock-out exhibited lower systolic blood pressure as they age, however no change was observed in body weight or fat mass when fed a low-fat diet (Yiannikouris et al., 2012). Systemic AGT knock-out mouse models have also been generated in which body weight, adiposity, leptin, and insulin levels were significantly lowered on a high-fat diet compared to wild-type mice. These effects were then reversed when AGT was re-expressed in adipose tissue (Massiera et al., 2001b; Kim et al., 2002).
Studies reviewed above link the elevated secretion of Agt from adipose tissue to obesity-associated local and systemic inflammation as well as insulin resistance, and possibly exacerbated adiposity. Therefore, we hypothesized that inactivation of Agt in adipocytes will limit lipid accumulation, and improve the inflammatory profile.
In the present study, we silenced Agt gene in 3T3-L1 adipocytes using shRNA, and demonstrated that lower Agt expression leads to decreased triglyceride accumulation, which is accompanied by improved expression patterns of adipogenic/lipogenic and inflammatory genes and proteins in adipocytes.
Materials and Methods
Cell Culture, shRNA Transfection, and Preadipocyte Differentiation
Initially, cell lines were generated as described below using two different shRNA sequences and prepared as both isolated or pooled clones of stably transfected cells. They were then compared to cells stably transfected with scrambled sequences. Both shRNA sequences reduced inflammatory markers and led to significant inactivation of AGT (>70%). Due to the similarities between the two sequences, only one was chosen and used for further detailed experiments as discussed below.
3T3-L1 preadipocytes (American Type Culture Collection; ATCC, Manassas, VA, USA) were seeded in two 6-well cell culture plates. Each well had 2 ml Dulbecco’s modified eagle medium (DMEM) supplemented with 10% fetal bovine serum (FBS). Cells were incubated at 37°C in a humidified CO2 incubator. The vector-based shRNA targeting Agt gene (Agt-shRNA, GGATCCCGTTTCTACCTTGGATCCTAGATTGATATCCGTCTAAGGA
TCCAAGGTAGAAATTTTTTCCAAAAGCTT) was ordered from GenScript (Piscataway, NJ, USA). A scrambled sequence (Sc-shRNA, GGATCCCGTCGCTTACCGATTCAGAATGGTTGATATCCGCCATTCT
GAATCGGTAAGCGACGAAGCTTAAGTTTAAACCGCTGATCAGCCTC
GACTGTGCCTTCTAGT) with no homology to any mouse or rat mRNA sequence in NCBI database was used as experimental control. These vectors carried a neomycin resistance gene.
Cells were stably transfected at ∼50–60% confluence. The transfection was performed using Lipofectamine™ 2000 Transfection Reagent (Life Technologies, Grand Island, NY, USA) method. 3T3-L1 preadipocytes transfected by Agt-shRNA or Sc-shRNA were maintained in regular growth medium (DMEM containing 10% FBS, 1% penicillin/streptomycin) till 90% confluence. To differentiate the preadipocytes to mature adipocytes, cells were maintained in regular growth medium supplemented by isobutylmethylxanthine (0.5 mM), dexamethasone (0.25 μM), and insulin (1 μg/ml) for 3 days, followed by regular growth media for another 3 days. Several cell lines were generated from these stable transfections and referred to as Agt-ShRNA1, 2, etc. Overall, Agt was silenced by more than 70% in these cell lines.
Agt and Ang II Measurement
Total protein was extracted using tissue lysis buffer (Life Technologies, Grand Island, NY, USA) containing protease inhibitors (Roche, USA). The concentration of extracted protein samples was determined by Bradford assay (Thermo Scientific/Pierce, Rockford, IL, USA).
The expression level of Agt protein was measured by western blotting. Each sample of 25 μg total protein from 3T3-L1 adipocytes transfected by Agt-shRNA or Sc-shRNA (3 vs. 3) was first separated by electrophoresis using 12% Mini-PROTEAN TGX Precast Gel (Bio-Rad, Hercules, CA, USA), and then transferred to a PVDF membrane. After overnight blocking (3% bovine serum albumin in tris-buffered-saline supplemented by 0.1% Tween 20), the membrane was incubated with polyclonal antibodies targeting Agt protein (Santa Cruz Biotechnology, Santa Cruz, CA, USA). After a wash (tris-buffered-saline with 0.1% Tween 20), the membrane was incubated with the secondary antibodies containing horseradish peroxidase. The expression of Agt was detected with the ECL Plus substrate (Thermo Scientific/Pierce, Rockford, IL, USA), and quantified using the NIH ImageJ software. The expression level of Agt protein was normalized by the expression of glyceraldehyde 3-phosphate dehydrogenase (GAPDH).
The intracellular level of Ang II was measured by Angiotensin II EIA Kit (Cayman Chemical, Ann Arbor, MI, USA). To perform the assay, 10 μL of each total protein sample from 3T3-L1 adipocytes transfected by Agt-shRNA or Sc-shRNA (n = 5 each) was used. The analyte value was normalized by total protein concentration.
Lipid Accumulation Assay
3T3-L1 adipocytes transfected by Agt-shRNA or Sc-shRNA (n = 5 each) were washed with PBS, and then harvested in PBS supplemented by 10% IGEPAL CA-630 (detergent, Sigma-Aldrich, St. Louis, MO, USA). Cells were then transferred to a 2 ml autoclaved centrifuge tube and homogenized for 15 s. The triglyceride content in cell lysate was measured using Serum Triglyceride Determination Kit (Sigma-Aldrich, St. Louis, MO, USA). The analyte value was normalized by total protein concentration.
Pro-Inflammatory Adipokine Profiling
The intracellular level of pro-inflammatory adipokines (IL-1, TNF-α, MCP-1, PAI-1, and resistin) was measured by the Mouse Serum Adipokine Milliplex Kit (Millipore, Billerica, MA, USA). To perform the assay, total protein sample from 3T3-L1 adipocytes transfected by Agt-shRNA or Sc-shRNA (n = 5 each) was used. The analyte value was normalized by protein concentration.
Microarray
Total RNA was extracted from 3T3-L1 adipocytes transfected with Agt-shRNA or Sc-shRNA using RNeasy lipid tissue kit (Qiagen, Valencia, CA, USA). Four sets of RNA samples each were used for microarray analyses. The concentration of these RNA samples was measured using NanoDrop 2000 (Thermo Scientific, USA), and the quality was determined by the Experion RNA StdSens Chips (Bio-Rad, Hercules, CA, USA). Samples were sent to the McGill University’s Génome Québec Innovation Center (Montréal, Canada) and Illumina MouseRef-8 V2.0 Expression Beadchips (Illumina, San Diego, CA, USA) were used to measure 25,697 RefSeq transcripts, over 19,100 genes. David Bioinformatics Database 6.71 (NIAID/NIH) was used for the ontology and pathway analysis on genes with differential expression.
Quantitative Real-Time PCR
The expression pattern of selected genes with differential expression in the microarray analyses was verified by quantitative Real-Time PCR (qRT-PCR). Total RNA samples extracted from 3T3-L1 adipocytes transfected with Agt-shRNA or Sc-shRNA (n = 4 each) were used for cDNA synthesis using the High Capacity cDNA RT kit (Applied Biosystems, Carlsbad, CA, USA). All primers used in this study were purchased from Qiagen (QuantiTect Primer Assay). The real-time PCR was performed on Applied Biosystems 7900HT Fast Real-Time PCR System using the Fast SYBR Master Mix (Applied Biosystems, Carlsbad, CA, USA). The expression level of housekeeping gene β-actin (Actb) was measured as reference to normalize the expression level of genes under investigation.
PCR Array
The expression of genes associated with adipocyte metabolism was profiled by Mouse Adipogenesis RT2 Profiler™ PCR Array (SABiosciences, Qiagen, Valencia, CA, USA), which targets 84 core genes in mouse adipogenesis pathway. The array kit also contains five housekeeping genes, which include Actb. Total RNA samples extracted from 3T3-L1 adipocytes transfected with Agt-shRNA or Sc-shRNA (n = 4 each) were used for the synthesis of cDNA using RT2 First Strand Kit (SABiosciences, Qiagen, Valencia, CA, USA). RT-PCR was performed on the same equipment as described previously using the RT2 SYBR Green qPCR Mastermix (SABiosciences, Qiagen, Valencia, CA, USA). David Bioinformatics Database 6.7 (see text footnote 1, NIAID/NIH) was used for the gene ontology analysis.
Statistical Analyses
In this study, microarray data were analyzed by R software (version 2.9.0) using “lumi” package in bioconductor2. Significant differential expression in 3T3-L1 adipocytes with Agt gene silencing compared to the adipocytes transfected by Sc-shRNA was defined as an FDR adjusted P value < 0.05.
Data from qRT-PCR and PCR array studies were analyzed by the web-based software3 (SABiosciences) using 2−ΔΔCT method. The expression level for genes of interest was normalized by the expression of Actb housekeeping gene.
All other analyses were performed using SAS software (version 9.2, Cary, NC, USA). Results were reported as means ± SE. One way ANOVA followed by Tukey post hoc test was used to compare the group means at P < 0.05.
Results
Angiotensinogen Gene Silencing Reduced Agt Protein Expression and Intracellular Level of Ang II in 3T3-L1 Adipocytes
Successful transfection of Agt-shRNA into 3T3-L1 preadipocytes was demonstrated by the significantly lower expression of Agt protein in 3T3-L1 adipocytes expressing Agt-shRNA vs. Sc-shRNA (Figures 1A,B; P < 0.005). As Agt is the precursor for the hypertensive hormone Ang II, we further measured the intracellular level of Ang II, which was also decreased in 3T3-L1 adipocytes expressing Agt-shRNA vs. Sc-shRNA (Figure 1C; P < 0.0001).
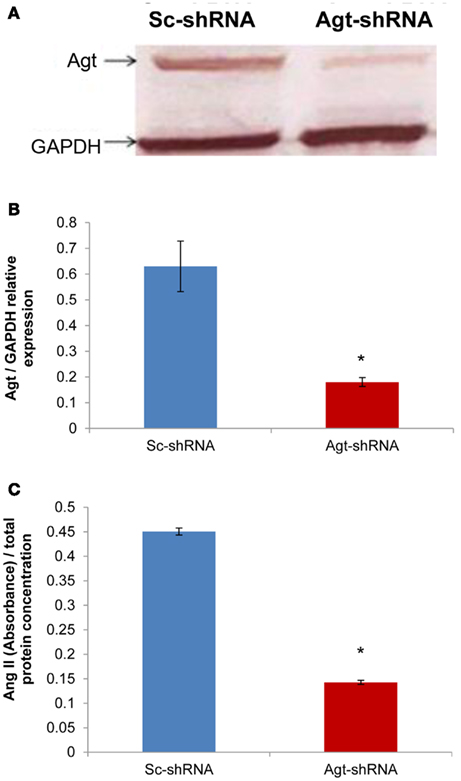
Figure 1. Agt gene silencing induces lower Agt protein expression and intracellular level of Ang II. 3T3-L1 preadipocytes were transfected by shRNA targeting Agt gene (Agt-shRNA) or scrambled shRNA (Sc-shRNA), and then differentiated to mature adipocytes. (A,B) Agt protein expression, and (C) intracellular level of Ang II are shown. Data are presented as mean ± SE [n = 3 for each group in (A), n = 5 for each group in (C)]. The expression of Agt is normalized by the expression of GAPDH. The intracellular level of Ang II is normalized by total protein concentration. *P < 0.005 vs. adipocytes transfected by Sc-shRNA.
Agt Gene Silencing Decreased Lipid Accumulation and Intracellular Level of Pro-Inflammatory Adipokines in 3T3-L1 Adipocytes
Previous studies have reported that Ang II increases the triglyceride content in 3T3-L1 adipocytes (Jones et al., 1997b). Here, we determined the role of RAS in mediating lipogenesis by directly knocking down the expression of Ang II precursor – Agt gene. Agt gene silencing significantly reduced the triglyceride content in 3T3-L1 adipocytes expressing Agt-shRNA vs. Sc-shRNA (Figure 2A; P < 0.005). Studies have also shown that Ang II stimulates the secretion of pro-inflammatory adipokines from both human and 3T3-L1 adipocytes. In this study, we measured the intracellular level of major pro-inflammatory adipokines (IL-6, TNF-α, MCP-1, resistin, and PAI-1). The results showed lower IL-6, TNF-α, and MCP-1 protein levels in 3T3-L1 adipocytes transfected with Agt-shRNA vs. Sc-shRNA (Figure 2B). This indicated Agt as an important mediator in adipose inflammation.
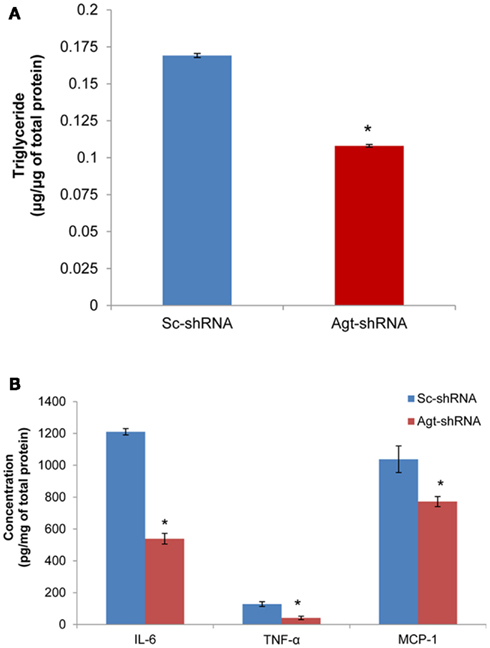
Figure 2. Agt gene silencing leads to lower triglyceride accumulation and intracellular level of pro-inflammatory adipokines in 3T3-L1 adipocytes. 3T3-L1 preadipocytes were transfected by shRNA targeting Agt gene (Agt-shRNA) or scrambled shRNA (Sc-shRNA), and then differentiated to mature adipocytes. Triglyceride content (A) and adipokine concentration (B) is normalized by total protein concentration. Data are presented as mean ± SE (n = 5 for each group). *P < 0.05 vs. adipocytes transfected by Sc-shRNA.
Agt Gene Silencing Induced Changes in the Expression of Genes Involved in Lipid Metabolism and Immune Response Pathways
To dissect the underlying mechanism which mediates the metabolic effects of Agt in adipocytes, a microarray study was performed on 3T3-L1 adipocytes transfected by Agt-shRNA or Sc-shRNA. After filtering out 16,561 transcripts with insignificant expression, we conducted statistical analysis on the remaining 9,136 transcripts. Compared to cells transfected with Sc-shRNA, the expression of 89 genes was significantly down-regulated and the expression of 23 genes was up-regulated in 3T3-L1 adipocytes with Agt gene silencing (Figure 3A). A heat map was plotted by cluster analysis on genes with differential expression in 3T3-L1 adipocytes transfected with Agt-shRNA vs. Sc-shRNA. The expression patterns of these genes were highly consistent within each adipocyte cell line, as shown in Figure 3B.
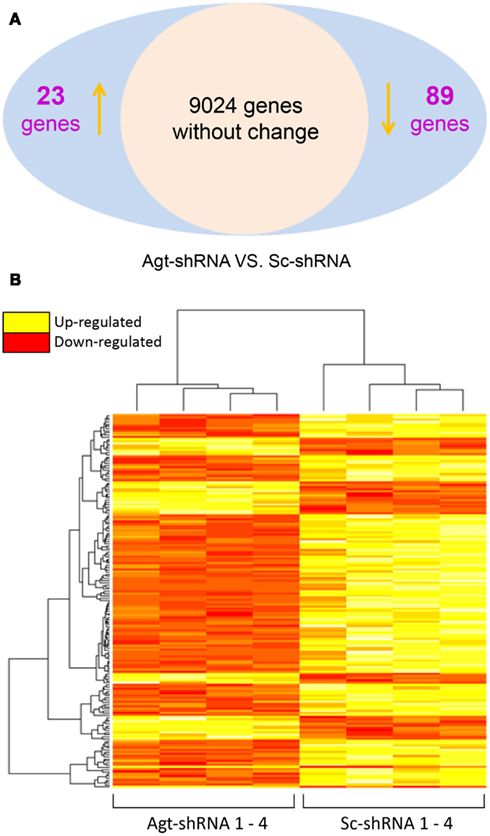
Figure 3. Agt gene silencing induces changes in global gene expression patterns in 3T3-L1 adipocytes. 3T3-L1 preadipocytes were transfected by shRNA targeting Agt gene (Agt-shRNA) or scrambled shRNA (Sc-shRNA), and then differentiated into mature adipocytes. Changes in global gene expression patterns were profiled by microarray study. Genes with significant differential expression in 3T3-L1 adipocytes transfected with Agt-shRNA vs. Sc-shRNA were determined by the false discovery rate (FDR) adjusted P value < 0.05 (A). Heat map with genes of differential expression is shown in (B). The rows represent the patterns of gene expression, and columns represent samples. Red region corresponds to genes with down-regulated expression, and yellow region corresponds to genes with up-regulated expression, in 3T3-L1 adipocytes transfected with Agt-shRNA vs. Sc-shRNA (n = 4 for each cell line).
Gene ontology and pathway analysis showed that the expression of several critical genes involved in lipid metabolism and inflammatory response was down-regulated in 3T3-L1 adipocytes with Agt gene silencing; selected genes are listed in Tables 1 and 2. Other genes with decreased expression in 3T3-L1 adipocytes with Agt gene silencing were genes involved in energy metabolism, immune response, oxidative stress, cell differentiation, and apoptosis. Genes with up-regulated expression in 3T3-L1 adipocytes with Agt gene silencing were ones involved in DNA replication, transcription, translation, repair, chromosomal structure, intracellular protein trafficking, protein phosphorylation, and proteolysis. These genes are listed in Table A1 in Appendix.
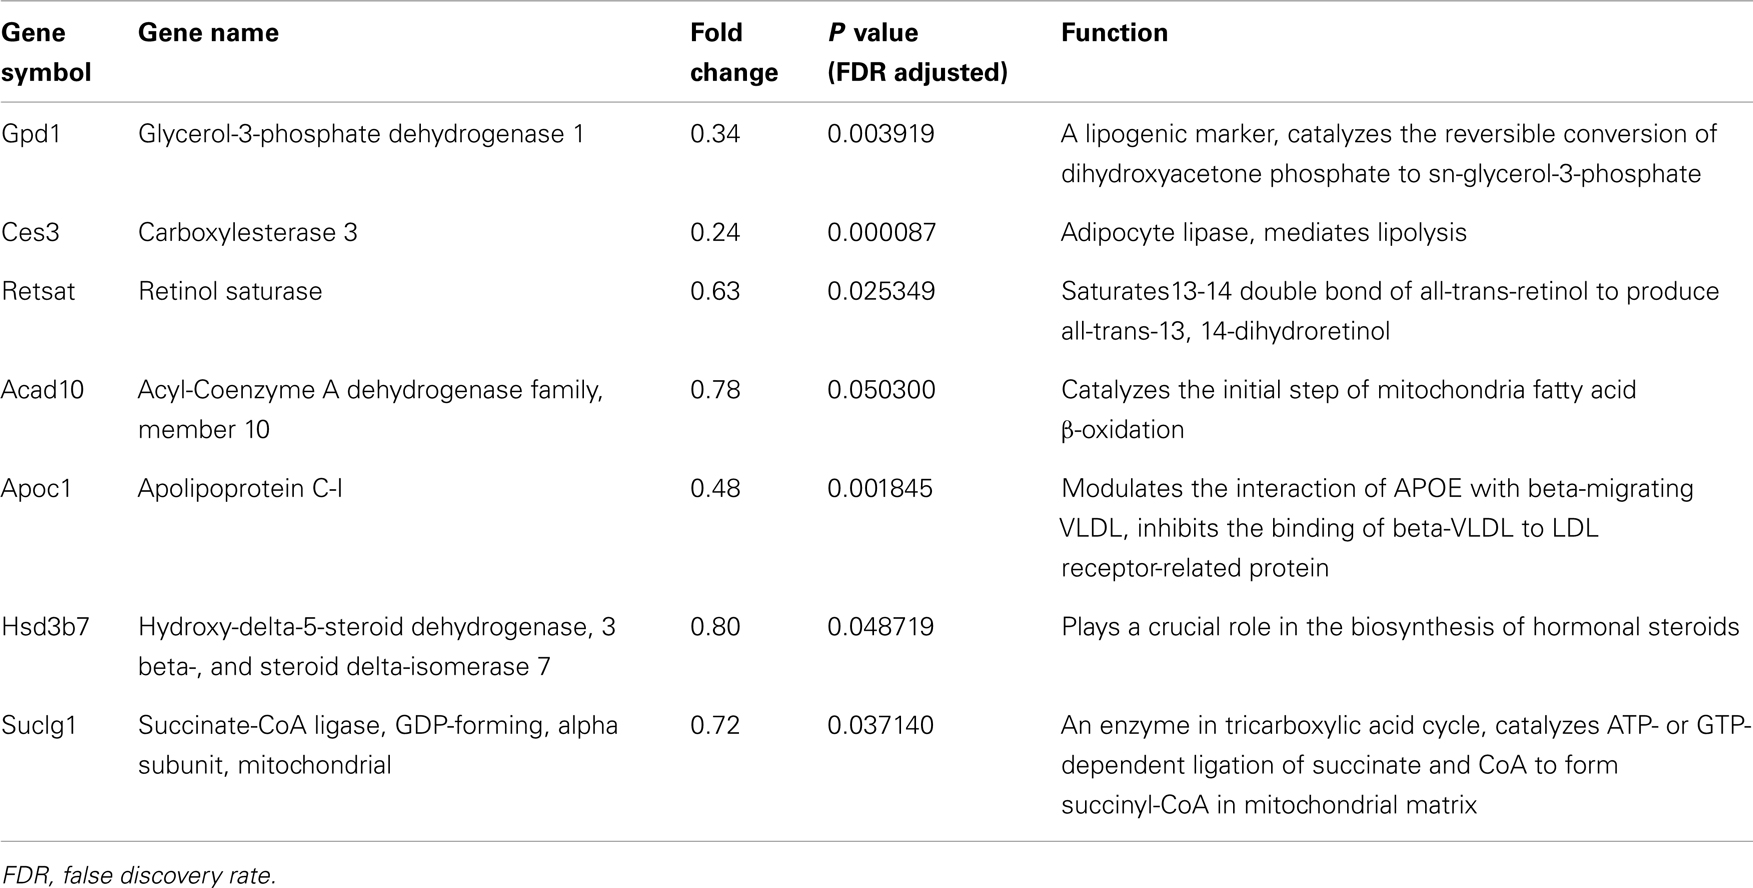
Table 1. Lipid metabolic genes differentially expressed in 3T3-L1 adipocytes transfected by Agt-shRNA vs. Sc-shRNA.
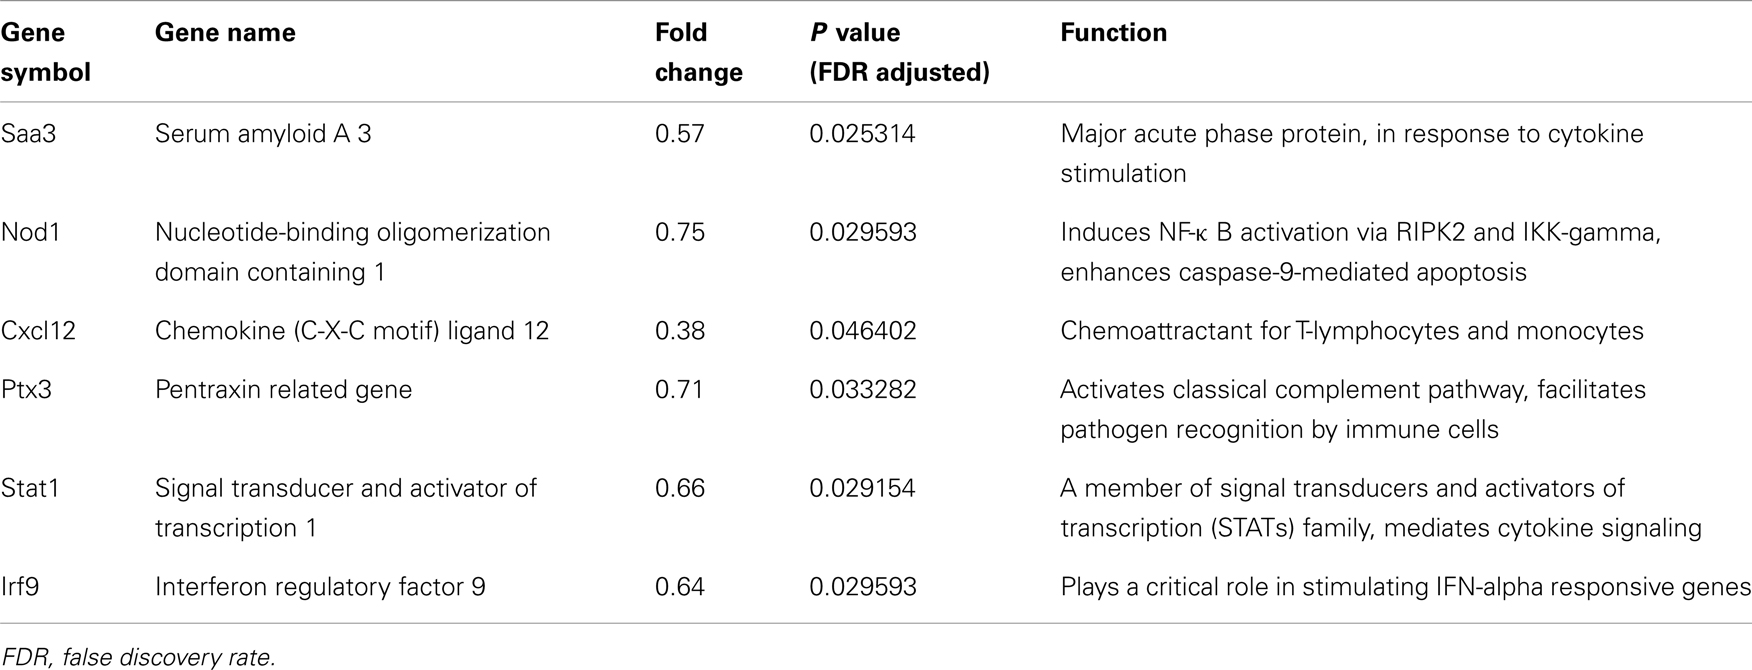
Table 2. Inflammatory genes differentially expressed in 3T3-L1 adipocytes transfected by Agt-shRNA vs. Sc-shRNA.
To determine whether the profile of global gene expression from the microarray study were consistent with the relative amounts of mRNA present in parallel samples, qRT-PCR was performed on selected genes (Cxcl12, Stat1, Saa3, Nod1, Gpd1, and Acad10). Consistent with microarray results, the expression level of all these genes were down-regulated in 3T3-L1 adipocytes with Agt gene silencing compared to those transfected with Sc-shRNA (Figure 4).
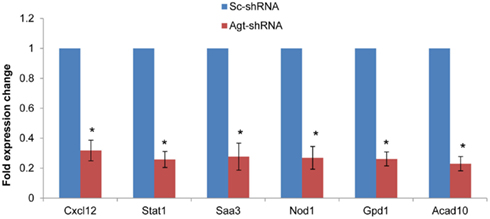
Figure 4. Agt gene silencing induces down-regulated expression of Cxcl12, Stat1, Saa3, Nod1, Gpd1, and Acad10 genes in 3T3-L1 adipocytes. 3T3-L1 preadipocytes were transfected by shRNA targeting Agt gene (Agt-shRNA) or scrambled shRNA (Sc-shRNA), and then differentiated to mature adipocytes. Data are presented as mean ± SE, and calculated according to the 2−ΔΔCT method (n = 4 for each group). *P < 0.0001 vs. adipocytes transfected by Sc-shRNA.
Since knock-down of Agt gene decreased lipid accumulation and the expression of genes associated with lipid metabolism in 3T3-L1 adipocytes, we further profiled the expression pattern of genes in the adipogenesis pathways using a PCR array. The results confirmed the lower expression of Agt gene at transcription level, and showed decreased expression of several adipogenic genes, including PPAR-γ, Cebpb, Srebf1 and Adig, and lipid metabolic markers Ppargc1b and Fabp4 in 3T3-L1 adipocytes with Agt gene silencing. Conversely, the expression of genes with anti-adipogenic effects, Gata3, and Vdr, were up-regulated. The expression pattern of these genes is shown in Figure 5, and the functions of these genes are described in Table 3.
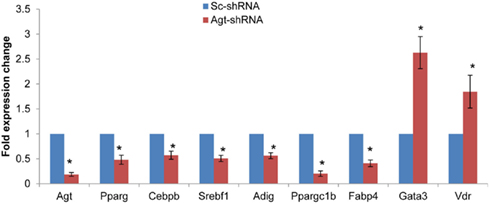
Figure 5. Agt gene silencing induces changes in the expression of genes associated with adipogenesis pathway in 3T3-L1 adipocytes. 3T3-L1 preadipocytes were transfected by shRNA targeting Agt gene (Agt-shRNA) or scrambled shRNA (Sc-shRNA), and then differentiated to mature adipocytes. Data are presented as mean ± SE, and calculated according to the 2−ΔΔCT method (n = 4 for each group). *P < 0.05 vs. adipocytes transfected by Sc-shRNA.
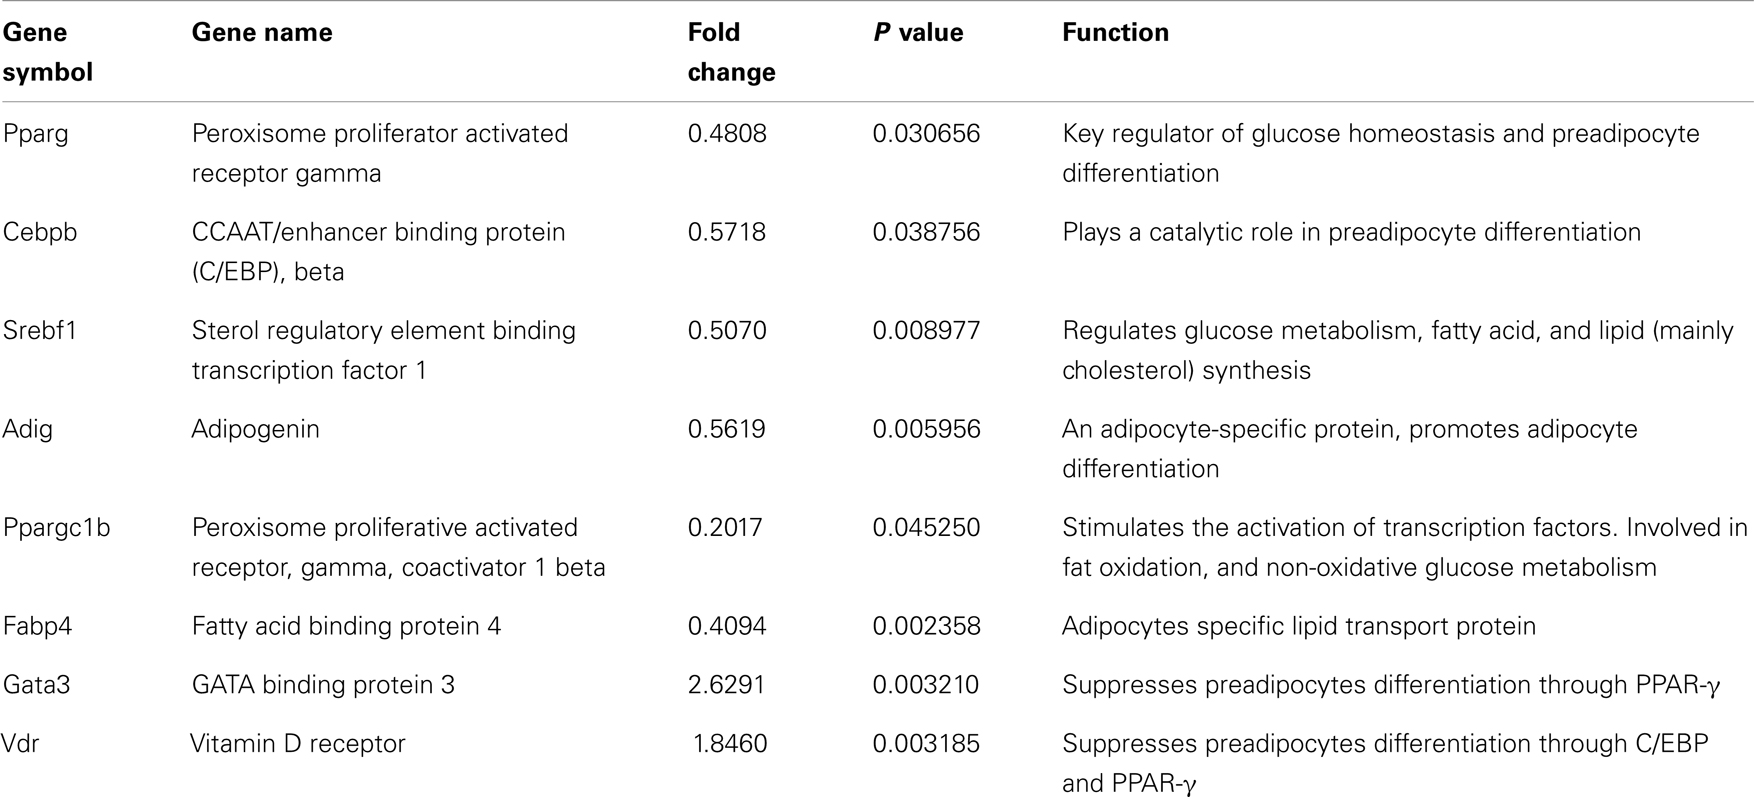
Table 3. Genes with differential expression associated with adipogenesis pathway in 3T3-L1 adipocytes transfected by Agt-shRNA vs. Sc-shRNA.
Discussion
Recent studies indicated the potential role of adipose tissue-derived Agt in the pathogenesis of metabolic disorders. However, the underlying mechanisms mediating these effects are not well clarified. In the present study, we successfully established Agt gene silencing in 3T3-L1 adipocytes using shRNA, which effectively decreased the intracellular level of Agt and Ang II, and enabled us to directly investigate the metabolic effects of adipose Agt. Using this in vitro model, we confirmed the direct contribution of adipocyte-derived Agt and Ang II to preadipocyte differentiation, lipogenesis, and adipocyte inflammation, as evidenced by decreased triglyceride accumulation, and pro-inflammatory adipokine production, as well as down-regulated expression of several adipogenic and inflammatory genes.
RAS and Adiposity
The present study confirmed the effects of Agt/Ang II in promoting lipogenesis. Our lab previously reported that Ang II increases lipogenesis in 3T3-L1 and human adipocytes (Jones et al., 1997b). In line with these findings, we demonstrated in this study that inactivation of Agt gene significantly reduced the lipid accumulation during 3T3-L1 preadipocyte differentiation. This is also in agreement with a recent study where shRNA-mediated Agt gene silencing inhibited triglyceride storage during human visceral preadipocyte differentiation (Ye et al., 2010). Indeed, in these studies, the expression of Gpd1 gene which encodes glycerol-3-phosphate dehydrogenase 1 was increased in Ang II treated 3T3-L1 adipocytes (Jones et al., 1997b) but decreased by knockdown of the Agt gene in human preadipocytes. Consistently, we identified here that the expression of Gpd1 gene was decreased in 3T3-L1 adipocytes with Agt gene silencing. In this study, no change was detected in the gene expression of acetyl-coenzyme A carboxylase or fatty acid synthase, the major enzymes mediating de novo lipogenesis. Therefore, the lower lipid accumulation in 3T3-L1 adipocytes with Agt gene silencing is potentially due to the decreased synthesis of glycerol by Gpd1 in the process of lipogenesis. It is also possible that Agt gene silencing down-regulates the activity of lipogenic enzymes, and inhibits the de novo lipogenesis in 3T3-L1 adipocytes. Ang II was previously shown to inhibit preadipocyte differentiation, which was potentially mediated by the AT1 receptor. Similarly, certain AT1 blockers enhanced preadipocyte differentiation in both 3T3-L1 and human preadipocytes, and mice with systemic knock-out of AT1a receptor showed adipocyte hypotrophy (Janke et al., 2002, 2006; Schupp et al., 2004). However, in this study, we identified that Agt gene silencing inhibited 3T3-L1 preadipocyte differentiation through down-regulating the expression of core adipogenic genes (C/EBP-β and PPAR-γ) and other adipogenic markers (Srebf1 and Adig) which mediate the initiation of adipogenesis. Agt gene silencing also decreased the expression of several lipid metabolic genes (Fabp4 and Ppargc1b). Genes with anti-adipogenic effects (Gata3 and Vdr) were also up-regulated in Agt-shRNA transfected cells. These indicated Agt as a critical factor with stimulatory effects on preadipocyte differentiation. We propose that the effect of Ang II on adipogenesis is receptor specific, and dose dependent. Possibly, low to regular levels of Ang II stimulate adipogenesis through the AT2 receptor, which overcomes the anti-adipogenic effect mediated by the AT1 receptor. However, high levels of Ang II could activate the AT1 receptor and inhibit preadipocyte differentiation.
Our microarray study detected multiple genes associated with adipocyte metabolism which were down-regulated by Agt gene silencing. Retsat (encodes retinol saturase) is induced during 3T3-L1 preadipocyte differentiation and promotes adipogenesis through increased PPAR-γ transcriptional activity (Schupp et al., 2009).
Ang II is an active mediator of lipolysis in a time-dependent manner. Short term treatment of Ang II inhibits lipolysis in human adipose tissue and adipocytes through the AT1 receptor (Boschmann et al., 2001; Goossens et al., 2004, 2007). However, long term infusion of Ang II markedly increased lipolysis in rats (Cabassi et al., 2005). One explanation for this could be the Ces3 gene which encodes for carboxylesterase 3 (triacylglycerol hydrolase, TGH) – an adipocyte lipase – whose expression was decreased in 3T3-L1 adipocytes with Agt gene silencing.
Lastly, our microarray and RT-PCR data indicated that Agt gene widely affects the whole process of lipid metabolism in adipocytes. This was seen in the expression of other genes down-regulated by Agt gene silencing, such as Acad10, Apoc1, Suclg1, and Hsd3b7, which are involved in lipid transport, β oxidation, TCA cycle, and biosynthesis of steroid hormones from lipids.
RAS and Inflammation
While it has been established that obesity leads to chronic low-grade inflammation in adipose tissue (Kalupahana and Moustaid-Moussa, 2012a), the exact trigger for this process is unknown. Adipose tissue-secreted Agt has been shown to induce obesity-associated inflammation, a major factor for the pathogenesis of metabolic disorders, and therefore is a potential target for obesity research as described below (Kalupahana and Moustaid-Moussa, 2012b). In obesity, adipose tissue-derived Agt significantly increases the level of Agt in circulation (Van Harmelen et al., 2000; Boustany et al., 2004; Engeli et al., 2005). Moreover, our lab and collaborators further showed that adipose-specific Agt over-expression induced local and systemic inflammation, as well as insulin resistance in mice (Kalupahana et al., 2012).
Previous studies reported that Ang II stimulated the secretion of several pro-inflammatory adipokines from both 3T3-L1 and human adipocytes (Skurk et al., 2001, 2004). Consistent with those studies, we demonstrated here that Agt gene silencing in 3T3-L1 adipocytes significantly reduced the intracellular level of pro-inflammatory adipokines, including MCP-1, IL-6, and TNFα.
In the current research, the microarray study identified that Agt gene silencing decreased the expression of several genes involved in adipose inflammation including Saa3, Nod1, Stat1, and Cxcl12. Saa3, which encodes for the acute phase protein – serum amyloid A3, was recently identified as a critical pro-inflammatory adipokine involved in obesity-associated metabolic disorders (Yang et al., 2006). A previous study showed that blocking the AT1 receptor suppressed the mRNA expression of Saa3, together with TNF-a, PAI-1, and MCP-1 in mice adipose tissue (Kurata et al., 2006). The present study further confirmed that Saa3 as a critical factor involved in Ang II-induced inflammatory disorders, as silencing of Agt in cultured adipocytes reduced Saa3 expression.
Nod1 gene encodes an intracellular pattern recognition receptor mediating immune response. The activation of this receptor induces peripheral and hepatic insulin resistance, which is prevented when this gene in inactivated (Schertzer et al., 2011). Activation of NOD1 also increases pro-inflammatory adipokine secretion and impairs the insulin-stimulated glucose uptake in 3T3-L1 and primary murine adipocytes (Schertzer et al., 2011; Zhao et al., 2011). Since Agt silencing reduced NOD1, this suggests that Nod1 is a potential mediator for Ang II-induced adipocyte inflammation.
Stat1 is a member in the Stats family – the major component of Jak-Stat pathway which plays a critical role in mediating cytokine signaling. Jak-Stat pathway mediates the action of hormones which impact adipocyte development and functions (Richard and Stephens, 2011). Stats mediate the activation of multiple inflammatory pathways, such as NF-κB and c-Jun (O’Shea et al., 2002). The lowered expression of the Stat1 gene, in part, indicates that Agt gene silencing down-regulates the cytokine signaling in 3T3-L1 adipocytes. Interferon regulatory factors (Irfs), which mainly respond to interferon in the JAK-STAT signaling pathway (O’Shea et al., 2002; Eguchi et al., 2008), could be one avenue of this down-regulation. Previous studies reported that IFN-α/β induced a complex formation of STAT1, STAT2, and IRF9, one of the Irfs which are expressed in adipocytes (Eguchi et al., 2008). Together these indicate that Agt gene silencing induced a consistent change pattern in cytokine signaling pathway (O’Shea et al., 2002; Eguchi et al., 2008).
Several other chemokines were altered by Agt inactivation. These include Cxcl12 and Ptx3. Cxcl12 is mainly expressed in stromal cells, but is also detected in 3T3-L1 adipocytes (Choi et al., 2010). This indicates the potential role of this gene in inducing the immune cells infiltration in adipose tissue. The expression of Ptx3 gene is up-regulated during preadipocyte differentiation, and although almost non-detectable in mature adipocytes, it can be re-activated in 3T3-F442A adipocytes upon TNF-α stimulation (Abderrahim-Ferkoune et al., 2003). The decreased expression of Ptx3 gene in 3T3-L1 adipocytes with Agt gene silencing is potentially mediated by decreased adipogenesis and TNF-α (Abderrahim-Ferkoune et al., 2003).
Elevated level of RAS components was detected in adipose tissue and circulation in obese human subjects and animals (Van Harmelen et al., 2000; Boustany et al., 2004; Engeli et al., 2005). Animal models with systemic deletion of RAS components (Agt, renin, ACE, AT1a, and AT2) were protected from diet-induced obesity and metabolic disorders (Massiera et al., 2001b). Transgenic mice with Agt over-expression in adipose tissue exhibit adiposity, adipocyte hypertrophy, adipose and systemic inflammation, and insulin resistance (Kalupahana et al., 2012). However, mice with Agt gene specifically knock-out from adipose tissue had no change in fat mass or body weight (Yiannikouris et al., 2012). These indicate that elevated secretion of Agt from adipose tissue may in part mediate obesity-associated metabolic disorders.
In summary, this study showed that gene silencing induced lower adipocyte-derived-Agt, which led to decreased lipid accumulation and pro-inflammatory adipokines production, as well as down-regulated expression of adipogenic and lipid metabolic markers and genes in inflammatory pathways. The underlying mechanism for the metabolic effect of Ang II is summarized in Figure 6.
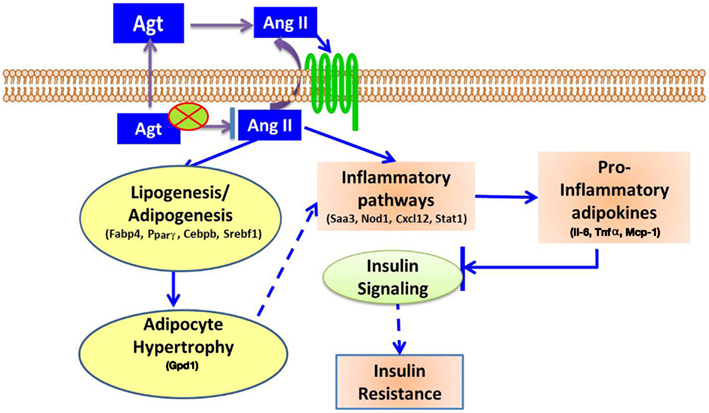
Figure 6. Proposed mechanisms for Ang II-induced metabolic disorders. Adipocyte-derived Agt is converted to Ang II which affects adipocytes in autocrine or paracrine manner through angiotensin receptors. Ang II activates inflammatory pathways, and increases the secretion of pro-inflammatory adipokines, which inhibit insulin signaling and induce insulin resistance. Ang II also stimulates lipogenesis in adipocytes, leading to adipocyte hypertrophy which potentially activates inflammatory pathways and exacerbates these inflammatory conditions.
Conflict of Interest Statement
The authors declare that the research was conducted in the absence of any commercial or financial relationships that could be construed as a potential conflict of interest.
Acknowledgments
This work was supported by the Physician Medical Education and Research Foundation, The University of Tennessee AgResearch, and The College of Human Sciences/Texas Tech University.
Footnotes
References
Abderrahim-Ferkoune, A., Bezy, O., Chiellini, C., Maffei, M., Grimaldi, P., Bonino, F., et al. (2003). Characterization of the long pentraxin PTX3 as a TNFα-induced secreted protein of adipose cells. J. Lipid Res. 44, 994–1000.
Ailhaud, G., Teboul, M., and Massiera, F. (2002). Angiotensinogen, adipocyte differentiation and fat mass enlargement. Curr. Opin. Clin. Nutr. Metab. Care 5, 385–389.
Boschmann, M., Ringel, J., Klaus, S., and Sharma, A. M. (2001). Metabolic and hemodynamic response of adipose tissue to angiotensin II. Obes. Res. 9, 486–491.
Boustany, C. M., Bharadwaj, K., Daugherty, A., Brown, D. R., Randall, D. C., and Cassis, L. A. (2004). Activation of the systemic and adipose renin-angiotensin system in rats with diet-induced obesity and hypertension. Am. J. Physiol. Regul. Integr. Comp. Physiol. 287, R943–R949.
Cabassi, A., Coghi, P., Govoni, P., Barouhiel, E., Speroni, E., Cavazzini, S., et al. (2005). Sympathetic modulation by carvedilol and losartan reduces angiotensin II-mediated lipolysis in subcutaneous and visceral fat. J. Clin. Endocrinol. Metab. 90, 2888–2897.
Choi, S., Kim, J., Yea, K., Suh, P. G., Kim, J., and Ryu, S. H. (2010). Targeted label-free quantitative analysis of secretory proteins from adipocytes in response to oxidative stress. Anal. Biochem. 401, 196–202.
Eguchi, J., Yan, Q. W., Schones, D. E., Kamal, M., Hsu, C. H., Zhang, M. Q., et al. (2008). Interferon regulatory factors are transcriptional regulators of adipogenesis. Cell Metab. 7, 86–94.
Engeli, S., Bohnke, J., Gorzelniak, K., Janke, J., Schling, P., Bader, M., et al. (2005). Weight loss and the renin-angiotensin-aldosterone system. Hypertension 45, 356–362.
Engeli, S., Negrel, R., and Sharma, A. M. (2000). Physiology and pathophysiology of the adipose tissue renin-angiotensin system. Hypertension 35, 1270–1277.
Galvez-Prieto, B., Bolbrinker, J., Stucchi, P., de Las Heras, A. I., Merino, B., Arribas, S., et al. (2008). Comparative expression analysis of the renin-angiotensin system components between white and brown perivascular adipose tissue. J. Endocrinol. 197, 55–64.
Goossens, G. H., Blaak, E. E., Arner, P., Saris, W. H., and van Baak, M. A. (2007). Angiotensin II: a hormone that affects lipid metabolism in adipose tissue. Int. J. Obes. (Lond.) 31, 382–384.
Goossens, G. H., Blaak, E. E., Saris, W. H. M., and van Baak, M. A. (2004). Angiotensin II-induced effects on adipose and skeletal muscle tissue blood flow and lipolysis in normal-weight and obese subjects. J. Clin. Endocrinol. Metab. 89, 2690–2696.
Janke, J., Engeli, S., Gorzelniak, K., Luft, F. C., and Sharma, A. M. (2002). Mature adipocytes inhibit in vitro differentiation of human preadipocytes via angiotensin type 1 receptors. Diabetes 51, 1699–1707.
Janke, J., Schupp, M., Engeli, S., Gorzelniak, K., Boschmann, M., Sauma, L., et al. (2006). Angiotensin type 1 receptor antagonists induce human in-vitro adipogenesis through peroxisome proliferator-activated receptor-gamma activation. J. Hypertens. 24, 1809–1816.
Jones, B. H., Standridge, M. K., Taylor, J. W., and Moustaïd, N. (1997a). Angiotensinogen gene expression in adipose tissue: analysis of obese models and hormonal and nutritional control. Am. J. Physiol. 273(1 Pt 2): R236–R242.
Jones, B. H., Standridge, M. K., and Moustaid, N. (1997b). Angiotensin II increases lipogenesis in 3T3-L1 and human adipose cells. Endocrinology 138, 1512–1519.
Kalupahana, N. S., Massiera, F., Quignard-Boulange, A., Ailhaud, G., Voy, B. H., Wasserman, D. H., et al. (2012). Overproduction of angiotensinogen from adipose tissue induces adipose inflammation, glucose intolerance, and insulin resistance. Obesity (Silver Spring) 20, 48–56.
Kalupahana, N. S., and Moustaid-Moussa, N. (2012a). The renin-angiotensin system: a link between obesity, inflammation and insulin resistance. Obes. Rev. 13, 136–149.
Kalupahana, N. S., and Moustaid-Moussa, N. (2012b). The adipose tissue renin-angiotensin system and metabolic disorders: a review of molecular mechanisms. Crit. Rev. Biochem. Mol. Biol. 47, 379–390.
Karlsson, C., Lindell, K., Ottosson, M., Sjostrom, L., Carlsson, B., and Carlsson, L. M. (1998). Human adipose tissue expresses angiotensinogen and enzymes required for its conversion to angiotensin II. J. Clin. Endocrinol. Metab. 83, 3925–3929.
Kim, S., Urs, S., Massiera, F., Wortman, P., Joshi, R., Heo, Y. R., et al. (2002). Effects of high-fat diet, angiotensinogen (agt) gene inactivation, and targeted expression to adipose tissue on lipid metabolism and renal gene expression. Horm. Metab. Res. 34, 721–725.
Kurata, A., Nishizawa, H., Kihara, S., Maeda, N., Sonoda, M., Okada, T., et al. (2006). Blockade of Angiotensin II type-1 receptor reduces oxidative stress in adipose tissue and ameliorates adipocytokine dysregulation. Kidney Int. 70, 1717–1724.
Massiera, F., Bloch-Faure, M., Ceiler, D., Murakami, K., Fukamizu, A., Gasc, J. M., et al. (2001a). Adipose angiotensinogen is involved in adipose tissue growth and blood pressure regulation. FASEB J. 15, 2727–2729.
Massiera, F., Seydoux, J., Geloen, A., Quignard-Boulange, A., Turban, S., Saint-Marc, P., et al. (2001b). Angiotensinogen-deficient mice exhibit impairment of diet-induced weight gain with alteration in adipose tissue development and increased locomotor activity. Endocrinology 142, 5220–5225.
O’Shea, J. J., Gadina, M., and Schreiber, R. D. (2002). Cytokine signaling in 2002: new surprises in the jak/stat pathway. Cell 109 (Suppl. 1), S121–S131.
Ouchi, N., Parker, J. L., Lugus, J. J., and Walsh, K. (2011). Adipokines in inflammation and metabolic disease. Nat. Rev. Immunol. 11, 85–97.
Pollare, T., Lithell, H., and Berne, C. (1989). A comparison of the effects of hydrochlorothiazide and captopril on glucose and lipid metabolism in patients with hypertension. N. Engl. J. Med. 321, 868–873.
Richard, A. J., and Stephens, J. M. (2011). Emerging roles of JAK–STAT signaling pathways in adipocytes. Trends Endocrinol. Metab. 22, 325–332.
Schertzer, J. D., Tamrakar, A. K., Magalhaes, J. G., Pereira, S., Bilan, P. J., Fullerton, M. D., et al. (2011). NOD1 activators link innate immunity to insulin resistance. Diabetes 60, 2206–2215.
Schupp, M., Janke, J., Clasen, R., Unger, T., and Kintscher, U. (2004). Angiotensin type 1 receptor blockers induce peroxisome proliferator-activated receptor-gamma activity. Circulation 109, 2054–2057.
Schupp, M., Lefterova, M. I., Janke, J., Leitner, K., Cristancho, A. G., Mullican, S. E., et al. (2009). Retinol saturase promotes adipogenesis and is downregulated in obesity. Proc. Natl. Acad. Sci. U.S.A. 106, 1105–1110.
Siriwardhana, N., Kalupahana, N. S., Fletcher, S., Xin, W., Claycombe, K. J., Quignard-Boulange, A., et al. (2012). n-3 and n-6 polyunsaturated fatty acids differentially regulate adipose angiotensinogen and other inflammatory adipokines in part via NF-κB-dependent mechanisms. J. Nutr. Biochem. 23, 1661–1667.
Skurk, T., Lee, Y. M., and Hauner, H. (2001). Angiotensin II and its metabolites stimulate PAI-1 protein release from human adipocytes in primary culture. Hypertension 37, 1336–1340.
Skurk, T., van Harmelen, V., and Hauner, H. (2004). Angiotensin II stimulates the release of interleukin-6 and interleukin-8 from cultured human adipocytes by activation of NF-kappaB. Arterioscler. Thromb. Vasc. Biol. 24, 1199–1203.
Van Harmelen, V., Ariapart, P., Hoffstedt, J., Lundkvist, I., Bringman, S., and Arner, P. (2000). Increased adipose angiotensinogen gene expression in human obesity. Obes. Res. 8, 337–341.
Yang, R. Z., Lee, M. J., Hu, H., Pollin, T. I., Ryan, A. S., Nicklas, B. J., et al. (2006). Acute-phase serum amyloid a: an inflammatory adipokine and potential link between obesity and its metabolic complications. PLoS Med. 3:e287. doi:10.1371/journal.pmed.0030287
Ye, Z. W., Wu, X. M., and Jiang, J. G. (2010). Knockdown of angiotensinogen by shRNA-mediated RNA interference inhibits human visceral preadipocytes differentiation. Int. J. Obes. (Lond.) 34, 157–164.
Yiannikouris, F., Karounos, M., Charnigo, R., English, V. L., Rateri, D. L., Daugherty, A., et al. (2012). Adipocyte-specific deficiency of angiotensinogen decreases plasma angiotensinogen concentration and systolic blood pressure in mice. Am. J. Physiol. Regul. Integr. Comp. Physiol. 302, R244–R251.
Yvan-Charvet, L., Massiera, F., Lamande, N., Ailhaud, G., Teboul, M., Moustaid-Moussa, N., et al. (2009). Deficiency of angiotensin type 2 receptor rescues obesity but not hypertension induced by overexpression of angiotensinogen in adipose tissue. Endocrinology 150, 1421–1428.
Zhao, L., Hu, P., Zhou, Y., Purohit, J. S., and Hwang, D. H. (2011). NOD1 activation induces proinflammatory gene expression and insulin resistance in 3T3-L1 adipocytes. Am. J. Physiol. Endocrinol. Metab. 301, E587–E598.
Appendix
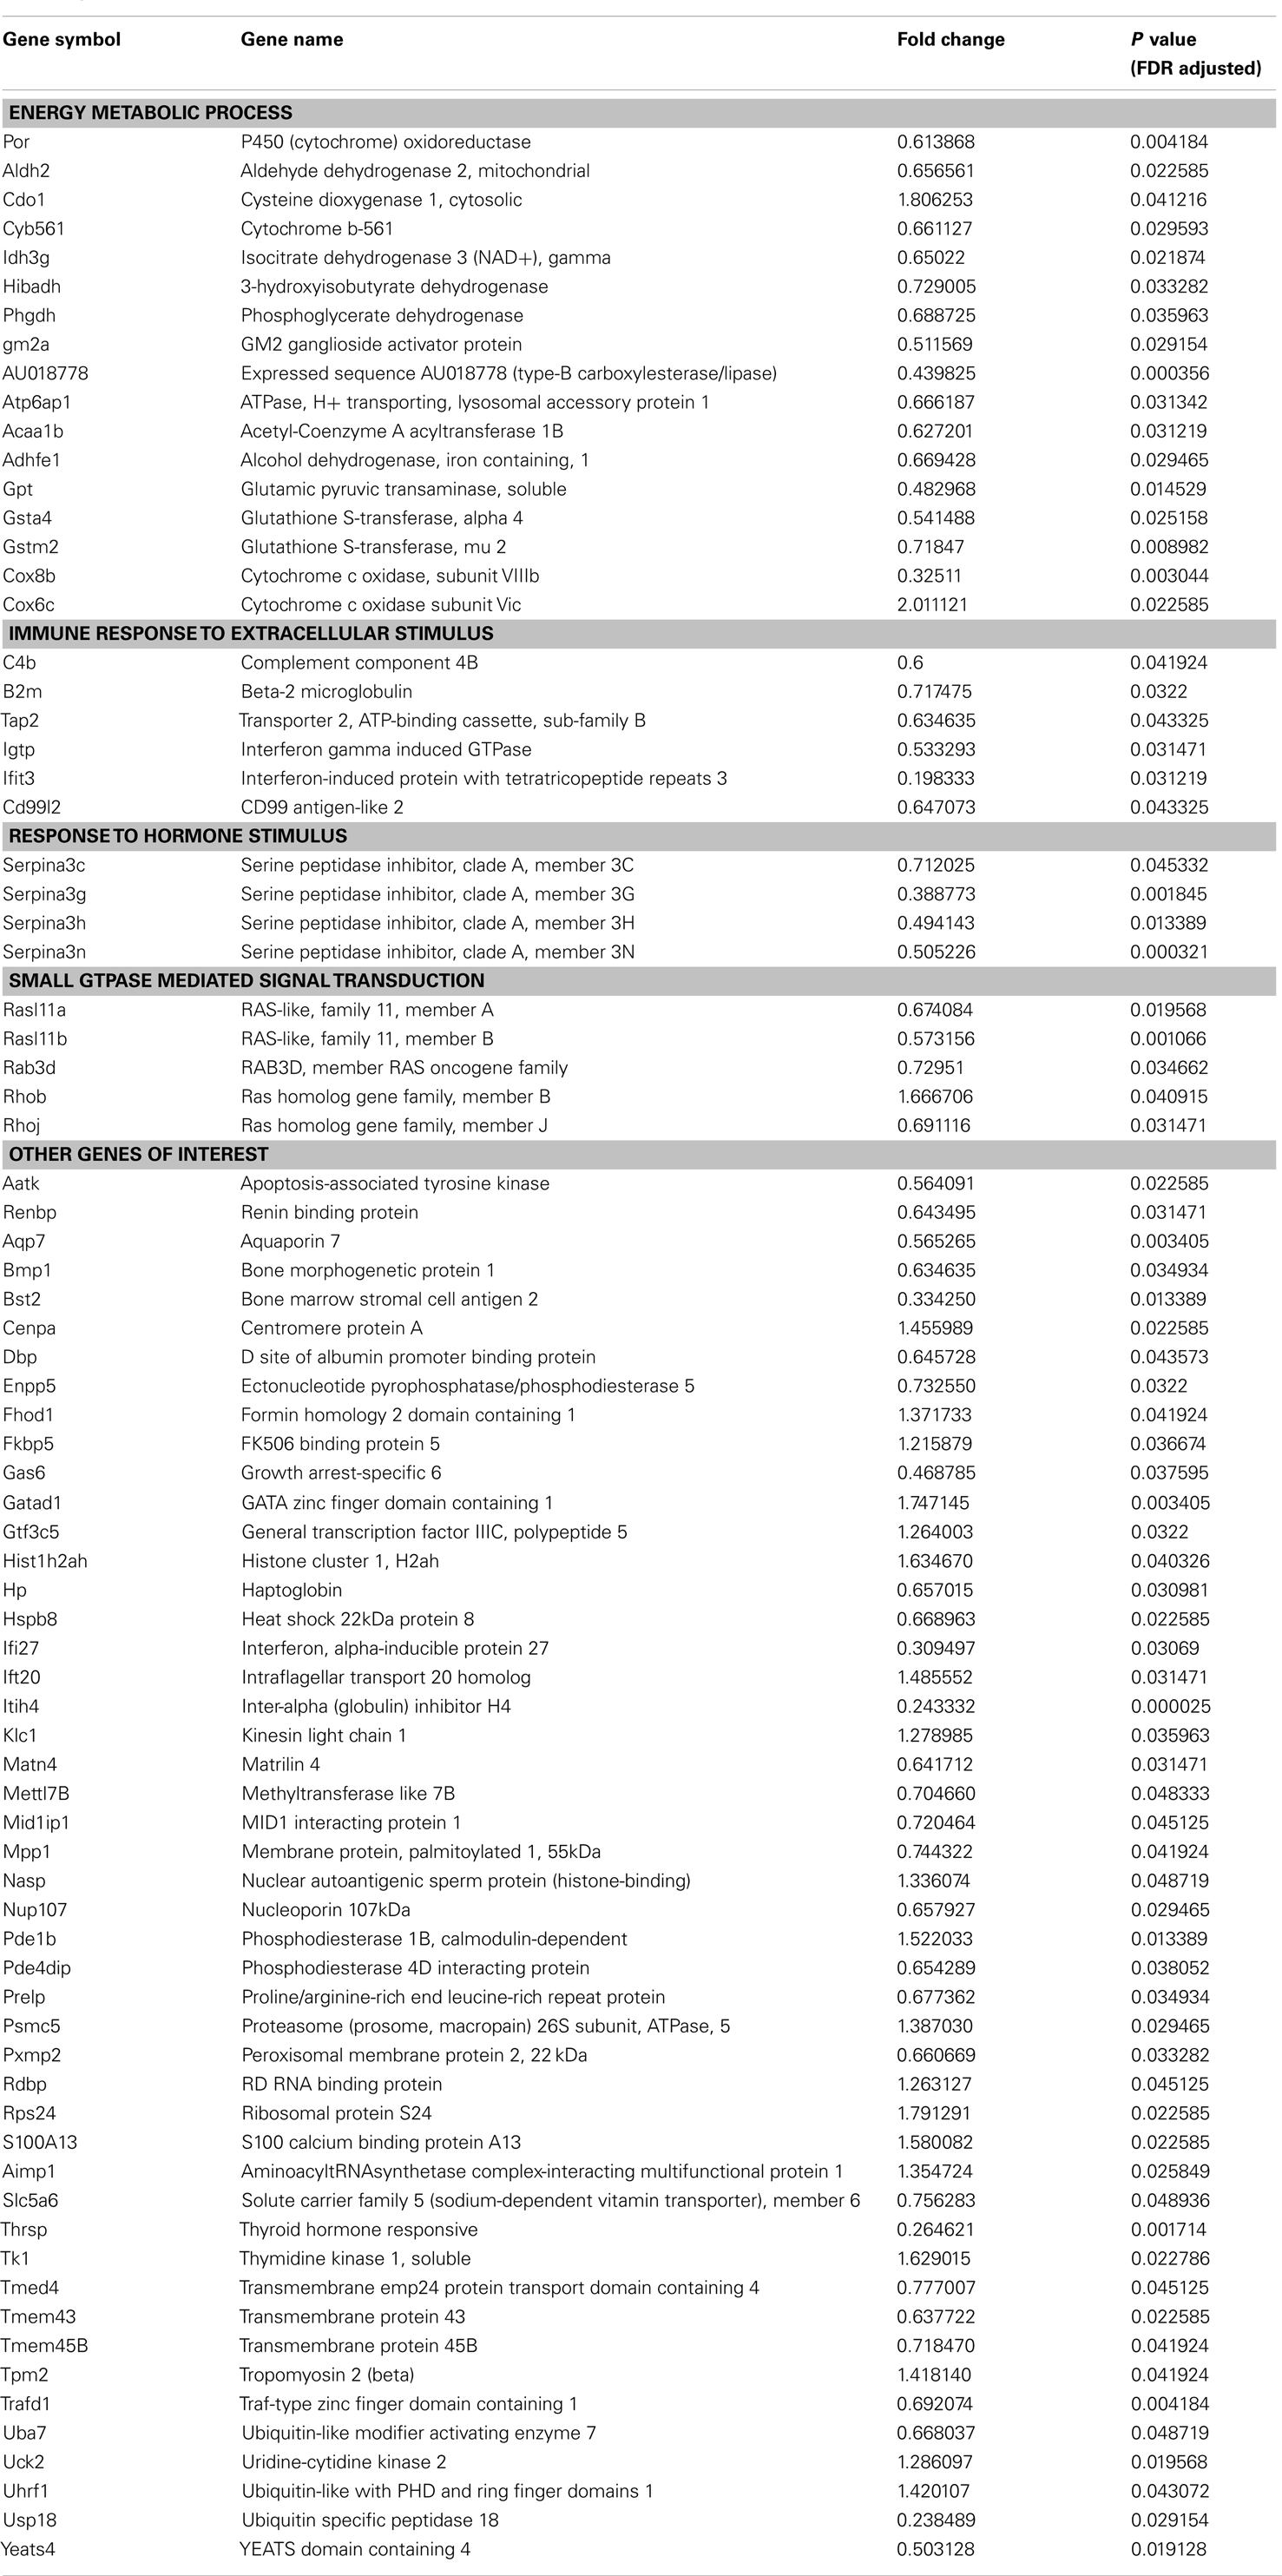
Table A1. Genes differentially expressed in 3T3-L1 adipocytes transfected with Agt-shRNA vs. Sc-shRNA.
Keywords: angiotensinogen, gene silencing, inflammation, adipocytes, adipokines, adipogenesis
Citation: Carroll WX, Kalupahana NS, Booker SL, Siriwardhana N, LeMieux M, Saxton AM and Moustaid-Moussa N (2013) Angiotensinogen gene silencing reduces markers of lipid accumulation and inflammation in cultured adipocytes. Front. Endocrinol. 4:10. doi: 10.3389/fendo.2013.00010
Received: 17 November 2012; Accepted: 28 January 2013;
Published online: 11 March 2013.
Edited by:
Tsuguhito Ota, Kanazawa University, JapanReviewed by:
Subrata Chakrabarti, The University of Western Ontario, CanadaPo Sing Leung, The Chinese University of Hong Kong, China
Copyright: © 2013 Carroll, Kalupahana, Booker, Siriwardhana, LeMieux, Saxton and Moustaid-Moussa. This is an open-access article distributed under the terms of the Creative Commons Attribution License, which permits use, distribution and reproduction in other forums, provided the original authors and source are credited and subject to any copyright notices concerning any third-party graphics etc.
*Correspondence: Naima Moustaid-Moussa, Nutritional Sciences Program, College of Human Sciences, Texas Tech University, 1301 Akron Street, Lubbock, TX 79409, USA. e-mail:bmFpbWEubW91c3RhaWQtbW91c3NhQHR0dS5lZHU=