 Soetkin Versteyhe1*
 Birgit Klaproth1†
 Rehannah Borup2
 Jane Palsgaard1† Maja Jensen1† Steven G. Gray1,3
 Pierre De Meyts1†
- 1Receptor Systems Biology Laboratory, Hagedorn Research Institute, Novo Nordisk A/S, Gentofte, Denmark
- 2Genomic Medicine, Microarray Center, Copenhagen University Hospital, Copenhagen, Denmark
- 3Thoracic Oncology Research Group, Trinity Centre for Health Sciences, Institute of Molecular Medicine, St. James’s Hospital, Dublin, Ireland
Insulin and the insulin-like growth factors (IGF)-I and -II are closely related peptides important for regulation of metabolism, growth, differentiation, and development. The IGFs exert their main effects through the IGF-I receptor. Although the insulin receptor is the main physiological receptor for insulin, this peptide hormone can also bind at higher concentrations to the IGF-I receptor and exert effects through it. We used microarray gene expression profiling to investigate the gene expression regulated by IGF-I, IGF-II, and insulin after stimulation of the IGF-I receptor. Fibroblasts from mice, knockout for IGF-II and the IGF-II/cation-independent mannose-6-phosphate receptor, and expressing functional IGF-I but no insulin receptors, were stimulated for 4 h with equipotent saturating concentrations of insulin, IGF-I, and IGF-II. Each ligand specifically regulated a group of transcripts that was not regulated by the other two ligands. Many of the functions and pathways these regulated genes were involved in, were consistent with the known biological effects of these ligands. The differences in gene expression might therefore account for some of the different biological effects of insulin, IGF-I, and IGF-II. This work adds to the evidence that not only the affinity of a ligand determines its biological response, but also its nature, even through the same receptor.
Introduction
Insulin and the closely related insulin-like growth factors (IGF)-I and -II are important for the regulation of metabolism and cell growth, survival, motility, differentiation, and development (1–6). These ligands bind to closely related receptor tyrosine kinases. The main physiological receptor for insulin is the insulin receptor, while the IGFs mainly exert their effects through the IGF-I receptor (7, 8). The insulin receptor exists under two isoforms, A and B, due to alternative splicing of exon 11 of the insulin receptor gene (9, 10).
Insulin-like growth factor-II in mammals also binds to the IGF-II/cation-independent mannose-6-phosphate receptor, which is thought to act as a scavenger for IGF-II rather than a signaling receptor (11, 12). Its presence on most cells however complicates the study of IGF-II binding and signaling mediated through the IGF-I receptor.
Binding of the ligands to the insulin or IGF-I receptor leads to autophosphorylation of the receptor on tyrosine residues. This creates binding sites for SH2 and PTB domain-containing docking proteins such as IRS-1–4 and Shc, and stimulates the tyrosine kinase activity of the receptor, enabling it to phosphorylate multiple cytoplasmic substrates, which activates signaling cascades, resulting in ligand-specific biological effects (4, 13).
Both the ligands and the receptors are closely related (and therefore the ligands can bind to their non-cognate receptors) and the signaling pathways they activate are largely overlapping (14). Microarray profiling showed that the two receptors are capable of stimulating the same gene expression response (15). Nevertheless, insulin is mainly a metabolic regulator, while the IGFs exert mainly mitogenic effects (growth, proliferation …). The molecular basis of this signaling specificity is still not understood (6, 16).
As mentioned, the three ligands can also bind to their non-cognate receptors, though with lower affinity, and by doing so they can exert different effects in comparison to the cognate ligand. Frasca et al. and Morrione et al., e.g., showed independently that IGF-II is more potent in stimulating proliferation through the insulin receptor A isoform than insulin (17, 18). Frasca et al. also showed that insulin is a more potent metabolic regulator through this isoform than IGF-II (17). Pandini et al. found that insulin and IGF-II induce different gene expression patterns after binding to the A isoform of the insulin receptor (19). Malaguarnera et al. found that proinsulin binds with high affinity the insulin receptor isoform A and predominantly activates the mitogenic pathway (20). Also, insulin analogs with different residence times on the insulin receptor have been shown to have different relative potencies for mitogenic versus metabolic signaling (21–23). Previous work from our laboratory has described an insulin mimetic peptide that despite binding to the insulin receptor with an affinity similar to insulin’s is less potent in stimulating thymidine incorporation and induces a different gene expression response in comparison to insulin (24). All in all, it is becoming increasingly clear that various ligands acting through the same receptor may activate different patterns of end-point cellular effects (“differential signaling”).
In this study we measured gene expression by microarray profiling after stimulating mouse fibroblasts expressing the IGF-I receptor, but devoid of insulin and IGF-II/cation-independent mannose-6-phosphate receptors (25) with equipotent concentrations of insulin, IGF-I, and IGF-II. During the analysis the focus was on finding differences, rather than similarities, in gene expression between the three ligands. The results show that insulin, IGF-I, and IGF-II indeed create different gene expression responses when stimulating the IGF-I receptor. We hope that these results and further studies will lead to a better understanding of the signaling specificity and different biological effects of these three ligands.
Materials and Methods
Materials
Fibroblasts from mice knockout for IGF-II and the IGF-II/cation-independent mannose-6-phosphate receptor were a gift from Dr. Kurt von Figura (25). Insulin was from Novo Nordisk A/S, Denmark, and IGF-I and IGF-II from Novozymes GroPep, Thebarton, SA, Australia. 125I-IGF-I was prepared by Novo Nordisk A/S. Unless otherwise specified all chemicals were from Sigma-Aldrich, Denmark.
Cell Line and Culture Conditions
The mouse fibroblasts were routinely cultured in 80 cm2 TC flasks (Nunc, Denmark) in DMEM medium (with Glutamax-1 and 4.5 g/l glucose; Gibco, Invitrogen, Denmark) supplemented with 10% Fetal Bovine Serum (Gibco, Invitrogen, Denmark), 100 U/ml Penicillin, and 100 μg/ml Streptomycin (Gibco, Invitrogen, Denmark). The cells were grown at 37°C in a 5% CO2 humidified atmosphere. They were passaged three times a week by washing in D-PBS (w/o Calcium and Magnesium; Gibco, Invitrogen, Denmark), trypsinization in Trypsin-EDTA (Gibco, Invitrogen, Denmark), and subsequent resuspension and dilution in fresh medium.
The mouse fibroblasts, devoid of IGF-II and the IGF-II/cation-independent mannose-6-phophate receptor, did not bind 125I-insulin, indicating the absence of biologically active insulin receptors (results not shown), but did bind 125I-IGF-I. From the below mentioned homologous competition assay data, we found that approximately 75,000 IGF-I receptor sites/cell are present on this cell line.
Determining the Affinities of IGF-I, IGF-II, and Insulin for the IGF-I Receptor
To determine the apparent affinities of the ligands for the IGF-I receptor on the mouse fibroblast cell line, homologous and heterologous radioligand competition assays were performed in quadruplets. Cells were detached with 10 mM EDTA (Gibco, Invitrogen, Denmark). Three million cells per milliliter were incubated with a constant concentration of 125I-IGF-I (20,000 cpm/ml) and increasing concentrations of cold IGF-I, IGF-II, or insulin for 2.5 h (time needed to reach steady-state binding) at 15°C in Hepes Binding Buffer (100 mM Hepes, 120 mM NaCl, 5 mM KCl, 1.2 mM MgSO4, 1 mM EDTA, 10 mM Glucose, 15 mM Na Acetate, and 1% BSA). After centrifugation unbound 125I-IGF-I was removed and cell-bound 125I-IGF-I was counted in a Wallac WIZARD gamma counter (PerkinElmer). Kd values were calculated after fitting the data to a one-site model using a program developed in our laboratory by Ronald M. Shymko and Andreas V. Groth.
Preparation of the Cells for the Microarray Experiments
Mouse fibroblasts were seeded out into 145 cm2 TC dishes (Nunc, Denmark) at two million cells per dish and subsequently allowed to recover for 24 h. In quadruplets, but at the same cell passage and after washing the cells twice with D-PBS (w/o Calcium and Magnesium; Gibco, Invitrogen, Denmark), the cells were serum starved for 24 h and afterward either left unstimulated or stimulated for 4 h with 20 nM IGF-I, 177 nM IGF-II, or 5168 nM insulin. These concentrations compensate for the relative affinities of the ligands for the receptor, measured as described above.
Isolation and Purification of Total RNA
Total RNA was isolated by using the TRI® reagent method (Molecular Research Gene, USA) and cleaned up using the RNeasy™ Mini Kit (Qiagen) according to the manufacturers’ protocol. RNA quality was verified by 1% agarose gel electrophoresis. Concentration and purity were determined by measuring absorbance at A260 and A280 in a spectrophotometer (Brinkmann Eppendorf BioPhotometer, Germany).
cRNA Generation and Hybridization to Gene Chip Microarrays
cRNA was produced using the One-cycle Target Labeling Kit (Affymetrix, Santa Clara, CA, USA). One-cycle Target Labeling Kit and procedures followed protocols in the GeneChip Expression Analysis Technical Manual (Affymetrix, Santa Clara, CA, USA). Fragmented biotin-labeled cRNA was hybridized to Affymetrix GeneChip® Mouse Genome 430 2.0 Arrays according to manufacturer’s protocol. The arrays were incubated at 45°C for 16 h under rotation (60 rpm), washed in the GeneChip® Fluidics Station (Affymetrix) and scanned using the GeneChip® Scanner 3000.
Data Analysis
The quality of the arrays was verified by quality control in the R package1 from Bioconductor2. The probe level data (CEL files) were transformed into expression values using R and the GC-RMA package from Bioconductor (see text footnote 2) (26). Briefly, the background was subtracted, the data were normalized by the quantile normalization method and the expression values of a probe set were summarized into one expression value.
For data analysis, the expression values were imported into the software package DNA-Chip Analyzer (dChip) (version 2008), freeware developed by Li and Wong (27)3. When generating original lists of transcripts, a fold change and p-value cut-off of respectively 1.2 and 0.05 were chosen. The lower confidence bound of fold changes was used for filtering and the threshold for absolute difference between two group means was set to 35. Using these cut-offs gave empirical median false discovery rates (FDR) of maximum 2% after running 100 permutations in dChip (FDRs were 0% for all but the lists of genes regulated by insulin, IGF-I, or IGF-II in comparison to the control). dChip recommends a median FDR of ¡5 or 10%. Composing a list of transcripts regulated by insulin, IGF-I, and IGF-II together or separately was done by selecting transcripts that fulfilled the above-mentioned criteria for the ligands in comparison to the control. In order to generate lists containing transcripts only regulated by one of the ligands, transcripts were selected that fulfilled the criteria for one of the ligands in comparison to the control and in comparison to the two other ligands. Transcripts that also fulfilled the criteria for one of the other ligands in comparison to the control were excluded. The resulting transcripts, uniquely regulated by one of the ligands, were afterward filtered for a fold change of 1.5 in comparison to the control, in order to focus the below mentioned functional analysis on the transcripts with the highest biological relevance. In order to study differences between one ligand and the two other ligands as a group, transcripts were selected that fulfilled the criteria for the two ligands in comparison to the control and to the other ligand. The resulting transcripts were afterward filtered for a fold change of 1.5 in comparison to the control, in order to focus the below mentioned functional analysis on the transcripts with the highest biological relevance.
Identification of gene function themes and canonical pathways was done using the web-based software Ingenuity Pathways Analysis (IPA)4. IPA takes the gene IDs in the dataset file and maps them to genes in the Ingenuity Pathways Knowledge Base (IPKB). The functional and canonical pathway analyses identified the molecular and cellular functions and canonical pathways that were most significant to the data set. This significance value is a measure for how likely it is that genes from the dataset file under investigation participate in that function. In this method, the p-value is calculated by comparing the number of user-specified genes of interest that participate in a given function or pathway, relative to the total number of occurrences of these genes in all functional/pathway annotations stored in the IPKB. Ingenuity uses a right-tailed Fisher’s Exact Test in order to calculate a p-value. In the right-tailed Fisher’s Exact Test, only over-represented functional/pathway annotations, annotations which have more Functions/Canonical Pathways Analysis Genes than expected by chance (“right-tailed” annotations), are used.
Preparation of Total RNA for qRT-PCR
To validate the microarray data two-step RT-PCR was performed on a subset of genes. To perform the validation on biological replicates, new (in comparison to the RNA used for the arrays) total RNA samples were prepared at three different cell passages.
qRT-PCR
The total RNA was reverse transcribed into single-stranded cDNA using the Transcriptor First Strand cDNA Synthesis Kit (Roche Applied Science) according to the manufacturer’s protocol. The cDNA was transcribed using FastStart TaqMan Probe Master (Rox) (Roche Applied Science). Probes were purchased from Universal ProbeLibrary (Roche). Probes were selected and primer sequences designed using the ProbeFinder software (Universal ProbeLibrary, Roche). The primers were purchased from DNA-technologies, Denmark. Primers and probes used are listed in Table 1. Per qRT-PCR assay the cDNA samples were run in quadruplets with 18S as the internal control gene, in 384-well optical plates on an ABI 7900HT Prism sequence detection system (Applied Biosystems). Each 15 μl TaqMan reaction contained 1.5 μl cDNA, 7.5 μl 2× FastStart TaqMan Probe Master (Rox), 0.15 μl Universal Probe (10 μM), 0.15 μl left primer (20 μM), 0.15 μl right primer (20 μM), and 5.55 μl PCR-grade water. PCR parameters were 50°C for 2 min, 95°C for 10 min, 40 cycles of 95°C for 15 s, and 60°C for 1 min. For each gene and for each biological replicate TaqMan PCR assays were performed in triplicates. The data were analyzed using Sequence Detector Software (Applied Biosystems), where after the fold changes were calculated by use of the ΔΔCt method (28). To compare the qRT-PCR data with the microarray results, negative microarray fold changes were converted into values between 0 and 1. When multiple probe sets for one gene were regulated on the microarrays, the average fold change was calculated. Significant differences in the qRT-PCR data were calculated by a two-tailed t-test.
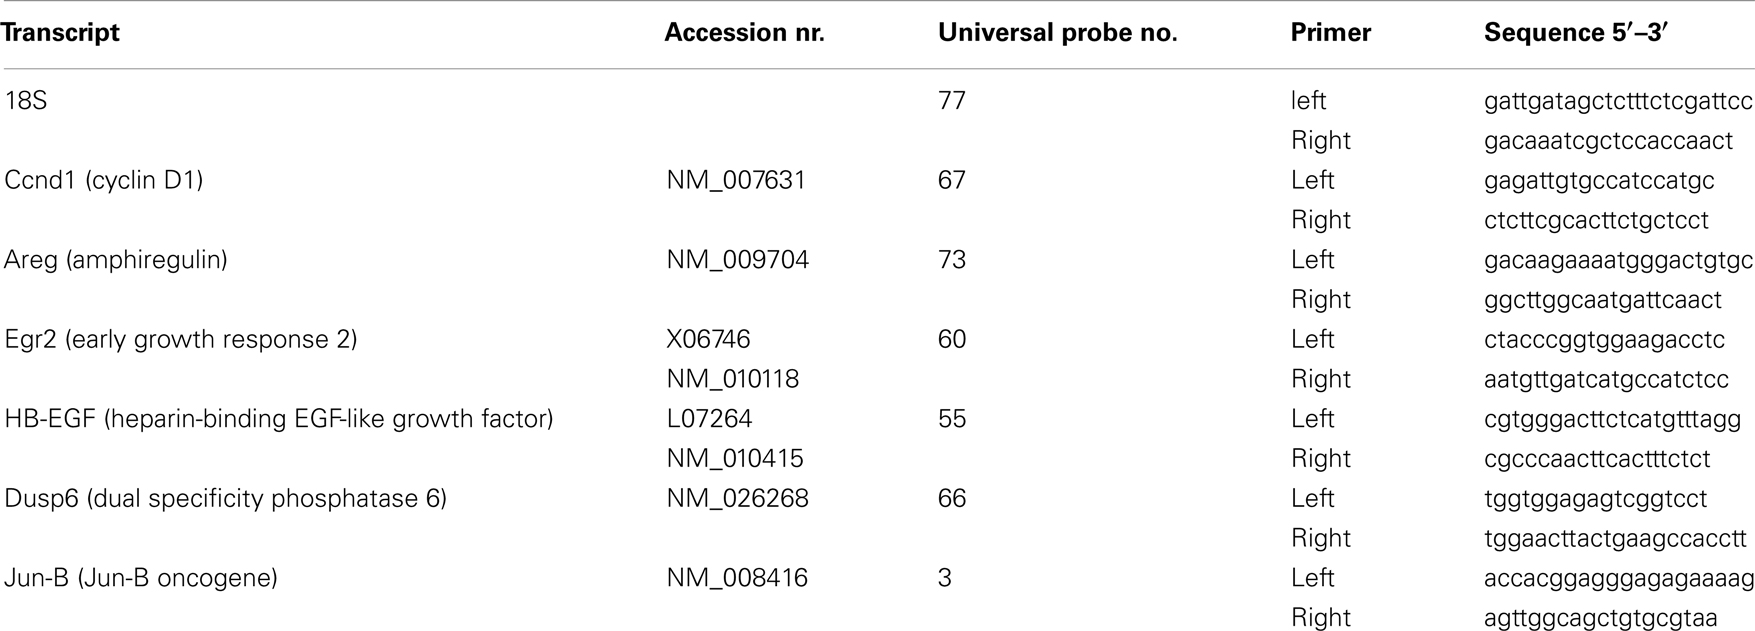
Table 1. Primers and probes used for qRT-PCR.
Results
Affinities of IGF-I, IGF-II, and Insulin for the IGF-I Receptor
In order to stimulate the IGF-I receptor on mouse fibroblasts with concentrations that are adjusted for the relative affinities of IGF-I, IGF-II, and insulin for the receptor, the apparent affinities of the three ligands were measured by allowing the cold ligands to compete with 125I-IGF-I for binding to the IGF-I receptor (Figure 1). IGF-I had a Kd value of 1.49 ± 0.14 nM, IGF-II a Kd value of 13.11 ± 0.69 nM, and insulin of 383 ± 27 nM. These results are in accordance with the known relative affinities of the ligands for the IGF-I receptor (29). Taking these relative affinities into account, it was decided to stimulate the cells for 4 h with 20 nM IGF-I, 177 nM IGF-II, or 5168 nM insulin, concentrations then are near saturation of the receptor with either ligand.
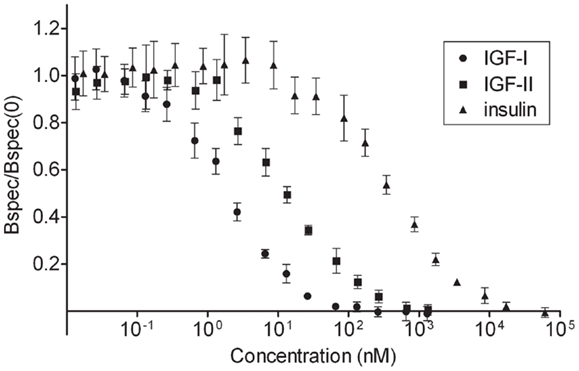
Figure 1. Affinities of insulin, IGF-I, and IGF-II for the IGF-I receptor. To determine the apparent affinities of the ligands for the IGF-I receptor on the mouse fibroblasts, homologous and heterologous radioligand competition assays were performed in quadruplets. Three million cells/ml were incubated with a constant concentration of 125I-IGF-I (20,000 cpm/ml) and increasing concentrations of cold IGF-I, IGF-II, or insulin for 2.5 h (time needed to reach steady-state binding) at 15°C. After centrifugation unbound 125I-IGF-I was removed and bound 125I-IGF-I was counted in a gamma counter. Specifically bound 125I-IGF-I/specifically bound 125I-IGF-I at 0 nM cold ligand was plotted versus the concentration of cold ligand. Kd values were calculated after fitting the data to a one-site model using a program developed by Ron M. Shymko and Andreas V. Groth. Results are averages ± standard deviations.
Global Gene Regulation Patterns
A total of 698 transcripts were regulated by both insulin and the IGFs (fold changes and p-values for these transcripts are in Table S1 in Supplementary Material). Table 2 shows the number of transcripts regulated by each ligand in comparison to the control and the number of transcripts commonly regulated between ligands. Fold changes and p-values for these transcripts can be found in Table S2 in Supplementary Material (IGF-I), Table S3 in Supplementary Material (IGF-II), and Table S4 in Supplementary Material (insulin). All the transcripts regulated in common between ligands were either up-regulated by all regulating ligands or down-regulated by all regulating ligands. Even though the three ligands stimulate similar responses, the overlap is partial and we identified transcripts selectively regulated by each ligand.
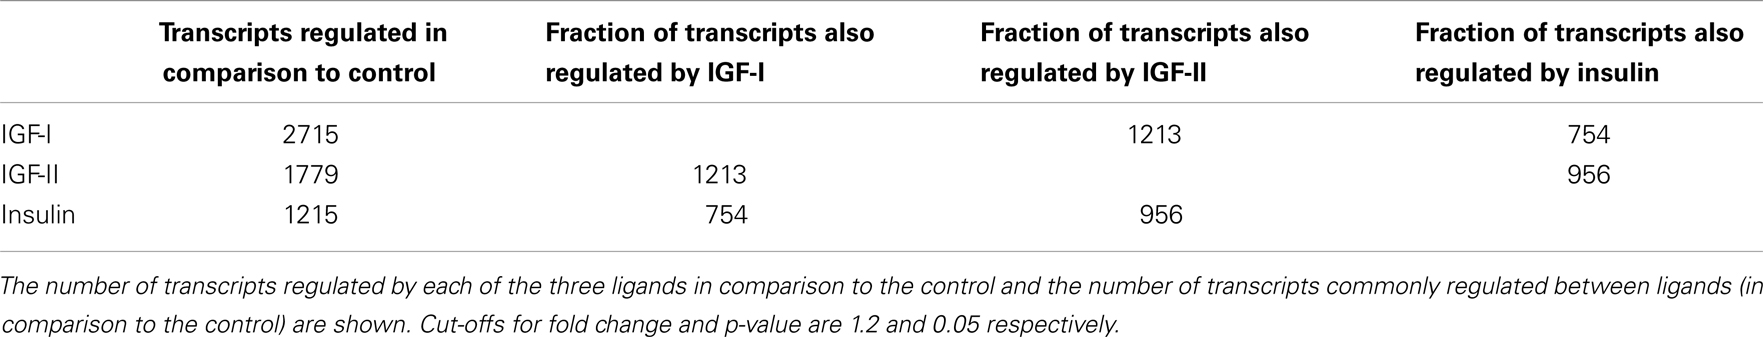
Table 2. Global gene regulation patterns.
Transcripts Selectively Regulated by IGF-I, IGF-II, or Insulin
Transcripts selectively regulated by IGF-I
A total of 75 transcripts were only regulated by IGF-I (Table 3; fold change cut-off 1.5). Fold changes and p-values for insulin and IGF-II can be found in Table S5 in Supplementary Material.
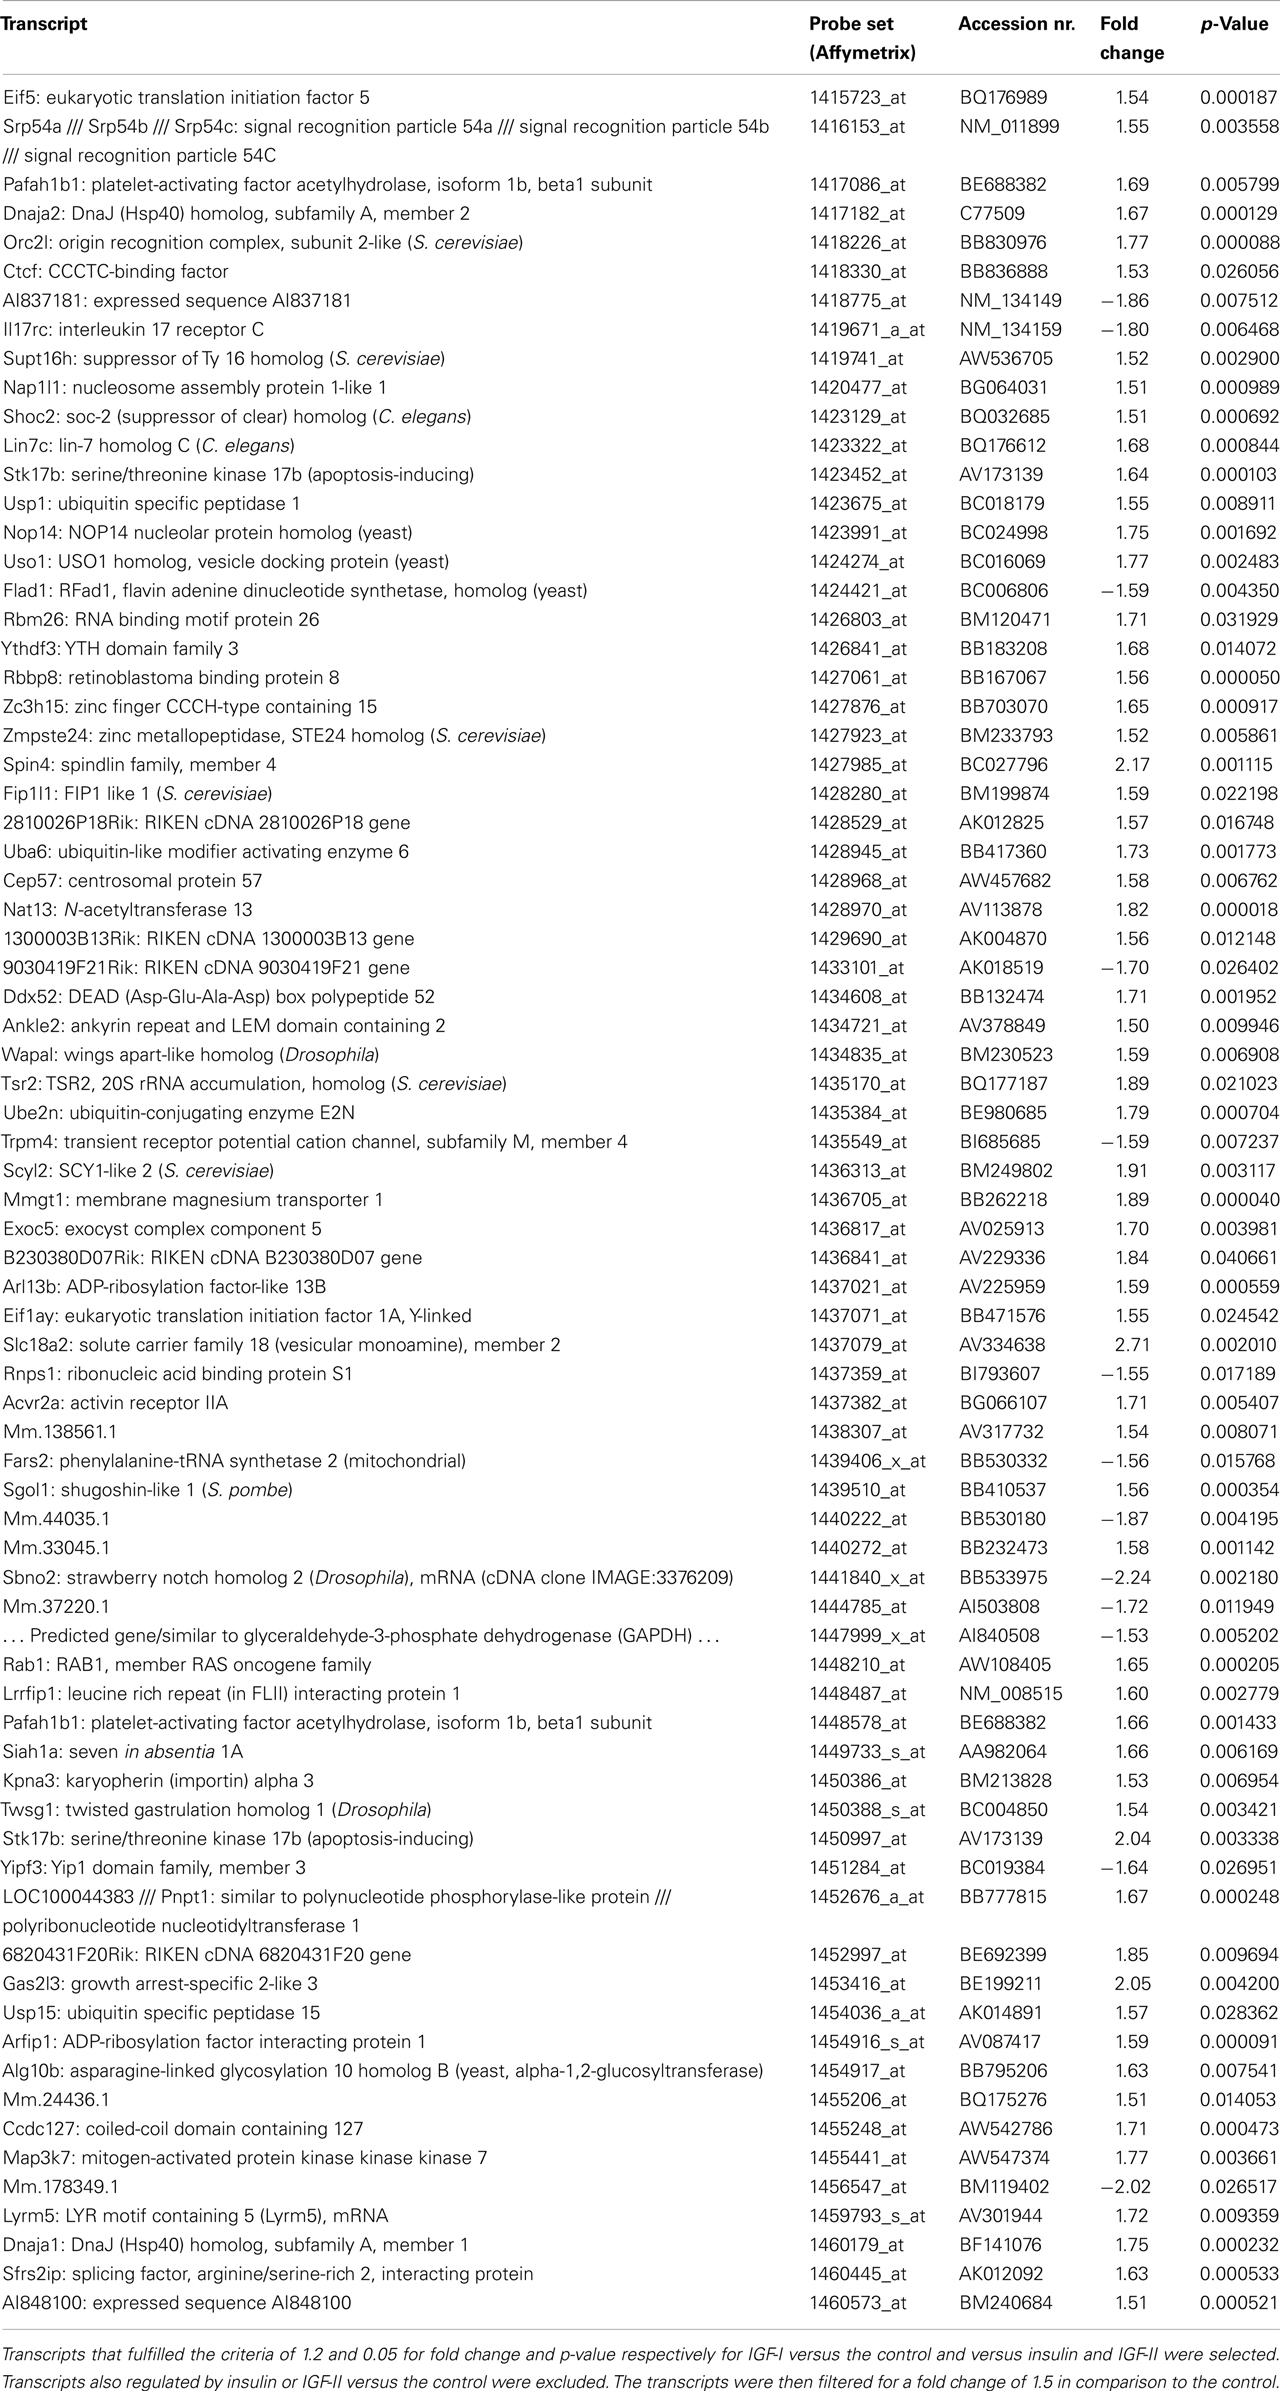
Table 3. Transcripts selectively regulated by IGF-I.
According to IPA the top five molecular and cellular functions these transcripts are involved in are molecular transport, protein trafficking, post-translational modification, protein folding, and cell morphology.
Transcripts selectively regulated by IGF-II
Eight transcripts were only regulated by IGF-II (see Table 4; fold change cut-off 1.5; for fold changes and p-values for insulin and IGF-I: see Table S6 in Supplementary Material). Two of these transcripts were TNF receptor-associated factor 1 (Traf1) and TRAF and TNF receptor-associated protein (Ttrap), which are functionally related proteins.
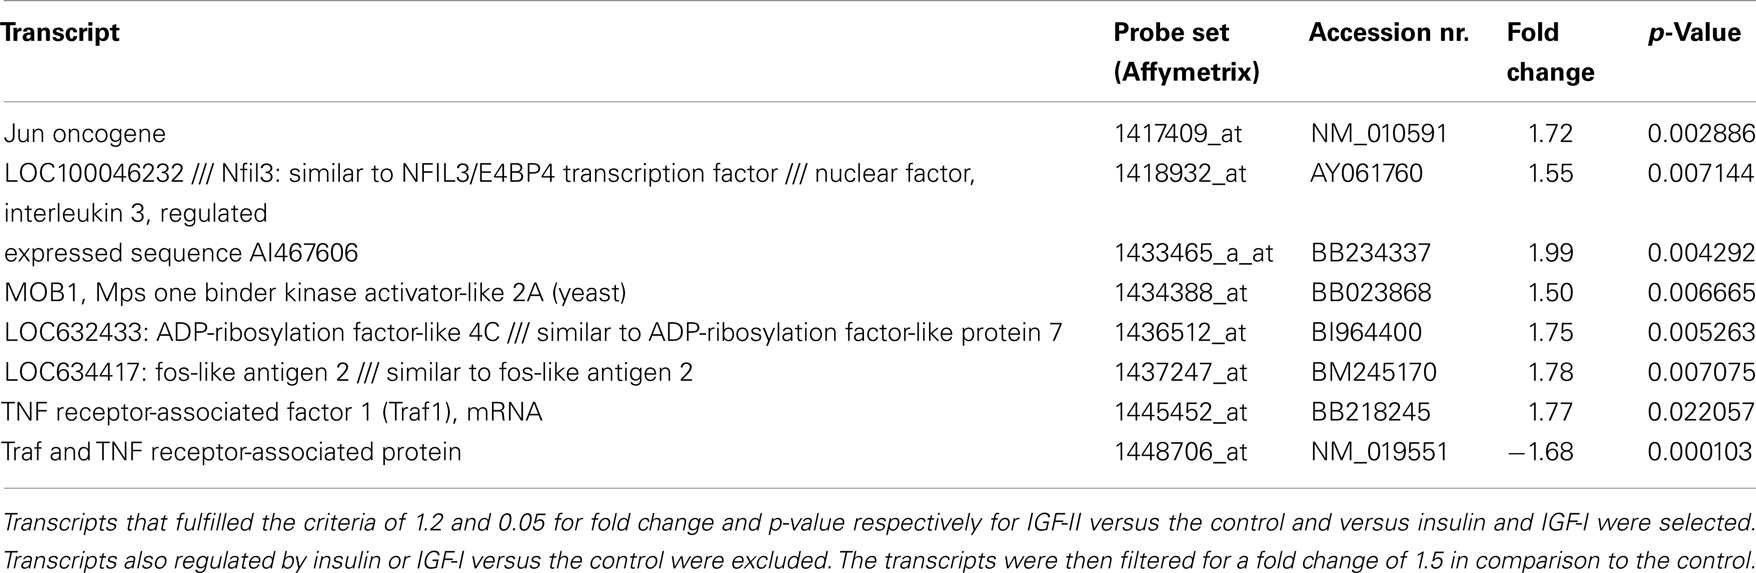
Table 4. Transcripts selectively regulated by IGF-II.
Transcripts selectively regulated by insulin
Four transcripts were only regulated by insulin (see Table 5; fold change cut-off 1.5; for fold changes and p-values for IGF-I and IGF-II: see Table S7 in Supplementary Material).
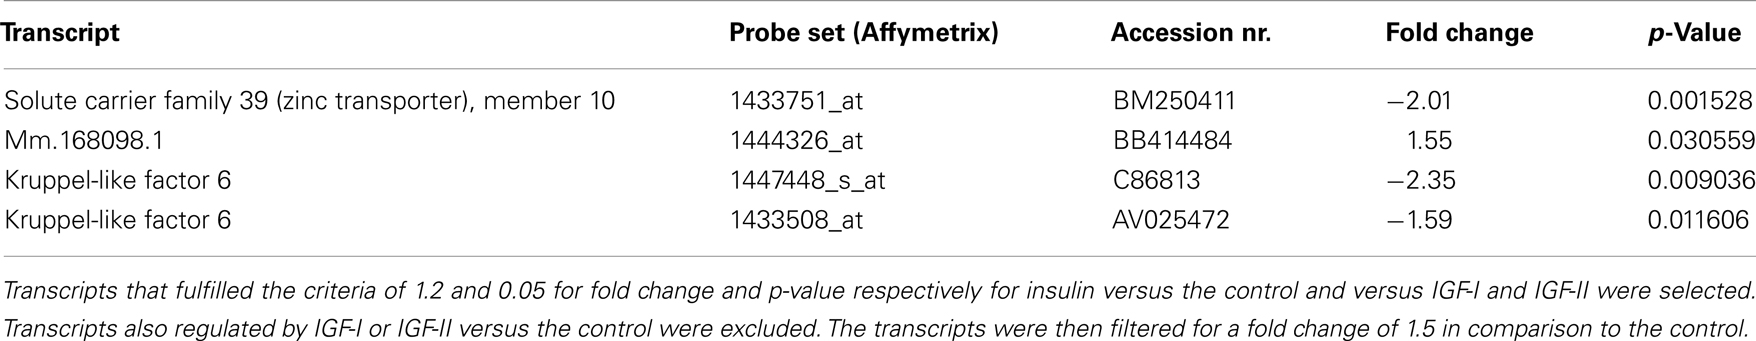
Table 5. Transcripts selectively regulated by insulin.
Gene Regulation Patterns of Ligand Pairs
Transcripts selectively or more potently regulated by the IGFs than by insulin
Sixty five transcripts fulfilled the set criteria for IGF-I and IGF-II in comparison to the control and to insulin. The IGFs regulated 46 transcripts that were not regulated by insulin in comparison to the control (Table 6). Interestingly, the 19 transcripts that were also regulated by insulin were always more regulated by the IGFs than by insulin.
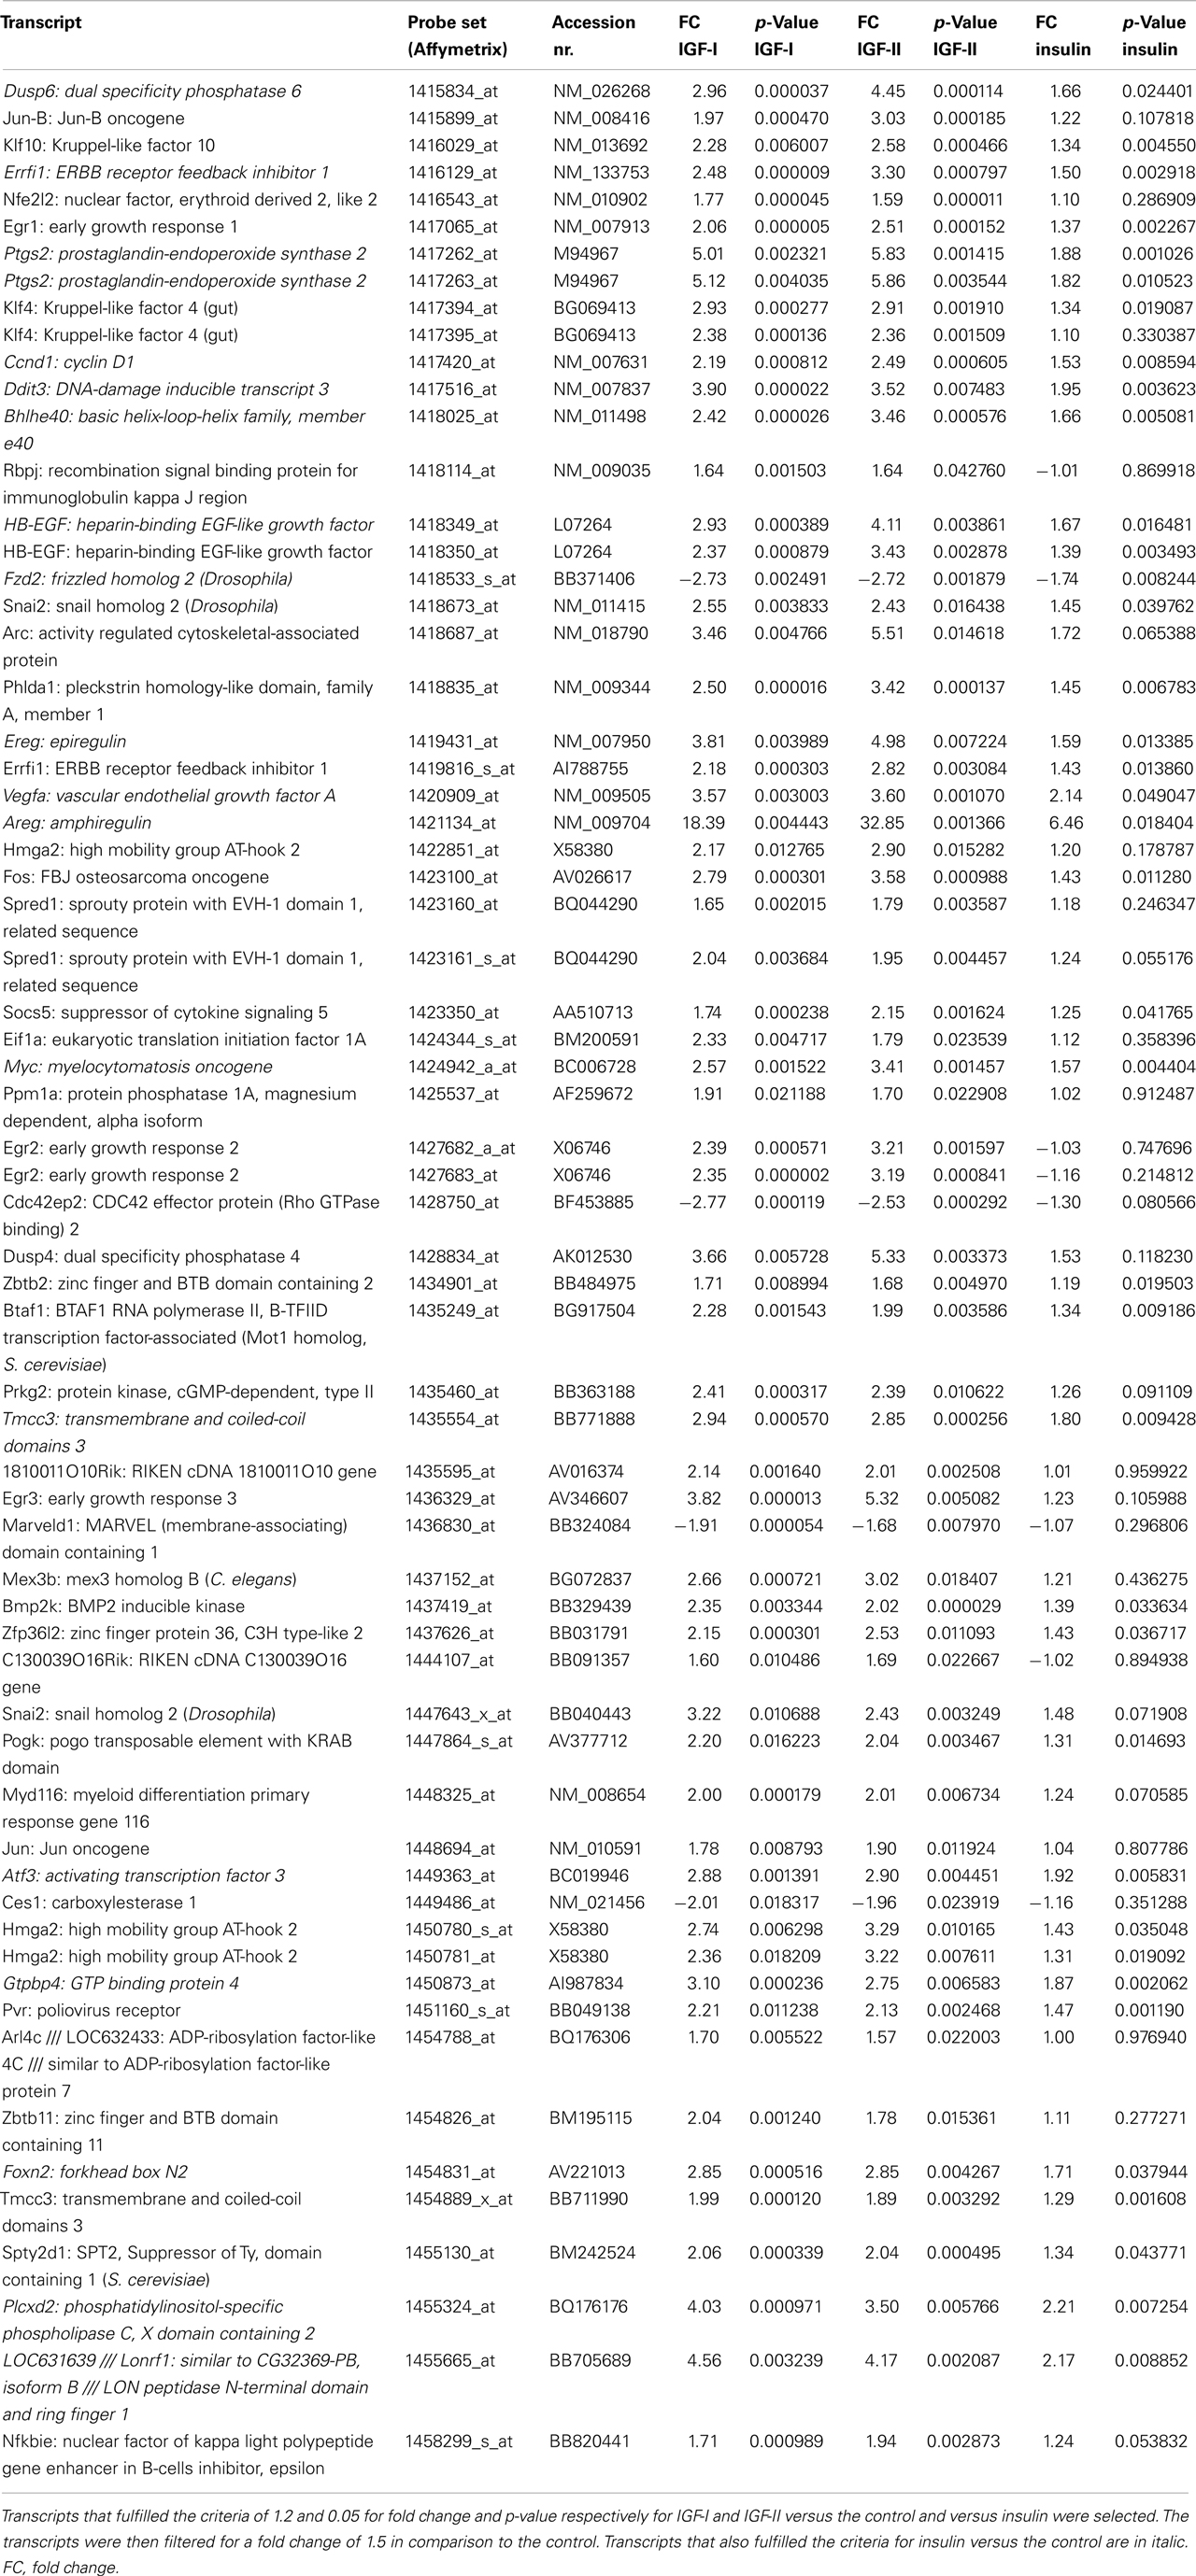
Table 6. Transcripts selectively or more potently regulated by the IGFs than by insulin.
The top five molecular and cellular functions in IPA for these genes were cellular development, cellular growth and proliferation, cell cycle, gene expression, and cell death and survival. Two of the top five canonical pathways represented by these genes were ErbB signaling and neuregulin signaling. The regulated transcripts in these pathways were amphiregulin, epiregulin, heparin-binding EGF-like growth factor, FBJ osteosarcoma oncogene, and Jun oncogene for ErbB signaling and amphiregulin, epiregulin, heparin-binding EGF-like growth factor, ERBB receptor feedback inhibitor 1, and myelocytomatosis oncogene for neuregulin signaling.
Selective gene regulation by insulin and IGF-II
Twenty transcripts fulfilled the criteria for insulin and IGF-II in comparison to the control and to IGF-I (Table 7). Fourteen of these were not influenced by IGF-I in comparison to the control, while they were either down-regulated or up-regulated by insulin and IGF-II.
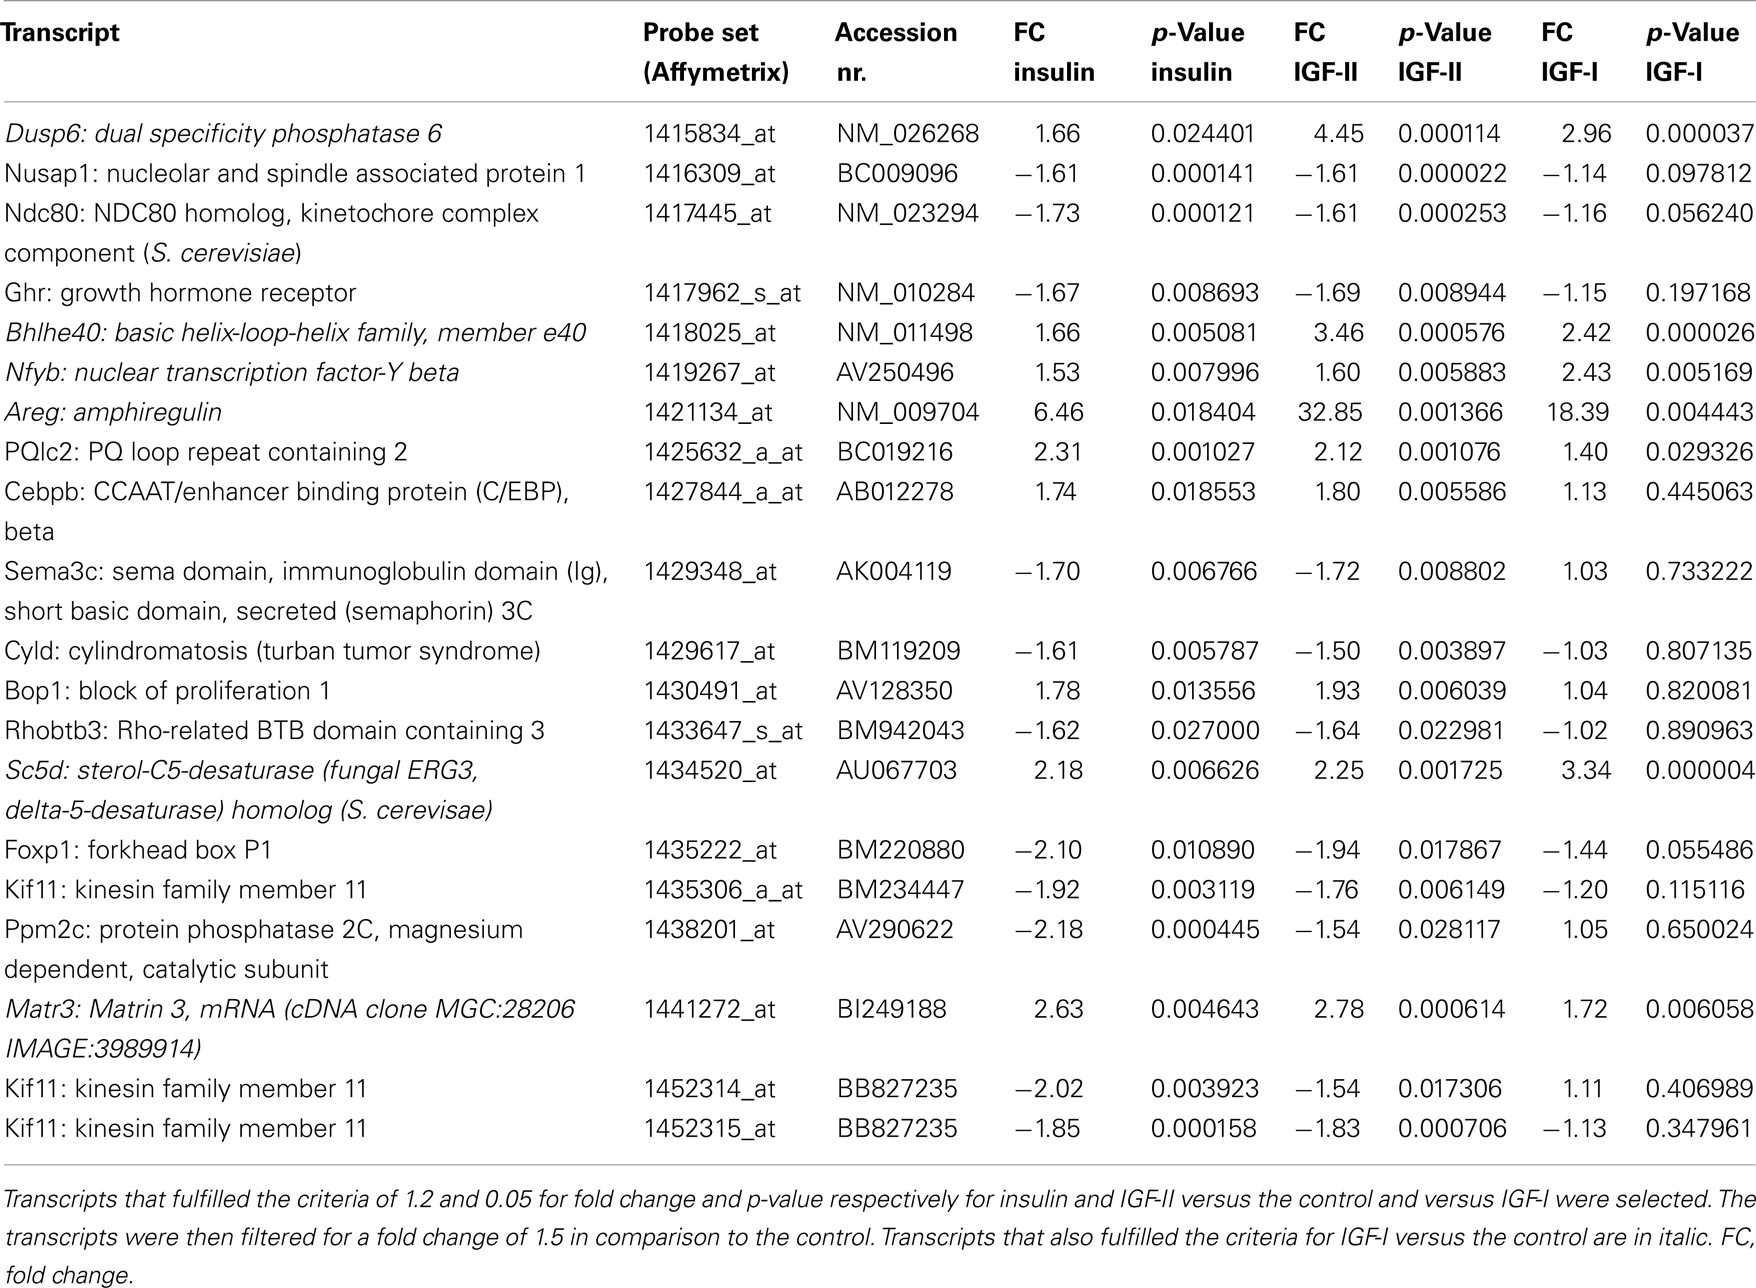
Table 7. Selective gene regulation by insulin and IGF-II.
The top five molecular and cellular functions in IPA for the 14 genes specifically regulated by insulin and IGF-II were cell cycle, cellular assembly and organization, DNA replication, recombination and repair, cellular function and maintenance, and cell morphology.
Gene regulation by insulin and IGF-I
Eleven transcripts fulfilled the criteria for insulin and IGF-I in comparison to the control and to IGF-II (Table 8). In contrast to the selective gene regulation by the IGFs and by insulin and IGF-II, 10 of these 11 transcripts were also, and more strongly, influenced by IGF-II.
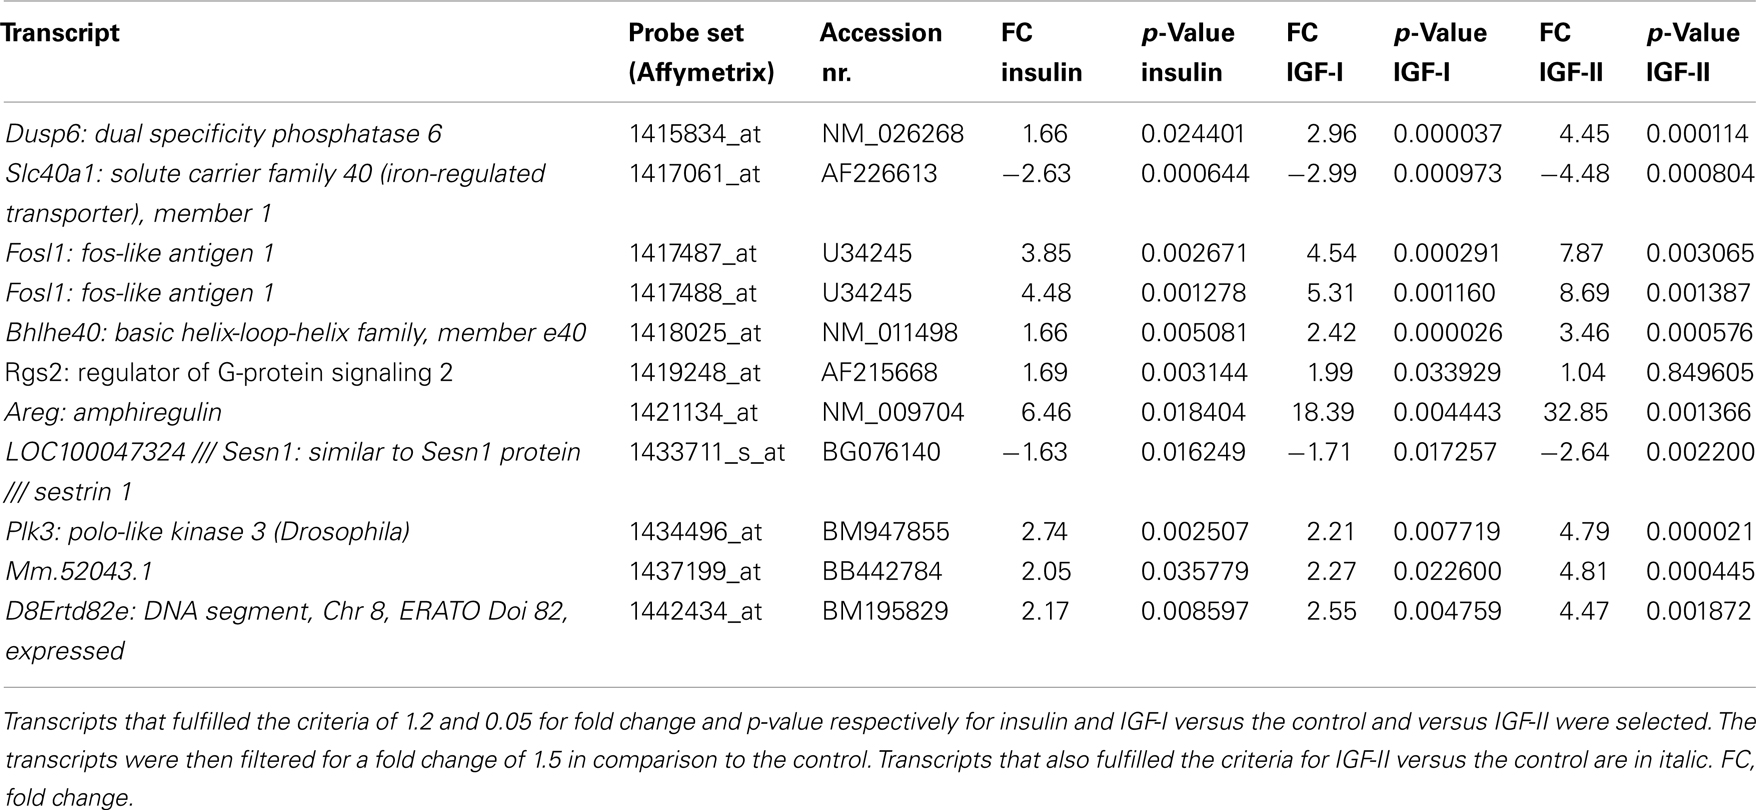
Table 8. Gene regulation by insulin and IGF-I.
Validation of the Microarray Data by qRT-PCR
To validate the microarray data qRT-PCR was performed for six transcripts on the total RNA of three independent biological replicates. These RNA samples are independent of the RNA used to generate the microarray data. Fold changes were calculated in comparison to the control and plotted in Figure 2. For the IGFs, the regulation trends from the microarray experiments (Table 6) are confirmed by qRT-PCR for all six genes: the IGFs regulate these genes more potently than insulin. For insulin, gene regulation (Table 6) was confirmed for four out of six genes (Areg, Egr2, HB-EGF, and Jun-B). In addition, for Ccnd1 the fold change was 1.51 on the array and 1.46 by qRT-PCR, two values that lay very close and are only just separated by the 1.5 fold change cut-off. In conclusion, the qRT-PCR data validate very well the microarray results.
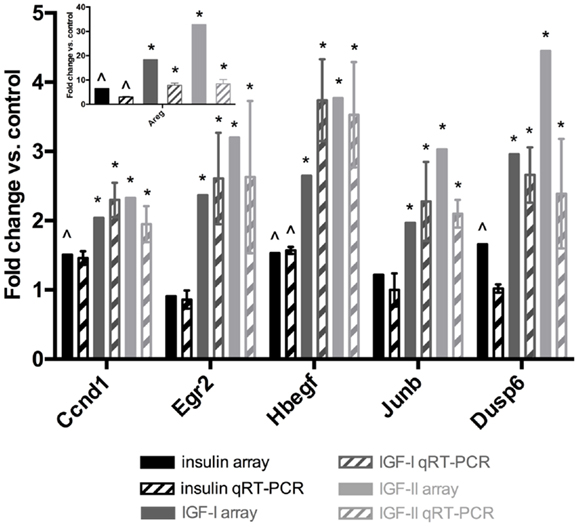
Figure 2. Validation of microarray data by qRT-PCR. Two-step RT-PCR was performed on a subset of transcripts. 18S was used as an internal control. The results are expressed as fold change in comparison to the control (unstimulated samples). Full bars represent the microarray data (Table 6). Bars with patterns represent the average qRT-PCR results ± standard deviations. Black: insulin, gray: IGF-I, light gray: IGF-II. Significant differences in the qRT-PCR data were calculated by a two-tailed t-test. ∧Significantly up-regulated by insulin in comparison to the control at the 1.5 fold change and 0.05 p-value level. *Significantly more up-regulated by this IGF than by insulin at the 0.05 p-value level.
Discussion
We compared the gene expression responses stimulated by insulin, IGF-I, and IGF-II through the IGF-I receptor using Affymetrix gene expression profiling. In order to eliminate the influence of the affinity of the ligands stimulating the receptor, we stimulated the IGF-I receptor on a mouse fibroblast cell line with concentrations of insulin, IGF-I, and IGF-II that compensated for the relative affinities of the ligands for the receptor on this cell line. Our analyses revealed that these three ligands stimulate overlapping but specific gene expression responses.
Some of the regulated transcripts that appeared in our analyses were also found by Mulligan et al. who studied the gene expression pattern after stimulating a chimeric receptor containing the intracellular domain of the IGF-I receptor (30), and Dupont et al. who studied gene expression after stimulation of the IGF-I receptor with IGF-I (31). As in our study, Mulligan et al., e.g., found the up-regulation of heparin-binding EGF-like growth factor and Dupont et al. found the up-regulation of early growth response 1 and Jun oncogene. The fact that transcripts regulated after stimulation of the IGF-I receptor with IGF-I found in our study and, e.g., the one by Dupont et al. only partially overlap, is most likely due to the differences in experimental set-up. We used a different cell line, concentrations of ligands, stimulation time, microarray platform and normalization, and analysis methods and criteria.
Boucher et al. recently showed that IGF-I and insulin, at equal concentrations, regulate the expression of the same genes through the IGF-I receptor (15). Insulin does that with a smaller magnitude of response than IGF-I. We show here that when compensating for the different affinities of the ligands, each ligand does specifically influence the expression of certain genes through the IGF-I receptor.
Each ligand specifically regulated a group of transcripts that was not regulated by the other two ligands. When stimulating the IGF-I receptor with IGF-II for example, two of the eight specifically regulated genes were Traf1 and Ttrap. Traf1 was up-regulated by IGF-II and is an inhibitor of apoptosis, which may be due to increased activation of nuclear factor-kappa B (NF-κB), an anti-apoptotic transcription factor (32– 34). Ttrap was down-regulated by IGF-II and inhibits the transcriptional activation of NF-κB (35). These results are consistent with the known anti-apoptotic activity of IGF-II through the IGF-I receptor.
In order to identify common gene regulation patterns between ligands, we studied the gene expression induced by two ligands in comparison to the control and to the third ligand. Interestingly, a group of 65 transcripts was identified to be selectively or more potently regulated by the IGFs than by insulin. ErbB signaling and neuregulin signaling were significant canonical pathways over-represented in the data set; regulated transcripts in common between the two pathways were amphiregulin, epiregulin, and heparin-binding EGF-like growth factor (HB-EGF). These were up-regulated more potently by the IGFs than by insulin. Pandini et al. showed that amphiregulin, HB-EGF, and epiregulin were similarly up-regulated by insulin and IGF-II through the insulin receptor isoform A in mouse fibroblasts (19). Mulligan et al. showed that HB-EGF transcript expression was up-regulated more potently after signaling through the IGF-I receptor than through the insulin receptor in fibroblasts (30). Amphiregulin, HB-EGF, and epiregulin are all EGF receptor (also named ErbB-1 or HER1) ligands (36). HB-EGF acts both as a regulated autocrine/paracrine and a juxtacrine growth factor (36, 37). Amphiregulin has been suggested to have both growth inhibitory and stimulatory effects (38). Epiregulin is a growth promoter in primary rat hepatocytes (39, 40) and an autocrine growth factor in human keratinocytes (41). HB-EGF and amphiregulin also bind and activate ErbB-3 and HB-EGF binds and activates ErbB-4 (42), just like the neuregulins, which bind ErbB-3 and ErbB-4. HB-EGF induces chemotaxis after stimulation of ErbB-4 (43).
As for the IGFs, we identified 14 transcripts selectively regulated by insulin and IGF-II. Using the same analysis criteria, this was however not the case when looking at insulin and IGF-I as a group. Ten of the 11 transcripts that were regulated by insulin and IGF-I in comparison to the control and IGF-II were also regulated by IGF-II. So the IGFs on one hand and insulin and IGF-II on the other hand seem to provoke more similar gene expression patterns than insulin and IGF-I. This is in accordance with the numbers presented in Table 2. Of all the transcripts regulated by insulin in comparison to the control, a larger fraction was also regulated by IGF-II than by IGF-I, even though IGF-I overall regulated more transcripts than IGF-II.
Although some of the transcripts identified in this study were involved in metabolic functions, the overall biological patterns were of a non-metabolic nature. This is not surprising, considering the tissue origin of the cell line used. From this study, no general conclusions could thus be drawn on whether certain ligands created a more metabolic or mitogenic response in comparison to the other ligands.
Many of the functions, pathways, and genes mentioned above are consistent with the known effects of insulin, IGF-I, and IGF-II. One could thus speculate that these differences in gene expression might account for some of the different biological effects of these three ligands. It should be mentioned that these gene expression patterns were measured after stimulating the receptor with supraphysiological concentrations of ligands. Therefore studying the concentration dependence of these gene expression profiles, together with performing time series of gene expression, could provide a more subtle picture.
Since the influences of affinity of the three ligands were largely accounted for in this study, it is likely that the differences in gene expression are due to intrinsic properties of each ligand. Different suggestions have been made to explain the mechanism responsible for this signaling specificity. Both differences in ligand binding kinetics and internalization properties have been correlated with different responses after stimulating the insulin receptor with different ligands (21–23, 44–46). More studies are needed in order to clarify at which level the cellular signal of different ligands stimulating the same receptor diverges.
Conclusion
We studied the gene expression patterns after stimulating the IGF-I receptor with equipotent concentrations of IGF-I, IGF-II, and insulin by microarray gene expression profiling and found significant differences in responses between the three ligands. Each ligand specifically regulated a group of transcripts that was not regulated by the other two ligands. Also, insulin and IGF-I seemed to stimulate the least overlapping response. The different gene expression profiles for the three ligands might explain some of their different biological effects. These results also add to the accumulating evidence that different ligands can bind to the same receptor and stimulate different cellular responses and that the nature of a ligand bound to a receptor, and not just its concentration and affinity, is determinant for the downstream cellular response. Further studies should help bringing a mechanistic understanding to the different functional consequences of different ligands activating the same receptor.
Conflict of Interest Statement
The authors declare that the research was conducted in the absence of any commercial or financial relationships that could be construed as a potential conflict of interest.
Acknowledgments
We thank Susanne Smed and Elisabeth Schiefloe for help with scanning of the microarrays. The Hagedorn Research Institute and the Receptor Systems Biology Laboratory were independent basic research components of Novo Nordisk A/S. Soetkin Versteyhe, Jane Palsgaard, and Maja Jensen were the recipient of an Industrial Ph.D. scholarship from the Danish Ministry of Science, Technology and Innovation. Steven Gray was the recipient of a BIO + IT postdoctoral fellowship from the Oresund IT Academy.
Supplementary Material
The Supplementary Material for this article can be found online at http://www.frontiersin.org/Molecular_and_Structural_Endocrinology/
10.3389/fendo.2013.00098/abstract
Table S1. Transcripts regulated by insulin and the IGFs.
Table S2. Transcripts regulated by IGF-I.
Table S3. Transcripts regulated by IGF-II.
Table S4. Transcripts regulated by insulin.
Table S5. Transcripts selectively regulated by IGF-I.
Table S6. Transcripts selectively regulated by IGF-II.
Table S7. Transcripts selectively regulated by insulin.
Footnotes
References
2. Monzavi R, Cohen P. IGFs and IGFBPs: Role in health and disease. Best Pract Res Clin Endocrinol Metab (2002) 16:433–47. doi:10.1053/beem.2002.0212
3. Saltiel AR, Kahn CR. Insulin signaling and the regulation of glucose and lipid metabolism. Nature (2001) 414:799–806. doi:10.1038/414799a
4. Taniguchi CM, Emanuelli B, Kahn CR. Critical nodes in signaling pathways: insights into insulin action. Nat Rev Mol Cell Biol (2006) 7:85–96. doi:10.1038/nrm1837
5. Siddle K. Signalling by insulin and IGF receptors: supporting acts and new players. J Mol Endocrinol (2011) 47:R1–10. doi:10.1530/JME-11-0022
6. Siddle K. Molecular basis of signalling specificity of insulin and IGF receptors: neglected corners and recent advances. Front Endocrinol (Lausanne) (2012) 3:34. doi:10.3389/fendo.2012.00034
7. De Meyts P. Insulin and its receptor: structure, function and evolution. Bioessays (2004) 26:1351–62. doi:10.1002/bies.20151
8. De Meyts P, Wallach B, Christoffersen CT, Ursø B, Grønskov K, Latus LJ, et al. The insulin-like growth factor-I receptor. Structure, ligand-binding mechanism and signal transduction. Horm Res (1994) 42:152–69. doi:10.1159/000184188
9. Moller DE, Yokota A, Caro JF, Flier JS. Tissue-specific expression of two alternatively spliced insulin receptor mRNAs in man. Mol Endocrinol (1989) 3:1263–9. doi:10.1210/mend-3-8-1263
10. Sesti G, Tullio AN, D’Alfonso R, Napolitano ML, Marini MA, Borboni P, et al. Tissue-specific expression of two alternatively spliced isoforms of the human insulin receptor protein. Acta Diabetol (1994) 31:59–65. doi:10.1007/BF00570536
11. Schmidt B, Kiecke-Siemsen C, Waheed A, Braulke T, von Figura K. Localization of the insulin-like growth factor II binding site to amino acids 1508-1566 in repeat 11 of the mannose-6-phosphate/insulin-like growth factor II receptor. J Biol Chem (1995) 270:14975–82. doi:10.1074/jbc.270.25.14975
12. Brown J, Jones EY, Forbes BE. Keeping IGF-II under control: lessons from the IGF-II-IGF2R crystal structure. Trends Biochem Sci (2009) 34:612–9. doi:10.1016/j.tibs.2009.07.003
13. Laviola L, Natalicchio A, Giorgino F. The IGF-I signaling pathway. Curr Pharm Des (2007) 13:663–9. doi:10.2174/138161207780249146
14. Dupont J, LeRoith D. Insulin and insulin-like growth factor I receptors: similarities and differences in signal transduction. Horm Res (2001) 55(Suppl 2):22–6. doi:10.1159/000063469
15. Boucher J, Tseng YH, Kahn CR. Insulin and insulin-like growth factor-1 receptors act as ligand-specific amplitude modulators of a common pathway regulating gene transcription. J Biol Chem (2010) 285:17235–45. doi:10.1074/jbc.M110.118620
16. Kim JJ, Accili D. Signaling through IGF-I and insulin receptors: where is the specificity? Growth Horm IGF Res (2002) 12:84–90. doi:10.1054/ghir.2002.0265
17. Frasca F, Pandini G, Scalia P, Sciacca L, Mineo R, Costantino A, et al. Insulin receptor isoform A, a newly recognized, high-affinity insulin-like growth factor II receptor in fetal and cancer cells. Mol Cell Biol (1999) 19:3278–88.
18. Morrione A, Valentinis B, Xu SQ, Yumet G, Louvi A, Efstratiadis A, et al. Insulin-like growth factor II stimulates cell proliferation through the insulin receptor. Proc Natl Acad Sci U S A (1997) 94:3777–82. doi:10.1073/pnas.94.8.3777
19. Pandini G, Medico E, Conte E, Sciacca L, Vigneri R, Belfiore A. Differential gene expression induced by insulin and insulin-like growth factor-II through the insulin receptor isoform A. J Biol Chem (2003) 278:42178–89. doi:10.1074/jbc.M304980200
20. Malaguarnera R, Sacco A, Voci C, Pandini G, Vigneri R, Belfiore A. Proinsulin binds with high affinity the insulin receptor isoform A and predominantly activates the mitogenic pathway. Endocrinology (2012) 153:2152–63. doi:10.1210/en.2011-1843
21. Hansen BF, Danielsen GM, Drejer K, Sørensen AR, Wiberg FC, Klein HH, et al. Sustained signaling from the insulin receptor after stimulation with insulin analogues exhibiting increased mitogenic potency. Biochem J (1996) 315(Pt 1):271–9.
22. Shymko RM, De Meyts P, Thomas R. Logical analysis of timing-dependent receptor signaling specificity: application to the insulin receptor metabolic and mitogenic signaling pathways. Biochem J (1997) 326(Pt 2):463–9.
23. Shymko RM, Dumont E, De Meyts P, Dumont JE. Timing-dependence of insulin-receptor mitogenic versus metabolic signaling: a plausible model based on coincidence of hormone and effector binding. Biochem J (1999) 339(Pt 3):675–83. doi:10.1042/0264-6021:3390675
24. Jensen M, Palsgaard J, Borup R, De Meyts P, Schäffer L. Activation of the insulin receptor (IR) by insulin and a synthetic peptide has different effects on gene expression in IR-transfected L6 myoblasts. Biochem J (2008) 412:435–45. doi:10.1042/BJ20080279
25. Dittmer F, Ulbrich EJ, Hafner A, Schmahl W, Meister T, Pohlmann R, et al. Alternative mechanisms for trafficking of lysosomal enzymes in mannose-6-phosphate receptor-deficient mice are cell-type-specific. J Cell Sci (1999) 112:1591–7.
26. Irizarry RA, Hobbs B, Collin F, Beazer-Barclay YD, Antonellis KJ, Scherf U, et al. Exploration, normalization, and summaries of high density oligonucleotide array probe level data. Biostatistics (2003) 4:249–64. doi:10.1093/biostatistics/4.2.249
27. Li C, Wong WH. Model-based analysis of oligonucleotide arrays: expression index computation and outlier detection. Proc Natl Acad Sci U S A (2001) 98:31–6. doi:10.1073/pnas.98.1.31
28. Livak KJ, Schmittgen TD. Analysis of relative gene expression data using real-time quantitative PCR and the 2(-Delta Delta C(T)) method. Methods (2001) 25:402–8. doi:10.1006/meth.2001.1262
29. Denley A, Bonython ER, Booker GW, Cosgrove LJ, Forbes BE, Ward CW, et al. Structural determinants for high-affinity binding of insulin-like growth factor II to insulin receptor (IR)-A, the exon 11 minus isoform of the IR. Mol Endocrinol (2004) 18:2502–12. doi:10.1210/me.2004-0183
30. Mulligan C, Rochford J, Denyer G, Stephens R, Yeo G, Freeman T, et al. Microarray analysis of insulin and insulin-like growth factor-1 (IGF-1) receptor signaling reveals the selective up-regulation of the mitogen heparin-binding EGF-like growth factor by IGF-1. J Biol Chem (2002) 277:42480–7. doi:10.1074/jbc.M206206200
31. Dupont J, Khan J, Qu BH, Metzler P, Helman L, LeRoith D. Insulin and IGF-1 induce different patterns of gene expression in mouse fibroblast NIH-3T3 cells: identification by cDNA microarray analysis. Endocrinology (2001) 142:4969–75. doi:10.1210/en.142.11.4969
32. Karin M, Lin A. NF-κB at the crossroads of life and death. Nat Immunol (2002) 3:221–7. doi:10.1038/ni0302-221
33. Gupta S. Molecular signaling in death receptor and mitochondrial pathways of apoptosis (Review). Int J Oncol (2003) 22:15–20.
34. Arch RH, Gedrich RW, Thompson CB. Tumor necrosis factor receptor-associated factors (TRAFs) – a family of adapter proteins that regulates life and death. Genes Dev (1998) 12:2821–30. doi:10.1101/gad.12.18.2821
35. Pype S, Declercq W, Ibrahimi A, Michiels C, Van Rietschoten JG, Dewulf N, et al. TTRAP, a novel protein that associates with CD40, tumor necrosis factor (TNF) receptor-75 and TNF receptor-associated factors (TRAFs), and that inhibits nuclear factor-κ B activation. J Biol Chem (2000) 275:18586–93. doi:10.1074/jbc.M000531200
36. Harris RC, Chung E, Coffey RJ. EGF receptor ligands. Exp Cell Res (2003) 284:2–13. doi:10.1016/S0014-4827(02)00105-2
37. Raab G, Klagsbrun M. Heparin-binding EGF-like growth factor. Biochim Biophys Acta (1997) 1333:F179–99.
38. Shoyab M, McDonald VL, Bradley JG, Todaro GJ. Amphiregulin: a bifunctional growth-modulating glycoprotein produced by the phorbol 12-myristate 13-acetate-treated human breast adenocarcinoma cell line MCF-7. Proc Natl Acad Sci U S A (1988) 85:6528–32. doi:10.1073/pnas.85.17.6528
39. Komurasaki T, Toyoda H, Uchida D, Nemoto N. Mechanism of growth promoting activity of epiregulin in primary cultures of rat hepatocytes. Growth Factors (2002) 20:61–9. doi:10.1080/08977190290024192
40. Toyoda H, Komurasaki T, Uchida D, Takayama Y, Isobe T, Okuyama T, et al. Epiregulin. A novel epidermal growth factor with mitogenic activity for rat primary hepatocytes. J Biol Chem (1995) 270:7495–500.
41. Shirakata Y, Komurasaki T, Toyoda H, Hanakawa Y, Yamasaki K, Tokumaru S, et al. Epiregulin, a novel member of the epidermal growth factor family, is an autocrine growth factor in normal human keratinocytes. J Biol Chem (2000) 275:5748–53. doi:10.1074/jbc.275.8.5748
42. Beerli RR, Hynes NE. Epidermal growth factor-related peptides activate distinct subsets of ErbB receptors and differ in their biological activities. J Biol Chem (1996) 271:6071–6. doi:10.1074/jbc.271.11.6071
43. Elenius K, Paul S, Allison G, Sun J, Klagsbrun M. Activation of HER4 by heparin-binding EGF-like growth factor stimulates chemotaxis but not proliferation. EMBO J (1997) 16:1268–78. doi:10.1093/emboj/16.6.1268
44. Drejer K. The bioactivity of insulin analogues from in vitro receptor binding to in vivo glucose uptake. Diabetes Metab Rev (1992) 8:259–85. doi:10.1002/dmr.5610080305
45. Jensen M, Hansen B, De Meyts P, Schäffer L, Ursø B. Activation of the insulin receptor by insulin and a synthetic peptide leads to divergent metabolic and mitogenic signaling and responses. J Biol Chem (2007) 282:35179–86. doi:10.1074/jbc.M704599200
Keywords: IGF-I receptor, microarray gene expression, insulin, IGF, differential signaling
Citation: Versteyhe S, Klaproth B, Borup R, Palsgaard J, Jensen M, Gray SG and De Meyts P (2013) IGF-I, IGF-II, and insulin stimulate different gene expression responses through binding to the IGF-I receptor. Front. Endocrinol. 4:98. doi: 10.3389/fendo.2013.00098
Received: 28 February 2013; Paper pending published: 21 March 2013;
Accepted: 26 July 2013; Published online: 09 August 2013.
Edited by:
Kenneth Siddle, University of Cambridge, UKReviewed by:
Ramasamy Paulmurugan, Stanford University, USAAndrew Chantry, University of East Anglia, UK
Copyright: © 2013 Versteyhe, Klaproth, Borup, Palsgaard, Jensen, Gray and De Meyts. This is an open-access article distributed under the terms of the Creative Commons Attribution License (CC BY). The use, distribution or reproduction in other forums is permitted, provided the original author(s) or licensor are credited and that the original publication in this journal is cited, in accordance with accepted academic practice. No use, distribution or reproduction is permitted which does not comply with these terms.
*Correspondence: Soetkin Versteyhe, Faculty of Health Sciences, The Novo Nordisk Foundation Center for Basic Metabolic Research, Integrative Physiology, University of Copenhagen, Blegdamsvej 3B, 2200 København N, Denmark e-mail:c29ldGtpbi52ZXJzdGV5aGVAc3VuZC5rdS5kaw==
†Present address: Birgit Klaproth and Maja Jensen, Insulin Biology, Novo Nordisk A/S, Måløv, Denmark; Jane Palsgaard, Novo Nordisk Foundation Center for Basic Metabolic Research, University of Copenhagen, Copenhagen, Denmark; Pierre De Meyts, Department of Diabetes Biology and Hagedorn Research Institute, Gentofte, Denmark.