 Werner C. Jaeger
 Stephen P. Armstrong1†
 Stephen J. Hill
 Kevin D. G. Pfleger
- 1Molecular Endocrinology and Pharmacology, Harry Perkins Institute of Medical Research and Centre for Medical Research, The University of Western Australia, Perth, WA, Australia
- 2Cell Signalling Research Group, School of Life Sciences, Queen’s Medical Centre, University of Nottingham Medical School, Nottingham, UK
- 3Dimerix Bioscience Pty Ltd, Perth, WA, Australia
Guanine nucleotide binding protein (G protein)-coupled receptors (GPCRs) function in complexes with a range of molecules and proteins including ligands, G proteins, arrestins, ubiquitin, and other receptors. Elements of these complexes may interact constitutively or dynamically, dependent upon factors such as ligand binding, phosphorylation, and dephosphorylation. They may also be allosterically modulated by other proteins in a manner that changes temporally and spatially within the cell. Elucidating how these complexes function has been greatly enhanced by biophysical technologies that are able to monitor proximity and/or binding, often in real time and in live cells. These include resonance energy transfer approaches such as bioluminescence resonance energy transfer (BRET) and fluorescence resonance energy transfer (FRET). Furthermore, the use of fluorescent ligands has enabled novel insights into allosteric interactions between GPCRs. Consequently, biophysical approaches are helping to unlock the amazing diversity and bias in G protein-coupled receptor signaling.
Introduction
Guanine nucleotide binding protein (G protein)-coupled receptors (GPCRs), also known as seven-transmembrane receptors, form the largest gene family in the vertebrate genome, with 1000–2000 members (1). To maintain homeostasis, GPCRs mediate responses to a vast array of extracellular signals, including light, ions, odorants, nucleotides, amino acids, glycoproteins, proteases, neurotransmitters, peptide hormones, lipids, and mechanical energy. Accordingly, GPCRs participate in many physiological and pathological processes, and the ability of their function to be modified with compounds presents GPCRs as highly useful pharmaceutical targets. Indeed, it has been widely reported that between 30 and 50% of medicines target this class of receptor (2–4). However, a recent study reported that these drugs only target approximately 30% of known non-olfactory GPCRs, and a much smaller percentage of potential underlying targets have been identified (5). The advent of increasingly powerful techniques to investigate GPCR function has progressed the field from a classical bimodal, monomeric theory of GPCR activity to involve multimodal, oligomeric mechanisms. Multiple alternative signaling pathways, allosterism, ligand bias, and receptor–receptor interactions all generate diverse GPCR trafficking and signaling outcomes. Notably, these mechanisms are not independent of each other, but instead likely integrate to influence drug specificity and efficacy. They are therefore the subject of intense focus for ongoing and future drug development.
Diversity of GPCR Function in Oligomeric Complexes
Guanine nucleotide binding protein (G protein)-coupled receptors were formerly believed to function as monomeric entities, although data from a number of early studies suggested otherwise [reviewed in Ref. (6–8)]. Most notably, early work involving the seminal GABAB1/GABAB2 heteromer has lent support to the concept of GPCRs acting as oligomeric complexes (9–11), along with studies of the taste receptor family (12–14). Biochemical and increasingly powerful biophysical methods have helped strengthen the growing body of evidence supporting the ability of GPCRs to form such complexes (15–21), including homomers, heteromers, and higher-order quaternary complexes (8, 22–25). When present in oligomeric complexes, individual receptors (protomers) may differ in their ability to bind ligands, traffic to/from the cell surface, and modify overall signaling activity compared to when present individually or in alternative complexes. In this way, individual receptors within a macromolecular complex provide a level of allosteric modulation that can ultimately alter the trafficking and signaling output of the complex as a whole. Furthermore, while these activities may be categorized and discussed as distinct events, allosteric modulation of ligand binding, signaling, and trafficking of receptors through oligomerization are highly dependent processes.
Recent Advances in Measurement of GPCR Complexes Using Biophysical Techniques
Recent advances in biophysical methods to monitor protein–protein interactions have evolved through the discovery and optimization of novel luciferase enzymes/substrates and fluorophores, as well as improved sensitivity of detection instrumentation. Variants of green fluorescent protein (GFP) derived from Aequorea victoria have resulted in optimization of the chemical stability as well as the quantum yield of these proteins, enabling them to be used to measure protein–protein interactions with greater sensitivity, as well as for use in living organisms (26). Novel luciferases, such as the optimized Renilla luciferases (26, 27) and newly characterized enzymes from other marine species (28), are providing molecular endocrinologists and pharmacologists with more optimal tools to assess complex formation and function utilizing resonance energy transfer (RET) techniques in vitro and in vivo. These assays utilize the biophysical properties of Förster RET that involves non-radiative transfer of energy from an excited donor to a suitable acceptor. Fluorescence resonance energy transfer (FRET) utilizes a donor fluorophore (such as cyan fluorescent protein) that is excited by an external light source (such as a flash lamp or laser), whereas bioluminescence resonance energy transfer (BRET) utilizes a luciferase enzyme as donor that transfers energy upon oxidation of its substrate. These approaches therefore enable live cell protein proximity detection (29–31) and can be used to monitor changes in conformations of individual GPCR protomers as well as between multiple GPCRs in complexes.
Fluorescence Resonance Energy Transfer/Time-Resolved FRET
A number of FRET-based techniques exist and have been extensively reviewed elsewhere (32). Intensity-based FRET methods have their limitations due to the overlap of fluorophore excitation and emission spectra (33). Bleedthrough of the donor emission into the acceptor detection window needs to be removed, as does the component of the acceptor emission resulting from direct acceptor excitation. Spectral unmixing is one approach to address this issue (34).
Alternatively, the “unmixing” can occur temporally through the utilization of time-resolved FRET (TR-FRET), which can also overcome issues of photobleaching and high background autofluorescence (35). This approach relies on energy transfer between lanthanide donors (such as europium or terbium cryptate complexes) and a suitable acceptor (such as the Cy-5-like cyanine dye, d2, or the modified allophycocyanine, XL665). The exceptional duration of fluorescence emission (300–1000 μs) from lanthanide donors enables measurement of acceptor emission long after background fluorescence has decayed (35). This, together with the high FRET efficiency between lanthanide and cyanine fluorophores, and the chemically stable nature of cryptate complexes, results in excellent signal-to-noise ratios for TR-FRET. As such, TR-FRET assays are well suited to high-throughput screening (36), as well as general investigative studies. When combined with labeling methods such as SNAP- and CLIP-tag technology or fluorescent ligands, TR-FRET becomes a powerful tool for detecting GPCR proximity. For example, a recent paper from the Milligan laboratory investigated cannabinoid receptor 1 (CB1) and orexin receptor 1 (OX1) heteromerization using TR-FRET and SNAP/CLIP tags, providing evidence for a remarkable ability of OX1 to induce internalization of the CB1–OX1 heteromer with greater potency than observed with OX1 alone (37). Similar approaches have been used to determine the stoichiometry of homo- and heteromer populations at the cell surface, specifically within the metabotropic glutamate (mGlu) receptor family (38) or between dopamine D2 and D3 receptors (39).
Fluorescent ligands (see section below) offer a powerful alternative approach to labeling GPCR complexes (40–42), by removing the requirement for engineered fusion proteins. Consequently, they enable investigation of GPCR complexes in their native environment, which is particularly useful given that the existence of heteromers in vivo is much less well-established than in vitro. Notably, TR-FRET between fluorophore-conjugated antagonists has been used to demonstrate the existence of oxytocin receptor homomers in primary mammary tissue (43, 44).
A recent paper demonstrated the use of TR-FRET antibodies to quantify levels of EGFR/HER2 heterodimerization since simultaneous in vivo treatment with antibodies that disrupted this complex resulted in the greatest median survival rate (45). Such a technique could also be used for screening compounds that regulate heteromerization of GPCR complexes, depending upon the availability of suitably validated GPCR antibodies and a distinct and measurable functional effect of a particular complex. The presence and proximity of protomers that constitute a GPCR complex may also be inferred using epitope-tagged receptors and fluorescently labeled antibodies to these epitopes. For example, to detect proximity between CXCR3 and CXCR4, these receptors were N-terminally epitope-labeled (HA-CXCR3/FLAG-CXCR4) and TR-FRET was measured between TR-FRET-labeled antibodies to these epitopes (46).
Bioluminescence Resonance Energy Transfer
Following the oxidation of a suitable substrate by a luciferase enzyme, typically a variant of Renilla luciferase (Rluc), such as Rluc2 or Rluc8, BRET occurs through a non-radiative transfer of energy to a complementary fluorophore, such as a variant of GFP, if it is in sufficiently close proximity (47, 48). Critically, as with FRET, energy transfer is dependent upon the distance between donor and acceptor (inversely proportional to the sixth power), as well as their relative orientation and degree of spectral overlap (29, 30, 49). The BRET process occurs naturally in marine organisms such as the jellyfish Aequorea victoria and sea pansy Renilla reniformis. Since the seminal use of this technique to observe interacting clock proteins (50), BRET has been used increasingly to monitor proximity indicative of association, dissociation, or conformational changes involving proteins of interest (29). Indeed, this method can be used to observe intramolecular changes to protein conformation in a bimodal manner indicating active or inactive states. This is particularly important for biosensors, and will be detailed in the next section (see Resonance Energy Transfer Biosensors).
Recent innovations in BRET technology have been extensively reviewed (30), but briefly, the original BRET approach (now termed BRET1) generally uses an Rluc variant and yellow fluorescent protein (YFP), as the donor and acceptor respectively, with coelenterazine h as the enzyme substrate. A second generation, termed BRET2, uses a synthetic coelenterazine, DeepBlueC, with a blue-shifted donor emission spectrum, and modified GFP (GFP2) (51). GFP10 is also a suitable BRET2 acceptor (52–55). BRET2 has the advantage of increased spectral resolution between donor and emission peaks, but this is overshadowed by rapid decay kinetics of the substrate and a substantially reduced quantum yield (56, 57). The distance ranges over which BRET1 and BRET2 energy transfer occurs are comparable with FRET, with BRET1 being more sensitive to proximity than BRET2 (58). BRET1 with Rluc/enhanced YFP, and BRET1 with Rluc2 or Rluc8/Venus, exhibit minimal energy transfer beyond about 6.5 and 8 nm, respectively, whereas BRET2 extends to about 11 nm regardless of whether Rluc, Rluc2, or Rluc8 is used (58).
Another permutation of BRET known as “extended BRET” (eBRET) utilizes a protected variant of coelenterazine h (EnduRen) and enables real-time monitoring of interactions for extended time periods (47, 59, 60). This enables discrimination of distinct kinetic profiles, such as between mutated receptors (61, 62). Similarly, protected DeepBlueC variants have also been produced, and may be of use to take advantage of increased spectral resolution with a lengthened substrate half-life (63). A further modification known as BRET3, utilizing a mutant fluorescent protein with red-shifted emission (mOrange), has also proved useful for in vivo imaging (64, 65). Other variations of BRET, including multiplexing, have also been devised to allow multiple acceptor fluorophores, conjugated to various proteins of interest, to be activated in a cascade manner (66). For example, this has been used to detect proximity between three proteins in a GPCR complex (67).
Recently, an investigation was carried out into novel luciferases from marine organisms that resulted in the isolation and optimization of a novel luciferase, “NanoLuc™,” derived from the deep sea shrimp Oplophorus gracilirostris (28). Concurrently, a novel imidazopyrazinone substrate, furimazine, was specifically developed for use with this novel enzyme. NanoLuc™ is almost half the size of Renilla luciferase [19 versus 36 kDa, respectively (28)], and this could potentially result in a lower degree of interference or steric hindrance of the luciferase tag when fused to a protein of interest in mammalian cells. NanoBRET™ benefits from the substantially increased brightness of NanoLuc™(28), enabling very low levels of enzyme expression to be used. Furthermore, the 460-nm emission maximum of NanoLuc™(28) is blue-shifted compared to the Rluc variants with emission peaks of about 480 nm (57). Along with the approximately 20% narrower spectral emission of NanoLuc™(28), this enables better spectral separation from the acceptor emission.
Resonance Energy Transfer Biosensors
Biosensors are novel molecular tools that can be used to investigate the activity of a signaling or structural protein qualitatively and/or quantitatively (68, 69). This may be in the form of bimodal output, whereby either unimolecular or bimolecular peptide probes are synthesized to include certain domains that measure a change in the inactive or active state of an effector protein, and this consequently causes a change in conformation of the biosensor, and magnitude of signal output (68, 69). Importantly, these can be used as screening tools to measure the activity of signaling or structural protein activity in a high-throughput situation. Several FRET biosensors have been developed for small GTPases, involved in a number of regulatory and signaling activities in the cell (68). Intracellular Ras activity of angiotensin receptor type 1 (AT1R) stimulated by angiotensin II has been observed using a Ras biosensor, and found to have activity in certain compartments (70). GTPases are activated and deactivated by guanine nucleotide exchange factors (GEFs) and GTPase activating proteins (GAPs), respectively (71). Therefore, if these proteins are known, and the domains that they affect, fusion proteins can be developed involving either a single domain, or two domains. If the effector causes a considerable change in conformation, this may be sufficient to enable a difference in the RET signal to be detected. This has been developed for Rab5, a member of the Rab family of GTPases involved in trafficking of GPCRs and other proteins in transport vesicles throughout various compartments in the cell (71), Quantitative changes using FRET probes have typically been used as the RET method for a large proportion of characterized biosensors, however, BRET probes are increasingly being used. An ERK sensor “REV” has been developed incorporating BRET tags to measure the phosphorylated or unphosphorylated state of ERK (72). Similarly, G protein activation can be inferred by monitoring interactions between G proteins and GPCRs using BRET (53, 73–75). Other examples include BRET biosensors for cAMP (76) and protein kinase A (77) [see Ref. (78) for review]. Although biosensors can be created using artificial constructs, native proteins may also be tagged at either N- or C-termini, or by integrating FRET or BRET tags into internal domains of the protein, such as the third intracellular loop of GPCRs, as recently demonstrated for an odorant GPCR (79). Additionally, homogeneous time-resolved fluorescence (HTRF) is a biosensor platform with a range of applications (80), including measurement of inositol-1-phosphate (61, 81, 82) and cAMP (61). Due to the impermeability of the metal chelates, HTRF measurement either requires cell lysis or mild cell permeabilization, the latter with Triton X-100 for example (75).
Proximity between BRET-tagged β-arrestin and BRET-tagged ubiquitin can be monitored following activation of a co-expressed GPCR, and the resultant kinetic profiles provide interesting insights into receptor pharmacology, as seen when comparing V2R with β2 adrenoceptor (83) or different orexin receptor subtypes (62, 84). Alternatively, BRET1 and BRET2 can be utilized in parallel by co-expressing Rluc-tagged β-arrestin, YFP-tagged GPCR, and GFP2-tagged ubiquitin, then measuring BRET in parallel cell populations following addition of coelenterazine h (BRET1) or DeepBlueC (BRET2) substrate (83).
Detection and Profiling of GPCR Heteromer Complexes
The agreed definition of a receptor heteromer is a “macromolecular complex composed of at least two (functional) receptor units with biochemical properties that are demonstrably different from those of its individual components” (85). Notably, heteromeric complexes may exist without GPCRs interacting directly, as other complex components may be in between (86). To detect specific heteromer complexes of GPCRs, suitable experimental controls are required to differentiate between specific and non-specific (bystander) reporter signals.
The Receptor-Heteromer Investigation Technology (Receptor-HIT) (87), includes Receptor Tyrosine Kinase-HIT (RTK-HIT) (88) and the GPCR-Heteromer Identification Technology (GPCR-HIT) as a novel approach for rapid identification, screening, and profiling of GPCR heteromers (30, 46, 86, 87, 89–92) (Figure 1). The approach consists of three essential components co-expressed in live cells, (i) a GPCR fused to a proximity-based first reporter component, (ii) an unlabeled GPCR, and (iii) a GPCR-interacting group, linked to the complementary second reporter component, whose interaction with the complex is modulated upon binding a ligand selective for the unlabeled GPCR or the heteromer complex specifically. Typically the first reporter component is fused to the C-terminus of the GPCR and an intracellular interacting group is used (Figure 1A), such as β-arrestin (86) or tagged G protein subunits (75). Indeed, our work with EGFR–HER3 complexes recruiting Grb2 illustrates the diversity of potential intracellular receptor interacting partners (88). However, by fusing the first reporter component to the N-terminus of a GPCR and using a fluorescently labeled ligand as the interacting group/second reporter component combination (Figure 1B), GPCR-HIT can be used to assess ligand binding to the heteromer. Upon expression of the aforementioned three components in cells, a ligand specific for the unlabeled GPCR or the heteromer complex is added and the reporter signal measured. If the GPCRs are not proximal, addition of the ligand specific to the untagged GPCR will modulate the interacting group’s proximity to the activated receptor, however, as the two reporter components will not be in close proximity, no modulation of the reporter signal will be measured. In contrast, when heteromers of the GPCRs are present, addition of ligand will modulate the interacting group’s proximity to the complex, resulting in a change in reporter signal (Figure 1).
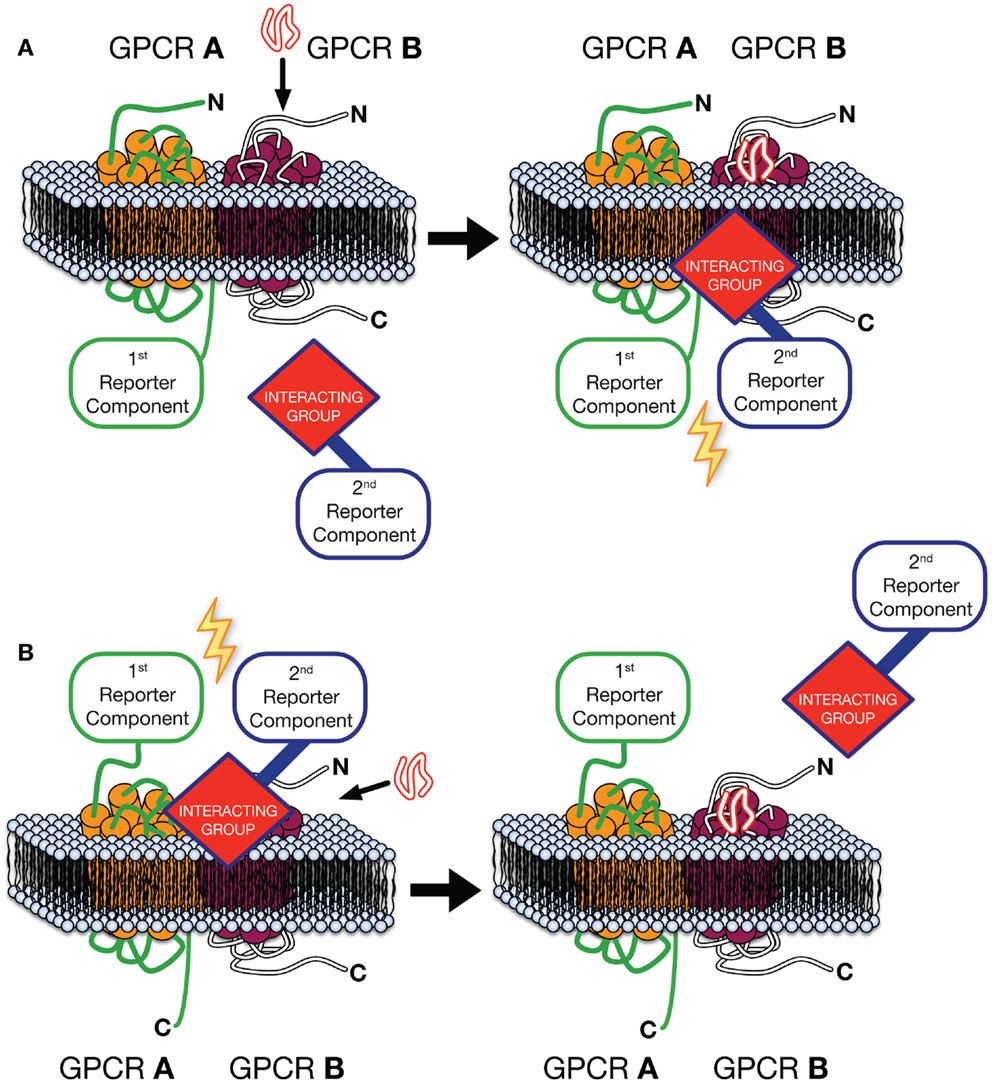
Figure 1. GPCR-Heteromer Identification Technology (GPCR-HIT). GPCR A is fused to the first reporter component, GPCR B is unlabeled with respect to the reporter system, and a GPCR-interacting group is linked to the complementary second reporter component. The first reporter component is fused to the C-terminus of the GPCR and an intracellular interacting group is used (A), or ligand binding to the heteromer is assessed by fusing the first reporter component to the N-terminus of a GPCR and using a fluorescently labeled ligand as the interacting group/second reporter component combination (B).
GPCR-HIT can be used on a broad range of reporter assay platforms including FRET (e.g., CisBio’s HTRF®), BRET, bimolecular fluorescence complementation (BiFC), bimolecular luminescence complementation (BiLC), enzyme fragment complementation (e.g., DiscoveRx’s PathHunter®), and proteolysis-based reporter systems (e.g., Invitrogen’s Tango™). The GPCR-HIT technique was recently demonstrated for two well characterized heteromers, CCR2–CXCR4 and CCR2–CCR5 (86). In this study, untagged CCR2 was co-expressed with β-arrestin2/Venus YFP and Rluc8-tagged CXCR4 or CCR5. Addition of CCL2, the ligand selective for CCR2, caused an increase in BRET signal indicative of β-arrestin recruitment to the heteromeric complex (86). In addition to dose–response and kinetic profiles, Z′ factors were determined (>0.6) for β-arrestin recruitment, which demonstrate the suitability of this assay for drug screening programs (86).
GPCR-Heteromer Identification Technology was used to identify and profile a novel α1AAR–CXCR2 heteromer, potentially relevant to benign prostate hyperplasia (BPH) (92). The α1AAR is an important mediator of prostatic smooth muscle tone and lower urinary tract function. Consequently, α1AAR antagonists are used in the treatment of BPH (93). Typically, α1AAR interacts extremely weakly, if at all, with β-arrestin in HEK293 cells (94). However, α1AAR coimmunoprecipitates with β-arrestin in prostate smooth muscle cells (95), suggesting a necessary cofactor may be missing in HEK293 cells. We employed GPCR-HIT in HEK293 cells using BRET with β-arrestin2/Venus as the acceptor. When α1AAR/Rluc8 was expressed alone, norepinephrine failed to induce recruitment of β-arrestin2/Venus to the receptor. However, when CXCR2 was co-expressed, norepinephrine caused a marked increase in BRET signal, suggestive of a heteromeric complex. Further investigation using CXCR2/Rluc8 and untagged α1AAR with β-arrestin2/Venus revealed a much larger increase in BRET signal compared to the reverse (BRET tag) configuration, indicating that β-arrestin2 may be recruited to CXCR2 via an allosteric interaction with norepinephrine-activated α1AAR. Interestingly, the norepinephrine-dependent β-arrestin recruitment was inhibited by SB265610, a CXCR2-specific inverse agonist, in addition to Terazosin, an α1AAR antagonist. Furthermore, BRET studies with both receptors tagged suggest that α1AAR–CXCR2 heteromerization is constitutive and not ligand-dependent (92).
Critically, the increase in signal observed with GPCR-HIT is ligand-dependent and specific to the heteromeric complex. The latter attribute is particularly important for demonstrating unique pharmacology arising from heteromerization, whilst the former enables heteromer-specific or biased compound screening and profiling (89, 91). BRET saturation and competition assays are often used to demonstrate the specificity of an interaction, however, they do not provide important functional information, as demonstrated when BRET saturation experiments were used to assess the α1AAR–CXCR2 heteromer using α1AAR and vasopressin receptor 2 (V2R) as a control (92). Surprisingly, co-expression of α1AAR and V2R also resulted in a hyperbolic curve indicative of specific proximity, despite a distinct lack of noticeable change in receptor pharmacology and an absence of norepinephrine-induced β-arrestin recruitment. In contrast, norepinephrine caused a marked increase in β-arrestin recruitment to the α1AAR–CXCR2 heteromer when compared to α1AAR alone (92). BRET competition assay data, where increasing expression of an unlabeled receptor reduces the BRET signal between BRET-tagged receptors, should also be interpreted with caution. This is because increasing the expression of unlabeled receptor can result in lower expression of the BRET-tagged receptors, artifactually resulting in a lower BRET signal (29). Therefore, whenever such competition data are presented, they should be supported by data showing relative receptor expression levels in the presence and absence of the competitor.
Protein-Fragment Complementation Assay
Protein-fragment complementation assay (PCA) represents another useful method for examining protein–protein interactions both in vitro and in vivo (96, 97). With this approach, each protein of interest is fused to one component of a split reporter protein (Figure 2). In the absence of any interaction, the separate fragments remain inactive (Figure 2A), however, when the two proteins of interest interact in an appropriate manner, the complementary fragments recombine to form a functional reporter protein (Figure 2B). Various reporters can be used including β-lactamase, dihydrofolate reductase, tobacco etch virus (TEV) protease, GFP variants (termed BiFC), and luciferase (termed bimolecular luminescence complementation, BiLC) (98, 99). Each has particular advantages and limitations depending on the application. For example, BiFC can be combined with fluorescence microscopy to investigate the intracellular localization of the interacting proteins. However, the recombination of GFP variants is irreversible, and interactions cannot be visualized in real time due to the slow maturation of the GFP. In contrast, luciferase-based PCA fragments appear to mature faster and are thought to be more reversible (97, 100). On the other hand, luminescence-based assays are generally not suitable for high resolution imaging. PCA is particularly useful for detecting weak protein–protein interactions and can provide some measure of affinity, as for weak interactions, BiFC signals are believed to be proportional to interaction strength (101). However, careful selection of experimental controls is also required (99), as by necessity the two reporter fragments must retain some affinity for one another. Nevertheless, when combined with other approaches, PCA is clearly a powerful technique. For example, BiFC and GPCR-HIT were recently used in parallel to investigate the novel pharmacology of AT1–AT2 heteromers (90).
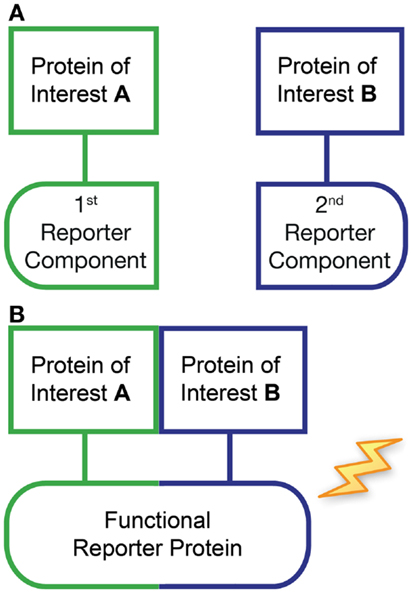
Figure 2. Protein-fragment complementation assay (PCA). This approach typically utilizes the expression of two recombinant proteins of interest fused to fragments of a split reporter protein (first and second reporter components). In the absence of any interaction between the proteins of interest, the separate reporter fragments remain inactive (A). However, if the two proteins of interest come into close proximity then the accompanying complementary reporter fragments are capable of recombining to form a functional protein, resulting in an increase in reporter signal (B).
Combinations of PCA and RET Approaches
Protein-fragment complementation assay can also be combined with BRET or FRET to examine complexes containing three or more proteins. For example a combination of BRET and BiFC, using Rluc-tagged adenosine A2A receptors (A2AR), along with A2AR-N-YFP and A2AR-C-YFP, was used to detect higher-order oligomeric complexes of A2AR (102). Similarly, BRET experiments have been carried out with dopamine D1 and D2 receptors tagged with split Rluc8 fragments as well as Venus-tagged Gα subunits, to demonstrate functional selectivity arising from heteromerization (103). Furthermore, by using four fragments (split Rluc and split Venus), Guo et al. demonstrated that the dopamine D2 receptor (D2R) can exist in a complex of at least four receptor protomers (104). BRET has also been combined with FRET to give sequential RET (SRET) (105). Combinations of three fusion proteins were used, Rluc-, YFP-, and DsRed-tagged (SRET1) or Rluc-, GFP2-, and YFP-tagged (SRET2) (105). If all three proteins are present in a complex, then Rluc substrate oxidation enables energy transfer from Rluc to the BRET acceptor (e.g., YFP), which then has the potential to act as a FRET donor to give sequential energy transfer to the FRET acceptor (e.g., DsRed). Complex formation is then inferred by specific measurement of FRET acceptor emission. This approach was recently used to provide evidence for heteromerization of adenosine A2A, dopamine D2, and cannabinoid CB1 receptors (105). Similarly, SRET was used to investigate higher-order complexes of adenosine A2A, D2, and mGlu5 receptors (106).
Proximity Ligation Assay
Proximity ligation assay (PLA) is a highly sensitive technique used to directly visualize protein–protein interactions with single-molecule resolution (107). PLA is an antibody-based approach of which several variations exist [see Ref. (108) for review]. In one of the more commonly used formats, two proteins of interest are targeted with primary antibodies from different species, and further labeled with two specific secondary antibodies conjugated to oligonucleotides. Complementary oligonucleotides are added to enable proximity-dependent (<40 nm) hybridization and ligation to form a circular DNA template. The template is then amplified in situ and visualized with a fluorescently labeled oligonucleotide probe. This approach yields a number of advantages over well-established imaging techniques in that the amplification step enables the visualization of individual protein complexes, whilst the in situ nature of the assay allows for determination of subcellular localization. Furthermore, as bioengineered protein constructs are not required, PLA can be used to visualize protein–protein interactions in primary tissue. Notably, PLA was used in a recent study in the Javitch laboratory to identify dopamine D2 and adenosine A2A receptor heteromers in the striatum of mice ex vivo (109). An important caveat is that PLA requires the use of well-validated antibodies, which are not always available for GPCRs. Nevertheless, PLA remains a powerful technique for investigating GPCR heteromers, as exemplified by studies on dopamine D2–D4 receptor heteromers in HEK293T cells (110) and cysteinyl leukotriene receptor-1 and -2 heteromers in INT-407 intestinal epithelial cells (111).
Fluorescently Labeled Ligands to Detect GPCR Complexes
The cellular context within which a receptor is located can have a major impact on ligand-binding affinity, efficacy, and the signaling pathways that are subsequently activated (112–114). It is therefore important to derive methods for the measurement of ligand-binding affinity in living cells where the integrity of the local cellular environment is maintained under physiological conditions. Fluorescence-based ligand-binding assays have the sensitivity and resolution to make measurements at the single-cell level and high quality fluorescent ligands (both agonists and antagonists) have become available in recent years to study GPCRs (115–119). These have been successfully applied to imaging experiments using confocal microscopy (117, 118, 120–122) and more recently to fragment screening strategies in living cells using automated confocal imaging plate readers (123). The ability to monitor ligand binding with fluorescent ligands in real time and at the level of single living cells has also provided powerful insights into the kinetics of ligand association and dissociation (42, 124, 125). Furthermore, the ability to evaluate the influence of non-fluorescent ligands on the dissociation kinetics of an orthosteric fluorescent ligand has provided an opportunity for the study of allosterism and negative cooperativity across dimer interfaces (42, 124, 125).
Fluorescent ligands have also been utilized with total internal reflection fluorescence (TIRF) microscopy. For example, a recent study identified individual M1 muscarinic receptors and determined their dimerization kinetics using TIRF and the fluorescent antagonist, Cy3B–telenzepine (126). Similarly, the monomer/dimer equilibrium of N-formyl peptide receptors was measured using TIRF and Alexa Fluor 594-conjugated N-formyl hexa-amino-acid peptide (127).
In addition to the direct imaging of the binding of a fluorescent ligand to an untagged wild-type receptor, fluorescent ligands have also been used in TR-FRET applications where the ligand and receptor (N-terminal) have been labeled with compatible TR-FRET partners (41). This has also been adapted to apply TR-FRET to the study of receptor dimers in native tissues (43). A similar strategy can be applied with NanoBRET™, using fluorescent ligands and GPCRs tagged on their N-terminus with NanoLuc™.
Fluorescence Correlation Spectroscopy and the Measurement of Ligand-Binding in Single Cells, Membrane Microdomains, and Nanodiscs
Biased signaling to particular intracellular signaling pathways (113, 128–130) can be considered to be equivalent to the regulation of GPCR ligand-binding and efficacy caused by small allosteric ligands. In this case, however, it is the binding of intracellular signaling proteins to the intracellular facing domains of the GPCR that mediates the allosteric effect. It is well-established that allosteric ligands bind to a site distinct from the orthosteric binding site occupied by the endogenous natural ligand and produce conformational changes in the receptor that may alter orthosteric ligand-binding affinity, agonist efficacy, or both (113, 131–133). In a similar manner, the interaction of a signaling protein with a receptor has the potential to change the binding affinity of the orthosteric ligand as a consequence of this allosteric interaction. A feature of allosterism is that the effects observed are probe-dependent (113, 132, 133). This means that the consequence of any allosteric influence on the receptor will depend on the ligand (probe) occupying the orthosteric site. As a consequence, agonists will usually have a higher affinity for the receptor when it is bound to an intracellular signaling protein and this will depend on both the orthosteric agonist involved and the signaling protein to which the receptor is coupled. This can manifest as signaling bias.
The location of the receptor and the signaling proteins can also have a major impact on the signaling outcome of receptor activation. It is now known that GPCRs and signaling proteins can be compartmentalized within the cell membrane (134–137). It is also clear that signaling from GPCRs can be mediated from intracellular domains following their internalization (138–141). This not only provides a mechanism by which intracellular signaling can be orchestrated by location within a cell, but also points to the potential for different signaling pathways to be activated by the same receptor in different cellular or membrane locations (135–137). The latter possibility raises the need to develop techniques by which the pharmacology of a receptor in a specific domain or location can be monitored. One such technique is fluorescence correlation spectroscopy (FCS) (142).
Fluorescence correlation spectroscopy is a quantitative biophysical technique that can measure the diffusional characteristics and estimate the number of fluorescent particles (e.g., GPCR complexes, signaling proteins, or fluorescent ligand-occupied receptor complexes) within highly localized membrane microdomains of single living cells (~0.2 μm2) (142–146). Fluorescent ligands in combination with FCS have also been used to study the properties and behavior of a number of different GPCRs in discrete membrane microdomains of single cells (117, 120, 134).
Fluorescence correlation spectroscopy uses a small confocal detection volume created by focusing a laser to a diffraction-limited spot using a lens with a high numerical aperture [see Ref. (142) for further details]. Essentially, the resulting detection volume is approximately 0.25–0.5 fl depending on the particular excitation wavelength being used (i.e., a larger volume is created with a red 633 nm laser compared to a green 488 nm laser). As fluorescent molecules (free fluorescent ligands, receptor-bound fluorescent ligands, GFP-tagged receptor complexes) diffuse through this volume, they are excited by the laser and the emitted photons are detected in a time-correlated manner using a single-photon counting device (e.g., an avalanche photodiode). Over a period of time, this leads to fluctuations in the measured mean level of fluorescence intensity. Autocorrelation analysis (142) of these fluctuations provides information on how long the species responsible for a particular fluorescent fluctuation is present within the confocal volume (the average dwell time, tD) and also the number (N) of diffusing fluorescent species present. As the fluorescent fluctuation data are collected in a time-correlated manner, it is possible to extract from this information the number of fluorescent particles present with particular tD values in complex mixtures (142).
In the context of ligand-binding experiments, it is therefore possible to obtain from FCS experiments the concentrations (deduced from N and the actual confocal volume) of both fluorescent ligand and ligand–receptor complexes on the basis of their differing diffusion coefficients (117, 120, 134, 142). For example, previous FCS work with a fluorescent adenosine A3 receptor (A3R) agonist in CHO cells expressing the human A3R revealed an agonist-occupied A3R complex with a membrane diffusion coefficient of 0.12 μ2m/s (134). It is worth pointing out that this is too slow to represent a single receptor and is more likely to be representative of an oligomeric signaling complex within which the receptor resides (117). Competition studies with an A3R-antagonist (MRS1220) and an A3R-agonist (NECA) indicated that this component had high affinity (low nanomoles) for both agonists and antagonists (134). These data suggest that, at the very low concentrations of fluorescent A3R-agonist required for FCS, selective labeling of the active (R*) form of the A3R can be achieved (134). Furthermore, the lack of effect of pertussis toxin on this high-affinity agonist binding suggested that the agonist-occupied receptor detected was not coupled to Gi proteins (134).
The ability of FCS to effectively work at high resolution in single-photon detection mode means that it also has the potential to monitor ligand-binding events to solubilized and purified GPCRs. The most successful approach to the reconstitution of these purified GPCRs into a membrane environment has come from the use of high-density lipoproteins (HDLs). HDLs, which are composed of a dimer of apolipoprotein A–I surrounding a planar bilayer of approximately 160 phospholipids, can be reconstituted in vitro to produce a disk-shaped structure (nanodisc or nanolipoprotein particle) of 10–12 nm in diameter and a thickness of 40 Å (147). Recently, nanodiscs have been used to solubilize the Neurokinin 1 receptor (NK1R) and to investigate the kinetics of the binding of fluorescent substance P to substance P-bound NK1R contained within nanodiscs (148). The combination of these techniques has the potential to investigate ligand-binding to defined receptor–receptor and receptor–signaling protein stoichiometries (149).
Concluding Remarks
As our understanding of GPCRs has improved, revealing the concepts of ligand and receptor bias, allosterism, and oligomerization, so have biophysical technologies to monitor and evaluate their function in ever more physiologically relevant ways. There is now a bewildering array of approaches available, each with their own strengths and weaknesses. Rigorously controlled application of these technologies promises to unlock many more secrets of the ever important GPCR superfamily.
Conflict of Interest Statement
In addition to being Head of Molecular Endocrinology and Pharmacology, Harry Perkins Institute of Medical Research and Centre for Medical Research, The University of Western Australia, Kevin D. G. Pfleger is a Chief Scientific Officer of Dimerix Bioscience, a spin-out company of The University of Western Australia that has been assigned the rights to the “Receptor-HIT.” Kevin D. G. Pfleger is an inventor on patents covering the technology and has a minor shareholding in Dimerix. Stephen J. Hill is a founding Director of the University of Nottingham spin-out company CellAura Technologies that markets fluorescent ligands. The other co-authors report no conflicts of interest.
Acknowledgments
Work in Kevin D. G. Pfleger’s laboratory is currently funded by the Australian Research Council (ARC; DP120101297 and LP130100037) and Dimerix Bioscience Pty Ltd. The University of Nottingham, Promega Corporation, and BMG Labtech Pty Ltd. provide funding as partner organizations of the ARC Linkage Grant LP130100037 for development of NanoBRET™ technologies, of which Kevin D. G. Pfleger is Chief Investigator and Stephen J. Hill is a Partner Investigator. Kevin D. G. Pfleger is an ARC Future Fellow (FT100100271). This review is, in part, an outcome of a Raine Visiting Professorship awarded to Stephen J. Hill by the Raine Medical Research Foundation. Work in Stephen J. Hill’s laboratory was funded by the Medical Research Council (G0800006).
References
1. Bockaert J, Philippe Pin J. Molecular tinkering of G protein-coupled receptors: an evolutionary success. EMBO J (1999) 18(7):1723–9. doi: 10.1093/emboj/18.7.1723
2. Wise A, Gearing K, Rees S. Target validation of G-protein coupled receptors. Drug Discov Today (2002) 7(4):235–46. doi:10.1016/s1359-6446(01)02131-6
3. Dorsam RT, Gutkind JS. G-protein-coupled receptors and cancer. Nat Rev Cancer (2007) 7(2):79–94. doi:10.1038/nrc2069
4. Wilson S, Bergsma D. Orphan G-protein coupled receptors: novel drug targets for the pharmaceutical industry. Drug Des Discov (2000) 17(2):105–14.
5. Garland SL. Are GPCRs still a source of new targets? J Biomol Screen (2013) 18(9):947–66. doi:10.1177/1087057113498418
6. Agnati LF, Ferré S, Lluis C, Franco R, Fuxe K. Molecular mechanisms and therapeutical implications of intramembrane receptor/receptor interactions among heptahelical receptors with examples from the striatopallidal GABA neurons. Pharmacol Rev (2003) 55(3):509–50. doi:10.1124/pr.55.3.2
7. Angers S, Salahpour A, Bouvier M. Dimerization: an emerging concept for G protein-coupled receptor ontogeny and function. Annu Rev Pharmacol Toxicol (2002) 42:409–35. doi:10.1146/annurev.pharmtox.42.091701.082314
8. Gonzalez-Maeso J. GPCR oligomers in pharmacology and signaling. Mol Brain (2011) 4(1):20. doi:10.1186/1756-6606-4-20
9. Jones KA, Borowsky B, Tamm JA, Craig DA, Durkin MM, Dai M, et al. GABAB receptors function as a heteromeric assembly of the subunits GABABR1 and GABABR2. Nature (1998) 396(6712):674–9. doi:10.1038/25460
10. Kaupmann K, Malitschek B, Schuler V, Heid J, Froestl W, Beck P, et al. GABAB-receptor subtypes assemble into functional heteromeric complexes. Nature (1998) 396(6712):683–7. doi:10.1038/25360
11. White JH, Wise A, Main MJ, Green A, Fraser NJ, Disney GH, et al. Heterodimerization is required for the formation of a functional GABA(B) receptor. Nature (1998) 396(6712):679–82. doi:10.1038/25354
12. Li X, Staszewski L, Xu H, Durick K, Zoller M, Adler E. Human receptors for sweet and umami taste. Proc Natl Acad Sci U S A (2002) 99(7):4692–6. doi:10.1073/pnas.072090199
13. Nelson G, Chandrashekar J, Hoon MA, Feng L, Zhao G, Ryba NJ, et al. An amino-acid taste receptor. Nature (2002) 416(6877):199–202. doi:10.1038/nature726
14. Nelson G, Hoon MA, Chandrashekar J, Zhang Y, Ryba NJ, Zuker CS. Mammalian sweet taste receptors. Cell (2001) 106(3):381–90. doi:10.1016/S0092-8674(01)00451-2
15. González S, Moreno-Delgado D, Moreno E, Pérez-Capote K, Franco R, Mallol J, et al. Circadian-related heteromerization of adrenergic and dopamine D4 receptors modulates melatonin synthesis and release in the pineal gland. PLoS Biol (2012) 10(6):e1001347. doi:10.1371/journal.pbio.1001347
16. Kern A, Albarran-Zeckler R, Walsh Heidi E, Smith Roy G. Apo-Ghrelin receptor forms heteromers with DRD2 in hypothalamic neurons and is essential for anorexigenic effects of DRD2 agonism. Neuron (2012) 73(2):317–32. doi:10.1016/j.neuron.2011.10.038
17. Liu X-Y, Liu Z-C, Sun Y-G, Ross M, Kim S, Tsai F-F, et al. Unidirectional cross-activation of GRPR by MOR1D uncouples itch and analgesia induced by opioids. Cell (2011) 147(2):447–58. doi:10.1016/j.cell.2011.08.043
18. Rivero-Müller A, Chou Y-Y, Ji I, Lajic S, Hanyaloglu AC, Jonas K, et al. Rescue of defective G protein-coupled receptor function in vivo by intermolecular cooperation. Proc Natl Acad Sci U S A (2010) 107(5):2319–24. doi:10.1073/pnas.0906695106
19. Fribourg M, Moreno José L, Holloway T, Provasi D, Baki L, Mahajan R, et al. Decoding the signaling of a GPCR heteromeric complex reveals a unifying mechanism of action of antipsychotic drugs. Cell (2011) 147(5):1011–23. doi:10.1016/j.cell.2011.09.055
20. Costantino CM, Gomes I, Stockton SD, Lim MP, Devi LA. Opioid receptor heteromers in analgesia. Expert Rev Mol Med (2012) 14:e9. doi:10.1017/erm.2012.5
21. Kroeger KM, Pfleger KDG, Eidne KA. Biophysical and biochemical methods to study GPCR oligomerization. In: Devi LA editor. The G Protein-Coupled Receptors Handbook. Contemporary Clinical Neuroscience. Totowa, NJ: Humana Press (2005). p. 217–41.
22. Dalrymple MB, Pfleger KDG, Eidne KA. G protein-coupled receptor dimers: functional consequences, disease states and drug targets. Pharmacol Ther (2008) 118(3):359–71. doi:10.1016/j.pharmthera.2008.03.004
23. Rozenfeld R, Devi LA. Exploring a role for heteromerization in GPCR signalling specificity. Biochem J (2010) 433(1):11–8. doi:10.1042/bj20100458
24. Kamal M, Jockers R. Biological significance of GPCR heteromerization in the neuro-endocrine system. Front Endocrinol (Lausanne) (2011) 2:2. doi:10.3389/fendo.2011.00002
25. Vischer HF, Watts AO, Nijmeijer S, Leurs R. G protein-coupled receptors: walking hand-in-hand, talking hand-in-hand? Br J Pharmacol (2011) 163(2):246–60. doi:10.1111/j.1476-5381.2011.01229.x
26. Loening AM, Wu AM, Gambhir SS. Red-shifted Renilla reniformis luciferase variants for imaging in living subjects. Nat Methods (2007) 4(8):641–3. doi:10.1038/nmeth1070
27. Loening AM, Fenn TD, Wu AM, Gambhir SS. Consensus guided mutagenesis of Renilla luciferase yields enhanced stability and light output. Protein Eng Des Sel (2006) 19(9):391–400. doi:10.1093/protein/gzl023
28. Hall MP, Unch J, Binkowski BF, Valley MP, Butler BL, Wood MG, et al. Engineered luciferase reporter from a deep sea shrimp utilizing a novel imidazopyrazinone substrate. ACS Chem Biol (2012) 7(11):1848–57. doi:10.1021/cb3002478
29. Pfleger KDG, Eidne KA. Illuminating insights into protein-protein interactions using bioluminescence resonance energy transfer (BRET). Nat Methods (2006) 3(3):165–74. doi:10.1038/nmeth841
30. Ayoub MA, Pfleger KDG. Recent advances in bioluminescence resonance energy transfer technologies to study GPCR heteromerization. Curr Opin Pharmacol (2010) 10(1):44–52. doi:10.1016/j.coph.2009.09.012
31. Jaeger WC, Pfleger KDG, Eidne KA. Monitoring GPCR–protein complexes using bioluminescence resonance energy transfer. In: Poyner DR, Wheatley M, editors. G Protein-Coupled Receptors: Essential Methods. Oxford, UK: Wiley-Blackwell (2010). p. 111–32. doi:10.1002/9780470749210.ch6
32. Miyawaki A. Development of probes for cellular functions using fluorescent proteins and fluorescence resonance energy transfer. Annu Rev Biochem (2011) 80(1):357–73. doi:10.1146/annurev-biochem-072909-094736
33. Pfleger KD, Eidne KA. Monitoring the formation of dynamic G-protein-coupled receptor-protein complexes in living cells. Biochem J (2005) 385(Pt 3):625–37. doi:10.1042/BJ20041361
34. Mustafa S, Hannagan J, Rigby P, Pfleger K, Corry B. Quantitative Förster resonance energy transfer efficiency measurements using simultaneous spectral unmixing of excitation and emission spectra. J Biomed Opt (2013) 18(2):26024. doi:10.1117/1.JBO.18.2.026024
35. Ciruela F, Vilardaga JP, Fernandez-Duenas V. Lighting up multiprotein complexes: lessons from GPCR oligomerization. Trends Biotechnol (2010) 28(8):407–15. doi:10.1016/j.tibtech.2010.05.002
36. Madiraju C, Welsh K, Cuddy MP, Godoi PH, Pass I, Ngo T, et al. TR-FRET-based high-throughput screening assay for identification of UBC13 inhibitors. J Biomol Screen (2012) 17(2):163–76. doi:10.1177/1087057111423417
37. Ward RJ, Pediani JD, Milligan G. Heteromultimerization of cannabinoid CB1 receptor and orexin OX1 receptor generates a unique complex in which both protomers are regulated by orexin A. J Biol Chem (2011) 286(43):37414–28. doi:10.1074/jbc.M111.287649
38. Doumazane E, Scholler P, Zwier JM, Trinquet E, Rondard P, Pin JP. A new approach to analyze cell surface protein complexes reveals specific heterodimeric metabotropic glutamate receptors. FASEB J (2011) 25(1):66–77. doi:10.1096/fj.10-163147
39. Pou C, Mannoury la Cour C, Stoddart LA, Millan MJ, Milligan G. Functional homomers and heteromers of dopamine D2L and D3 receptors co-exist at the cell surface. J Biol Chem (2012) 287(12):8864–78. doi:10.1074/jbc.M111.326678
40. Kuder K, Kiec-Kononowicz K. Fluorescent GPCR ligands as new tools in pharmacology. Curr Med Chem (2008) 15(21):2132–43. doi:10.2174/092986708785747599
41. Cottet M, Faklaris O, Falco A, Trinquet E, Pin JP, Mouillac B, et al. Fluorescent ligands to investigate GPCR binding properties and oligomerization. Biochem Soc Trans (2013) 41(1):148–53. doi:10.1042/bst20120237
42. May LT, Bridge LJ, Stoddart LA, Briddon SJ, Hill SJ. Allosteric interactions across native adenosine-A3 receptor homodimers: quantification using single-cell ligand-binding kinetics. FASEB J (2011) 25(10):3465–76. doi:10.1096/fj.11-186296
43. Albizu L, Cottet M, Kralikova M, Stoev S, Seyer R, Brabet I, et al. Time-resolved FRET between GPCR ligands reveals oligomers in native tissues. Nat Chem Biol (2010) 6(8):587–94. doi:10.1038/nchembio.396
44. Cottet M, Faklaris O, Maurel D, Scholler P, Doumazane E, Trinquet E, et al. BRET and Time-resolved FRET strategy to study GPCR oligomerization: from cell lines toward native tissues. Front Endocrinol (Lausanne) (2012) 3:92. doi:10.3389/fendo.2012.00092
45. Gaborit N, Larbouret C, Vallaghe J, Peyrusson F, Bascoul-Mollevi C, Crapez E, et al. Time-resolved fluorescence resonance energy transfer (TR-FRET) to analyze the disruption of EGFR/HER2 dimers: a new method to evaluate the efficiency of targeted therapy using monoclonal antibodies. J Biol Chem (2011) 286(13):11337–45. doi:10.1074/jbc.M111.223503
46. Watts AO, van Lipzig MM, Jaeger WC, Seeber RM, van Zwam M, Vinet J, et al. Identification and profiling of CXCR3-CXCR4 chemokine receptor heteromer complexes. Br J Pharmacol (2013) 168(7):1662–74. doi:10.1111/bph.12064
47. Pfleger KD, Seeber RM, Eidne KA. Bioluminescence resonance energy transfer (BRET) for the real-time detection of protein-protein interactions. Nat Protoc (2006) 1(1):337–45. doi:10.1038/nprot.2006.52
48. Kocan M, Pfleger KD. Study of GPCR-protein interactions by BRET. Methods Mol Biol (2011) 746:357–71. doi:10.1007/978-1-61779-126-0_20
49. Pfleger KD, Eidne KA. New technologies: bioluminescence resonance energy transfer (BRET) for the detection of real time interactions involving G-protein coupled receptors. Pituitary (2003) 6(3):141–51. doi:10.1023/B:PITU.0000011175.41760.5d
50. Xu Y, Piston DW, Johnson CH. A bioluminescence resonance energy transfer (BRET) system: application to interacting circadian clock proteins. Proc Natl Acad Sci U S A (1999) 96(1):151–6. doi:10.1073/pnas.96.1.151
51. Kocan M, Pfleger KD. Detection of GPCR/beta-arrestin interactions in live cells using bioluminescence resonance energy transfer technology. Methods Mol Biol (2009) 552:305–17. doi:10.1007/978-1-60327-317-6_22
52. Mercier JF, Salahpour A, Angers S, Breit A, Bouvier M. Quantitative assessment of beta 1- and beta 2-adrenergic receptor homo- and heterodimerization by bioluminescence resonance energy transfer. J Biol Chem (2002) 277(47):44925–31. doi:10.1074/jbc.M205767200
53. Gales C, Rebois RV, Hogue M, Trieu P, Breit A, Hebert TE, et al. Real-time monitoring of receptor and G-protein interactions in living cells. Nat Methods (2005) 2(3):177–84. doi:10.1038/nmeth743
54. Kocan M, See HB, Sampaio NG, Eidne KA, Feldman BJ, Pfleger KD. Agonist-independent interactions between beta-arrestins and mutant vasopressin type II receptors associated with nephrogenic syndrome of inappropriate antidiuresis. Mol Endocrinol (2009) 23(4):559–71. doi:10.1210/me.2008-0321
55. Kocan M, Dalrymple MB, Seeber RM, Feldman BJ, Pfleger KD. Enhanced BRET technology for the monitoring of agonist-induced and agonist-independent interactions between GPCRs and beta-Arrestins. Front Endocrinol (Lausanne) (2011) 1:12. doi:10.3389/fendo.2010.00012
56. Hamdan FF, Audet M, Garneau P, Pelletier J, Bouvier M. High-throughput screening of G protein-coupled receptor antagonists using a bioluminescence resonance energy transfer 1-based beta-arrestin2 recruitment assay. J Biomol Screen (2005) 10(5):463–75. doi:10.1177/1087057105275344
57. Kocan M, See HB, Seeber RM, Eidne KA, Pfleger KD. Demonstration of improvements to the bioluminescence resonance energy transfer (BRET) technology for the monitoring of G protein-coupled receptors in live cells. J Biomol Screen (2008) 13(9):888–98. doi:10.1177/1087057108324032
58. Dacres H, Michie M, Wang J, Pfleger KD, Trowell SC. Effect of enhanced Renilla luciferase and fluorescent protein variants on the Förster distance of Bioluminescence resonance energy transfer (BRET). Biochem Biophys Res Commun (2012) 425(3):625–9. doi:10.1016/j.bbrc.2012.07.133
59. Pfleger KD, Dromey JR, Dalrymple MB, Lim EM, Thomas WG, Eidne KA. Extended bioluminescence resonance energy transfer (eBRET) for monitoring prolonged protein-protein interactions in live cells. Cell Signal (2006) 18(10):1664–70. doi:10.1016/j.cellsig.2006.01.004
60. Pfleger KD. Analysis of protein-protein interactions using bioluminescence resonance energy transfer. Methods Mol Biol (2009) 574:173–83. doi:10.1007/978-1-60327-321-3_14
61. Armstrong SP, Seeber RM, Ayoub MA, Feldman BJ, Pfleger KD. Characterization of three vasopressin receptor 2 variants: an apparent polymorphism (V266A) and two loss-of-function mutations (R181C and M311V). PLoS One (2013) 8(6):e65885. doi:10.1371/journal.pone.0065885
62. Jaeger WC, Seeber RM, Eidne KA, Pfleger KDG. Molecular determinants of orexin receptor-arrestin-ubiquitin complex formation. Br J Pharmacol (2014) 171(2):364–74. doi:10.1111/bph.12481
63. Levi J, De A, Cheng Z, Gambhir SS. Bisdeoxycoelenterazine derivatives for improvement of bioluminescence resonance energy transfer assays. J Am Chem Soc (2007) 129(39):11900–1. doi:10.1021/ja073936h
64. Dragulescu-Andrasi A, Chan CT, De A, Massoud TF, Gambhir SS. Bioluminescence resonance energy transfer (BRET) imaging of protein-protein interactions within deep tissues of living subjects. Proc Natl Acad Sci U S A (2011) 108(29):12060–5. doi:10.1073/pnas.1100923108
65. De A, Ray P, Loening AM, Gambhir SS. BRET3: a red-shifted bioluminescence resonance energy transfer (BRET)-based integrated platform for imaging protein-protein interactions from single live cells and living animals. FASEB J (2009) 23(8):2702–9. doi:10.1096/fj.08-118919
66. Breton B, Sauvageau E, Zhou J, Bonin H, Le Gouill C, Bouvier M. Multiplexing of multicolor bioluminescence resonance energy transfer. Biophys J (2010) 99(12):4037–46. doi:10.1016/j.bpj.2010.10.025
67. Breton B, Lagace M, Bouvier M. Combining resonance energy transfer methods reveals a complex between the alpha2A-adrenergic receptor, Gαi1β1γ2, and GRK2. FASEB J (2010) 24(12):4733–43. doi:10.1096/fj.10-164061
68. Kiyokawa E, Aoki K, Nakamura T, Matsuda M. Spatiotemporal regulation of small GTPases as revealed by probes based on the principle of Forster Resonance Energy Transfer (FRET): implications for signaling and pharmacology. Annu Rev Pharmacol Toxicol (2011) 51:337–58. doi:10.1146/annurev-pharmtox-010510-100234
69. Komatsu N, Aoki K, Yamada M, Yukinaga H, Fujita Y, Kamioka Y, et al. Development of an optimized backbone of FRET biosensors for kinases and GTPases. Mol Biol Cell (2011) 22(23):4647–56. doi:10.1091/mbc.E11-01-0072
70. Balla A, Erdelyi LS, Soltesz-Katona E, Balla T, Varnai P, Hunyady L. Demonstration of angiotensin II-induced Ras activation in the trans-Golgi network and endoplasmic reticulum using bioluminescence resonance energy transfer-based biosensors. J Biol Chem (2011) 286(7):5319–27. doi:10.1074/jbc.M110.176933
71. Pfeffer SR. Rab GTPases: specifying and deciphering organelle identity and function. Trends Cell Biol (2001) 11(12):487–91. doi:10.1016/S0962-8924(01)02147-X
72. Xu C, Peter M, Bouquier N, Ollendorff V, Villamil I, Liu J, et al. REV, A BRET-based sensor of ERK activity. Front Endocrinol (Lausanne) (2013) 4:95. doi:10.3389/fendo.2013.00095
73. Ayoub MA, Damian M, Gespach C, Ferrandis E, Lavergne O, De Wever O, et al. Inhibition of heterotrimeric G protein signaling by a small molecule acting on Galpha subunit. J Biol Chem (2009) 284(42):29136–45. doi:10.1074/jbc.M109.042333
74. Ayoub MA, Maurel D, Binet V, Fink M, Prezeau L, Ansanay H, et al. Real-time analysis of agonist-induced activation of protease-activated receptor 1/Galphai1 protein complex measured by bioluminescence resonance energy transfer in living cells. Mol Pharmacol (2007) 71(5):1329–40. doi:10.1124/mol.106.030304
75. Ayoub MA, Trinquet E, Pfleger KD, Pin JP. Differential association modes of the thrombin receptor PAR1 with Galphai1, Galpha12, and beta-arrestin 1. FASEB J (2010) 24(9):3522–35. doi:10.1096/fj.10-154997
76. Jiang LI, Collins J, Davis R, Lin K-M, DeCamp D, Roach T, et al. Use of a cAMP BRET sensor to characterize a novel regulation of cAMP by the sphingosine 1-phosphate/G13 pathway. J Biol Chem (2007) 282(14):10576–84. doi:10.1074/jbc.M609695200
77. Prinz A, Diskar M, Erlbruch A, Herberg FW. Novel, isotype-specific sensors for protein kinase A subunit interaction based on bioluminescence resonance energy transfer (BRET). Cell Signal (2006) 18(10):1616–25. doi:10.1016/j.cellsig.2006.01.013
78. Salahpour A, Espinoza S, Masri B, Lam V, Barak L, Gainetdinov Raul R. BRET biosensors to study GPCR biology, pharmacology and signal transduction. Front Endocrinol (Lausanne) (2012) 3:105. doi:10.3389/fendo.2012.00105
79. Dacres H, Wang J, Leitch V, Horne I, Anderson AR, Trowell SC. Greatly enhanced detection of a volatile ligand at femtomolar levels using bioluminescence resonance energy transfer (BRET). Biosens Bioelectron (2011) 29(1):119–24. doi:10.1016/j.bios.2011.08.004
80. Degorce F, Card A, Soh S, Trinquet E, Knapik GP, Xie B. HTRF: a technology tailored for drug discovery – a review of theoretical aspects and recent applications. Curr Chem Genomics (2009) 3:22–32. doi:10.2174/1875397300903010022
81. Trinquet E, Bouhelal R, Dietz M. Monitoring Gq-coupled receptor response through inositol phosphate quantification with the IP-One assay. Expert Opin Drug Discov (2011) 6(10):981–94. doi:10.1517/17460441.2011.608658
82. Trinquet E, Fink M, Bazin H, Grillet F, Maurin F, Bourrier E, et al. D-myo-inositol 1-phosphate as a surrogate of D-myo-inositol 1,4,5-tris phosphate to monitor G protein-coupled receptor activation. Anal Biochem (2006) 358(1):126–35. doi:10.1016/j.ab.2006.08.002
83. Perroy J, Pontier S, Charest PG, Aubry M, Bouvier M. Real-time monitoring of ubiquitination in living cells by BRET. Nat Methods (2004) 1(3):203–8. doi:10.1038/nmeth722
84. Dalrymple MB, Jaeger WC, Eidne KA, Pfleger KD. Temporal profiling of orexin receptor-arrestin-ubiquitin complexes reveals differences between receptor subtypes. J Biol Chem (2011) 286(19):16726–33. doi:10.1074/jbc.M111.223537
85. Ferre S, Baler R, Bouvier M, Caron MG, Devi LA, Durroux T, et al. Building a new conceptual framework for receptor heteromers. Nat Chem Biol (2009) 5(3):131–4. doi:10.1038/nchembio0309-131
86. See HB, Seeber RM, Kocan M, Eidne KA, Pfleger KD. Application of G protein-coupled receptor-heteromer identification technology to monitor beta-arrestin recruitment to G protein-coupled receptor heteromers. Assay Drug Dev Technol (2011) 9(1):21–30. doi:10.1089/adt.2010.0336
87. Johnstone EKM, Pfleger K. Receptor-Heteromer Investigation Technology and its application using BRET. Front Endocrinol (Lausanne) (2012) 3:101. doi:10.3389/fendo.2012.00101
88. Ayoub MA, See HB, Seeber RM, Armstrong SP, Pfleger KD. Profiling epidermal growth factor receptor and heregulin receptor 3 heteromerization using receptor tyrosine kinase heteromer investigation technology. PLoS One (2013) 8(5):e64672. doi:10.1371/journal.pone.0064672
89. Mustafa S, Ayoub MA, Pfleger KDG. Uncovering GPCR heteromer-biased ligands. Drug Discov Today Technol (2010) 7(1):e77–85. doi:10.1016/j.ddtec.2010.06.003
90. Porrello ER, Pfleger KDG, Seeber RM, Qian H, Oro C, Abogadie F, et al. Heteromerization of angiotensin receptors changes trafficking and arrestin recruitment profiles. Cell Signal (2011) 23(11):1767–76. doi:10.1016/j.cellsig.2011.06.011
91. Mustafa S, Pfleger KDG. G protein-coupled receptor heteromer identification technology: identification and profiling of GPCR heteromers. J Lab Autom (2011) 16(4):285–91. doi:10.1016/j.jala.2011.03.002
92. Mustafa S, See HB, Seeber RM, Armstrong SP, White CW, Ventura S, et al. Identification and profiling of a novel α1A-adrenoceptor-CXC chemokine receptor 2 heteromer. J Biol Chem (2012) 287(16):12952–65. doi:10.1074/jbc.M111.322834
93. Michel MC, Vrydag W. α1-, α2- and β-adrenoceptors in the urinary bladder, urethra and prostate. Br J Pharmacol (2006) 147(S2):S88–119. doi:10.1038/sj.bjp.0706619
94. Stanasila L, Abuin L, Dey J, Cotecchia S. Different internalization properties of the alpha1a- and alpha1b-adrenergic receptor subtypes: the potential role of receptor interaction with beta-arrestins and AP50. Mol Pharmacol (2008) 74(3):562–73. doi:10.1124/mol.107.043422
95. Hennenberg M, Schlenker B, Roosen A, Strittmatter F, Walther S, Stief C, et al. Beta-arrestin-2 is expressed in human prostate smooth muscle and a binding partner of alpha1A-adrenoceptors. World J Urol (2011) 29(2):157–63. doi:10.1007/s00345-010-0634-3
96. Morell M, Ventura S, Aviles FX. Protein complementation assays: approaches for the in vivo analysis of protein interactions. FEBS Lett (2009) 583(11):1684–91. doi:10.1016/j.febslet.2009.03.002
97. Remy I, Michnick SW. A highly sensitive protein-protein interaction assay based on Gaussia luciferase. Nat Methods (2006) 3(12):977–9. doi:10.1038/nmeth979
98. Michnick SW, Ear PH, Manderson EN, Remy I, Stefan E. Universal strategies in research and drug discovery based on protein-fragment complementation assays. Nat Rev Drug Discov (2007) 6(7):569–82. doi:10.1038/nrd2311
99. Rose RH, Briddon SJ, Holliday ND. Bimolecular fluorescence complementation: lighting up seven transmembrane domain receptor signalling networks. Br J Pharmacol (2010) 159(4):738–50. doi:10.1111/j.1476-5381.2009.00480.x
100. Remy I, Michnick SW. Application of protein-fragment complementation assays in cell biology. Biotechniques (2007) 42(2):137. doi:10.2144/000112396 139, 141 passim,
101. Morell M, Espargaro A, Aviles FX, Ventura S. Study and selection of in vivo protein interactions by coupling bimolecular fluorescence complementation and flow cytometry. Nat Protoc (2008) 3(1):22–33. doi:10.1038/nprot.2007.496
102. Gandia J, Galino J, Amaral OB, Soriano A, Lluís C, Franco R, et al. Detection of higher-order G protein-coupled receptor oligomers by a combined BRET-BiFC technique. FEBS Lett (2008) 582(20):2979–84. doi:10.1016/j.febslet.2008.07.045
103. Urizar E, Yano H, Kolster R, Gales C, Lambert N, Javitch JA. CODA-RET reveals functional selectivity as a result of GPCR heteromerization. Nat Chem Biol (2011) 7(9):624–30. doi:10.1038/nchembio.623
104. Guo W, Urizar E, Kralikova M, Mobarec JC, Shi L, Filizola M, et al. Dopamine D2 receptors form higher order oligomers at physiological expression levels. EMBO J (2008) 27(17):2293–304. doi:10.1038/emboj.2008.153
105. Carriba P, Navarro G, Ciruela F, Ferre S, Casado V, Agnati L, et al. Detection of heteromerization of more than two proteins by sequential BRET-FRET. Nat Methods (2008) 5(8):727–33. doi:10.1038/nmeth.1229
106. Cabello N, Gandía J, Bertarelli DCG, Watanabe M, Lluís C, Franco R, et al. Metabotropic glutamate type 5, dopamine D2 and adenosine A2a receptors form higher-order oligomers in living cells. J Neurochem (2009) 109(5):1497–507. doi:10.1111/j.1471-4159.2009.06078.x
107. Soderberg O, Gullberg M, Jarvius M, Ridderstrale K, Leuchowius KJ, Jarvius J, et al. Direct observation of individual endogenous protein complexes in situ by proximity ligation. Nat Methods (2006) 3(12):995–1000. doi:10.1038/nmeth947
108. Weibrecht I, Leuchowius KJ, Clausson CM, Conze T, Jarvius M, Howell WM, et al. Proximity ligation assays: a recent addition to the proteomics toolbox. Expert Rev Proteomics (2010) 7(3):401–9. doi:10.1586/epr.10.10
109. Trifilieff P, Rives ML, Urizar E, Piskorowski RA, Vishwasrao HD, Castrillon J, et al. Detection of antigen interactions ex vivo by proximity ligation assay: endogenous dopamine D2-adenosine A2A receptor complexes in the striatum. Biotechniques (2011) 51(2):111–8. doi:10.2144/000113719
110. Borroto-Escuela DO, Craenenbroeck KV, Romero-Fernandez W, Guidolin D, Woods AS, Rivera A, et al. Dopamine D2 and D4 receptor heteromerization and its allosteric receptor-receptor interactions. Biochem Biophys Res Commun (2011) 404(4):928–34. doi:10.1016/j.bbrc.2010.12.083
111. Parhamifar L, Sime W, Yudina Y, Vilhardt F, Mörgelin M, Sjölander A. Ligand-induced tyrosine phosphorylation of cysteinyl leukotriene receptor 1 triggers internalization and signaling in intestinal epithelial cells. PLoS One (2010) 5(12):e14439. doi:10.1371/journal.pone.0014439
112. Kenakin T, Miller LJ. Seven transmembrane receptors as shapeshifting proteins: the impact of allosteric modulation and functional selectivity on new drug discovery. Pharmacol Rev (2010) 62(2):265–304. doi:10.1124/pr.108.000992
113. Kenakin TP. Biased signalling and allosteric machines: new vistas and challenges for drug discovery. Br J Pharmacol (2012) 165(6):1659–69. doi:10.1111/j.1476-5381.2011.01749.x
114. Williams C, Hill SJ. GPCR signaling: understanding the pathway to successful drug discovery. Methods Mol Biol (2009) 552:39–50. doi:10.1007/978-1-60327-317-6_3
115. Baker JG, Adams LA, Salchow K, Mistry SN, Middleton RJ, Hill SJ, et al. Synthesis and characterization of high-affinity 4,4-difluoro-4-bora-3a,4a-diaza-s-indacene-labeled fluorescent ligands for human beta-adrenoceptors. J Med Chem (2011) 54(19):6874–87. doi:10.1021/jm2008562
116. Baker JG, Hall IP, Hill SJ. Pharmacology and direct visualisation of BODIPY-TMR-CGP: a long-acting fluorescent beta2-adrenoceptor agonist. Br J Pharmacol (2003) 139(2):232–42. doi:10.1038/sj.bjp.0705287
117. Briddon SJ, Middleton RJ, Yates AS, George MW, Kellam B, Hill SJ. Application of fluorescence correlation spectroscopy to the measurement of agonist binding to a G-protein coupled receptor at the single cell level. Faraday Discuss (2004) 126:197–207. doi:10.1039/b307407b discussion 45-54,
118. Daly CJ, Parmryd I, McGrath JC. Visualization and analysis of vascular receptors using confocal laser scanning microscopy and fluorescent ligands. Methods Mol Biol (2012) 897:95–107. doi:10.1007/978-1-61779-909-9_5
119. Middleton RJ, Briddon SJ, Cordeaux Y, Yates AS, Dale CL, George MW, et al. New fluorescent adenosine A1-receptor agonists that allow quantification of ligand-receptor interactions in microdomains of single living cells. J Med Chem (2007) 50(4):782–93. doi:10.1021/jm061279i
120. Briddon SJ, Middleton RJ, Cordeaux Y, Flavin FM, Weinstein JA, George MW, et al. Quantitative analysis of the formation and diffusion of A1-adenosine receptor-antagonist complexes in single living cells. Proc Natl Acad Sci U S A (2004) 101(13):4673–8. doi:10.1073/pnas.0400420101
121. Corriden R, Self T, Akong-Moore K, Nizet V, Kellam B, Briddon SJ, et al. Adenosine-A3 receptors in neutrophil microdomains promote the formation of bacteria-tethering cytonemes. EMBO Rep (2013) 14(8):726–32. doi:10.1038/embor.2013.89
122. Vernall AJ, Stoddart LA, Briddon SJ, Hill SJ, Kellam B. Highly potent and selective fluorescent antagonists of the human adenosine A(3) receptor based on the 1,2,4-triazolo[4,3-a]quinoxalin-1-one scaffold. J Med Chem (2012) 55(4):1771–82. doi:10.1021/jm201722y
123. Stoddart LA, Vernall AJ, Denman JL, Briddon SJ, Kellam B, Hill SJ. Fragment screening at adenosine-A(3) receptors in living cells using a fluorescence-based binding assay. Chem Biol (2012) 19(9):1105–15. doi:10.1016/j.chembiol.2012.07.014
124. May LT, Briddon SJ, Hill SJ. Antagonist selective modulation of adenosine A1 and A3 receptor pharmacology by the food dye Brilliant Black BN: evidence for allosteric interactions. Mol Pharmacol (2010) 77(4):678–86. doi:10.1124/mol.109.063065
125. May LT, Self TJ, Briddon SJ, Hill SJ. The effect of allosteric modulators on the kinetics of agonist-G protein-coupled receptor interactions in single living cells. Mol Pharmacol (2010) 78(3):511–23. doi:10.1124/mol.110.064493
126. Hern JA, Baig AH, Mashanov GI, Birdsall B, Corrie JET, Lazareno S, et al. Formation and dissociation of M1 muscarinic receptor dimers seen by total internal reflection fluorescence imaging of single molecules. Proc Natl Acad Sci U S A (2010) 107(6):2693–8. doi:10.1073/pnas.0907915107
127. Kasai RS, Suzuki KGN, Prossnitz ER, Koyama-Honda I, Nakada C, Fujiwara TK, et al. Full characterization of GPCR monomer-dimer dynamic equilibrium by single molecule imaging. J Cell Biol (2011) 192(3):463–80. doi:10.1083/jcb.201009128
128. Azzi M, Charest PG, Angers S, Rousseau G, Kohout T, Bouvier M, et al. Beta-arrestin-mediated activation of MAPK by inverse agonists reveals distinct active conformations for G protein-coupled receptors. Proc Natl Acad Sci U S A (2003) 100(20):11406–11. doi:10.1073/pnas.1936664100
129. Baker JG, Hall IP, Hill SJ. Agonist and inverse agonist actions of beta-blockers at the human beta 2-adrenoceptor provide evidence for agonist-directed signaling. Mol Pharmacol (2003) 64(6):1357–69. doi:10.1124/mol.64.6.1357
130. Whalen EJ, Rajagopal S, Lefkowitz RJ. Therapeutic potential of beta-arrestin- and G protein-biased agonists. Trends Mol Med (2011) 17(3):126–39. doi:10.1016/j.molmed.2010.11.004
131. Hill SJ, May LT, Kellam B, Woolard J. Allosteric interactions at adenosine A1 and A3 receptors: new insights into the role of small molecules and receptor dimerization. Br J Pharmacol (2014) 171(5):1102–13. doi:10.1111/bph.12345
132. Keov P, Sexton PM, Christopoulos A. Allosteric modulation of G protein-coupled receptors: a pharmacological perspective. Neuropharmacology (2011) 60(1):24–35. doi:10.1016/j.neuropharm.2010.07.010
133. May LT, Leach K, Sexton PM, Christopoulos A. Allosteric modulation of G protein-coupled receptors. Annu Rev Pharmacol Toxicol (2007) 47:1–51. doi:10.1146/annurev.pharmtox.47.120505.105159
134. Cordeaux Y, Briddon SJ, Alexander SP, Kellam B, Hill SJ. Agonist-occupied A3 adenosine receptors exist within heterogeneous complexes in membrane microdomains of individual living cells. FASEB J (2008) 22(3):850–60. doi:10.1096/fj.07-8180com
135. Gines S, Ciruela F, Burgueno J, Casado V, Canela EI, Mallol J, et al. Involvement of caveolin in ligand-induced recruitment and internalization of A1 adenosine receptor and adenosine deaminase in an epithelial cell line. Mol Pharmacol (2001) 59(5):1314–23. doi:10.1124/mol.59.5.1314
136. Insel PA, Head BP, Ostrom RS, Patel HH, Swaney JS, Tang CM, et al. Caveolae and lipid rafts: G protein-coupled receptor signaling microdomains in cardiac myocytes. Ann N Y Acad Sci (2005) 1047:166–72. doi:10.1196/annals.1341.015
137. Ostrom RS, Insel PA. The evolving role of lipid rafts and caveolae in G protein-coupled receptor signaling: implications for molecular pharmacology. Br J Pharmacol (2004) 143(2):235–45. doi:10.1038/sj.bjp.0705930
138. Feinstein TN, Wehbi VL, Ardura JA, Wheeler DS, Ferrandon S, Gardella TJ, et al. Retromer terminates the generation of cAMP by internalized PTH receptors. Nat Chem Biol (2011) 7(5):278–84. doi:10.1038/nchembio.545
139. Irannejad R, Tomshine JC, Tomshine JR, Chevalier M, Mahoney JP, Steyaert J, et al. Conformational biosensors reveal GPCR signalling from endosomes. Nature (2013) 495(7442):534–8. doi:10.1038/nature12000
140. Mullershausen F, Zecri F, Cetin C, Billich A, Guerini D, Seuwen K. Persistent signaling induced by FTY720-phosphate is mediated by internalized S1P1 receptors. Nat Chem Biol (2009) 5(6):428–34. doi:10.1038/nchembio.173
141. Werthmann RC, Volpe S, Lohse MJ, Calebiro D. Persistent cAMP signaling by internalized TSH receptors occurs in thyroid but not in HEK293 cells. FASEB J (2012) 26(5):2043–8. doi:10.1096/fj.11-195248
142. Briddon SJ, Hill SJ. Pharmacology under the microscope: the use of fluorescence correlation spectroscopy to determine the properties of ligand-receptor complexes. Trends Pharmacol Sci (2007) 28(12):637–45. doi:10.1016/j.tips.2007.09.008
143. Ayling LJ, Briddon SJ, Halls ML, Hammond GR, Vaca L, Pacheco J, et al. Adenylyl cyclase AC8 directly controls its micro-environment by recruiting the actin cytoskeleton in a cholesterol-rich milieu. J Cell Sci (2012) 125(Pt 4):869–86. doi:10.1242/jcs.091090
144. Briddon SJ, Gandia J, Amaral OB, Ferre S, Lluis C, Franco R, et al. Plasma membrane diffusion of G protein-coupled receptor oligomers. Biochim Biophys Acta (2008) 1783(12):2262–8. doi:10.1016/j.bbamcr.2008.07.006
145. Herrick-Davis K, Grinde E, Cowan A, Mazurkiewicz JE. Fluorescence correlation spectroscopy analysis of serotonin, adrenergic, muscarinic, and dopamine receptor dimerization: the oligomer number puzzle. Mol Pharmacol (2013) 84(4):630–42. doi:10.1124/mol.113.087072
146. Kilpatrick LE, Briddon SJ, Holliday ND. Fluorescence correlation spectroscopy, combined with bimolecular fluorescence complementation, reveals the effects of beta-arrestin complexes and endocytic targeting on the membrane mobility of neuropeptide Y receptors. Biochim Biophys Acta (2012) 1823(6):1068–81. doi:10.1016/j.bbamcr.2012.03.002
147. Whorton MR, Bokoch MP, Rasmussen SG, Huang B, Zare RN, Kobilka B, et al. A monomeric G protein-coupled receptor isolated in a high-density lipoprotein particle efficiently activates its G protein. Proc Natl Acad Sci U S A (2007) 104(18):7682–7. doi:10.1073/pnas.0611448104
148. Gao T, Petrlova J, He W, Huser T, Kudlick W, Voss J, et al. Characterization of de novo synthesized GPCRs supported in nanolipoprotein discs. PLoS One (2012) 7(9):e44911. doi:10.1371/journal.pone.0044911
Keywords: bioluminescence resonance energy transfer, BRET, fluorescence resonance energy transfer, FRET, GPCR, GPCR-HIT, heteromer, Receptor-HIT
Citation: Jaeger WC, Armstrong SP, Hill SJ and Pfleger KDG (2014) Biophysical detection of diversity and bias in GPCR function. Front. Endocrinol. 5:26. doi: 10.3389/fendo.2014.00026
Received: 06 January 2014; Paper pending published: 05 February 2014;
Accepted: 19 February 2014; Published online: 05 March 2014.
Edited by:
Stuart Maudsley, National Institutes of Health, USAReviewed by:
Emma June Petrie, The University of Melbourne, AustraliaJoris Hubertus Robben, Radboud University Nijmegen Medical Centre, Netherlands
Copyright: © 2014 Jaeger, Armstrong, Hill and Pfleger. This is an open-access article distributed under the terms of the Creative Commons Attribution License (CC BY). The use, distribution or reproduction in other forums is permitted, provided the original author(s) or licensor are credited and that the original publication in this journal is cited, in accordance with accepted academic practice. No use, distribution or reproduction is permitted which does not comply with these terms.
*Correspondence: Kevin D. G. Pfleger, Molecular Endocrinology and Pharmacology, Harry Perkins Institute of Medical Research and Centre for Medical Research, The University of Western Australia, QEII Medical Centre, QQ Block, 6 Verdun Street, Nedlands, Perth, WA 6009, Australia e-mail:a2V2aW4ucGZsZWdlckBwZXJraW5zLnV3YS5lZHUuYXU=
†Werner C. Jaeger and Stephen P. Armstrong have contributed equally to this work.