 Min Sun1,2†
 Mengyu Du2†Wenhua Zhang3Sisi Xiong4
 Xingrui Gong2Peijie Lei5Jin Zha2Hongrui Zhu2Heng Li1Dong Huang1*Xinsheng Gu6*
- 1Department of General Surgery, Taihe Hospital, Hubei University of Medicine, Shiyan, China
- 2Department of Anesthesiology, Institute of Anesthesiology, Taihe Hospital, Hubei University of Medicine, Shiyan, China
- 3Department of Pharmaceutical Sciences, College of Pharmacy, Hubei University of Medicine, Shiyan, China
- 4School of Nursing, Hubei University of Medicine, Shiyan, China
- 5The First Clinical School, Hubei University of Medicine, Shiyan, China
- 6Department of Pharmacology, College of Basic Medical Sciences, Hubei University of Medicine, Shiyan, China
Background: Silent information regulator 2 homolog 1 (SIRT1) is an evolutionarily conserved enzymes with nicotinamide adenine dinucleotide (NAD)+-dependent deacetylase activity. SIRT1 is involved in a large variety of cellular processes, such as genomic stability, energy metabolism, senescence, gene transcription, and oxidative stress. SIRT1 has long been recognized as both a tumor promoter and tumor suppressor. Its prognostic role in cancers remains controversial.
Methods: A meta-analysis of 13,138 subjects in 63 articles from PubMed, EMBASE, and Cochrane Library was performed to evaluate survival and clinicopathological significance of SIRT1 expression in various cancers.
Results: The pooled results of meta-analysis showed that elevated expression of SIRT1 implies a poor overall survival (OS) of cancer patients [Hazard Ratio (HR) = 1.566, 95% CI: 1.293–1.895, P < 0.0001], disease free survival (DFS) (HR = 1.631, 95% CI: 1.250–2.130, P = 0.0003), event free survival (EFS) (HR = 2.534, 95% CI: 1.602–4.009, P = 0.0001), and progress-free survival (PFS) (HR = 3.325 95% CI: 2.762–4.003, P < 0.0001). Elevated SIRT1 level was associated with tumor stage [Relative Risk (RR) = 1.299, 95% CI: 1.114–1.514, P = 0.0008], lymph node metastasis (RR = 1.172, 95% CI: 1.010–1.360, P = 0.0363), and distant metastasis (RR = 1.562, 95% CI: 1.022–2.387, P = 0.0392). Meta-regression and subgroup analysis revealed that ethnic background has influence on the role of SIRT1 expression in predicting survival and clinicopathological characteristics of cancers. Overexpression of SIRT1 predicted a worse OS and higher TNM stage and lymphatic metastasis in Asian population especially in China.
Conclusion: Our data suggested that elevated expression of SIRT1 predicted a poor OS, DFS, EFS, PFS, but not for recurrence-free survival (RFS) and cancer-specific survival (CCS). SIRT1 overexpression was associated with higher tumor stage, lymph node metastasis, and distant metastasis. SIRT1-mediated molecular events and biological processes could be an underlying mechanism for metastasis and SIRT1 is a therapeutic target for inhibiting metastasis, leading to good prognosis.
Introduction
Silent information regulator 2 homolog 1 (SIRT1) is an evolutionarily conserved enzymes with nicotinamide adenine dinucleotide (NAD)+-dependent deacetylase activity and a member of the mammalian sirtuin family. It is expressed in almost all human tissues and localized in both nuclei and cytoplasm (1). Its substrates include histones and non-histone proteins such as transcription factors (2–4). SIRT1 is involved in a large variety of cellular processes, such as genomic stability, energy metabolism, senescence, gene transcription, and oxidative stress (5). It has been shown to be involved in a spectrum of diseases, including cancer, diabetes, obesity, and neurodegenerative diseases (6–8). SIRT1 plays an important role in regulating glucose and lipid metabolism and regulates malignancy in tumors (9).
SIRT1 has long been recognized as both a tumor promoter and tumor suppressor (10–12). This is also shown in recent studies. SIRT1 promotes proliferation, migration, and invasion of breast cancer cell line MCF-7 (13). SIRT1 promotes proliferation and paclitaxel-resistance of human cervical cancer cells (14). Yang et al. found that SIRT1 levels are lower in non-small cell lung cancer (NSCLC) than the normal control group (15), but Gharabaghi et al. found that SIRT1 are over expressed in NSCLC (16). The role of SIRT1 in prognosis of cancer was also investigated in several studies. Over expression of SIRT1 suggests poor prognosis in luminal breast cancer (17) and serous epithelial ovarian cancer (EOC) (18), gastric cancer (19), high pathological stage and worse overall survival in the lung adenocarcinoma patients (20), decreased survival and increased relapse in breast cancer patients (3, 21), colorectal carcinoma patients (22), lymphangiogenesis, lymphovascular invasion, and prognosis in pN0 esophageal squamous cell carcinoma (23), soft tissue sarcomas (24), both operable triple-negative and non-triple-negative breast cancer (25), hepatocellular carcinoma (26), gastric carcinoma (27), diffuse large B-cell lymphoma (28). On the other hand, SIRT1 expression is found to be associated with good prognosis for head and neck squamous cell carcinoma patients (29), and colorectal cancer (30). Therefore, the prognostic and clinicopathological significance of SIRT1 abnormal expression in cancers remain to be elucidated.
Prognostic value and clinicopathological association of SIRT1 with cancers have been analyzed in previous meta-analysis (31–36). However, the studies included in these meta-analysis were limited to mostly Asian population, single or several cancer types, or they were published several years ago (31–36). In the present study, we conducted an updated and more comprehensive meta-analysis and subgroup analysis to reveal the prognostic value and clinicopathological association of SIRT1 abnormal expression in cancers.
Methods
Search Strategy
We retrieved literature published in between 1966 and April 1st, 2018 by searching PubMed, EMBASE, and Cochrane Library with the keywords (1) “SIRT1” OR “sirtuin 1” OR “SIR2” OR “SIR2L1” OR “SIR2alpha” OR “silent mating type information regulation 2 homolog-1” AND (2) “tumor OR cancer OR carcinoma OR neoplasm” and using the search strategies as illustrated in Supplementary Tables 1A–C. We selected and evaluated all relevant studies and review articles about SIRT1 and inquired the authors for unpublished raw data. The search and selection of articles for the study were separately conducted based on a common set of criteria. The divergence in opinion were settled through discussion among ourselves.
Inclusion and Exclusion Criteria
This meta-analysis was conducted according to Meta-analysis of Observational Studies in Epidemiology (MOOSE) Checklist. Studies enrolled in this analysis satisfied the following requirements: (i) patients must be diagnosed with cancer via pathology; (ii) The expression of SIRT1 must be determined by quantitative real-time polymerase chain reaction (q-PCR), immunohistochemistry (IHC), or in situ hybridization (ISH); (iii) The correlation between SIRT1 expression and prognosis or clinicopathological features was investigated; (iv) The Hazard Ratio (HR) and its 95% confidence interval (CI) for survival indicator on the basis of SIRT1 expression level were readily available or could be calculated indirectly; (v) The most representative and most accurate study was adopted when a single sample source was used in multiple studies to avoid unnecessary cohort overlapping. Studies that have satisfied the abovementioned inclusion requirements were further ruled out if they had any of the following flaws: (i) duplicated articles or data; (ii) not human studies; (iii) review articles or letters; (iv) lack of sufficient data or information to get HR; (v) articles not written in English.
Quality Assessment of Included Studies
We used the Newcastle-Ottawa Scale (NOS) to assess the quality of each included study. Scores ≥ 7 were considered high quality. We used a “star system” for case-control studies (Supplementary Table 2).
Data Extraction
We extracted the following data from the full texts of eligible studies: (i) the first author; (ii) publication year; (iii) characteristics of the studies, which comprised of the patients' nationality, sample size, tumor type, and clinicopathological characteristics; (iv) the assay method and cut-off value of SIRT1; (v) HRs of SIRT1 expression for OS, disease-free survival (DFS), event-free survival (EFS), recurrence-free survival (RFS), cancer-specific survival (CCS), progression-free survival (PFS); (vi) if the HR for OS, DFS, EFS, RFS, CCS and PFS were calculated by both univariate and multivariate analyses, the latter was our first choice, given that these results were adjusted for confounding factors. If a study did not report the HR, we estimated HR and their corresponding 95% CI using the method described by Parmar et al. (37) and Tierney et al. (38). We recovered the data of Kaplan-Meier curves via the Engauge Digitizer version 9.8 (http://markummitchell.github.io/engauge-digitizer) and calculated the HR and its 95% CI. We repeated this process three times to reduce variability. Any divergence regarding the extraction and interpretation of all data was resolved by discussion among ourselves until consensus was reached.
Statistical Analysis
All the HRs and their 95% CIs were combined to evaluate the effect of SIRT1 high expression on prognosis. If the pooled HR < 1 and their 95% CI did not overlap the invalid line in the forest plot, the high expression of SIRT1 predicted a good OS. If the 95% CI overlapped the invalid line, the combined HR was considered insignificant. Otherwise, the combined HR predicted a poor OS. The heterogeneity of the pooled results was examined via Cochrane's Q test and Higgins' I-squared, and P < 0.1 or I2 ≥ 25% was considered high heterogeneity. If P > 0.1 and I2 < 25%, we ignored the influence of heterogeneity and pooled the overall result using a fixed effects model, otherwise employing the random effects model. The potential publication bias was assessed by a funnel plot, and Egger's test (39). P < 0.05 was considered significant. Statistical analysis was carried out using the “metafor” and “meta” packages of the R/BioConductor (version 3.5.1).
Results
Search Results
We found 2,397 articles in PubMed, 2,460 articles in EMBASE, 20 articles in Cochrane library, and one articles through the references. We had a total of 3,733 articles after removing 1,145 duplicated articles. We then ruled out 2,953 articles which were review, letters, laboratory studies, or articles irrelevant to present research. We further excluded 717 full-text articles according to the inclusion and exclusion criteria of this study. The remaining 63 articles were finally eligible and included in this meta-analysis (Figure 1).
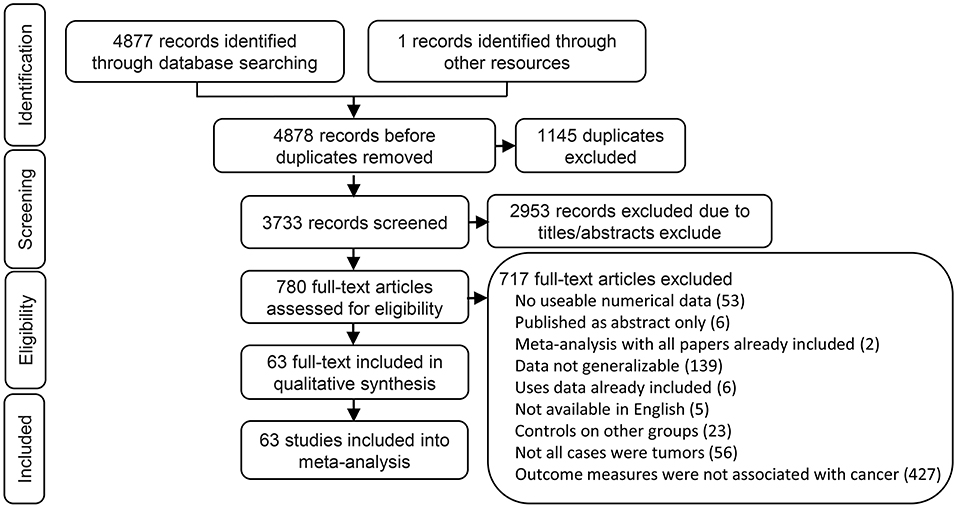
Figure 1. Flow chart of the identification process for eligible studies.
Study Demographics
The 63 eligible articles were published in between 2008 and 2017 with 63 studies that included a total of 13,138 participants from 9 countries who represented 16 cancer types and Asian and Caucasian ethnic groups (Table 1). The mean and median value were selected as the cut-off value in most articles. All studies measured SIRT1 expression in tumor tissue or serum via q-PCR, IHC, or ISH.
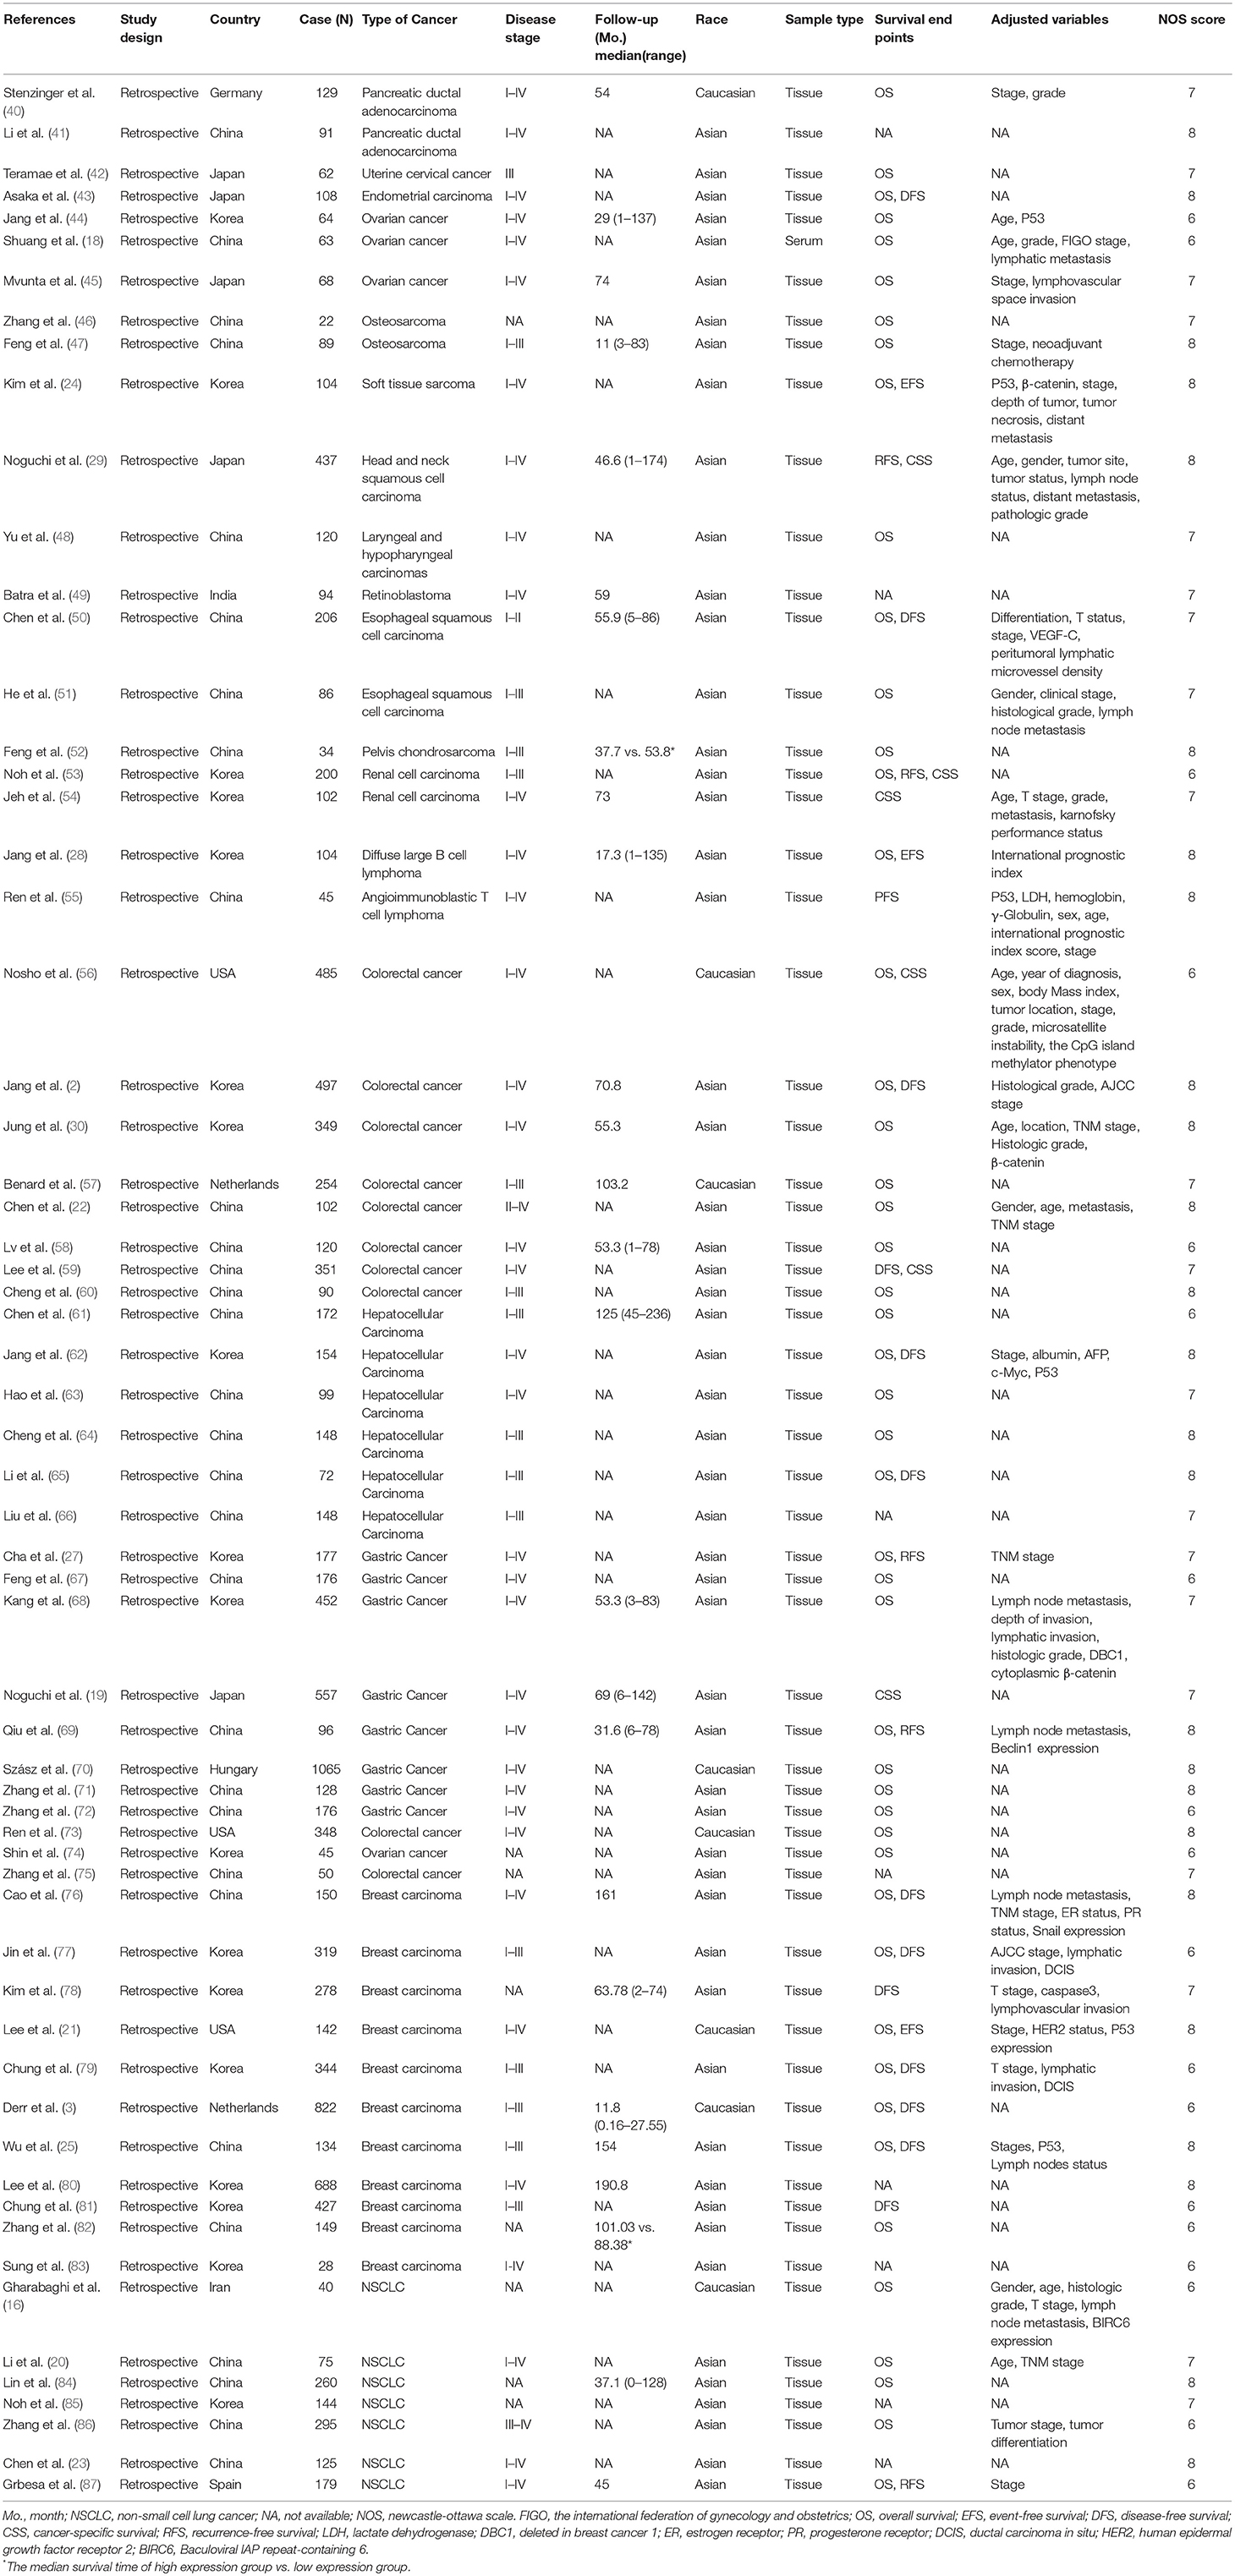
Table 1. Main characteristics of 63 included studies.
Correlation Between SIRT1 Expression and Prognosis
We performed meta-analysis of correlation between SIRT1 expression and OS, DFS, EFS, RFS, CCS, and PFS. The results and analysis of publication bias are presented in Table 2. The results showed that higher SIRT1 expression indicated an unfavorable OS (n = 48, HR: 1.566, 95% CI: [1.293, 1.895], P < 0.0001, I2 = 81.3%) (Figure 2), poor patient DFS (n = 14, HR: 1.631, 95% CI: [1.250–2.130], P = 0.0003, I2 = 72.6%, Figure 3A), poor EFS (n = 3, HR: 2.534, 95% CI: [1.602, 4.009], P = 0.0001, I2 = 0%, Figure 3B), and poor PFS (n = 2, HR: 3.325, 95% CI: [2.762, 4.003], P < 0.0001, I2 = 0%, Figure 3C), but not correlated with RFS of the Asian or tissue (n = 5, HR: 1.936, 95% CI: [0.903 - 4.151], P = 0.0898, I2 = 88.9%) (Figure 3D) or CCS (n = 6, HR: 1.229, 95% CI: [0.757–1.994], P = 0.4037, I2 = 77.3%) (Figure 3E).
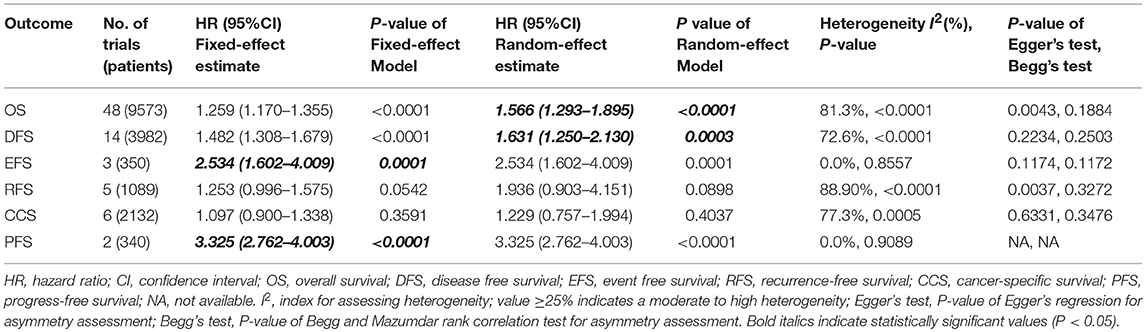
Table 2. Survival effects of SIRT1 overexpression and the prognosis of patients.
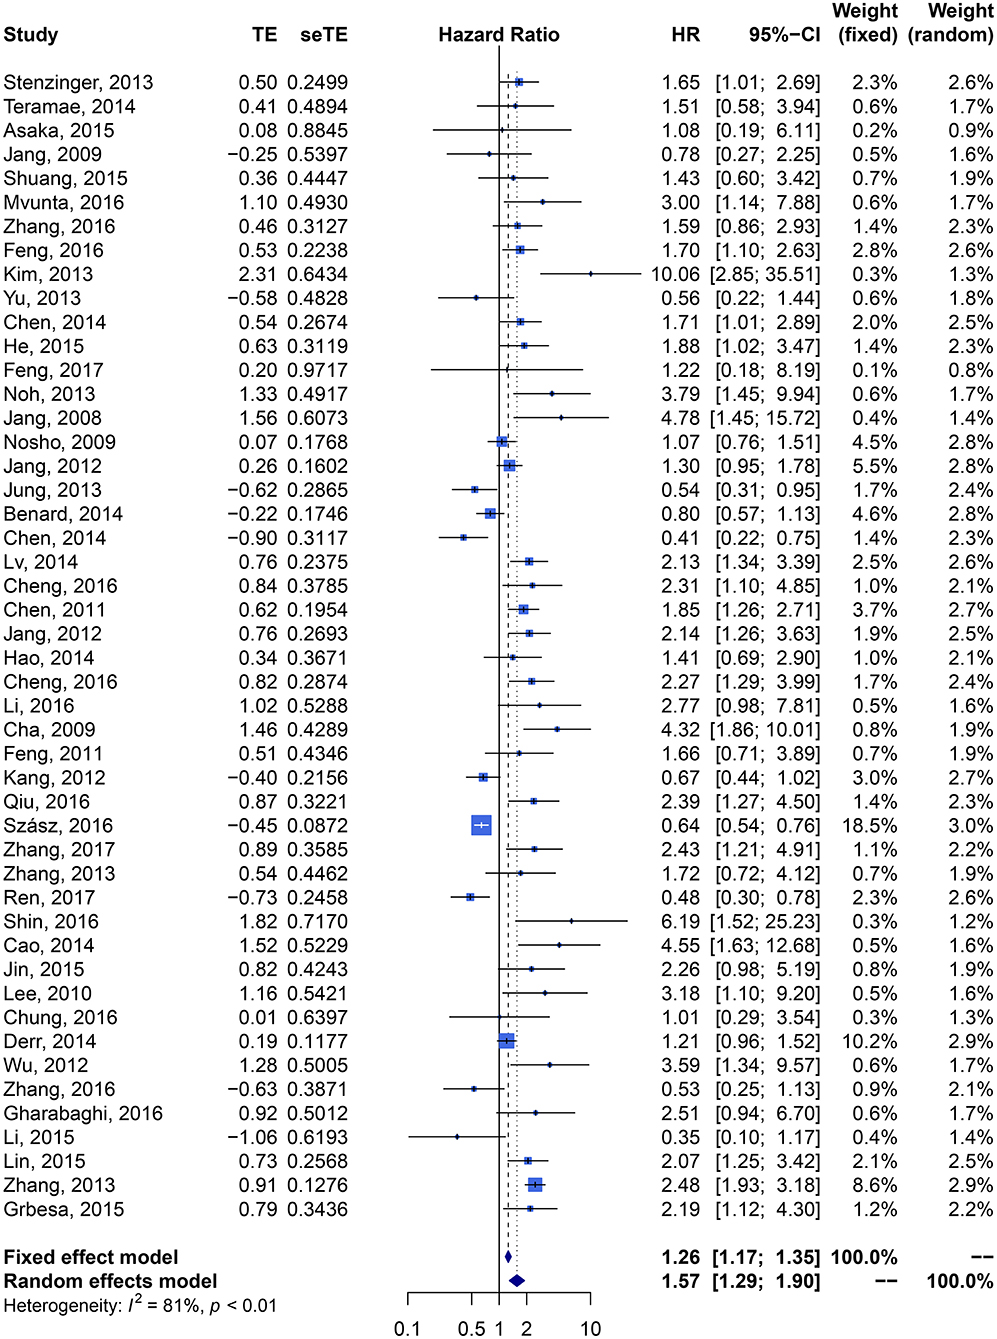
Figure 2. Forest plot of SIRT1 expression and overall survival in various cancers.
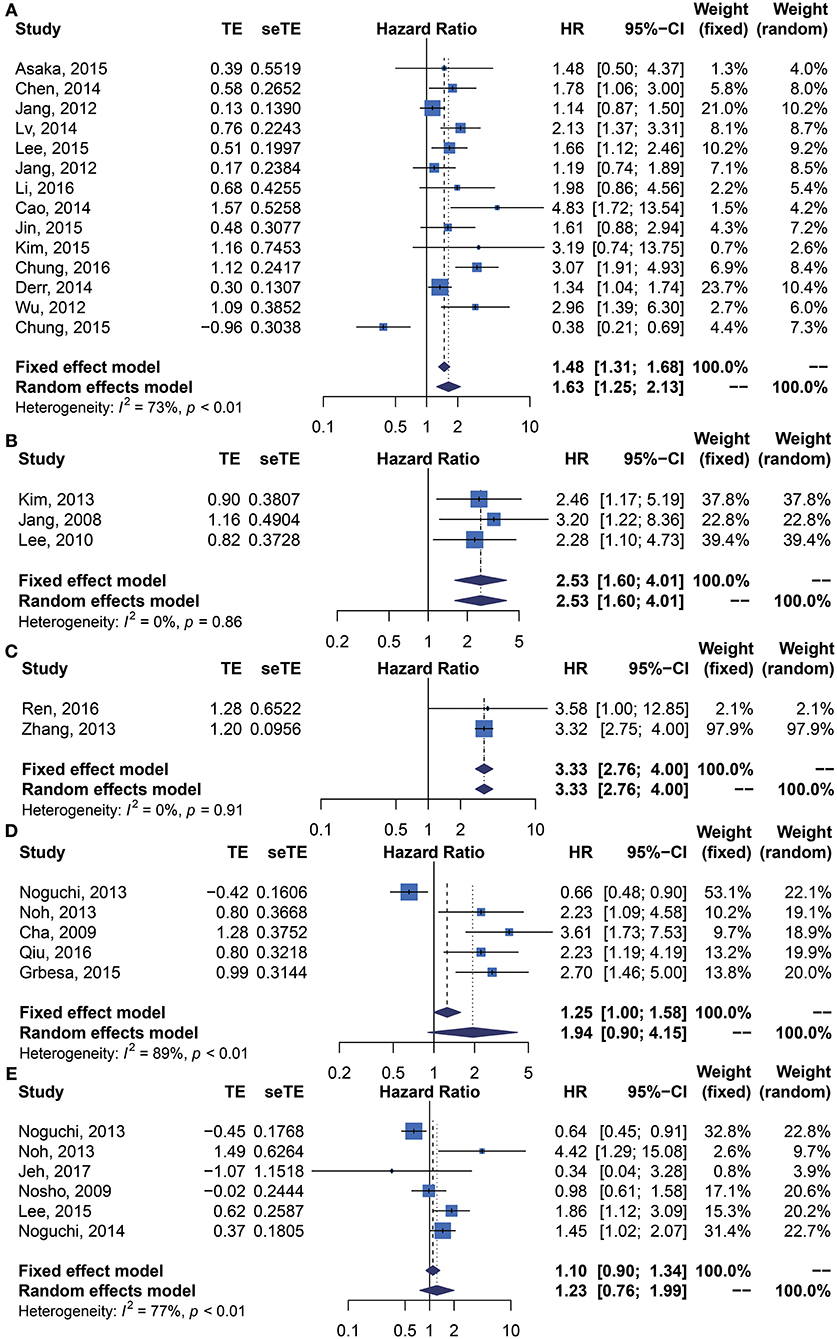
Figure 3. Forest plots of main survival outcomes compared SIRT1 overexpression with underexpression. (A) DFS. (B) EFS. (C) PFS. (D) RFS. (E) CCS.
Correlation Between SIRT1 Expression and Prognosis of Cancer Types
Cancer type subgroup analysis showed that SIRT1 overexpression was associated with a worse OS in osteosarcoma (n = 2, HR: 1.661, 95% CI: [1.162, 2.372], P = 0.0053, I2 = 0%), esophageal squamous cell carcinoma (n = 2, HR: 1.781, 95% CI: [1.197, 2.652], P = 0.0044, I2 = 0%), hepatocellular carcinoma (n = 5, HR: 1.969, 95% CI: [1.539, 2.520], P < 0.0001, I2 = 0%), breast carcinoma (n = 7, HR: 1.744, 95% CI: [1.022, 2.978], P < 0.0416, I2 = 70.18%), NSCLC (n = 5, HR: 1.929, 95% CI: [1.259, 2.957], P < 0.0025, I2 = 59.40%), whereas SIRT1 overexpression was not correlated with the OS in ovarian cancer (n = 4, HR: 1.971, 95% CI: [0.899, 4.323], P = 0.0903, I2 = 55.18%), colorectal carcinoma (n = 8, HR: 0.932, 95% CI: [0.636, 1.366], P = 0.7198, I2 = 82.96%), gastric carcinoma (n = 7, HR: 1.535, 95% CI: [0.864, 2.726], P = 0.1436, I2 = 87.90%) (Supplementary Figure 1A).
SIRT1 overexpression was associated with a worse DFS in colorectal cancer (n = 3, HR: 1.544, 95% CI: [1.061, 2.247], P = 0.0233, I2 = 68.69%), and breast carcinoma (n = 7, HR: 1.819, 95% CI: [1.026, 3.223], P = 0.0404, I2 = 84.59%), whereas it was not correlated with the DFS in hepatocellular carcinoma (n = 2, HR: 1.357, 95% CI: [0.872, 2.113], P = 0.1758, I2 = 9.41%) (Supplementary Figure 2A).
SIRT1 overexpression was correlated with RFS of Gastric Cancer (n = 2, HR: 2.734, 95% CI: [1.694, 4.413], P < 0.0001, I2 = 0%), Renal cell carcinoma (n = 1, HR: 2.233, 95% CI: [1.088, 4.583]), and NSCLC (HR: 2.698, 95% CI: [1.457, 4.996]), whereas SIRT1 overexpression was negatively correlated with RFS of head and neck squamous cell carcinoma (HR: 0.655, 95% CI: [0.478, 0.897], P = 0.0084) (Supplementary Table 3).
SIRT1 overexpression was correlated with CCS in head and neck squamous cell carcinoma (n = 1, HR: 0.640, 95% CI: [0.453, 0.905], P = 0.0116), gastric cancer (n = 1, HR: 1.450, 95% CI: [1.018, 2.066], P = 0.0396), and renal cell carcinoma (n = 2, HR: 1.478, 95% CI: [0.124, 17.621]), but not with CCS in colorectal cancer (HR: 1.344, 95% CI: [0.716, 2.521], P = 0.3577) (Supplementary Table 3).
Correlation Between SIRT1 Expression and Prognosis of Cancer in Different Countries
Analysis of country subgroups showed that high expression of SIRT1 was correlated with poor OS in China (n = 24, HR: 1.661, 95% CI: [1.339, 2.060], P < 0.0001, I2 = 63.03%), Korea (n = 12, HR: 1.902, 95% CI: [1.187, 3.047], P = 0.0075, I2 = 80.65%), Japan (n = 3, HR: 1.940, 95% CI: [1.029, 3.655], P = 0.0405, I2 = 0%), but not in USA (n = 3, HR: 1.043, 95% CI: [0.465, 2.338], P = 0.9193, I2 = 84.36%), or Netherlands (n = 2, HR: 1.003, 95% CI: [0.671, 1.498], P = 0.9893, I2 = 73.79%) (Supplementary Figure 1B).
SIRT1 overexpression was also correlated with poor DFS in China (n = 6, HR: 2.021, 95% CI: [1.612, 2.534], P < 0.0001, I2 = 0%), but not in Korea (n = 6, HR: 1.321, 95% CI: [0.773, 2.259]) (Supplementary Figure 2B).
SIRT1 overexpression was correlated with poor EFS in Korea (n = 2, HR: 2.714, 95% CI: [1.506, 4.894], P = 0.0009, I2 = 0%) and USA (n = 1, HR: 2.280, 95% CI: [1.098, 4.734]).
Correlation Between SIRT1 Expression and Prognosis of Cancer in Asian and Caucasian
Elevated SIRT1 expression predicted a significantly worse OS in Asian population with cancers (HR: 1.708, 95% CI: [1.406, 2.076], P < 0.0001, I2 = 69.59%) rather than in Caucasian population (HR: 1.04, 95% CI: [0.75, 1.45], P < 0.01, I2 = 81%) (Supplementary Figure 1C).
SIRT1 expression predicted a significantly worse DFS in Asian population with cancers (n = 13, HR: 1.683, 95% CI: [1.235, 2.294], P < 0.0010, I2 = 74.27%), whereas one article suggested that increased expression of SIRT1 is correlated with Caucasian patient DFS (HR: 1.344, 95% CI: [1.040; 1.736], P = 0.0237) (Supplementary Figure 2C).
Correlation Between SIRT1 Expression and Clinicopathological Characteristics
We performed an analysis of the association of SIRT1 expression with clinicopathological characteristics (Table 3). The results showed that overexpression of SIRT1 was significantly correlated with TNM stage. Higher SIRT1 expression indicated high TNM stage for various malignancies (n = 33, RR: 1.299; 95% CI: [1.114, 1.514], P = 0.0008, I2 = 77.4%, Figure 4). SIRT1 expression was significantly correlated with lymphatic metastasis (n = 29, RR: 1.172, 95% CI: [1.010, 1.360], P = 0.0363, I2 = 86.3%, Figure 5), distant metastasis (n = 14, RR: 1.562, 95% CI: [1.022, 2.387], P = 0.0392, I2 = 71.0%, Figure 6), but not correlated with tumor size (RR:1.101, 95% CI [0.984-1.232], I2 = 41.7%), depth of tumor invasion (RR: 1.113, 95% CI [0.985–1.258], I2 = 81.7%), differentiation (RR: 1.055, 95% CI [0.931–1.196], I2 = 63.1%), gender (RR: 0.991, 95% CI [0.950–1.035], I2 = 35.0%), or age (RR: 1.043, 95% CI [0.973–1.118], I2 = 43.5%) (Table 3, Supplementary Figure 3).
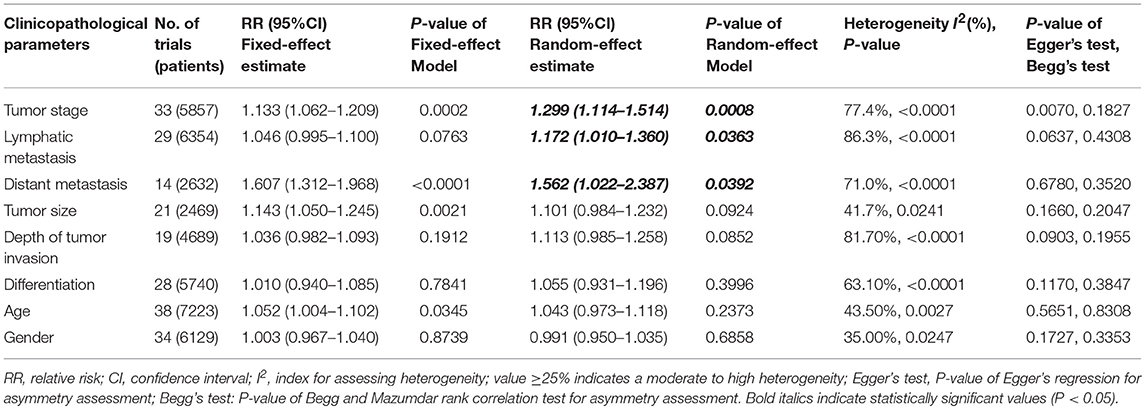
Table 3. The associations of SIRT1 overexpression with the clinicopathological characteristics of the study patients.
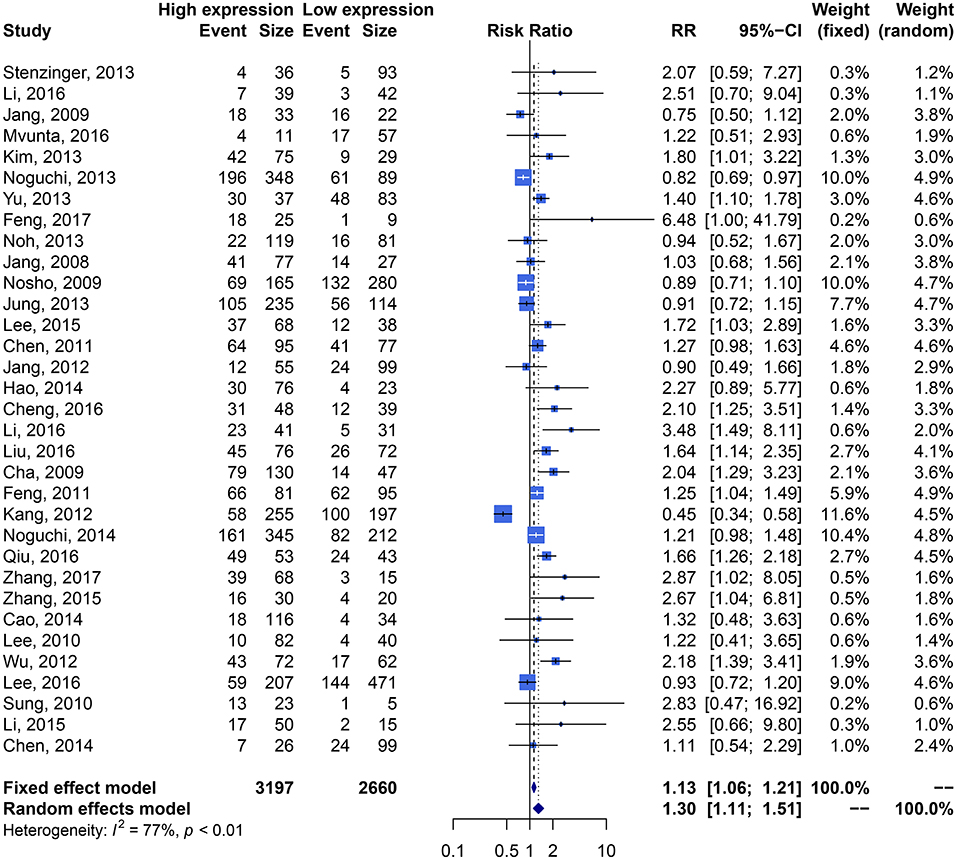
Figure 4. Forest plots of tumor stage compared SIRT1 overexpression with underexpression.
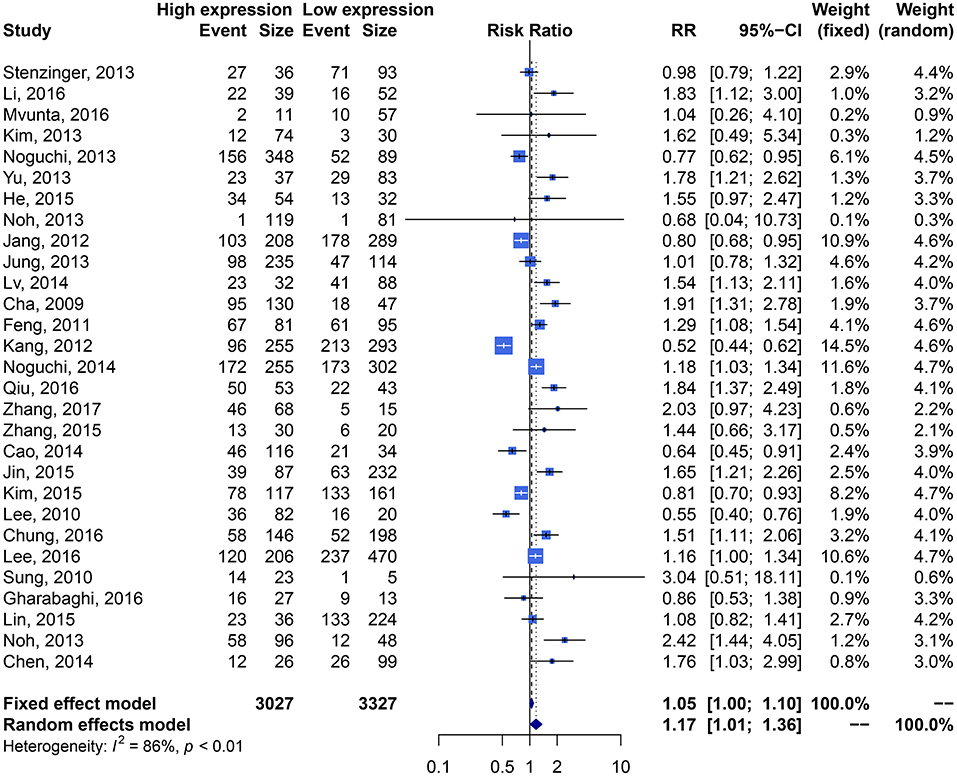
Figure 5. Forest plots of lymphatic metastasis compared SIRT1 overexpression with underexpression.
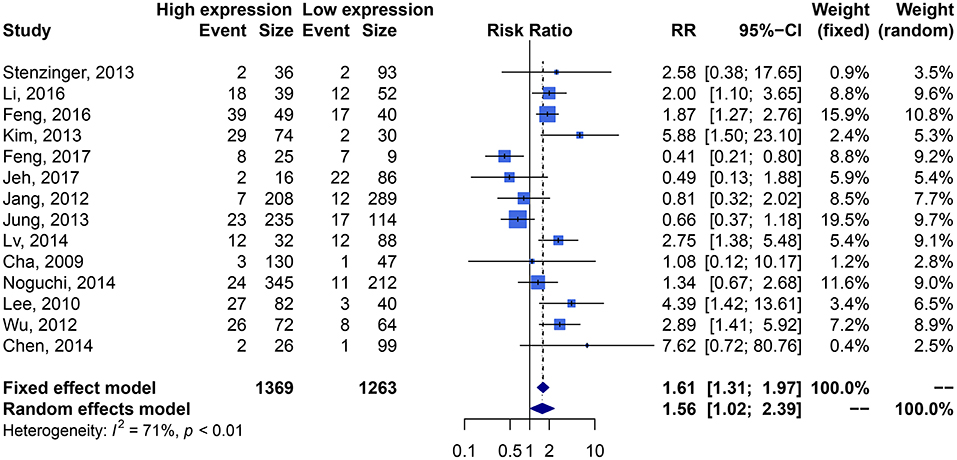
Figure 6. Forest plots of distant metastasis compared SIRT1 overexpression with underexpression.
Correlation Between SIRT1 Expression and Clinicopathological Characteristics of Cancers Types
We performed analysis of correlation between SIRT1 expression and clinicopathological characteristics of cancers types (Supplementary Table 4). The results showed that SIRT1 overexpression was associated with a higher TNM stage in hepatocellular carcinoma (n = 6, RR: 1.611, 95% CI: [1.185, 2.188], P = 0.0023, I2 = 55.30%), but not correlated with the TNM stage in pancreatic ductal adenocarcinoma (n = 2, RR: 2.275, 95% CI: [0.928, 5.579], P = 0.0725, I2 = 0%), ovarian cancer (n = 2, RR: 0.820, 95% CI: [0.561, 1.201], P = 0.3082, I2 = 3.18%), colorectal cancer (n = 4, RR: 1.146, 95% CI: [0.817, 1.608], P = 0.4290, I2 = 70.90%), gastric cancer (n = 6, RR: 1.264, 95% CI: [0.823, 1.942], P = 0.2842, I2 = 92.48%), breast carcinoma (n = 5, RR: 1.411, 95% CI: [0.846, 2.356], P = 0.1873, I2 = 65.10%), or NSCLC (n = 2, RR: 1.389, 95% CI: [0.661, 2.917], P = 0.3853, I2 = 16.51%) (Supplementary Figure 4A).
SIRT1 overexpression was associated with distant metastasis in pancreatic ductal adenocarcinoma (n = 2, RR: 2.046, 95% CI: [1.153, 3.631], P = 0.0144, I2 = 0%) and breast carcinoma (n = 2, RR: 3.257, 95% CI: [1.777, 5.970], P = 0.0001, I2 = 0%), but not in colorectal cancer (n = 3, RR: 1.140, 95% CI: [0.444, 2.923], P = 0.7857, I2 = 80.57%) or gastric cancer (n = 2, RR: 1.316, 95% CI: [0.679, 2.551], P = 0.4160, I2 = 0%) (Supplementary Figure 5A).
Correlation Between SIRT1 Expression and Clinicopathological Characteristics of Cancers in Different Countries
We performed analysis of correlation between SIRT1 expression and clinicopathological characteristics of cancers in different countries (Supplementary Table 4). The results showed that SIRT1 overexpression was associated with a higher TNM stage (n = 17, RR: 1.638, 95% CI: [1.404, 1.911], P < 0.0001, I2 = 41.16%) (Supplementary Figure 4B) and lymphatic metastasis in China (n = 11, RR: 1.411, 95% CI: [1.155, 1.724], P = 0.0007, I2 = 68.48%), and not with lymphatic metastasis in Japan (n = 3, RR: 0.964, 95% CI: [0.657, 1.415]), or Korea (n = 12, RR: 1.166, 95% CI: [0.898, 1.516]) (Supplementary Figure 6A).
Correlation Between SIRT1 Expression and Clinicopathological Characteristics of Cancers in Asian and Caucasian
We performed analysis of correlation between SIRT1 expression and clinicopathological characteristics of cancers in Asian and Caucasian (Supplementary Table 4). The results showed that SIRT1 overexpression predicted a significantly higher TNM stage in Asian population with cancers (n = 30, RR: 1.323, 95% CI: [1.124, 1.559], P = 0.0008, I2 = 78.76%) rather than that in Caucasian population (n = 3, RR: 0.919, 95% CI: [0.744, 1.136], P = 0.4352, I2 = 0%) (Supplementary Figure 4C). However, publication bias was suspected based on the Egger's test (P = 0.0070) rather than Begg's test (P = 0.1827).
Elevated SIRT1 expression predicted a significantly distant metastasis in Caucasian population with cancers (n = 2, RR: 3.830, 95% CI: [1.445, 10.154], P = 0.0069, I2 = 0%), but not in Asian population (n = 12, RR: 1.422, 95% CI: [0.913, 2.217], P = 0.1198, I2 = 72.85%) (Supplementary Figure 5B).
Elevated SIRT1 expression predicted a significantly higher lymphatic metastasis in Asian population with cancers (n = 29, RR: 1.239, 95% CI: [1.056, 1.453], P = 0.0086, I2 = 86.81%), but not correlated with lymphatic metastasis in Caucasian population (n = 3, RR: 0.777, 95% CI: [0.526, 1.147], P = 0.2040, I2 = 76.11%) (Supplementary Figure 6B).
Meta-Regression Analysis of Heterogeneity for Overall Survival and Publication Bias
We performed a meta-regression to explore the source of high heterogeneity for OS (Table 4). All potential factors could not significantly explain heterogeneity in the meta-analyses of the SIRT1 expression with survival outcomes in the post-hoc analysis, with the exception of ethnicity (Supplementary Table 5). Meta-regression analysis demonstrated a statistically significant correlation between ethnicity and OS (P = 0.022). From the meta-regression result, we conducted a subgroup analysis with groups of patients Asian or Caucasian (Supplementary Figure 1C). This subgroup analysis demonstrated a significantly lower heterogeneity value in Asian group (n = 40, RR: 1.708, 95% CI: [1.406, 2.076], I2 = 69.59%), which suggests that the high SIRT1 expression has stronger efficacy in the Asian population than the Caucasian population.
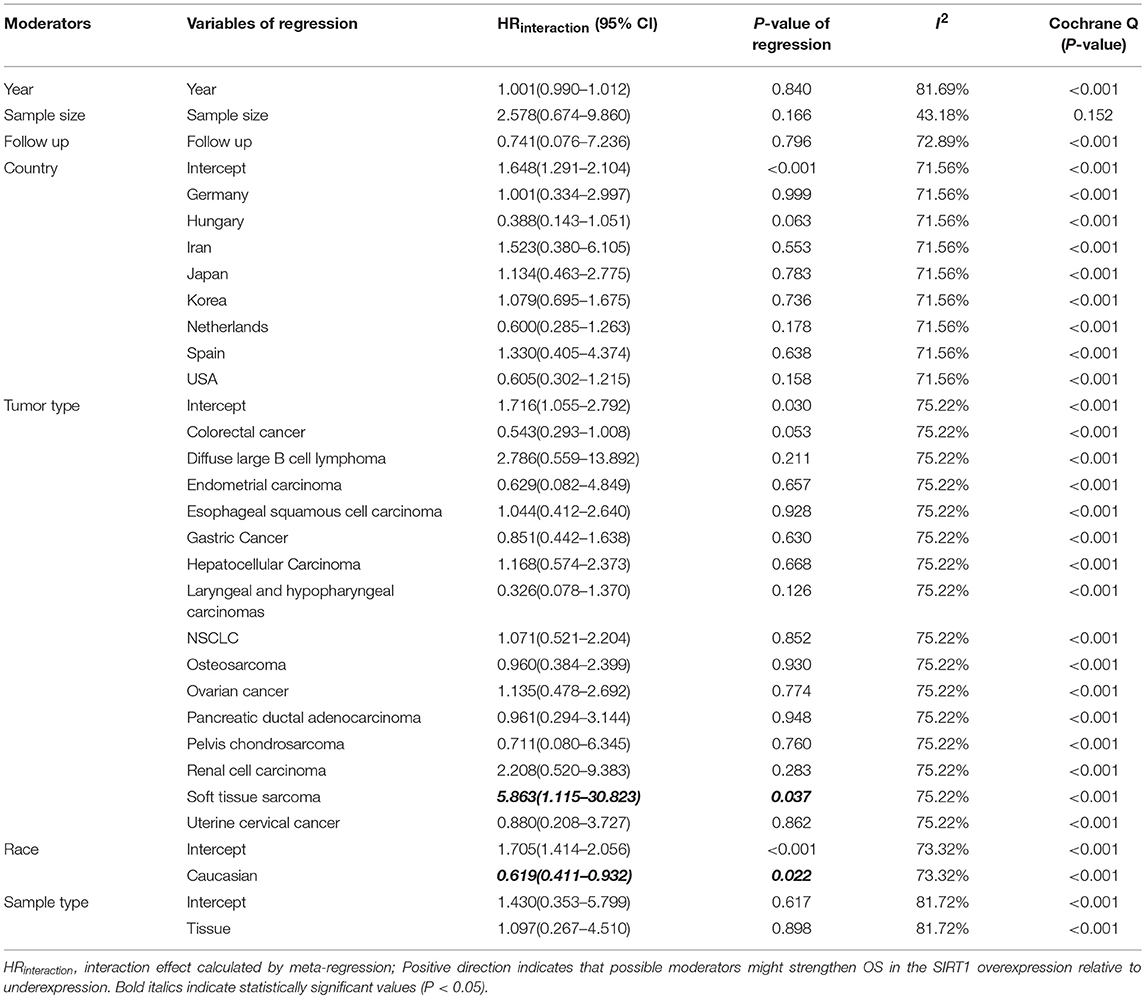
Table 4. Meta-regression analysis of heterogeneity for overall survival.
Meta-regression also used to explore the source of high heterogeneity for clinicopathological outcomes (Further details are provided in Supplementary Table 6). As to tumor stage, meta-regression analysis demonstrated a statistically significant correlation between tumor stage and country (P < 0.05), published year (P = 0.0169), and sample size (P = 0.0004). This subgroup analysis demonstrated a significantly lower heterogeneity value in China (n = 17, RR: 1.638, 95% CI: [1.404, 1.911], I2 = 41.16%), which suggests that the high SIRT1 expression has stronger efficacy in the China population than the other countries. As to tumor size, meta-regression analysis demonstrated a statistically significant correlation between tumor size and published year (P = 0.0260). As to depth of tumor invasion, meta-regression analysis demonstrated a statistically significant correlation between depth of tumor invasion and sample size (P = 0.0044).
We used funnel plots and Egger's regression models to assess potential publication bias (Tables 2, 3). The association between HRs (Supplementary Figure 7) or RRs (Supplementary Figure 8) and standard error for the SIRT1 expression was demonstrated in funnel plots, with each plot point representing a study. In regards to the OS, RFS, and TNM stage, we found that Egger's regression yielded potential publication bias (Figure 7).
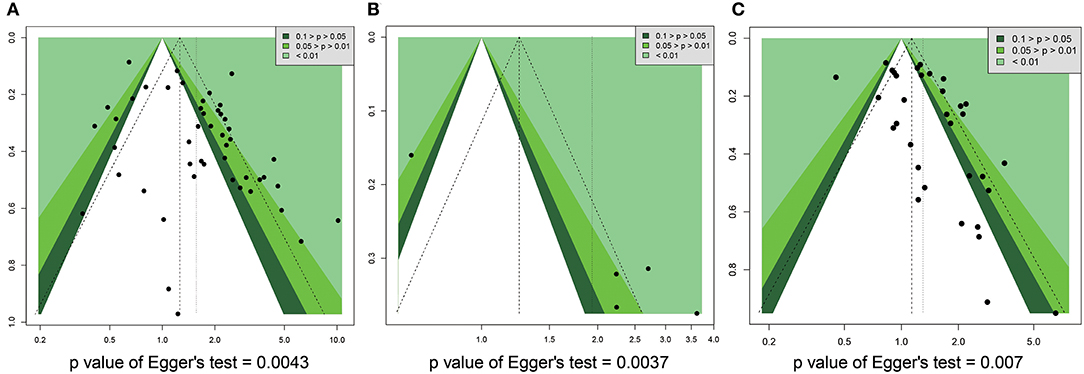
Figure 7. Funnel plot for publication bias in overall survival, recurrence free survival, and TNM stage. (A) OS. (B) RFS. (C) TNM stage.
Discussion
In the current study, we conducted a meta-analysis of 13,138 subjects in 63 articles from PubMed, EMBASE and Cochrane library to evaluate prognostic and clinicopathological significance of SIRT1 expression in cancers. We found that elevated expression of SIRT1 was correlated with a poor OS of cancer patients, DFS, EFS, and PFS, but couldn't predict RFS or CCS. Elevated SIRT1 expression was associated with TNM stage, lymph node metastasis, and distant metastasis, but not with tumor size, depth of tumor invasion, differentiation, gender, or age. Our findings provide a clue to understanding prognostic and clinicopathological significance of SIRT1 expression in cancers.
Our current study indicates that overexpression of SIRT1 is correlated with poor OS, DFS, EFS, and PFS, but not with RFS or CCS, suggesting that SIRT1 expression is significantly correlated with poor prognosis as a global factor but not a restricted factor to tumor itself. It has been shown that SIRT1 is not a protein only found to a specific tissues or organs, instead, its expression can be found in almost all human tissues (1) and involved in a large variety of cellular processes, such as genomic stability, energy metabolism, senescence, gene transcription, and oxidative stress (5) by acting on a wide spectrum of proteins, including histones and transcription factors (2–4). This render SIRT1 plays multiple roles to regulate biological process in multi-systems. Melatonin is a pleiotropic molecule synthesized by pineal gland and many other organs and has important cytoprotective effects in many tissues including aging, neurodegenerative diseases, immunomodulation, and cancer and modulates DNA damage response (88, 89). Melatonin counteracts tumor metastases by modulating cell-cell and cell-matrix interaction, extracellular matrix remodeling, cytoskeleton reorganization, epithelial-mesenchymal transition, and angiogenesis (90). Recent studies showed that the upregulated SIRT1 signaling pathway is involved in protective effects of melatonin on vascular endothelium against aging-, oxidative stress-, lipopolysaccharide-, and ischemia-induced damage (91) and delays ovarian aging (92). SIRT1 is induced in normal cells and inhibited in tumor cells by melatonin (88, 89). SIRT1 may mediate the pleiotropic function of melatonin in cancer progression and metastasis. SIRT1 is an endocrine regulator of thyroid and parathyroid hormone function (93–95), and steroid hormone receptor activity (96, 97). SIRT1 is a regulator in immunity and autoimmunity, such as dendritic cell activation, T-regulatory cells (98–102). SIRT1 is also a regulator of lipid and carbohydrate metabolism (9, 103–105). In addition, SIRT1 regulates nervous system by inhibiting neuronal apoptosis and damage as well module nerve regeneration (103, 106, 107). Therefore, SIRT1 is a global factor for endocrine, immunity, metabolism, and nervous system, and affect poor OS, DFS, EFS, and PFS, but not with RFS or CCS in cancer patients.
In the current study, we found that SIRT1 overexpression was associated with TNM stage, lymph node metastasis, and distant metastasis, but not with tumor size, depth of tumor invasion, differentiation, gender, or age, suggesting that SIRT1 promotes metastasis but not growth, proliferation, and invasion of cancer tissues. Tumor is locally initiated and proliferated and may invade near tissues. Tumor size, depth of tumor invasion, and differentiation are terms used to characterize tumors which are locally confined in the early stage of malignancy (108, 109). Metastasis is the characteristics of advanced malignancy of cancer progression (110–113). Our data indicate that SIRT1 overexpression is associated with metastasis but not with tumor characteristics of early stage, suggesting that SIRT1 expression can predict advanced malignancy and is a potential therapeutic target for inhibiting metastasis of advanced cancer.
We performed subgroup analysis because of high heterogeneity in included studies. Correlation analysis between SIRT1 expression and prognosis of cancer types showed that SIRT1 overexpression predicted worse OS of osteosarcoma, esophageal squamous cell carcinoma, OS but not DFS of hepatocellular carcinoma, OS and DFS of breast carcinoma, OS and RFS of NSCLC, DFS but not OS or CCS in colorectal cancer, RFS and CCS but not OS of gastric cancer, RFS and CCS of renal cell carcinoma, CCS but not RFS in head and neck squamous cell carcinoma. SIRT1 overexpression cannot predict OS in ovarian cancer. Correlation analysis between SIRT1 expression and clinicopathological characteristics of cancers types showed that SIRT1 overexpression was associated with a higher TNM stage in hepatocellular carcinoma, but not in pancreatic ductal adenocarcinoma, ovarian cancer, colorectal cancer, gastric cancer, breast carcinoma, or NSCLC. SIRT1 overexpression was associated with distant metastasis in pancreatic ductal adenocarcinoma and breast carcinoma, but not in colorectal cancer or gastric cancer. From these results, we are unable to draw a unanimous conclusion, probably because there is a deficiency of studies that employ all prognostic indexes OS, DFS, EFS, RFS, CCS, and PFS or a full range of clinicopathological characteristics to study the role of SIRT1 expression in survival of patients with a specific cancer type. More thorough studies are warranted.
Our subgroup correlation analysis between SIRT1 expression and prognosis of cancer in different countries and ethnic groups showed that high expression of SIRT1 predicted poor OS and DFS in China, poor OS and EFS but not DFS in Korea, poor OS in Japan, EFS in USA, but not OS in USA or Netherlands. Elevated SIRT1 expression predicted worse OS and DFS in Asian population with cancers, poor DFS but not OS in Caucasian population. Our subgroup analysis between SIRT1 expression and clinicopathological characteristics of cancers in different countries and ethnic groups showed that SIRT1 overexpression was associated with a higher TNM stage and lymphatic metastasis in China and Asian population except lymphatic metastasis in Japan or Korea, and not higher TNM stage and lymphatic metastasis in Caucasian population, We also found that SIRT1 overexpression predicted distant metastasis in Caucasian population, but not in Asians. These results indicate that ethnic background has influence on the role of SIRT1 expression in predicting the OS and clinicopathological characteristics of cancers. This is consistent with recent studies that showed SIRT1 expression is lower in NSCLC than the normal control group in a group of Chinese patients (15), and overexpressed in NSCLC in an Iran population (16). Our study showed that overexpression of SIRT1 predicted a worse OS in the Asian but not in the Caucasian, a higher TNM stage and lymphatic metastasis in Asian population especially in China but not in the Caucasian. This is consistent with the results of our meta-regression analysis. The effects of ethnic background on the role of SIRT1 expression in predicting the OS and clinicopathological characteristics of cancers need further collaborative investigation.
It has been established that there are significant differences between Asian and Caucasian populations in genetic and epigenetic background, dietary, environmental factors (114, 115). These factors are essential for not only initiation and progression, but also metastasis of cancers (116, 117). Mutations and extensive polymorphisms of SIRT1 were found in Chinese and Japanese (118–121) and 41 cancer lines (122). Although the data on mutations and polymorphisms of SIRT1 are very limited, we speculate that difference in SIRT1 mutations and polymorphisms may be one of accounts for difference in predicting OS and TNM stage and lymphatic metastasis of cancer by SIRT1 expression. This deserves further investigation (123).
It is known that metastasis is an independent predictor for poor prognosis of many cancer types (124–126). We find that elevated expression of SIRT1 was correlated with OS, DFS, EFS, and PFS. SIRT1 overexpression is also correlated with TNM stage, lymph node metastasis, and distant metastasis, but not with tumor size, depth of tumor invasion, differentiation, gender, or age. Overexpression of SIRT1 predicted a worse OS and higher TNM stage and lymphatic metastasis in Asian population especially in China. Therefore, overexpression of SIRT1 may promote lymphatic metastasis of cancers that lead to poor OS, DFS, EFS, and PFS. It is likely that SIRT1-mediated molecular events and biological processes could be an underlying mechanism for metastasis.
Our study is consistent with the most recent study by Wang et al. in that SIRT1 overexpression was significantly correlated with the OS in solid cancers, especially in liver cancer and lung cancer based on 7,369 cases from 37 studies and most of them are Asians (34). Consistently, the study by Hong et al showed that high SIRT1 expression correlated with vascular invasion and was not significantly correlated with overall survival rates in colon cancer (36). Study with 3024 patients by Wu et al showed that high SIRT1 expression predicts poor survival in non-colorectal gastrointestinal cancer, but not in colorectal cancer (35). SIRT1 expression was correlated with depth of invasion, lymph node metastasis and TNM stage and predicted a poor OS in colorectal cancer patients based on an analysis with seven studies (33). In an analysis of 1,650 patients in seven studies, high SIRT1 expression predicts a poor prognosis of gastric cancer patients and linked with patients' age, T stage, N stage, and tumor differentiation (32). Analysis by Cao et al. based on six studies involving 604 patients showed that SIRT1 expression was correlated with poor DFS and OS and high TNM stage and lymph node metastasis (31). However, we have performed study on survival and clinicopathological significance of SIRT1 expression in cancers more comprehensively. First, we included 63 eligible articles and a total of 13,138 participants in our study. These patients represented 9 countries and 16 cancer types as well as Asian and Caucasian ethnic groups. Second, we investigated both clinicopathological and prognostic significance of SIRT1 expression based on comprehensive clinical data and performed a series of subgroup analysis based on prognostic types, clinicopathological characteristics, cancer types, ethnic groups, countries. These stratifications provide more vehicles in understanding the survival and clinicopathological significance of SIRT1 expression in cancers.
There are also limitations in our study. Firstly, we found that heterogeneity existed in the meta-analysis as indicated by the I2 values. It is predictable because of presence of inter-study differences in study design (prospective and retrospective), enrolled populations, treatment regimen, duration of follow-up, outcome measures, and other study and clinical characteristics (127). The heterogeneity among the studies remained, despite the usage of a random-effects model and subgroup analyses (128). Secondly, there is publication bias for SIRT1 expression and prognosis or clinicopathological characteristics as indicated by asymmetry of funnel plots for OS, DFS, EFS, RFS, CCS, PFS, and clinicopathological characteristics. Thirdly, we barely explored the correlation between SIRT1 overexpression and patient survival in terms of clinical parameters. Other elements that may contribute to the heterogeneity, such as therapeutic regimen, pathological grade, body mass index, and mean age, were not analyzed due to the lack of sufficient data (129). Fourthly, we performed a quantitative meta-analysis based mostly on secondary data, which could lead to inaccurate results because of a shortage of original individual patient data (130). Finally, we conducted our study based on the mRNA expression of SIRT1 or the protein levels, although the changes in the mRNA and protein levels of SIRT1 are consistent in several cancer types (15, 16, 131, 132). The study by Hong et al who determined SIRT1 expression using immunohistochemistry showed similar results to ours study in relation with vascular invasion and overall survival rates in colon cancer (36). We should extensively investigate the prognostic and clinicopathological significance of SIRT1 expression at protein level in the future.
In conclusion, we have found that elevated expression of SIRT1 can predict poor OS, DFS, EFS, and PFS, but not with RFS or CCS, TNM stage, lymph node metastasis, and distant metastasis, but not tumor size, depth of tumor invasion, differentiation of cancers. Ethnic background has influence on the role of SIRT1 expression in predicting survival and clinicopathological characteristics of cancers. Overexpression of SIRT1 predicted a worse OS and higher TNM stage and lymphatic metastasis in Asian population especially in China. SIRT1-mediated molecular events and biological processes could be an underlying mechanism for metastasis and SIRT1 is a potential therapeutic target for inhibiting cancer metastasis. More studies that employ all prognostic indexes OS, DFS, EFS, RFS, CCS, and PFS or a full range of clinicopathological characteristics to study the role of SIRT1 expression in survival of patients with a specific cancer type, and mutations and polymorphisms of SIRT1 in cancers of different ethnic groups need to be further investigated in the future.
Data Availability
All datasets generated for this study are included in the manuscript and the supplementary files.
Author Contributions
MS, DH, XGu, and HZ participated in research design. MS, WZ, MD, SX, XGo, PL, HL, and JZ performed data analysis. MS and XGu wrote or contributed to the writing of the manuscript.
Funding
This research was supported by the Natural Science Foundation of Hubei Provincial Department of Education (Q20182105), Chen Xiao-ping Foundation for the development of science and technology of Hubei Provincial (CXPJJH11800001-2018333), Natural Science Foundation of Hubei Province of China (2016CFB530) and Faculty Development Foundation of Hubei University of Medicine (2014QDJZR01), and National Students' platform for innovation and entrepreneurship training program (201810929005, 201810929009, 201810929068, and 201813249010).
Conflict of Interest Statement
The authors declare that the research was conducted in the absence of any commercial or financial relationships that could be construed as a potential conflict of interest.
Supplementary Material
The Supplementary Material for this article can be found online at: https://www.frontiersin.org/articles/10.3389/fendo.2019.00121/full#supplementary-material
Supplementary Table 1. Databases searching terms. (a) Search criterion of Medline (via PubMed, from inception to April 1st, 2018) (n = 2397). (b) Search criterion of Embase (from 1966 to July 24, 2018) (n = 2460). (c) Search criterion of Cochrane Library (April 1st, 2018) (n = 20).
Supplementary Table 2. Results of quality assessment using the Newcastle–Ottawa Scale for the included studies.
Supplementary Table 3. Subgroup analysis for SIRT1 overexpression and the prognosis in cancers.
Supplementary Table 4. Subgroup analysis for SIRT1 overexpression and clinicopathological parameters in cancers.
Supplementary Table 5. Meta-regression analysis of heterogeneity for survival outcomes.
Supplementary Table 6. Meta-regression analysis of heterogeneity for clinicopathological parameters in cancers.
Supplementary Figure 1. Forest plot of subgroup analysis for SIRT1 overexpression and OS in cancers. (A) Cancer subgroup, (B) Country subgroup, (C) Ethnicity subgroup.
Supplementary Figure 2. Forest plot of subgroup analysis for SIRT1 overexpression and DFS in cancers. (A) Cancer subgroup, (B) Country subgroup, (C) Ethnicity subgroup.
Supplementary Figure 3. Forest plots of non-essential clinicopathological outcomes compared SIRT1 overexpression with underexpression. (A) Tumor size, (B) Depth of tumor invasion, (C) Differentiation, (D) Gender, (E) Age.
Supplementary Figure 4. Forest plot of subgroup analysis for SIRT1 overexpression and TNM stage in cancers. (A) Cancer subgroup, (B) Country subgroup, (C) Ethnicity subgroup.
Supplementary Figure 5. Forest plot of subgroup analysis for SIRT1 overexpression and distant metastasis in cancers. (A) Cancer subgroup, (B) Ethnicity subgroup.
Supplementary Figure 6. Forest plot of subgroup analysis for SIRT1 overexpression and lymphatic metastasis in cancers. (A) Country subgroup, (B) Ethnicity subgroup.
Supplementary Figure 7. Funnel plot for publication bias for SIRT1 expression and prognosis. (A) OS, (B) DFS, (C) EFS, (D) RFS, (E) CCS.
Supplementary Figure 8. Funnel plot for publication bias for SIRT1 expression and clinicopathological characteristics. (A) Age, (B) Gender, (C) Tumor stage, (D) Distant metastasis, (E) Lymphatic invasion, (F) Tumor size, (G) Depth of tumor invasion, (H) Differentiation.
Abbreviations
OS, overall survival; SIRT1, silent information regulator 1, sirtuin-1; HR, hazard ratio; RR, relative risk; CI, confidence interval; DFS, disease free survival; EFS, event free survival; PFS, progress-free survival; RFS, recurrence-free survival; CCS, cancer-specific survival; NAD, nicotinamide adenine dinucleotide; q-PCR, quantitative real-time polymerase chain reaction; IHC, immunohistochemistry; ISH, in situ hybridization; NA, not available; NOS, newcastle-ottawa scale; NSCLC, non-small cell lung cancer; EOC, epithelial ovarian cancer; TNM, tumor, node, metastasis; MOOSE, meta-analysis of observational Studies in Epidemiology.
References
1. Fagerberg L, Hallstrom BM, Oksvold P, Kampf C, Djureinovic D, Odeberg J, et al. Analysis of the human tissue-specific expression by genome-wide integration of transcriptomics and antibody-based proteomics. Mol Cell Proteomics. (2014) 13:397–406. doi: 10.1074/mcp.M113.035600
2. Jang SH, Min KW, Paik SS, Jang KS. Loss of SIRT1 histone deacetylase expression associates with tumour progression in colorectal adenocarcinoma. J Clin Pathol. (2012) 65:735–9. doi: 10.1136/jclinpath-2012-200685
3. Derr RS, van Hoesel AQ, Benard A, Goossens-Beumer IJ, Sajet A, Dekker-Ensink NG, et al. High nuclear expression levels of histone-modifying enzymes LSD1, HDAC2 and SIRT1 in tumor cells correlate with decreased survival and increased relapse in breast cancer patients. BMC Cancer. (2014) 14:604. doi: 10.1186/1471-2407-14-604
4. Xu Z, Yang Y, Li B, Li Y, Xia K, Li X, et al. Checkpoint suppressor 1 suppresses transcriptional activity of ERalpha and breast cancer cell proliferation via deacetylase SIRT1. Cell Death Dis. (2018) 9:559. doi: 10.1038/s41419-018-0629-3
5. Tran D, Bergholz J, Zhang H, He H, Wang Y, Zhang Y, et al. Insulin-like growth factor-1 regulates the SIRT1-p53 pathway in cellular senescence. Aging Cell. (2014) 13:669–78. doi: 10.1111/acel.12219
6. Imai S, Guarente L. Ten years of NAD-dependent SIR2 family deacetylases: implications for metabolic diseases. Trends Pharmacol Sci. (2010) 31:212–20. doi: 10.1016/j.tips.2010.02.003
7. Sebastian C, Satterstrom FK, Haigis MC, Mostoslavsky R. From sirtuin biology to human diseases: an update. J Biol Chem. (2012) 287:42444–52. doi: 10.1074/jbc.R112.402768
8. Carafa V, Rotili D, Forgione M, Cuomo F, Serretiello E, Hailu GS, et al. Sirtuin functions and modulation: from chemistry to the clinic. Clin Epigenet. (2016) 8:61. doi: 10.1186/s13148-016-0224-3
9. Zhu S, Dong Z, Ke X, Hou J, Zhao E, Zhang K, et al. The roles of sirtuins family in cell metabolism during tumor development. Semin Cancer Biol. (2018). doi: 10.1016/j.semcancer.2018.11.003. [Epub ahead of print].
10. Liu T, Liu PY, Marshall GM. The critical role of the class III histone deacetylase SIRT1 in cancer. Cancer Res. (2009) 69:1702–5. doi: 10.1158/0008-5472.CAN-08-3365
11. Fang Y, Nicholl MB. Sirtuin 1 in malignant transformation: friend or foe? Cancer Lett. (2011) 306:10–4. doi: 10.1016/j.canlet.2011.02.019
12. Fang Y, Nicholl MB. A dual role for sirtuin 1 in tumorigenesis. Curr Pharm Des. (2014) 20:2634–6.
13. Xu Y, Qin Q, Chen R, Wei C, Mo Q. SIRT1 promotes proliferation, migration, and invasion of breast cancer cell line MCF-7 by upregulating DNA polymerase delta1 (POLD1). Biochem Biophys Res Commun. (2018) 502:351–7. doi: 10.1016/j.bbrc.2018.05.164
14. Xia X, Zhou X. Knockdown of SIRT1 inhibits proliferation and promotes apoptosis of paclitaxel-resistant human cervical cancer cells. Cell Mol Biol. (2018) 64:36–41.
15. Yang F. The expression and mechanism of Sirt1 and AMPK in nonsmall cell lung cancer. J BUON. (2018) 23:106–10.
16. Gharabaghi MA. Diagnostic investigation of BIRC6 and SIRT1 protein expression level as potential prognostic biomarkers in patients with non-small cell lung cancer. Clin Respir J. (2018) 12:633–8. doi: 10.1111/crj.12572
17. Tan J, Liu Y, Maimaiti Y, Wang C, Yan Y, Zhou J, et al. Combination of SIRT1 and Src overexpression suggests poor prognosis in luminal breast cancer. Onco Targets Ther. (2018) 11:2051–61. doi: 10.2147/OTT.S162503
18. Shuang T, Wang M, Zhou Y, Shi C. Over-expression of Sirt1 contributes to chemoresistance and indicates poor prognosis in serous epithelial ovarian cancer (EOC). Med Oncol. (2015) 32:260. doi: 10.1007/s12032-015-0706-8
19. Noguchi A, Kikuchi K, Zheng H, Takahashi H, Miyagi Y, Aoki I, et al. SIRT1 expression is associated with a poor prognosis, whereas DBC1 is associated with favorable outcomes in gastric cancer. Cancer Med. (2014) 3:1553–61. doi: 10.1002/cam4.310
20. Li C, Wang L, Zheng L, Zhan X, Xu B, Jiang J, et al. SIRT1 expression is associated with poor prognosis of lung adenocarcinoma. Onco Targets Ther. (2015) 8:977–84. doi: 10.2147/ott.s82378
21. Lee H, Kim KR, Noh SJ, Park HS, Kwon KS, Park BH, et al. Expression of DBC1 and SIRT1 is associated with poor prognosis for breast carcinoma. Hum Pathol. (2011) 42:204–13. doi: 10.1016/j.humpath.2010.05.023
22. Chen X, Sun K, Jiao S, Cai N, Zhao X, Zou H, et al. High levels of SIRT1 expression enhance tumorigenesis and associate with a poor prognosis of colorectal carcinoma patients. Sci Rep. (2014) 4:7481. doi: 10.1038/srep07481
23. Chen X, Hokka D, Maniwa Y, Ohbayashi C, Itoh T, Hayashi Y. Sirt1 is a tumor promoter in lung adenocarcinoma. Oncol Lett. (2014) 8:387–93. doi: 10.3892/ol.2014.2057
24. Kim JR, Moon YJ, Kwon KS, Bae JS, Wagle S, Yu TK, et al. Expression of SIRT1 and DBC1 is associated with poor prognosis of soft tissue sarcomas. PLoS ONE. (2013) 8:e74738. doi: 10.1371/journal.pone.0074738
25. Wu M, Wei W, Xiao X, Guo J, Xie X, Li L, et al. Expression of SIRT1 is associated with lymph node metastasis and poor prognosis in both operable triple-negative and non-triple-negative breast cancer. Med Oncol. (2012) 29:3240–9. doi: 10.1007/s12032-012-0260-6
26. Chen HC, Jeng YM, Yuan RH, Hsu HC, Chen YL. SIRT1 promotes tumorigenesis and resistance to chemotherapy in hepatocellular carcinoma and its expression predicts poor prognosis. Ann Surg Oncol. (2012) 19:2011–9. doi: 10.1245/s10434-011-2159-4
27. Cha EJ, Noh SJ, Kwon KS, Kim CY, Park BH, Park HS, et al. Expression of DBC1 and SIRT1 is associated with poor prognosis of gastric carcinoma. Clin Cancer Res. (2009) 15:4453–9. doi: 10.1158/1078-0432.ccr-08-3329
28. Jang KY, Hwang SH, Kwon KS, Kim KR, Choi HN, Lee NR, et al. SIRT1 expression is associated with poor prognosis of diffuse large B-cell lymphoma. Am J Surg Pathol. (2008) 32:1523–31. doi: 10.1097/PAS.0b013e31816b6478
29. Noguchi A, Li X, Kubota A, Kikuchi K, Kameda Y, Zheng H, et al. SIRT1 expression is associated with good prognosis for head and neck squamous cell carcinoma patients. Oral Surg Oral Med Oral Pathol Oral Radiol. (2013) 115:385–92. doi: 10.1016/j.oooo.2012.12.013
30. Jung W, Hong KD, Jung WY, Lee E, Shin BK, Kim HK, et al. SIRT1 expression is associated with good prognosis in colorectal cancer. Korean J Pathol. (2013) 47:332–9. doi: 10.4132/KoreanJPathol.2013.47.4.332
31. Cao YW, Li YC, Wan GX, Du XM, Li F. Clinicopathological and prognostic role of SIRT1 in breast cancer patients: a meta-analysis. Int J Clin Exp Med. (2015) 8:616–24.
32. Jiang B, Chen JH, Yuan WZ, Ji JT, Liu ZY, Wu L, et al. Prognostic and clinical value of Sirt1 expression in gastric cancer: A systematic meta-analysis. J Huazhong Univ Sci Technolog Med Sci. (2016) 36:278–84. doi: 10.1007/s11596-016-1580-0
33. Zu G, Ji A, Zhou T, Che N. Clinicopathological significance of SIRT1 expression in colorectal cancer: a systematic review and meta analysis. Int J Surg. (2016) 26:32–7. doi: 10.1016/j.ijsu.2016.01.002
34. Wang C, Yang W, Dong F, Guo Y, Tan J, Ruan S, et al. The prognostic role of Sirt1 expression in solid malignancies: a meta-analysis. Oncotarget. (2017) 8:66343–51. doi: 10.18632/oncotarget.18494
35. Wu S, Jiang J, Liu J, Wang X, Gan Y, Tang Y. Meta-analysis of SIRT1 expression as a prognostic marker for overall survival in gastrointestinal cancer. Oncotarget. (2017) 8:62589–99. doi: 10.18632/oncotarget.19880
36. Hong WG, Pyo JS. The clinicopathological significance of SIRT1 expression in colon cancer: an immunohistochemical study and meta-analysis. Pathol Res Pract. (2018) 214:1550–5. doi: 10.1016/j.prp.2018.07.022
37. Parmar MK, Torri V, Stewart L. Extracting summary statistics to perform meta-analyses of the published literature for survival endpoints. Stat Med. (1998) 17:2815–34.
38. Tierney JF, Stewart LA, Ghersi D, Burdett S, Sydes MR. Practical methods for incorporating summary time-to-event data into meta-analysis. Trials. (2007) 8:16. doi: 10.1186/1745-6215-8-16
39. Stuck AE, Rubenstein LZ, Wieland D. Bias in meta-analysis detected by a simple, graphical test. Asymmetry detected in funnel plot was probably due to true heterogeneity. BMJ. (1998) 316: 469; author reply 470–461.
40. Stenzinger A, Endris V, Klauschen F, Sinn B, Lorenz K, Warth A, et al. High SIRT1 expression is a negative prognosticator in pancreatic ductal adenocarcinoma. BMC Cancer. (2013) 13:450. doi: 10.1186/1471-2407-13-450
41. Li S, Hong H, Lv H, Wu G, Wang Z. SIRT 1 overexpression is associated with metastasis of Pancreatic Ductal Adenocarcinoma (PDAC) and promotes migration and growth of PDAC cells. Med Sci Monit. (2016) 22:1593–600. doi: 10.12659/MSM.896697
42. Teramae M, Fukuda T, Wada T, Kawanishi M, Imai K, Yamauchi M, et al. Sirtuin1 expression predicts the efficacy of neoadjuvant chemotherapy for locally advanced uterine cervical cancer. Mol Clin Oncol. (2015) 3:73–8. doi: 10.3892/mco.2014.427
43. Asaka R, Miyamoto T. Sirtuin 1 promotes the growth and cisplatin resistance of endometrial carcinoma cells: a novel therapeutic target. Lab Invest. (2015) 95:1363–73. doi: 10.1038/labinvest.2015.119
44. Jang KY, Kim KS, Hwang SH, Kwon KS, Kim KR, Park HS, et al. Expression and prognostic significance of SIRT1 in ovarian epithelial tumours. Pathology. (2009) 41:366–71. doi: 10.1080/00313020902884451
45. Mvunta DH, Miyamoto T, Asaka R, Yamada Y, Ando H, Higuchi S, et al. Overexpression of SIRT1 is associated with poor outcomes in patients with ovarian carcinoma. Appl Immunohistochem Mol Morphol. (2017) 25:415–21. doi: 10.1097/pai.0000000000000316
46. Zhang N, Xie T, Xian M, Wang YJ, Li HY, Ying MD, et al. SIRT1 promotes metastasis of human osteosarcoma cells. Oncotarget. (2016) 7:79654–69. doi: 10.18632/oncotarget.12916
47. Feng H, Guo P, Wang J, Xu J, Xie C, Gao F. Expression of Leptin and Sirtuin-1 is associated with poor prognosis in patients with osteosarcoma. Pathol Res Pract. (2016) 212:319–24. doi: 10.1016/j.prp.2016.02.002
48. Yu XM, Liu Y, Jin T, Liu J, Wang J, Ma C, et al. The expression of SIRT1 and DBC1 in laryngeal and hypopharyngeal carcinomas. PLoS ONE. (2013) 8:e66975. doi: 10.1371/journal.pone.0066975
49. Batra A, Kashyap S, Singh L, Bakhshi S. Sirtuin1 expression and correlation with histopathological features in retinoblastoma. Ocul Oncol Pathol. (2015) 2:86–90. doi: 10.1159/000439594
50. Chen GQ, Tian H, Yue WM, Li L, Li SH, Qi L, et al. SIRT1 expression is associated with lymphangiogenesis, lymphovascular invasion and prognosis in pN0 esophageal squamous cell carcinoma. Cell Biosci. (2014) 4:48. doi: 10.1186/2045-3701-4-48
51. He Z, Yi J, Jin L, Pan B, Chen L, Song H. Overexpression of Sirtuin-1 is associated with poor clinical outcome in esophageal squamous cell carcinoma. Tumour Biol. (2016) 37:7139–48. doi: 10.1007/s13277-015-4459-y
52. Feng H, Wang J, Xu J, Xie C, Gao F, Li Z. The expression of SIRT1 regulates the metastaticplasticity of chondrosarcoma cells by inducing epithelial-mesenchymal transition. Sci Rep. (2017) 7:41203. doi: 10.1038/srep41203
53. Noh SJ, Kang MJ, Kim KM, Bae JS, Park HS, Moon WS, et al. Acetylation status of P53 and the expression of DBC1, SIRT1, and androgen receptor are associated with survival in clear cell renal cell carcinoma patients. Pathology. (2013) 45:574–80. doi: 10.1097/PAT.0b013e3283652c7a
54. Jeh SU, Park JJ, Lee JS, Kim DC, Do J, Lee SW, et al. Differential expression of the sirtuin family in renal cell carcinoma: aspects of carcinogenesis and prognostic significance. Urol Oncol. (2017) 35:675.e9–675.e15. doi: 10.1016/j.urolonc.2017.08.016
55. Ren Y, Gu Y, Wang W, Wang J, Li X, Wang Y, et al. Expression of the significance of silent information regulator type-1 in Angioimmunoblastic T-cell lymphoma is greater association with tumorigenesis and has strong implications for adverse prognosis. Cell Cycle. (2016) 15:1545–51. doi: 10.1080/15384101.2016.1172157
56. Nosho K, Shima K, Irahara N, Kure S, Firestein R, Baba Y, et al. SIRT1 histone deacetylase expression is associated with microsatellite instability and CpG island methylator phenotype in colorectal cancer. Mod Pathol. (2009) 22:922–32. doi: 10.1038/modpathol.2009.49
57. Benard A, Goossens-Beumer IJ, van Hoesel AQ, Horati H, de Graaf W, Putter H, et al. Nuclear expression of histone deacetylases and their histone modifications predicts clinical outcome in colorectal cancer. Histopathology. (2015) 66:270–82. doi: 10.1111/his.12534
58. Lv L, Shen Z, Zhang J, Zhang H, Dong J, Yan Y, et al. Clinicopathological significance of SIRT1 expression in colorectal adenocarcinoma. Med Oncol. (2014) 31:965. doi: 10.1007/s12032-014-0965-9
59. Lee WY, Lee WT, Cheng CH, Chen KC, Chou CM, Chung CH, et al. Repositioning antipsychotic chlorpromazine for treating colorectal cancer by inhibiting sirtuin 1. Oncotarget. (2015) 6:27580–95. doi: 10.18632/oncotarget.4768
60. Cheng F, Su L, Yao C, Liu L, Shen J, Liu C, et al. SIRT1 promotes epithelial-mesenchymal transition and metastasis in colorectal cancer by regulating Fra-1 expression. Cancer Lett. (2016) 375:274–83. doi: 10.1016/j.canlet.2016.03.010
61. Chen J, Zhang B, Wong N, Lo AW, To KF, Chan AW, et al. Sirtuin 1 is upregulated in a subset of hepatocellular carcinomas where it is essential for telomere maintenance and tumor cell growth. Cancer Res. (2011) 71:4138–49. doi: 10.1158/0008-5472.can-10-4274
62. Jang KY, Noh SJ, Lehwald N, Tao GZ, Bellovin DI, Park HS, et al. SIRT1 and c-Myc promote liver tumor cell survival and predict poor survival of human hepatocellular carcinomas. PLoS ONE. (2012) 7:e45119. doi: 10.1371/journal.pone.0045119
63. Hao C, Zhu PX, Yang X, Han ZP, Jiang JH, Zong C, et al. Overexpression of SIRT1 promotes metastasis through epithelial-mesenchymal transition in hepatocellular carcinoma. BMC Cancer. (2014) 14:978. doi: 10.1186/1471-2407-14-978
64. Cheng J, Liu C, Liu L, Chen X, Shan J, Shen J, et al. MEK1 signaling promotes self-renewal and tumorigenicity of liver cancer stem cells via maintaining SIRT1 protein stabilization. Oncotarget. (2016) 7:20597–611. doi: 10.18632/oncotarget.7972
65. Li Y, Xu S, Li J, Zheng L, Feng M, Wang X, et al. SIRT1 facilitates hepatocellular carcinoma metastasis by promoting PGC-1alpha-mediated mitochondrial biogenesis. Oncotarget. (2016) 7:29255–74. doi: 10.18632/oncotarget.8711
66. Liu L, Liu C, Zhang Q, Shen J, Zhang H, Shan J, et al. SIRT1-mediated transcriptional regulation of SOX2 is important for self-renewal of liver cancer stem cells. Hepatology. (2016) 64:814–27. doi: 10.1002/hep.28690
67. Feng AN, Zhang LH, Fan XS, Huang Q, Ye Q, Wu HY, et al. Expression of SIRT1 in gastric cardiac cancer and its clinicopathologic significance. Int J Surg Pathol. (2011) 19:743–50. doi: 10.1177/1066896911412181
68. Kang Y, Jung WY, Lee H, Lee E, Kim A, Kim BH. Expression of SIRT1 and DBC1 in gastric adenocarcinoma. Korean J Pathol. (2012) 46:523–31. doi: 10.4132/KoreanJPathol.2012.46.6.523
69. Qiu G, Li X. The prognostic role of SIRT1-autophagy axis in gastric cancer. Evid Based Complement Alternat Med. (2016) 2016:6869415. doi: 10.1155/2016/5989681
70. Szasz AM, Lanczky A, Nagy A, Forster S, Hark K, Green JE, et al. Cross-validation of survival associated biomarkers in gastric cancer using transcriptomic data of 1,065 patients. Oncotarget. (2016) 7:49322–33. doi: 10.18632/oncotarget.10337
71. Zhang S, Huang S, Deng C, Cao Y, Yang J, Chen G, et al. Co-ordinated overexpression of SIRT1 and STAT3 is associated with poor survival outcome in gastric cancer patients. Oncotarget. (2017) 8:18848–60. doi: 10.1016/j.nut.2016.09.008
72. Zhang LH, Huang Q, Fan XS, Wu HY, Yang J, Feng AN. Clinicopathological significance of SIRT1 and p300/CBP expression in gastroesophageal junction (GEJ) cancer and the correlation with E-cadherin and MLH1. Pathol Res Pract. (2013) 209:611–7. doi: 10.1016/j.prp.2013.03.012
73. Ren NS, Ji M, Tokar EJ, Busch EL, Xu X, Lewis D, et al. Haploinsufficiency of SIRT1 enhances glutamine metabolism and promotes cancer development. Curr Biol. (2017) 27:483–94. doi: 10.1016/j.cub.2016.12.047
74. Shin DH, Choi YJ, Jin P, Yoon H, Chun YS, Shin HW, et al. Distinct effects of SIRT1 in cancer and stromal cells on tumor promotion. Oncotarget. (2016) 7:23975–87. doi: 10.18632/oncotarget.8073
75. Zhang XZ, Chen SQ, Cheng ML, Cao FL, Cheng YF. The expression and correlation of SIRT1 and Phospho-SIRT1 in colorectal cancer. Int J Clin Exp Med. (2015) 8:809–17.
76. Cao YW, Li WQ, Wan GX, Li YX, Du XM, Li YC, et al. Correlation and prognostic value of SIRT1 and Notch1 signaling in breast cancer. J Exp Clin Cancer Res. (2014) 33:97. doi: 10.1186/s13046-014-0097-2
77. Jin MS, Hyun CL, Park IA, Kim JY, Chung YR, Im SA, et al. SIRT1 induces tumor invasion by targeting epithelial mesenchymal transition-related pathway and is a prognostic marker in triple negative breast cancer. Tumour Biol. (2016) 37:4743–53. doi: 10.1007/s13277-015-4231-3
78. Kim H, Lee KH, Park IA, Chung YR, Im SA, Noh DY, et al. Expression of SIRT1 and apoptosis-related proteins is predictive for lymph node metastasis and disease-free survival in luminal A breast cancer. Virchows Arch. (2015) 467:563–70. doi: 10.1007/s00428-015-1815-7
79. Chung SY, Jung YY, Park IA, Kim H, Chung YR, Kim JY, et al. Oncogenic role of SIRT1 associated with tumor invasion, lymph node metastasis, and poor disease-free survival in triple negative breast cancer. Clin Exp Metastasis. (2016) 33:179–85. doi: 10.1007/s10585-015-9767-5
80. Lee JJ, Lee HJ, Son BH, Kim SB, Ahn JH, Ahn SD, et al. Expression of FOXM1 and related proteins in breast cancer molecular subtypes. Int J Exp Pathol. (2016) 97:170–7. doi: 10.1111/iep.12187
81. Chung YR, Kim H, Park SY, Park IA, Jang JJ, Choe JY, et al. Distinctive role of SIRT1 expression on tumor invasion and metastasis in breast cancer by molecular subtype. Hum Pathol. (2015) 46:1027–35. doi: 10.1016/j.humpath.2015.03.015
82. Zhang W, Luo J, Yang F, Wang Y, Yin Y, Strom A, et al. BRCA1 inhibits AR-mediated proliferation of breast cancer cells through the activation of SIRT1. Sci Rep. (2016) 6:22034. doi: 10.1038/srep22034
83. Sung JY, Kim R, Kim JE, Lee J. Balance between SIRT1 and DBC1 expression is lost in breast cancer. Cancer Sci. (2010) 101:1738–44. doi: 10.1111/j.1349-7006.2010.01573.x
84. Lin SY, Peng F. Association of SIRT1 and HMGA1 expression in non-small cell lung cancer. Oncol Lett. (2016) 11:782–8. doi: 10.3892/ol.2015.3914
85. Noh SJ, Baek HA, Park HS, Jang KY, Moon WS, Kang MJ, et al. Expression of SIRT1 and cortactin is associated with progression of non-small cell lung cancer. Pathol Res Pract. (2013) 209:365–70. doi: 10.1016/j.prp.2013.03.011
86. Zhang T, Rong N, Chen J, Zou C, Jing H, Zhu X, et al. SIRT1 expression is associated with the chemotherapy response and prognosis of patients with advanced NSCLC. PLoS ONE. (2013) 8:e79162. doi: 10.1371/journal.pone.0079162
87. Grbesa I, Pajares MJ, Martinez-Terroba E, Agorreta J, Mikecin AM, Larrayoz M, et al. Expression of sirtuin 1 and 2 is associated with poor prognosis in non-small cell lung cancer patients. PLoS ONE. (2015) 10:e0124670. doi: 10.1371/journal.pone.0124670
88. Majidinia M, Sadeghpour A, Mehrzadi S, Reiter RJ, Khatami N, Yousefi B. Melatonin: a pleiotropic molecule that modulates DNA damage response and repair pathways. J Pineal Res. (2017) 63:e12416. doi: 10.1111/jpi.12416
89. Mayo JC, Sainz RM, Gonzalez Menendez P, Cepas V, Tan DX, Reiter RJ. Melatonin and sirtuins: a “not-so unexpected” relationship. J Pineal Res. (2017) 62:e12391. doi: 10.1111/jpi.12391
90. Su SC, Hsieh MJ, Yang WE, Chung WH, Reiter RJ, Yang SF. Cancer metastasis: mechanisms of inhibition by melatonin. J Pineal Res. (2017) 62:e12370. doi: 10.1111/jpi.12370
91. Lee FY, Sun CK, Sung PH, Chen KH, Chua S, Sheu JJ, et al. Daily melatonin protects the endothelial lineage and functional integrity against the aging process, oxidative stress, and toxic environment and restores blood flow in critical limb ischemia area in mice. J Pineal Res. (2018) 65:e12489. doi: 10.1111/jpi.12489
92. Tamura H, Kawamoto M, Sato S, Tamura I, Maekawa R, Taketani T, et al. Long-term melatonin treatment delays ovarian aging. J Pineal Res. (2017) 62:e12381. doi: 10.1111/jpi.12381
93. Cordeiro A, de Souza LL, Oliveira LS, Faustino LC, Santiago LA, Bloise FF, et al. Thyroid hormone regulation of Sirtuin 1 expression and implications to integrated responses in fasted mice. J Endocrinol. (2013) 216:181–93. doi: 10.1530/JOE-12-0420
94. Thakran S, Sharma P, Attia RR, Hori RT, Deng X, Elam MB, et al. Role of sirtuin 1 in the regulation of hepatic gene expression by thyroid hormone. J Biol Chem. (2013) 288:807–18. doi: 10.1074/jbc.M112.437970
95. Fei Y, Shimizu E, McBurney MW, Partridge NC. Sirtuin 1 is a negative regulator of parathyroid hormone stimulation of matrix metalloproteinase 13 expression in osteoblastic cells: role of sirtuin 1 in the action of PTH on osteoblasts. J Biol Chem. (2015) 290:8373–82. doi: 10.1074/jbc.M114.602763
96. Dai Y, Ngo D, Forman LW, Qin DC, Jacob J, Faller DV. Sirtuin 1 is required for antagonist-induced transcriptional repression of androgen-responsive genes by the androgen receptor. Mol Endocrinol. (2007) 21:1807–21. doi: 10.1210/me.2006-0467
97. Moore RL, Dai Y, Faller DV. Sirtuin 1 (SIRT1) and steroid hormone receptor activity in cancer. J Endocrinol. (2012) 213:37–48. doi: 10.1530/JOE-11-0217
98. Kong S, McBurney MW, Fang D. Sirtuin 1 in immune regulation and autoimmunity. Immunol Cell Biol. (2012) 90:6–13. doi: 10.1038/icb.2011.102
99. Yang H, Lee SM, Gao B, Zhang J, Fang D. Histone deacetylase sirtuin 1 deacetylates IRF1 protein and programs dendritic cells to control Th17 protein differentiation during autoimmune inflammation. J Biol Chem. (2013) 288:37256–66. doi: 10.1074/jbc.M113.527531
100. Akimova T, Xiao H, Liu Y, Bhatti TR, Jiao J, Eruslanov E, et al. Targeting sirtuin-1 alleviates experimental autoimmune colitis by induction of Foxp3+ T-regulatory cells. Mucosal Immunol. (2014) 7:1209–20. doi: 10.1038/mi.2014.10
101. Luciano JA, Kautza B, Darwiche S, Martinez S, Stratimirovic S, Waltz P, et al. Sirtuin 1 agonist minimizes injury and improves the immune response following traumatic shock. Shock. (2015) 44(Suppl. 1):149–55. doi: 10.1097/SHK.0000000000000412
102. Owczarczyk AB, Schaller MA, Reed M, Rasky AJ, Lombard DB, Lukacs NW. Sirtuin 1 regulates dendritic cell activation and autophagy during respiratory syncytial virus-induced immune responses. J Immunol. (2015) 195:1637–46. doi: 10.4049/jimmunol.1500326
103. Zhang Y, Li H, Cao Y, Zhang M, Wei S. Sirtuin 1 regulates lipid metabolism associated with optic nerve regeneration. Mol Med Rep. (2015) 12:6962–8. doi: 10.3892/mmr.2015.4286
104. Alayon AN, Ortega Avila JG, Echeverri Jimenez I. Carbohydrate metabolism and gene expression of sirtuin 1 in healthy subjects after Sacha inchi oil supplementation: a randomized trial. Food Funct. (2018) 9:1570–7. doi: 10.1039/c7fo01956d
105. Cao MM, Lu X, Liu GD, Su Y, Li YB, Zhou J. Resveratrol attenuates type 2 diabetes mellitus by mediating mitochondrial biogenesis and lipid metabolism via Sirtuin type 1. Exp Ther Med. (2018) 15:576–84. doi: 10.3892/etm.2017.5400
106. Yan P, Bai L, Lu W, Gao Y, Bi Y, Lv G. Regulation of autophagy by AMP-activated protein kinase/sirtuin 1 pathway reduces spinal cord neurons damage. Iran J Basic Med Sci. (2017) 20:1029–36. doi: 10.22038/IJBMS.2017.9272
107. Shi X, Pi L, Zhou S, Li X, Min F, Wang S, et al. Activation of Sirtuin 1 Attenuates High Glucose-Induced Neuronal Apoptosis by Deacetylating p53. Front Endocrinol. (2018) 9:274. doi: 10.3389/fendo.2018.00274
108. Knudsen BS, Vasioukhin V. Mechanisms of prostate cancer initiation and progression. Adv Cancer Res. (2010) 109:1–50. doi: 10.1016/B978-0-12-380890-5.00001-6
109. Leong SP, Aktipis A, Maley C. Cancer initiation and progression within the cancer microenvironment. Clin Exp Metastasis. (2018). doi: 10.1007/s10585-018-9921-y. [Epub ahead of print].
110. Patel LR, Camacho DF, Shiozawa Y, Pienta KJ, Taichman RS. Mechanisms of cancer cell metastasis to the bone: a multistep process. Future Oncol. (2011) 7:1285–97. doi: 10.2217/fon.11.112
111. Farnsworth RH, Achen MG, Stacker SA. The evolving role of lymphatics in cancer metastasis. Curr Opin Immunol. (2018) 53:64–73. doi: 10.1016/j.coi.2018.04.008
112. Franchino F, Ruda R, Soffietti R. Mechanisms and Therapy for Cancer Metastasis to the Brain. Front Oncol. (2018) 8:161. doi: 10.3389/fonc.2018.00161
113. Hamidi H, Ivaska J. Every step of the way: integrins in cancer progression and metastasis. Nat Rev Cancer. (2018) 18:533–48. doi: 10.1038/s41568-018-0038-z
114. Hur YM, Kaprio J, Iacono WG, Boomsma DI, McGue M, Silventoinen K, et al. Genetic influences on the difference in variability of height, weight and body mass index between Caucasian and East Asian adolescent twins. Int J Obes. (2008) 32:1455–67. doi: 10.1038/ijo.2008.144
115. Tarabay M, Elshazli R, Settin A. African vs. Caucasian and Asian difference for the association of interleukin-10 promotor polymorphisms with type 2 diabetes mellitus (a meta-analysis study). Meta Gene. (2016) 9:10–7. doi: 10.1016/j.mgene.2016.02.006
116. Chatterjee A, Rodger EJ, Eccles MR. Epigenetic drivers of tumourigenesis and cancer metastasis. Semin Cancer Biol. (2018) 51:149–59. S1044-579X(17)30053-6
117. Pavlidis ET, Pavlidis TE. Current molecular and genetic aspects of pancreatic cancer, the role of Metastasis Associated Proteins (MTA): a review. J Invest Surg. (2018) 31:54–66. doi: 10.1080/08941939.2016.1269854
118. Shimoyama Y, Suzuki K, Hamajima N, Niwa T. Sirtuin 1 gene polymorphisms are associated with body fat and blood pressure in Japanese. Transl Res. (2011) 157:339–47. doi: 10.1016/j.trsl.2011.02.004
119. Shimoyama Y, Mitsuda Y, Tsuruta Y, Suzuki K, Hamajima N, Niwa T. SIRTUIN 1 gene polymorphisms are associated with cholesterol metabolism and coronary artery calcification in Japanese hemodialysis patients. J Ren Nutr. (2012) 22:114–9. doi: 10.1053/j.jrn.2011.10.025
120. Chen Z, Zhai Y, Zhang W, Teng Y, Yao K. Single Nucleotide Polymorphisms of the Sirtuin 1 (SIRT1) gene are associated with age-related macular degeneration in chinese han individuals: a case-control pilot study. Medicine. (2015) 94:e2238. doi: 10.1097/MD.0000000000002238
121. Lv Y, Lin S, Peng F. SIRT1 gene polymorphisms and risk of lung cancer. Cancer Manag Res. (2017) 9:381–6. doi: 10.1016/j.canlet.2017.09.001
122. Han J, Hubbard BP, Lee J, Montagna C, Lee HW, Sinclair DA, et al. Analysis of 41 cancer cell lines reveals excessive allelic loss and novel mutations in the SIRT1 gene. Cell Cycle. (2013) 12:263–70. doi: 10.4161/cc.23056
123. Mei ZB, Duan CY, Li CB, Cui L, Ogino S. Prognostic role of tumor PIK3CA mutation in colorectal cancer: a systematic review and meta-analysis. Ann Oncol. (2016) 27:1836–48. doi: 10.1093/annonc/mdw264
124. Tsutsumi S, Watanabe R, Tabe Y, Fujii T, Morita H, Kigure W, et al. Extranodal metastasis predicts poor survival in advanced colorectal cancer. Hepatogastroenterology. (2012) 59:372–4. doi: 10.5754/hge10139
125. Funazo T, Nomizo T, Kim YH. Liver metastasis is associated with poor progression-free survival in patients with non-small cell lung cancer treated with nivolumab. J Thorac Oncol. (2017) 12:e140–1. doi: 10.1016/j.jtho.2017.04.027
126. Ambe PC, Godde D, Storkel S, Zirngibl H, Bonicke L. Extra nodular metastasis is a poor prognostic factor for overall survival in node-positive patients with colorectal cancer. Int J Colorectal Dis. (2018) 33:403–9. doi: 10.1007/s00384-018-2991-0
127. Mei Z, Shi L, Wang B, Yang J, Xiao Z, Du P, et al. Prognostic role of pretreatment blood neutrophil-to-lymphocyte ratio in advanced cancer survivors: a systematic review and meta-analysis of 66 cohort studies. Cancer Treat Rev. (2017) 58:1–13. doi: 10.1016/j.ctrv.2017.05.005
128. Mei Z, Liang M, Li L, Zhang Y, Wang Q, Yang W. Effects of statins on cancer mortality and progression: a systematic review and meta-analysis of 95 cohorts including 1,111,407 individuals. Int J Cancer. (2017) 140:1068–81. doi: 10.1002/ijc.30526
129. Xiao Y, Zheng L, Mei Z, Xu C, Liu C, Chu X, et al. The impact of metformin use on survival in prostate cancer: a systematic review and meta-analysis. Oncotarget. (2017) 8:100449–58. doi: 10.18632/oncotarget.22117
130. Mei ZB, Zhang ZJ, Liu CY, Liu Y, Cui A, Liang ZL, et al. Survival benefits of metformin for colorectal cancer patients with diabetes: a systematic review and meta-analysis. PLoS ONE. (2014) 9:e91818. doi: 10.1371/journal.pone.0091818
131. Rifai K, Judes G, Idrissou M, Daures M, Bignon YJ, Penault-Llorca F, et al. Dual SIRT1 expression patterns strongly suggests its bivalent role in human breast cancer. Oncotarget. (2017) 8:110922–30. doi: 10.18632/oncotarget.23006
132. Subramaniyan B, Kumar V, Mathan G. Effect of sodium salt of Butrin, a novel compound isolated from Butea monosperma flowers on suppressing the expression of SIRT1 and Aurora B kinase-mediated apoptosis in colorectal cancer cells. Biomed Pharmacother. (2017) 90:402–13. doi: 10.1016/j.biopha.2017.03.086
Keywords: SIRT1, cancer, prognosis, clinicopathological significance, meta-analysis
Citation: Sun M, Du M, Zhang W, Xiong S, Gong X, Lei P, Zha J, Zhu H, Li H, Huang D and Gu X (2019) Survival and Clinicopathological Significance of SIRT1 Expression in Cancers: A Meta-Analysis. Front. Endocrinol. 10:121. doi: 10.3389/fendo.2019.00121
Received: 10 December 2018; Accepted: 11 February 2019;
Published: 13 March 2019.
Edited by:
Yang Yang, Northwest University, ChinaReviewed by:
Fan Peng, Fourth Military Medical University, ChinaZu-Bing Mei, Shuguang Hospital, Shanghai University of Traditional Chinese Medicine, China
Copyright © 2019 Sun, Du, Zhang, Xiong, Gong, Lei, Zha, Zhu, Li, Huang and Gu. This is an open-access article distributed under the terms of the Creative Commons Attribution License (CC BY). The use, distribution or reproduction in other forums is permitted, provided the original author(s) and the copyright owner(s) are credited and that the original publication in this journal is cited, in accordance with accepted academic practice. No use, distribution or reproduction is permitted which does not comply with these terms.
*Correspondence: Dong Huang, aGRfODE0QHNvaHUuY29t
Xinsheng Gu, Z3UueGluc2hlbmdAZ21haWwuY29t
†These authors have contributed equally to this work