 Zhimin Ma1†
 Yunfeng Wang1,2†Chaonan Xu1,3Feiling Ai1,3Ling Huang4Jieping Wang4Ji Peng2
 Yanming Zhou1,3
 Meihua Yin1,3Shan Zhang1,3
 Xinghua Yang1,3*
- 1School of Public Health, Capital Medical University, Beijing, China
- 2Shenzhen Center for Chronic Disease Control, Shenzhen, China
- 3Beijing Municipal Key Laboratory of Clinical Epidemiology, Beijing, China
- 4Fu Xing Hospital, Capital Medical University, Beijing, China
Objective: Obesity/metabolic syndrome and hyperuricemia are clinically associated; however, the association of obesity/metabolic syndrome-related genetic variants with hyperuricemia is not clear. Therefore, we assessed this association in Chinese men diagnosed with hyperuricemia in comparison to a non-hyperuricemia group.
Methods: We genotyped 47 single nucleotide polymorphisms (SNPs) previously identified to be associated with obesity or metabolic syndrome in 474 adult males (aged ≥ 18 years) using multiplex polymerase chain reaction. Multivariate logistic regression was used to investigate the association between the genetic variations and hyperuricemia. Stratified analyses were applied to further assess the associations.
Results: The obesity-related SNP in MSRA rs545854 significantly affected serum uric acid levels. In addition, the G-allele of rs545854 was positively associated with the risk of hyperuricemia [odds ratio (OR) = 2.80, 95% confidence interval (CI) = 1.19–6.64, P = 0.0188]. After adjusting the model for body mass index and central obesity, rs545854 was shown to be an independent factor increasing the risk of hyperuricemia (OR = 2.81, 95%CI = 1.18–6.70, P = 0.0196). Stratified analyses also showed a significant association between rs545854 and hyperuricemia among meat eaters (OR = 2.62, 95%CI = 1.09–6.26, P = 0.0308).
Conclusion: The obesity-related SNP rs545854 was correlated with the serum uric acid level and risk of hyperuricemia in a male Chinese population. Therefore, men carrying this SNP could benefit from limiting their meat consumption to prevent hyperuricemia. These findings suggest an underlying genetic link between obesity and hyperuricemia worthy of further exploration.
Introduction
Serum uric acid (SUA) is a final product of the metabolic breakdown of purine oxidation (1). Since humans lack the gene for uricase that converts uric acid into a soluble form, the human uric acid level tends to be higher than that of other mammals that produce uricase (2). Indeed, an elevated SUA level was identified as the cause of gout in the early 1800s (3), and has since been associated with a wide range of health outcomes, including renal disorders, cardiovascular diseases, metabolic syndrome (MS), diabetes, and cancer (4–6). In addition, the high prevalence of hyperuricemia represents a great public health concern. The prevalence of hyperuricemia was reported at 21.0% in the total population, including 21.2% for men and 21.6% for women, in the USA (7). Moreover, the prevalence of hyperuricemia in Chinese men and women was recently reported at 19.4 and 7.9%, respectively (8).
The varying levels of uric acid in human populations can be attributed to environmental factors such as diet, including dietary deficiency of uricase, and genetic factors (9). In addition, hyperuricemia is commonly observed in patients with obesity and MS (10). Although the increase in serum SUA has generally been considered to be secondary to these conditions (11, 12), recent studies suggest that it may play a more direct and contributory role (13). These conflicting findings indicate that potential associations between hyperuricemia and obesity or MS are related to a shared genetic background.
With the advent of new molecular analysis tools, genetic information is now widely used to assess causality in the pathogenesis of complex disorders (14). Genetic variants are inherited independent of potential confounding factors, since alleles are allocated randomly during gamete formation (15). In addition, numerous single nucleotide polymorphisms (SNPs) have been reported to be associated with overweight/obesity, hypertension, and other MS components in Asian populations as in Caucasian and Hispanic-American Populations (16–18). However, few studies have explored whether these SNPs are associated with hyperuricemia in Chinese populations. Accordingly, the aim of this study was to investigate the genetic link between MS components and hyperuricemia in Chinese men. Moreover, we further investigated the influence of key clinical and demographic characteristics on mediating the association between these SNPs and hyperuricemia. These findings should shed light on the underlying biological mechanisms mediating obesity/MS and hyperuricemia.
Methods
Study Population
A cross-sectional study was conducted at the Physical Examination Center of Fu Xing Hospital between April and May 2013. The records of a total of 474 male adults (aged 18 years or older) who underwent an annual health examination at this center were reviewed for inclusion in the study. Among these patients, 66 individuals were diagnosed with hyperuricemia based on the definition of an SUA level > 7.0 mg/dL in men (4). As non-hyperuricemia group, a total of 408 men without hyperuricemia were included based on the following criteria: no history of hyperuricemia, gout, MS, kidney disease, or cardiovascular disease. As for the study participants, we excluded female participants since metabolic or additional hormonal effects can influence the SUA levels as well as the risk of hyperuricemia in women (19). In addition, individuals with type 2 diabetes or those that had taken any agents that lower SUA levels in the last 6 months were excluded from the study.
The study protocol was approved by the ethics committee of Fu Xing Hospital (Beijing, China), and written informed consent was provided by each participant.
Anthropometric and Demographic Characteristics
Detailed information regarding demographic characteristics, dietary habits, lifestyle factors, and health conditions was obtained through a structured questionnaire conducted during face-to-face interviews. For example, salt intake was categorized into three classes: low-salt diet, normal-salt diet, and high salt diet. In addition, exercise was categorized into two classes: < 1 h/week and >1 h/week.
Anthropometric and biochemical characteristics of the subjects were collected by well-trained staff. Height, weight, and waist circumference (WC) were measured for each participant while dressed in their regular indoor clothes without shoes. Body mass index (BMI) was calculated as the weight in kilograms divided by height in meters squared, and was used to classify subjects into the following categories according to the accepted Chinese BMI standard: underweight (BMI < 18.5 kg/m2), normal weight (18.5 ≤ BMI < 24.0 kg/m2), overweight (24.0 ≤ BMI < 28.0 kg/m2), and obese (BMI ≥ 28.0 kg/m2) (20, 21). Central obesity was defined as a WC ≥ 90 cm in Chinese men (22).
Laboratory Examination and Clinical Assessment
SUA, creatinine, blood glucose, triglycerides, total cholesterol (TC), low-density lipoprotein cholesterol (LDL-C), and high-density lipoprotein cholesterol (HDL-C) levels were measured at the hospital's central certified biochemical laboratory. High blood glucose was identified as a fasting blood glucose level ≥ 7.0 mmol/L. Hypertension was defined according to self-reported history and/or systolic pressure ≥ 140 mmHg or diastolic pressure ≥ 90 mmHg. Low HDL-C was identified as a fasting HDL-C level ≤ 0.9 mmol/L, and high LDL-C was defined as a fasting LDL-C level ≥ 4.1 mmol/L. Hypertriglyceridemia was regarded as fasting triglycerides ≥ 2.3 mmol/L. Hypercholesterolemia was defined as a fasting TC level ≥ 6.2 mmol/L. Non-alcoholic fatty liver disease (NAFLD) was diagnosed on the basis of established guidelines from the American Association for the Study of Liver Diseases (23).
Genotyping
We searched the literature and SNP databases to identify candidate SNPs associated with obesity or MS for assessment. A total of 47 SNPs reportedly associated with overweight/obesity, hypertension, and MS in Asian populations were genotyped (16, 17, 24). Genomic DNA was extracted from peripheral leukocytes using phenol chloroform. The primers and probes for SNP amplification were designed using Sequenom Assay Design 3.1 software (Sequenom, Inc., San Diego, CA, USA). SNP genotyping was conducted using the Mass Array system (Sequenom, Inc.) based on high-throughput multiplex polymerase chain reaction (PCR) amplification of target fragments in a 384-well PCR plate. The PCR products were subjected to uric acidification and primer single-base extension reaction. Alleles were then detected by matrix-assisted laser desorption time-of-flight mass spectrometry (Sequenom, Inc.), and mass spectra analysis was conducted with Mass Array Typer 4.0 software (Sequenom, Inc.).
Statistical Analysis
All statistical analyses were conducted using SAS software version 9.4 (SAS Institute Inc). Genotype data were examined for Hardy-Weinberg equilibrium using a chi-square test. Continuous and categorical variables are presented as mean ± standard deviation and numbers with percent frequency, respectively. Differences between the hyperuricemia and non-hyperuricemia groups were assessed by Student's t-test for normally distributed variables and with the chi-square test (or Fisher's exact test) for categorical variables. Differences in SUA levels among genotypes were evaluated by one-way analysis of variance. The inclusion criteria of candidate SNPs included conformance to Hardy-Weinberg equilibrium (P > 0.1), significant difference between hyperuricemia case and non-hyperuricemia groups (P < 0.1), and a difference in SUA levels across the genotype distribution (P < 0.1). Associations of risk alleles with hyperuricemia were assessed using multivariate logistic regression analysis. Independent associations were further evaluated after adjusting the model for BMI category and central obesity. Two-sided P < 0.05 were considered statistically significant. In addition, a series of stratified analyses were conducted to separately evaluate the correlation of SNP with SUA in Chinese men according to various demographic and anthropometric characteristics. Finally, the power of this study was estimated using Quanto software 1.2.4 (University of Southern California, USA).
Results
Baseline Characteristics
The demographic and biochemical characteristics of the male participants are summarized in Table 1. There was no difference in the average age between the hyperuricemia and non-hyperuricemia groups. However, significantly more of the men with hyperuricemia also showed hypertriglyceridemia and reported eating meat. Compared with the non-hyperuricemia group, men with hyperuricemia had a higher frequency of a BMI outside the healthy range, central obesity, hypertension, and NAFLD.
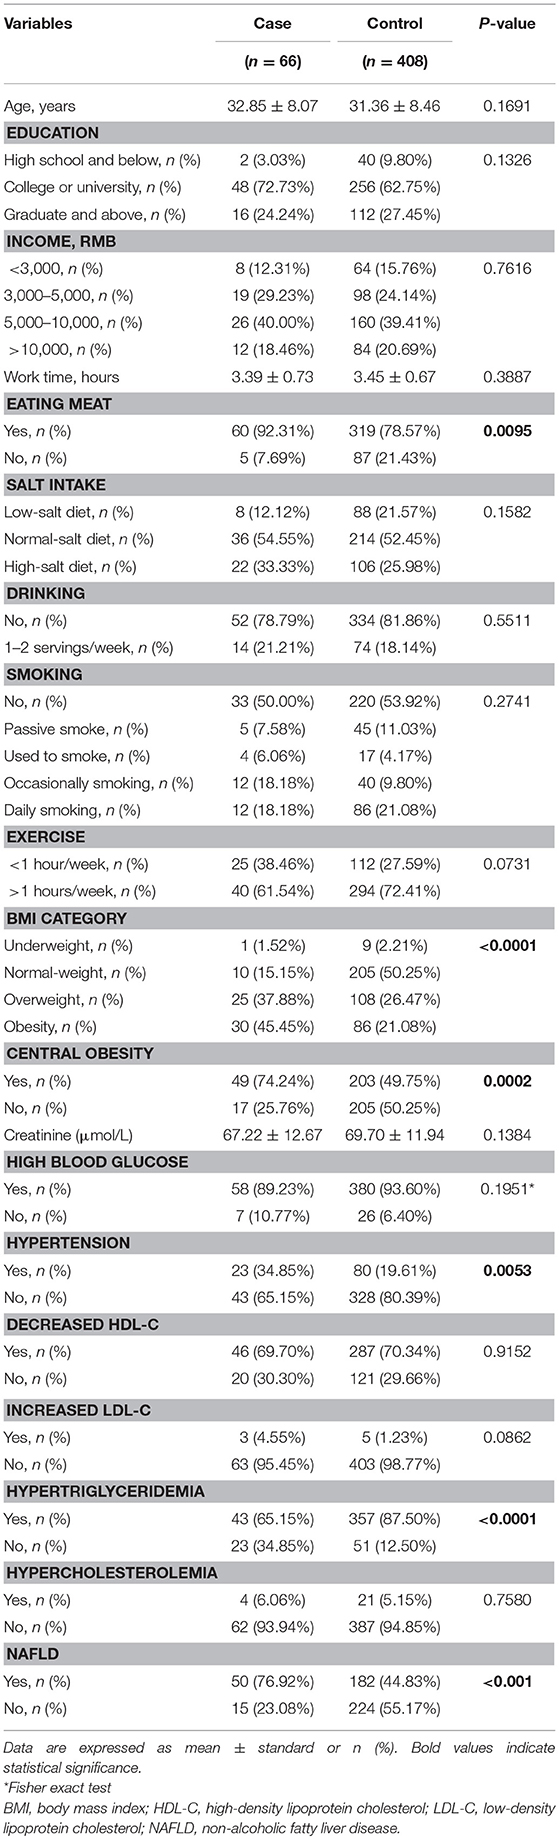
Table 1. Demographic and biochemical characteristics of study participants.
Genotypic Frequencies of SNPs in Hyperuricemia and Non-hyperuricemia Groups
The 47 candidate SNPs were genotyped in all subjects. The frequencies of six SNPs showed notable heterogeneity (P < 0.1) between the hyperuricemia and non-hyperuricemia groups (Table 2): rs1294421, rs12970134, rs545854, rs713586, rs7359397, and rs987237, which genotyped within or near the genes lymphocyte antigen 86 (LY86), melanocortin 4 receptor (MC4R), methionine sulfoxide reductase (MSRA), adenylate cyclase 3 (ADCY3), SH2B adaptor protein 1 (SH2B1), and transcription factor AP-2 beta (TFAP2B), respectively. Of these six SNPs, the genetic variance of rs545854 and rs713586 was associated with SUA levels (P < 0.1). Since only rs545854 did not deviate significantly from Hardy-Weinberg equilibrium (P > 0.1), we further focused on the MSRA SNP rs545854 as a candidate for mediating the association between hyperuricemia and obesity/MS. The distributions of the remaining 41 SNPs in the hyperuricemia and non-hyperuricemia groups are presented in Table S1.
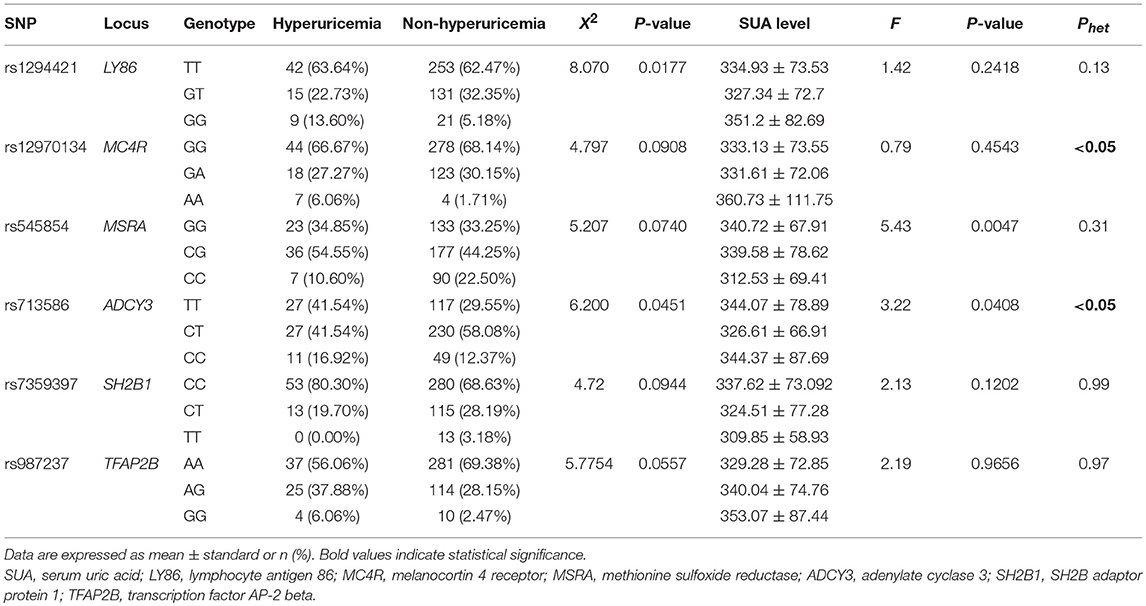
Table 2. Association of six SNPs with SUA.
Association of MSRA rs545854 With Hyperuricemia
Since the frequencies of eating meat, hypertriglyceridemia, abnormal BMI, central obesity, hypertension, and NAFLD were unevenly distributed between the hyperuricemia and non-hyperuricemia groups, we included these variables as covariates in the model to exclude their potential confounding effects on the association of the SNP with hyperuricemia. According to the genetic frequencies of rs545854 in the hyperuricemia and non-hyperuricemia groups (Table 2), a dominant inheritance model was conducted. As shown in Table 3, the G allele of rs545854 was associated with an increased risk of hyperuricemia (P = 0.0188) after adjusting for eating meat, hypertension, high triglycerides, and NAFLD. Further adjustment for BMI category and central obesity did not diminish the association of the rs545854 G allele with hyperuricemia in Chinese men.
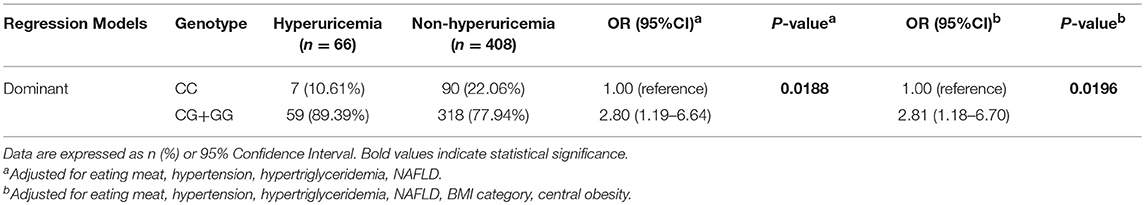
Table 3. The association of genotype with hyperuricemia in dominant model.
Stratified Analyses
Figure 1 illustrates the association between MSRA rs545854 with hyperuricemia according to subgroups of men based on meat eating, hypertension, hypertriglyceridemia, and NAFLD. The association between MSRA rs545854 and hyperuricemia remained significant in the meat-eating group [odds ratio (OR) = 2.62, 95% confidence interval (CI) = 1.09–6.26, P = 0.0308], whereas the association was not observed in the other subgroups.
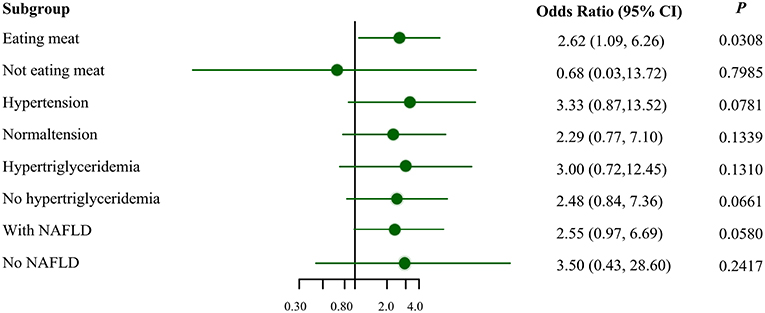
Figure 1. Subgroup analysis for the association of MSRA rs545854 with hyperuricemia. NAFLD, non-alcoholic fatty liver disease. All analyses were adjusted for eating meat, hypertension, hypertriglyceridemia, NAFLD, BMI category, central obesity, with the exception of subgroup variables.
Power Analysis
The 1,000 Genomes Project data indicate that the minor frequency of rs545854 is 0.354 in the Han Chinese population of Beijing. In addition, a recent meta-analysis reported that the prevalence of hyperuricemia in Chinese men was 19.4% (8). Considering this information, the sample size of this study had 99.99% power to detect significant effects with the OR of 2.81 obtained in this study (two-tailed test with α = 0.05).
Discussion
Among the 47 SNPs reported to be related to MS components, we identified that rs545854 in the MSRA gene independently affects the SUA level and increases the risk of hyperuricemia in Chinese men. This effect remained pronounced in a subgroup analysis among only meat eaters.
Although numerous longitudinal studies have indicated an association of hyperuricemia with multiple diseases, including obesity and MS, the potential genetic evidence of this relationship has thus far remained unclear. To our best knowledge, this is the first study to assess the correlation of obesity susceptibility loci with the level of SUA and the risk of hyperuricemia in Chinese men. Our results suggest that this association could be related to a shared genetic background, which can help further elucidate the underlying mechanism and related biological pathways. Since this design failed to fulfill one of the conditions of Mendelian randomization analysis, i.e., an obesity-related SNP should not influence the hyperuricemia risk via pathways other than those related to obesity (25, 26), we only analyzed the association of obesity genetic variations with hyperuricemia risk, rather than determining the causal relationship between them.
The SNP rs545854, originally named rs7826222, is located ~50,000 bp upstream of the MSRA gene (27, 28), which encodes a protein that protects against oxidative stress by repairing methionine (29). Rs545854 was previously reported to be associated with body fat distribution traits, indicating that carriers of the MSRA rs545854 risk allele (G-allele) tended to have a considerably lower leg fat percentage with a trend toward a higher trunk fat percentage, trunk-periphery fat ratio, and visceral fat area percentage adjusted for total fat (30). In addition, large-scale genome-wide association studies confirmed that the G-allele of MSRA rs545854 was associated with greater WC and BMI (31–33). Moreover, index variants near or at MSRA were found to contribute to obesity in the Han Chinese population (28). Thus, we further extend the risk of the G-allele of the MSRA rs545854 polymorphism for increasing SUA and contributing to hyperuricemia. Recent studies indicated associations of central obesity-associated variants in MSRA with metabolic traits, lower fasting levels of serum insulin, and decreased homeostatic model assessment-insulin resistance among men (34, 35). Hyperinsulinemia, a consequence of overweight and obesity, was shown to enhance the renal proximal tubular reabsorption of SUA, leading to elevation of SUA levels (36), which could explain the mechanisms underlying the associations between MSRA rs545854 and hyperuricemia. Consequently, the present results may be in line with a previous bidirectional Mendelian randomization study suggesting that elevated SUA is a consequence rather than a cause of adiposity in adult Caucasians (26).
There is further evidence that may shed some light on the association between obesity and hyperuricemia. First, obese individuals tend to have elevated levels of SUA due to higher urinary excretion and reduced SUA clearance in comparison with individuals of normal weight (37, 38). Second, weight loss in obese subjects was reported to be accompanied by a decrease in both SUA levels and xanthine oxidoreductase (XOR) activity (39, 40); XOR is responsible for the breakdown of hypoxanthine and xanthine into SUA. Third, animal experiments suggested that the underlying mechanisms of elevated SUA in obese adipose tissue may result from dysregulation of adipocytokines and chronic low-grade inflammation (41–43).
Results of the stratified analysis indicated a statistically significant association between MSRA rs545854 with hyperuricemia in meat eaters. Both genetic and dietary factors have been shown to influence the SUA level (44–48). Moreover, a large cohort study recently confirmed that low intake of red meat could reduce SUA levels during 26 years of follow-up (49). These findings suggest that males harboring the MSRA rs545854 SNP should limit their meat intake to prevent hyperuricemia.
The main strength of this study is that it is the first assessment of the correlation of obesity susceptibility loci with both SUA level and risk of hyperuricemia in Chinese men, indicating a significant association for MSRA rs545854. Thus, these findings shed light on the underlying biological mechanisms mediating obesity and hyperuricemia. However, there are some limitations of our study. First, there could be recall bias while filling out the questionnaire in this study. Second, we only focused on the association between MS-or obesity-associated SNPs and hyperuricemia in Chinese men, since metabolic or additional hormonal effects could impact the SUA levels and hyperuricemia in women. But further studies should investigate the association in women. Third, we did not use Mendelian randomization to validate this association between SNPs and hyperuricemia, and a significant association could be affected by other potential confounding factors. Indeed, a significant association was only observed in the meat-eating group, whereas no association was found in a series of stratified analyses based on hypertension, hypertriglyceridemia, and NAFLD. Hence, these stratified analyses indicated that there are potentially other confounding factors influencing the association, including hypertension, hypertriglyceridemia, and NAFLD as well as some other groups of foods that may be more likely to cause hyperuricemia (e.g., seafood). Hence, further study needs to consider the effect of some other groups of food on hyperuricemia. Fourth, this association should be confirmed in other ethnic groups to understand the genetic diversity and common features contributing to these associations. Gaining a greater understanding of these mechanisms can help guide improved prevention strategies to reduce the incidence of hyperuricemia tailored to specific populations and genetic backgrounds.
Conclusion
This study suggested that an obesity-related genetic variant (MSRA rs545854) was associated with SUA level and the risk of hyperuricemia in Chinese men. MSRA rs545854 was associated with the risk of hyperuricemia independent of BMI and central obesity. Additionally, our results suggest that male carriers of MSRA rs545854 might be able to limit their meat intake to prevent hyperuricemia.
Ethics Statement
The study protocol was approved by the ethics committee of Fu Xing Hospital (Beijing, China), and written informed consent was provided by each participant.
Author Contributions
ZM performed the stratified analysis, interpreted the results, and drafted the manuscript. YW contributed to the study idea and data analysis. CX and JP assisted in interpreting the findings and revising the manuscript. LH and JW recruited study participants and performed the clinical diagnoses. FA, YZ, MY, and SZ were responsible for data collection and the Hardy-Weinberg equilibrium test. XY contributed to the study concept and design as well as revision of the manuscript. All authors read and approved the final manuscript.
Funding
This study was supported by Beijing Municipal Education Commission (KM201310025010).
Conflict of Interest Statement
The authors declare that the research was conducted in the absence of any commercial or financial relationships that could be construed as a potential conflict of interest.
Acknowledgments
We are grateful for the assistance of the staff of Physical Examination Center of Fu Xing hospital. Additionally, we also thank all study participants for their cooperation.
Supplementary Material
The Supplementary Material for this article can be found online at: https://www.frontiersin.org/articles/10.3389/fendo.2019.00230/full#supplementary-material
Abbreviations
SUA, serum uric acid; SNPs, single nucleotide polymorphisms; BMI, body mass index; MS, metabolic syndrome; WC, waist circumference; TC, total cholesterol; LDL-C, low-density lipoprotein cholesterol; HDL-C, high-density lipoprotein cholesterol; SNP, single-nucleotide polymorphisms; MALDI-TOF-MS, matrix-assisted laser desorption ionization time-of-flight mass spectrometry; LY86, lymphocyte antigen 86; MC4R, melanocortin 4 receptor; MSRA, methionine sulfoxide reductase; ADCY3, adenylate cyclase 3; SH2B1, SH2B adaptor protein 1; TFAP2B, transcription factor AP-2 beta; XOR, xanthine oxido reductase; NAFLD, nonalcoholic fatty liver disease.
References
1. Wang W, Zhang D, Xu C, Wu Y, Duan H, Li S, et al. Heritability and genome-wide association analyses of serum uric acid in middle and old-aged chinese twins. Front Endocrinol. (2018) 9:75. doi: 10.3389/fendo.2018.00075
2. Wu X, Muzny DM, Cheng CL, Caskey CT. Two independent mutational events in the loss of urate oxidase during hominoid evolution. J Mol Evol. (1992) 34:78–84. doi: 10.1007/BF00163854
3. Garrod AB. Observations on certain pathological conditions of the blood and urine, in gout, rheumatism, and bright's disease. Med Chir Trans. 31:83–97. doi: 10.1177/095952874803100109
4. Li WD, Jiao H, Wang K, Zhang CK, Glessner JT, Grant SF, et al. A genome wide association study of plasma uric acid levels in obese cases and never-overweight controls. Obesity. (2013) 21:E490–4. doi: 10.1002/oby.20303
5. Pacifico L, Cantisani V, Anania C, Bonaiuto E, Martino F, Pascone R, et al. Serum uric acid and its association with metabolic syndrome and carotid atherosclerosis in obese children. Eur J Endocrinol. (2009) 160:45–52. doi: 10.1530/eje-08-0618
6. Fu S, Yao Y, Zhao Y, Luan F. Relationships of hyperhomocysteinemia and hyperuricemia with metabolic syndrome and renal function in Chinese centenarians. Front Endocrinol. (2018) 9:502. doi: 10.3389/fendo.2018.00502
7. Krishnan E, Akhras KS, Sharma H, Marynchenko M, Wu EQ, Tawk R, et al. Relative and attributable diabetes risk associated with hyperuricemia in US veterans with gout. QJM. (2013) 106:721–9. doi: 10.1093/qjmed/hct093
8. Rui L, Cheng H, Di W, Xia X, Gu J, Guan H, et al. Prevalence of hyperuricemia and gout in mainland china from 2000 to 2014: a systematic review and meta-analysis. Biomed Res Int. (2015) 2015:762820. doi: 10.1155/2015/762820
9. Meng J, Tan W, Zhu Y, Wang F, Li X, Zhang M. A coronary artery disease-associated SNP rs6903956 contributed to asymptomatic hyperuricemia susceptibility in Han Chinese. Lipids Health Dis. (2015) 14:33. doi: 10.1186/s12944-015-0026-1
10. Matsuura F, Yamashita S, Nakamura T, Nishida M, Nozaki S, Funahashi T, et al. Effect of visceral fat accumulation on uric acid metabolism in male obese subjects: visceral fat obesity is linked more closely to overproduction of uric acid than subcutaneous fat obesity. Metab Clin Exp. (1998) 47:929–33. doi: 10.1016/S0026-0495(98)90346-8
11. Vaccarino V, Krumholz HM. Risk factors for cardiovascular disease: one down, many more to evaluate. Ann Int Med. (1999) 131:62–3. doi: 10.7326/0003-4819-131-1-199907060-00012
12. Wannamethee SG, Shaper AG, Whincup H. P. Serum urate and the risk of major coronary heart disease events. Heart. (1997) 78:147–53. doi: 10.1136/hrt.78.2.147
13. Kivity S, Kopel E, Maor E, Abu-Bachar F, Segev S, Sidi Y, et al. Association of serum uric acid and cardiovascular disease in healthy adults. Am J Cardiol. (2013) 111:1146–51. doi: 10.1016/j.amjcard.2012.12.034
14. Sedaghat S, Pazoki R, Uitterlinden AG, Hofman A, Stricker BH, Ikram MA, et al. Association of uric acid genetic risk score with blood pressure: the Rotterdam study. Hypertension. (2014) 64:1061–6. doi: 10.1161/HYPERTENSIONAHA.114.03757
15. Verduijn M, Siegerink B, Jager KJ, Zoccali C, Dekker FW. Mendelian randomization: use of genetics to enable causal inference in observational studies. Nephrol Dial Transplant. (2010) 25:1394–8. doi: 10.1093/ndt/gfq098
16. Hotta K, Kitamoto A, Kitamoto T, Mizusawa S, Teranishi H, So R, et al. Replication study of 15 recently published Loci for body fat distribution in the Japanese population. J Atheroscl Thromb. (2013) 20:336. doi: 10.5551/jat.14589
17. Fall T, Ingelsson E. Genome-wide association studies of obesity and metabolic syndrome. Mol Cell Endocrinol. (2014) 382:740–57. doi: 10.1016/j.mce.2012.08.018
18. Pullinger CR, Goldfine ID, Tanyolac S, Movsesyan I, Faynboym M, Durlach V, et al. Evidence that an HMGA1 gene variant associates with type 2 diabetes, body mass index, and high-density lipoprotein cholesterol in a Hispanic-American population. Metabolic syndrome and related disorders. (2014) 12:25–30. doi: 10.1089/met.2013.0086
19. Cheng ST, Wu S, Su CW, Teng MS, Hsu LA, Ko YL. Association of ABCG2 rs2231142-A allele and serum uric acid levels in male and obese individuals in a Han Taiwanese population. J Form Med Assoc. (2017) 116:18–23. doi: 10.1016/j.jfma.2015.12.002
20. Wang YF, Tang Z, Guo J, Tao LX, Liu L, Li HB, et al. BMI and BMI changes to all-cause mortality among the elderly in beijing: a 20-year cohort study. Biomed Environ Sci BES. (2017) 30:79–87. doi: 10.3967/bes2017.011
21. Cho SK, Kim S, Chung JY, Jee SH. Discovery of URAT1 SNPs and association between serum uric acid levels and URAT1. BMJ Open. (2015) 5:e009360. doi: 10.1136/bmjopen-2015-009360
22. Burton WN, Chen CY, Schultz AB, Edington DW. The prevalence of metabolic syndrome in an employed population and the impact on health and productivity. J Occup Environ Med. (2008) 50:1139–48. doi: 10.1097/JOM.0b013e318188b8eb
23. Naga C, Zobair Y, E LJ, Michael C, Kenneth C, Mary R, et al. The diagnosis and management of nonalcoholic fatty liver disease: practice guidance from the american association for the study of liver diseases. Hepatology. (2018) 67:328–57. doi: 10.1002/hep.29367
24. Wen W, Cai Q, Xiang YB, Xu WH, Ruan ZX, Cheng J, et al. The modifying effect of C-reactive protein gene polymorphisms on the association between central obesity and endometrial cancer risk. Cancer. (2008) 112:2409–16. doi: 10.1002/cncr.23453
25. Dai X, Yuan J, Yao P, Yang B, Gui L, Zhang X, et al. Association between serum uric acid and the metabolic syndrome among a middle- and old-age Chinese population. Eur J Epidemiol. (2013) 28:669–76. doi: 10.1007/s10654-013-9829-4
26. Lyngdoh T, Vuistiner P, Marques-Vidal P, Rousson V, Waeber G, Vollenweider P, et al. Serum uric acid and adiposity: deciphering causality using a bidirectional Mendelian randomization approach. PLoS ONE. (2012) 7:e39321. doi: 10.1371/journal.pone.0039321
27. den Hoed M, Ekelund U, Brage S, Grontved A, Zhao JH, Sharp SJ, et al. Genetic susceptibility to obesity and related traits in childhood and adolescence: influence of loci identified by genome-wide association studies. Diabetes. (2010) 59:2980–8. doi: 10.2337/db10-0370
28. Dorajoo R, Blakemore AI, Sim X, Ong RT, Ng DP, Seielstad M, et al. Replication of 13 obesity loci among Singaporean Chinese, Malay and Asian-Indian populations. Int J Obesity. (2012) 36:159–63. doi: 10.1038/ijo.2011.86
29. Cabreiro F, Picot CR, Friguet B, Petropoulos I. Methionine sulfoxide reductases: relevance to aging and protection against oxidative stress. Ann N Y Acad Sci. (2006) 1067:37–44. doi: 10.1196/annals.1354.006
30. Lim U, Ernst T, Wilkens LR, Albright CL, Lum-Jones A, Seifried A, et al. Susceptibility variants for waist size in relation to abdominal, visceral, and hepatic adiposity in postmenopausal women. J Acad Nutr Dietetics. (2012) 112:1048–55. doi: 10.1016/j.jand.2012.03.034
31. Lim U, Wilkens LR, Monroe KR, Caberto C, Tiirikainen M, Cheng I, et al. Susceptibility variants for obesity and colorectal cancer risk: the multiethnic cohort and PAGE studies. Int J Cancer. (2012) 131:E1038–43. doi: 10.1002/ijc.27592
32. Albuquerque D, Nobrega C, Rodriguez-Lopez R, Manco L. Association study of common polymorphisms in MSRA, TFAP2B, MC4R, NRXN3, PPARGC1A, TMEM18, SEC16B, HOXB5, and OLFM4 genes with obesity-related traits among Portuguese children. J Hum Genet. (2014) 59:307–13. doi: 10.1038/jhg.2014.23
33. Lindgren CM, Heid IM, Randall JC, Lamina C, Steinthorsdottir V, Qi L, et al. Genome-wide association scan meta-analysis identifies three Loci influencing adiposity and fat distribution. PLoS Genet. (2009) 5:e1000508. doi: 10.1371/journal.pgen.1000508
34. Yeung E, Qi L, Hu FB, Zhang C. Novel abdominal adiposity genes and the risk of type 2 diabetes: findings from two prospective cohorts. Int J Mol Epidemiol Genet. (2011) 2:138–44. doi: 10.1038/sj.bjc.6602868
35. Bille DS, Banasik K, Justesen JM, Sandholt CH, Sandbaek A, Lauritzen T, et al. Implications of central obesity-related variants in LYPLAL1, NRXN3, MSRA, and TFAP2B on quantitative metabolic traits in adult Danes. PLoS ONE. (2011) 6:e20640. doi: 10.1371/journal.pone.0020640
36. Facchini F, Chen YD, Hollenbeck CB, Reaven GM. Relationship between resistance to insulin-mediated glucose uptake, urinary uric acid clearance, and plasma uric acid concentration. JAMA. (1991) 266:3008–11. doi: 10.1001/jama.1991.03470210076036
37. Baldwin W, McRae S, Marek G, Wymer D, Pannu V, Baylis C, et al. Hyperuricemia as a mediator of the proinflammatory endocrine imbalance in the adipose tissue in a murine model of the metabolic syndrome. Diabetes. (2011) 60:1258–69. doi: 10.2337/db10-0916
38. Tsushima Y, Nishizawa H, Tochino Y, Nakatsuji H, Sekimoto R, Nagao H, et al. Uric acid secretion from adipose tissue and its increase in obesity. J Biol Chem. (2013) 288:27138–49. doi: 10.1074/jbc.M113.485094
39. Richette P, Poitou C, Manivet P, Denis J, Bouillot JL, Clement K, et al. Weight loss, xanthine oxidase, and serum urate levels: a prospective longitudinal study of obese patients. Arthrit Care Res. (2016) 68:1036–42. doi: 10.1002/acr.22798
40. Nielsen SM, Bartels EM, Henriksen M, Waehrens EE, Gudbergsen H, Bliddal H, et al. Weight loss for overweight and obese individuals with gout: a systematic review of longitudinal studies. Ann Rheumat Dis. (2017) 76:1870–82. doi: 10.1136/annrheumdis-2017-211472
41. Negrao MR, Monteiro R, Calhau C, Soares R, Azevedo I. Comment on: Hosogai, et al. (2007) adipose tissue hypoxia in obesity and its impact on adipocytokine dysregulation. Diabetes 56:901–911, 2007. Diabetes. (2008) 57:e15. doi: 10.2337/db08-0603
42. Martyniak K, Masternak MM. Changes in adipose tissue cellular composition during obesity and aging as a cause of metabolic dysregulation. Exp Gerontol. (2017) 94:59–63. doi: 10.1016/j.exger.2016.12.007
43. Trayhurn P. Hypoxia and adipose tissue function and dysfunction in obesity. Physiol Rev. (2013) 93:1–21. doi: 10.1152/physrev.00017.2012
44. Beydoun MA, Canas JA, Fanelli-Kuczmarski MT, Tajuddin SM, Evans MK, Zonderman AB. Genetic risk scores, sex and dietary factors interact to alter serum uric acid trajectory among African-American urban adults. Br J Nutr. (2017) 117:686–97. doi: 10.1017/s0007114517000411
45. Zykova SN, Storhaug HM, Toft I, Chadban SJ, Jenssen TG, White SL. Cross-sectional analysis of nutrition and serum uric acid in two caucasian cohorts: the ausdiab study and the tromso study. Nutr J. (2015) 14:49. doi: 10.1186/s12937-015-0032-1
46. Beydoun MA, Fanelli-Kuczmarski MT, Canas JA, Beydoun HA, Evans MK, Zonderman AB. Dietary factors are associated with serum uric acid trajectory differentially by race among urban adults. Br J Nutr. (2018) 120:935–45. doi: 10.1017/s0007114518002118
47. Zhu L, Wu Q, Deng C, Zhang M, Zhang C, Chen H, et al. Adaptive evolution to a high purine and fat diet of carnivorans revealed by gut microbiomes and host genomes. Environ Microbial. (2018) 20:1711–22. doi: 10.1111/1462-2920.14096
48. Choi HK, Atkinson K, Karlson EW, Willett W, Curhan G. Purine-rich foods, dairy and protein intake, and the risk of gout in men. New Engl J Med. (2004) 350:1093–103. doi: 10.1056/NEJMoa035700
Keywords: obesity, metabolic syndrome, single nucleotide polymorphisms, hyperuricemia, gene
Citation: Ma Z, Wang Y, Xu C, Ai F, Huang L, Wang J, Peng J, Zhou Y, Yin M, Zhang S and Yang X (2019) Obesity-Related Genetic Variants and Hyperuricemia Risk in Chinese Men. Front. Endocrinol. 10:230. doi: 10.3389/fendo.2019.00230
Received: 23 January 2019; Accepted: 22 March 2019;
Published: 12 April 2019.
Edited by:
Antonio Brunetti, Università Degli Studi Magna Græcia di Catanzaro, ItalyReviewed by:
Sinan Tanyolac, Istanbul University, TurkeyConsolato Sergi, University of Alberta Hospital, Canada
Copyright © 2019 Ma, Wang, Xu, Ai, Huang, Wang, Peng, Zhou, Yin, Zhang and Yang. This is an open-access article distributed under the terms of the Creative Commons Attribution License (CC BY). The use, distribution or reproduction in other forums is permitted, provided the original author(s) and the copyright owner(s) are credited and that the original publication in this journal is cited, in accordance with accepted academic practice. No use, distribution or reproduction is permitted which does not comply with these terms.
*Correspondence: Xinghua Yang, eGluZ2h1YXlAc2luYS5jb20=
†These authors have contributed equally to this work and are co-first authors