 Krisztina Banfai1,2
 David Ernszt2,3
 Attila Pap4
 Peter Bai5,6,7,8
 Kitti Garai1,2
 Djeda Belharazem9
 Judit E. Pongracz1,2
 Krisztian Kvell1,2*
- 1Department of Pharmaceutical Biotechnology, Faculty of Pharmacy, University of Pécs, Pécs, Hungary
- 2Szentagothai Research Center, University of Pécs, Pécs, Hungary
- 3Department of Physiology, Medical School, University of Pécs, Pécs, Hungary
- 4Department of Biochemistry and Molecular Biology, Faculty of Medicine, University of Debrecen, Debrecen, Hungary
- 5Medical Chemistry, Faculty of Medicine, University of Debrecen, Debrecen, Hungary
- 6MTA-DE Cell Biology and Signaling Research Group, Debrecen, Hungary
- 7MTA-DE Lendulet Laboratory of Cellular Metabolism, Debrecen, Hungary
- 8Research Center for Molecular Medicine, University of Debrecen, Debrecen, Hungary
- 9Department of Pathology, University Hospital of Mannheim, Mannheim, Germany
With thymic senescence the epithelial network shrinks to be replaced by adipose tissue. Transcription factor TBX-1 controls thymus organogenesis, however, the same TBX-1 has also been reported to orchestrate beige adipose tissue development. Given these different roles of TBX-1, we have assessed if thymic TBX-1 expression persists and demonstrates this dualism during adulthood. We have also checked whether thymic adipose involution could yield beige adipose tissue. We have used adult mouse and human thymus tissue from various ages to evaluate the kinetics of TBX-1 expression, as well as mouse (TEP1) and human (1889c) thymic epithelial cells (TECs) for our studies. Electron micrographs show multi-locular lipid deposits typical of beige adipose cells. Histology staining shows the accumulation of neutral lipid deposits. qPCR measurements show persistent and/or elevating levels of beige-specific and beige-indicative markers (TBX-1, EAR-2, UCP-1, PPAR-gamma). We have performed miRNome profiling using qPCR-based QuantStudio platform and amplification-free NanoString platform. We have observed characteristic alterations, including increased miR21 level (promoting adipose tissue development) and decreased miR34a level (bias toward beige adipose tissue differentiation). Finally, using the Seahorse metabolic platform we have recorded a metabolic profile (OCR/ECAR ratio) indicative of beige adipose tissue. In summary, our results support that thymic adipose tissue emerging with senescence is bona fide beige adipose tissue. Our data show how the borders blur between a key immune tissue (the thymus) and a key metabolic tissue (beige adipose tissue) with senescence. Our work contributes to the understanding of cross talk between the immune system and metabolism.
Introduction
In human the degenerative process of thymic adipose involution is already detectable in childhood and accelerates with puberty due to hormonal (sex-steroid) induction (1–3). The process shows identical kinetics in mouse. Also, we have developed a model whereby TECs are treated by a steroid (using Dx or dexamethasone) thus both in vivo and in vitro model systems are readily available (4) As for all adipose tissues subtypes, thymic adipose involution is orchestrated by transcription factor PPARgamma (5–7). It is estimated that by the age of 50 years in human (approx. 12 months in mouse), the thymus loses approx. Ninety percent of its function: naïve T-cell production (8, 9). The consequences of impaired thymus function are profound: elevated incidence of infections, cancer and autoimmune disorders observed at senior ages (10, 11). This poses a significant burden on health-care and health-insurance systems, while simultaneously lowering the quality of life in the elderly.
Transcription factor TBX-1 is a key molecular player in the formation of the third pharyngeal pouch involved in thymus organogenesis during embryonic development (12). Human patients with 22q11.2DS impairing TBX-1 often have thymus hypoplasia or aplasia. In accordance, Tbx-1null mice develop severe pathologies in tissues derived from the third pharyngeal pouch, including hypoplasia of the thymus (13, 14). In these cases, impaired thymus organogenesis leads to deficient thymocyte development, naive T-cell production, and immune functions (15). However, recently it has also been reported that the role of TBX-1 in thymus organogenesis is more complex. Ectopic expression of TBX-1 may suppress transcription factor FoxN1, the mastermind of thymic epithelial identity (16). The issue was investigated in the embryonic setting, but the potential role of persistent TBX-1 expression during adulthood has not been addressed.
TBX-1 has another pivotal role in the development and function of a recently described subtype of adipose tissue: beige adipose tissue (17–20). White adipose tissue stores energy, brown adipose tissue generates heat (via NST or non-shivering thermogenesis), while beige adipocytes act as intermediates. Beige adipocytes respond to adrenergic stimuli by thermogenesis (21). TBX-1 is considered as a beige-specific marker, but other beige-indicative markers have also been described. Mitochondrial uncoupling proteins (mostly UCP-1) have been reported to be expressed by brown / beige adipose tissue. EAR2 (also known as Nr2f6) was reported to efficiently promote adipose tissue development with beige bias, while CD137 (also known as Tnfrsf9) is an acknowledged beige adipocyte surface marker (22).
The adult thymus expresses TBX-1 and UCP-1 in the stromal compartment, both known to promote beige adipose tissue development. Yet to date thymic adipose tissue that develops with age has not been accurately positioned on this white-beige-brown continuum of adipose tissue subtypes, despite recent cellular analysis from an adipocyte perspective (23–26). For this reason, we have characterized senescence-related thymic adipose tissue using molecular, cellular and histological markers, at structural and ultra-structural levels, using both mouse and human samples. Additionally, we have also performed metabolic profiling and complete miRNome analysis using both PCR-based and amplification-free platforms.
Methods
Cell Cultures
For in vitro experiments primary-derived (BALB/c) thymic epithelial cells were used (TEP1) as reported previously (cell source: Prof. G. Anderson, University of Birmingham, UK) (27). Briefly, the cells were cultured in DMEM (Dulbecco's Modified Eagle's medium Lonza) supplemented with 10% FCS, penicillin, streptomycin and β-mercapto-ethanol. Human thymus-derived 1889c thymic carcinoma cells were cultured in RPMI 1640 (Roswell Park Memorial Institute medium, Lonza) containing 10% FCS, penicillin, streptomycin, L-Glutamine and Hepes (28, 29). Adipose differentiation of TEP1 and 1889c cells was induced by steroid treatment. Briefly, experiments differentiation was induced by dexamethasone alone (Dx) as added to complete DMEM and RPMI medium. Cells were treated with Dx at a final concentration of 1 μM for 1 week.
Animal Samples
Thymus lobes were used from C57BL/6J mice at 1, 6, 8, 12, 14, 18, and 21 months of age. Mice were housed under minimal disease (MD) conditions. Animal rooms were ventilated 15 times/h with filtered air, mice received autoclaved pellet diet (Altromin VRF1) and tap water ad libitum. The cages contained sterilized bedding. Room lighting was automated with 12 h light and 12 h dark periods. Room temperature was 21 ± 2°C, relative humidity was between 30 and 60%. Mice were kept in the Laboratory Animal Core Facility of the University. Experimental procedures were carried out according to the “1988/XXVIII act of the Hungarian Parliament on Animal Protection (243/1988)” which complies with recommendations of the Helsinki Declaration. All animal experiments were performed with the consent of the Ethics Committee on Animal Research of the University (ref. no.: #BA02/2000-46/2016).
Enrichment of Primary Cells
Mouse thymic epithelial cells were isolated by MACS cell separation. Briefly, mouse thymic lobes (1 month-old or 12 month-old) were digested with type F collagenase from C. hystolyticum (3mg/ml, Sigma-Aldrich) for 2 h, with stirring in every 20 min, then washed with DMEM. Cell suspensions were then labeled with anti-EpCAM1 antibody (1:100, rat monoclonal antibody clone: G8.8) and washed with MACS-buffer (2% FCS, 1mM EDTA in PBS) followed by incubation with Dynabeads sheep anti-rat IgG-coated beads (Invitrogen) The EpCAM+-cells were separated with EasySep column-free cell isolation platform (Stemcell Technologies) according to the manufacturer's instructions. Isolated cells were used for total RNA isolation and subsequent qPCR analysis.
Human Thymus Samples
Formalin-fixed, paraffin-embedded (FFPE) human thymus samples from 18, 23, 42, 44, and 58 years of age were provided by the Department of Pathology, Faculty of Medicine, University of Pecs, Hungary. Experiments involving human samples were performed with the consent of the Regional and Local Ethics Committee of Clinical Center of the University (ref. no.: 6069/2016) according to their guidelines. All subjects gave written informed consent in accordance with the Declaration of Helsinki.
Transmission Electron Microscopy
Cells were harvested and pelleted then fixed with PBS containing 2.5% glutaraldehyde overnight at 4°C. Following fixation, pellets were mixed in 3% porcine gelatin (Sigma-Aldrich). Hardened small blocks of approximately 1 mm3 were cut. Blocks were post-fixed in 1% osmium-tetroxide in PBS for 1 h at 4°C and dehydrated with increasing concentration of ethanol. Uranyl-acetate (1%) was added in 70% ethanol to increase contrast. After complete dehydration in ascending ethanol series, blocks were transferred to propylene-oxide twice for 4 min. Then blocks were immersed in the mixture of propylene-oxide and Durcupan resin (Sigma-Aldrich) for 30 min. Later blocks were placed into Durcupan-containing tin-foil boats overnight, and embedded into gelatin capsule filled with Durcupan resin (Sigma-Aldrich). Following polymerization and hardening of the resin at 56 °C for 72 h, semi thin sections were cut with Leica Ultracut ultramicrotom, mounted on glass slides, stained with toluidine-blue and examined with Olympus BX50 light microscope. Then serial ultra-thin sections were cut by ultramicrotom, and mounted on mesh grids. Ultra-thin sections were contrasted by uranyl-acetate and lead-citrate, and examined using JEOL 1200EX-II electron microscope.
Immune-Histochemistry
Human thymus lobes were fixed in paraformaldehyde (4% PFA in PBS) then paraffin embedded. 5μm thick sections were stained with immunohistochemistry method as described earlier (30). First, slides were rinsed in heated xylene then washed with a descending series of alcohol. After deparaffinization slides were rehydrated and antigen retrieval was performed in Target Retrieval Solution (pH 6 DAKO) at 97°C for 20–30 min. Following wash in dH2O and endogenous peroxidase activity was blocked with 3% H2O2 in TBS (pH 7.4) for 15 min. Then slides were washed with TBS containing Tween (0.05%, pH 7.4). Pre-blocking was carried out with 3% BSA in TBS for 20 min followed by overnight incubation with a-TBX-1 (1:100, rabbit polyclonal antibody, Sigma-Aldrich) primary antibody at 4°C. After the incubation slides were washed with TBS then incubated with peroxidase conjugated secondary antibody (1:100, Polyclonal Goat Anti-Rabbit IgG, DAKO) for 90 min. Labeling was visualized with liquid DAB Substrate Chromogen System (DAKO). Hematoxylin served for nuclear counterstaining. Slides were mounted with Faramount Aqueous Mounting Medium (DAKO). Histological evaluation was performed with Panoramic MIDI digital slide scanner (3DHistech) and images were captured with CaseViewer. Image analysis was made with ImageJ / IHC toolbox.
Immune-Fluorescent Staining
Immune-fluorescent staining was performed on 8μm cryostat thymus sections. Cytospin technique was used to spin TEP1 and 1889c cells onto glass slides (4). Slides were fixed in cold acetone, then dried and blocked using 5% BSA in PBS for 20 min before staining with fluorochrome conjugated or primary antibodies: a-EpCAM-FITC (1:100, clone: G8.8,), a-UCP-1 (1:100, rabbit polyclonal antibody, Abcam) a-TBX-1 (1:100, rabbit polyclonal antibody, Sigma-Aldrich), a-PPAR-gamma (1:100, rabbit monoclonal antibody, Cell Signaling Technology). For secondary antibody Alexa-555 conjugated a-rabbit goat IgG (1:200, Life Technologies) was used. Fluorescent lipid staining was performed on paraformaldehyde (4%) fixed TEP1 and 1889c cytospin slides with LipidTOX Red dye (1:200, Invitrogen). For nuclear counterstain DAPI (Life Technologies) was used. Sections were imaged using a Nikon Eclipse Ti-U microscope equipped with a CCD camera (Andor Zyla 5.5) and NIS-Elements software.
Metabolic Profiling
The use of TEP1 cells for Seahorse metabolic profiling was started by pilot experiments for optimal starting cell number, duration of differentiation, differentiation medium etc. Accordingly, 15,000 cells/well were cultured for 9 days using standard MDI differentiation protocol (31). This was followed by the evaluation of their metabolic profile using the Seahorse XF 96 platform (Seahorse Bioscience). Cells were plated into Seahorse cell plates at confluence and were left to attach overnight. The next day, cells were subject to oxymetry measurement. After recording baseline oxygen consumption cells were treated with butyril-cAMP (500 μM), oligomycin (2 μM), and antimycin (10 μM). Antimycin-resistant oxygen consumption was considered as background and was subtracted from all values. Baseline oxygen consumption, membrane leak (OCR, after oligomycin treatment) was calculated. Glycolysis was assessed through the extracellular acidification value (ECAR, before oligomycin treatment) and the ECAR/OCR values were calculated. Negative values were omitted in calculations.
RNA Isolation, cDNA Preparation, qRT-PCR, TaqMan Array
Total RNA of enriched thymic epithelial cells, TEP1 and 1889c cells was isolated with the NucleoSpin RNAII kit (Macherey-Nagel). cDNA was prepared using the High Capacity cDNA Reverse Transcription kit (Applied Biosystems). For qPCR analysis the StepOnePlus (Applied Biosystems) platform was used with SensiFAST SYBR Hi-ROX Mix (Bioline) as well as PikoReal™ Real-Time PCR System (Thermo Fisher Scientific) using Luminaris Color HiGreen qPCR Master Mix (Thermo Fisher Scientific) (for primer list see Table 1). Gene expression was normalized to β-actin, GUSB and HPRT1 housekeeping genes. Reverse transcription of 1889c RNA samples for miRNA analysis was completed with Megaplex™ RT Primers specific to human Pool A (Cat. No.: 4399966) and Pool B (Cat. No.: 4444281). MiRNA profiling was performed on Applied Biosystems Quantstudio™ 12K Flex Real-Time PCR System platform using TaqMan™ Array Human MicroRNA A (Applied Biosystems, Cat. No.: 4398965) and B Card (Applied Biosystems, Cat. No.: 4444910) containing 6 housekeeping genes (RNU44, RNU48, ath-miR159a and 4 U6 snRNAs) and 377 human miRNAs. Additionally 600 ng of total RNA was mixed with TaqMan™ Fast Universal PCR Master Mix (2X), no AmpErase™ UNG (Applied Biosystems, Cat. No.: 4364103) for each array card. Gene expressions were analyzed using Expression Suite Software version 1.1.
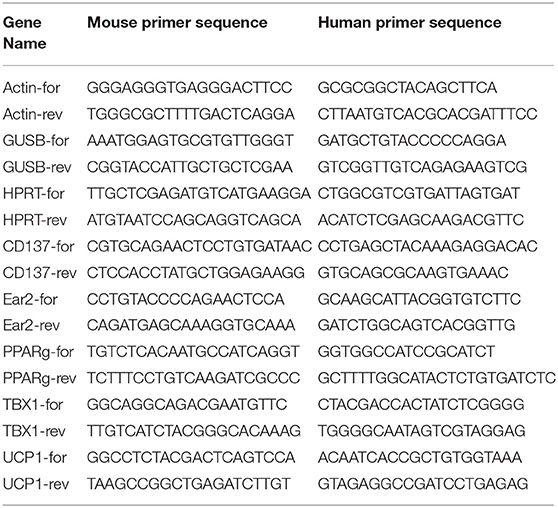
Table 1. List of mouse and human primer sequences.
NanoString System Assay
One hundred nanogram of total RNA was used to detect up to 800 miRNA targets with nCounter SPRINT Profiler (NanoString Technologies) using nCounter® Human v3 miRNA Expression Assay. Sample preparation was performed with nCounter® CodeSet (NanoString Technologies) following annealing, ligation and purification. Hybridization protocol was completed at 65°C and 12 h long according to the manufacturer's instructions. Quantified data was analyzed using nSolver™ Analysis Software version 4.0. Threshold count was determined using negative controls as background noise. Gene expression changes were visualized on heat map using GraphGad Prism version 7.04.
Statistical Analysis
All experiments were performed at least on three occasions, representative experiments are shown. Measures were obtained in triplicates, data are presented as mean and ±SD as error bars. For statistical analysis GraphPad Prism software and SPSS Statistics version 22.0 was used. To evaluate the kinetics of TBX-1 expression with age in both mouse and human samples normality distribution was tested using Shapiro-Wilk test (n < 50). In case of human samples our data met the assumption of homogeneity of variances, so parametric one-way ANOVA with Tukey's honestly significant difference (HSD) post hoc test was used. To determine the significant differences of mouse samples non-parametric Kruskal-Wallis test was used. For further cases two-tailed student's t-test was applied. Significant differences are shown by asterisks (ns for p > 0.05, *p ≤ 0.05, **p ≤ 0.01, ***p ≤ 0.001).
Results
Aging and Steroid-Induced TECS Show Beige Adipocyte Markers
Thymic senescence is accompanied by the appearance of adipose tissue. Mediastinal location and local FGF21 production are characteristic to the thymus and both were reported to promote beige adipose tissue development (23–25). For this reason we searched for the up-regulation of beige adipocyte markers in the adult thymus tissue and its model system: steroid-induced TECs.
Aging Up-Regulates key Beige Adipocyte Marker in Human Thymus Tissue
Using a pilot set of human thymic FFPE samples of various adult ages (18, 23, 42, 44, and 58 years) we performed immune-histochemistry staining for beige adipose tissue-specific marker TBX-1 (Figures 1A–E). TBX-1 expression (enzyme reaction in brown) appears to persist throughout adulthood. Normalization to hematoxylin nuclear counterstain (in blue) shows that TBX-1 staining intensity transiently decreases at young adult age (23 years) to show rebound at later ages (Figure 1F). In other words: TBX-1 expression may present a bimodal nature with elevations at both young and adulthood ages and an in-between transient decrease during young adulthood. The histological appearance of adipocytes is observed from 44 years of age onwards in this series.
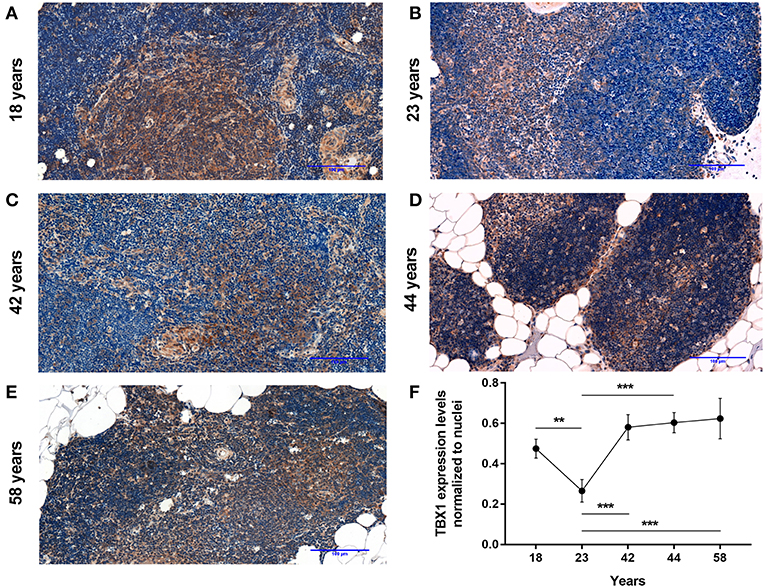
Figure 1. Kinetics of TBX-1 expression in the adult human thymus with age. Human thymic FFPE sections from different ages (18, 23, 42, 44, and 58 years) were evaluated by immune-histochemical staining (A–E), respectively. Brown color reaction (DAB) shows TBX-1 expression along with hematoxylin nuclear counter-staining. Please note signs of adipose degeneration (vacuoles) at elevated ages. TBX-1 staining was normalized to nuclear counter-stain and is shown as relative value (F). Please note that relative TBX-1 expression shows a transient decrease at young adult age (23 years of age). Significant differences are shown by asterisks (**p ≤ 0.01, ***p ≤ 0.001). Data were calculated from three slides and representative slide is shown. For exact numerical values and standard error of mean please refer to Supplementary Data Sheet.
Further Beige Adipocyte Markers Are Also Up-Regulated in Steroid-Induced Human TECs
As reported previously molecular level events are similar in the aging thymus and steroid-induced TECs in the mouse setting (4, 6). Accordingly, Dx-treatment significantly up-regulated (p < 0.01) pan-adipocyte marker PPAR-gamma expression in the human 1889c TEC line (Figures 2A,B,I). We have evaluated 1889c human TECs for the expression of beige-specific and beige-indicative protein markers as well following Dx-treatment. Similar to human thymus sections above, 1889c cells showed persistent and increasing (p < 0.05) TBX-1 expression following Dx-treatment (Figures 2C,D,I). UCP-1 expression showed only indicative (not significant) increase upon Dx-treatment (Figures 2E,F,I). Lipid accumulation was also tested, using a fluorescent dye (LipidTox Red) specific for neutral lipid deposits. The staining showed that Dx-treatment triggers significant (p < 0.05) accumulation of neutral lipid deposits (Figures 2G–I) in harmony with our previous reports (4, 6).
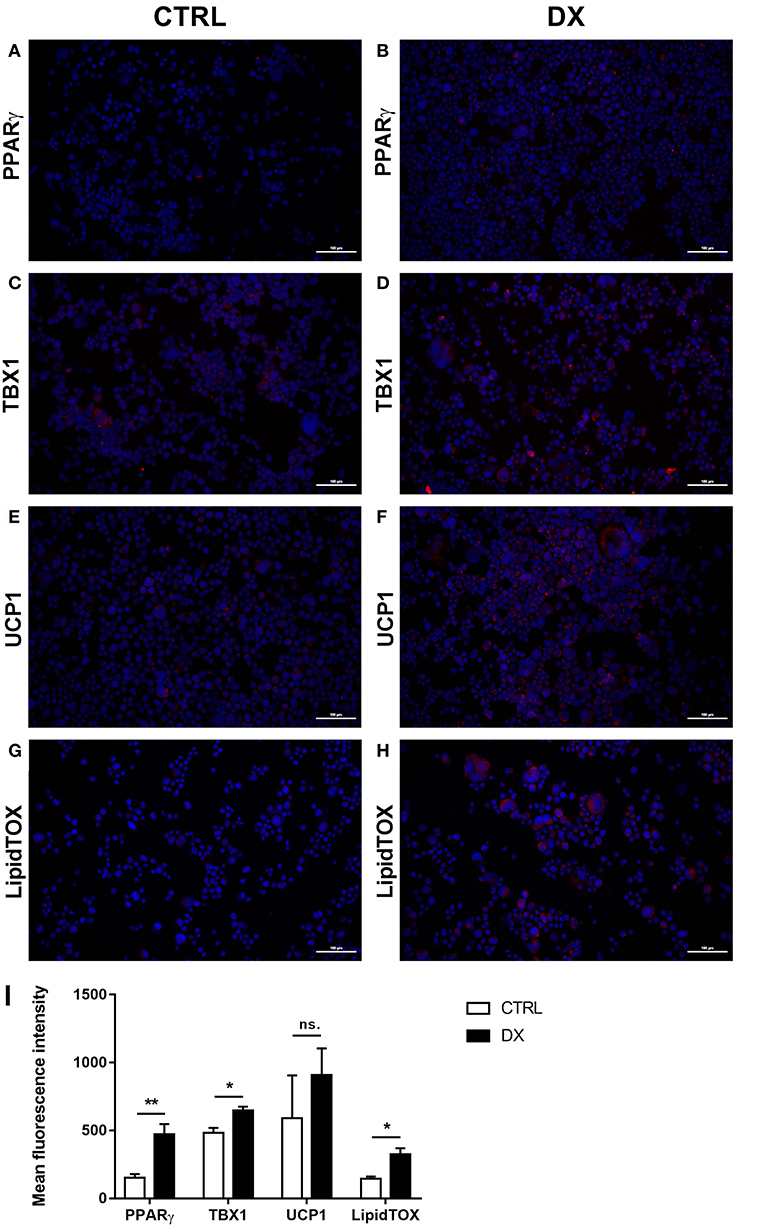
Figure 2. Beige adipocyte marker expression and lipid accumulation in steroid-induced human TECs. Cytospin slides of control (Ctrl) and steroid-induced (Dx) 1889c cells were stained by immune-fluorescence. Adipose tissue mastermind transcription factor PPARgamma (A,B), beige-specific marker TBX-1 (C,D) and beige-indicative marker UCP-1 (E,F) was evaluated in red (Alexa555). Neutral lipid deposits were stained with LipidTOX Red dye (G,H). DAPI staining was also applied as fluorescent nuclear counter stain in all cases. PPAR-gamma, TBX-1, UCP-1 and LipidTOX staining relative to DAPI staining is also shown by histograms (I). PPAR-gamma and TBX-1 show significant increase, UCP-1 remains unchanged, while neutral lipid deposits show significant increase following Dx-induction. Significant differences are shown by asterisks (*p ≤ 0.05, **p ≤ 0.01). Data were calculated from six slides, representative slide is shown. For exact numerical values and standard error of mean please refer to Supplementary Data Sheet.
Aging Up-Regulates key Beige Adipocyte Marker in Mouse Thymus Tissue
Using a pilot set of mouse thymic cryosections of various ages (1, 6, 8, 12, 14, 18, and 21 months) we performed immune-fluorescent staining for beige adipose tissue-specific marker TBX-1 (Figures 3A–G). TBX-1 expression (in red) appears to persist throughout adulthood in the mouse similar to human above. EpCAM-1 staining (in green) shows medullary areas to demonstrate histological organization. Normalization to DAPI nuclear counterstain (in blue, not shown here) reveals that TBX-1 staining intensity transiently decreases at adult mid-term (12–14 months) to show rebound at senior ages (Figure 3H). In other terms: TBX-1 expression potentially appears to be bimodal in the mouse as well showing elevation at both young and senior ages with a transient in-between decrease during adulthood. Murine kinetics of TBX-1 expression resembles the previously shown human kinetics but with higher resolution in time. Please note medullary involution observed from 14 months of age onwards in line with our previous reports (4, 6).
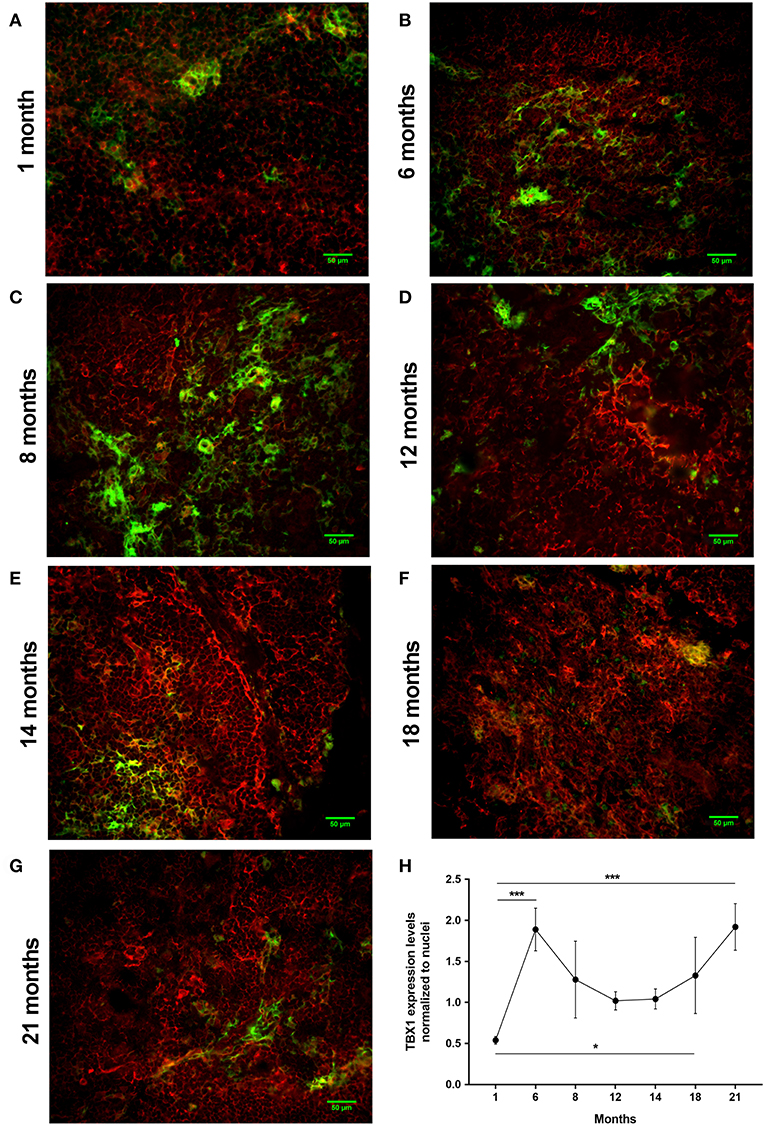
Figure 3. Kinetics of TBX-1 expression in the adult mouse thymus with age. Murine thymic frozen sections from different ages (1, 6, 8, 12, 14, 18, and 21 months) were evaluated by immune-fluorescent staining (A–G), respectively. Epithelial network is shown in green (EpCAM1-FITC) while TBX-1 expression is shown in red (TBX1-Alexa555) fluorescence. Please note signs of degeneration (auto-fluorescence) at elevated ages. Please also note that TBX-1 staining pattern localizes to both nuclear and cytoplasmic bodies in accordance with The Human Protein Atlas: http://www.proteinatlas.org/ENSG00000184058-TBX1/cell. TBX-1 staining was normalized to DAPI nuclear counter-stain (not shown) and is presented as relative value (H). Please note that relative TBX-1 expression shows a transient decrease at adult age (12 months of age). Significant differences are shown by asterisks (*p ≤ 0.05, ***p ≤ 0.001). Data were calculated from three slides, representative slide is shown. For exact numerical values and standard error of mean please refer to Supplementary Data Sheet.
Further Beige Adipocyte Markers Are Also Up-Regulated in Steroid-Induced Mouse TECs
As reported previously focusing on PPARgamma expression molecular level events are similar in the aging thymus and steroid-induced TECs in the mouse setting (4, 6). We have evaluated TEP1 mouse TECs for the expression of beige-specific and beige-indicative protein markers after Dx-treatment. TEP1 cells showed persistent, unchanged TBX-1 expression following Dx-treatment (Figures 4A,B,I). UCP-1 expression showed significant (p < 0.01) increase following Dx-treatment (Figures 4C,D,I). Lipid accumulation was also tested (LipidTox Red as above). The staining showed that Dx-treatment results in significant (p < 0.05) accumulation of neutral lipid deposits (Figures 4E,F,I) in accordance with our previous reports (4, 6). Ultra-structural imaging by TEM shows the appearance of multi-locular intracellular lipid deposits (indicated by asterisks) upon Dx-treatment, reminiscent of beige adipose tissue (Figures 4G,H).
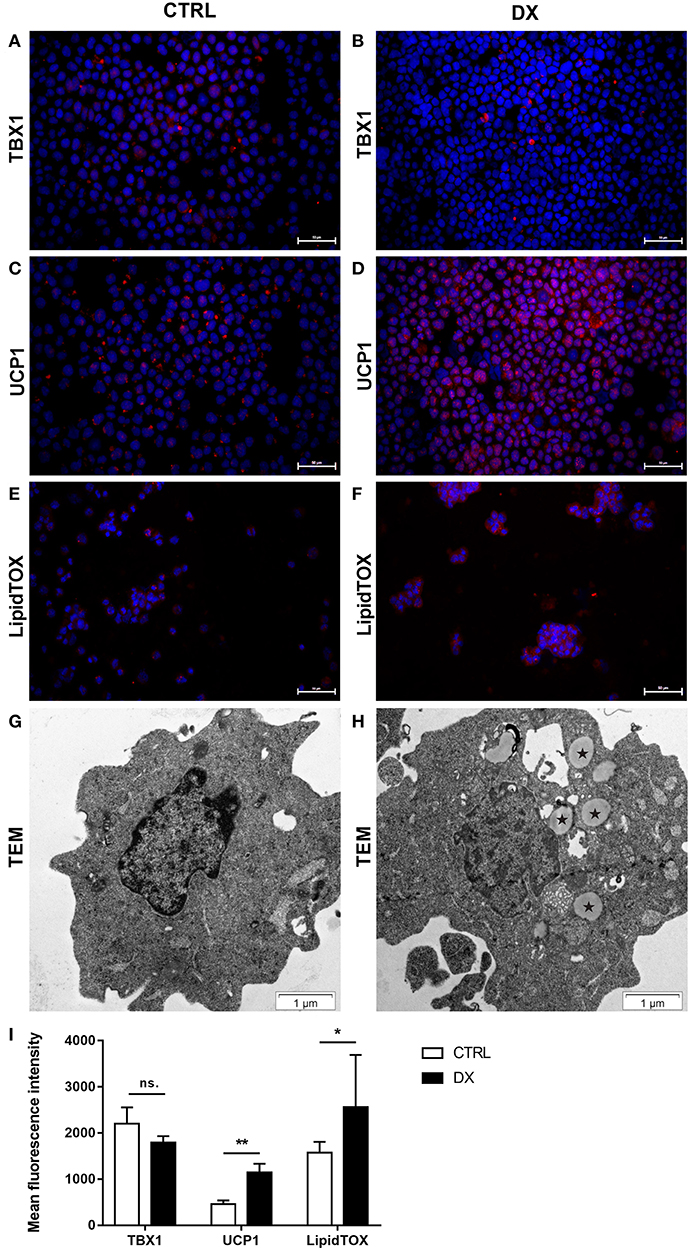
Figure 4. Beige adipocyte marker expression and lipid accumulation in steroid-induced mouse TECs. Cytospin slides of control (Ctrl) and steroid-induced (Dx) TEP1 cells were stained by immune-fluorescence. Beige-specific marker TBX-1 (A,B) and beige-indicative marker UCP-1 (C,D) was evaluated in red (Alexa555). Neutral lipid deposits were stained with LipidTOX Red dye (E,F). DAPI staining was also applied as nuclear counter-stain. TBX-1, UCP-1, and LipidTOX staining relative to DAPI staining is also shown by histograms (I). TBX-1 shows unaltered expression, while UCP-1 and lipid accumulation show significant increase following Dx-induction. Significant differences are shown by asterisks (*p ≤ 0.05, **p ≤ 0.01). Data were calculated from six slides, representative slide is shown. For exact numerical values and standard error of mean please refer to Supplementary Data Sheet. Ultrastructure of control (Ctrl) and steroid-induced (Dx) TEP1 cells was also evaluated by transmission electron microscopy (TEM) (G,H), respectively. Asterisks (*) show intracellular multi-locular lipid deposits following Dx-induction.
Steroid-Induced TECs Show Beige Adipocyte Metabolic Profile
There is a significant difference between white, brown and beige adipose tissue metabolic traits. In search of further evidence we have characterized the metabolic fingerprint of Dx-induced mouse TECs (TEP1).
The metabolic fingerprint of TEP1 cells treated with Dx (as part of MDI differentiation medium) was assayed using the Seahorse platform (Figure 5). MDI cells showed significantly higher basal OCR values compared to control cells (p < 0.001) (Figure 5A). Of note cAMP-induced OCR was rapid (30 min post-treatment) and lasted shorter than in previous reports (32, 33). In line with elevated UCP-1 expression oligomycin-resistant respiration was significantly higher in MDI cells than in control cells (p < 0.001) (Figure 5B). Although we have recorded increased glycolysis marked by significantly increased ECAR values (p < 0.001) (Figure 5C), the significantly increased ratio of basal OCR and ECAR (p < 0.001) (Figure 5D) in MDI cells suggests their dependence on mitochondrial oxidation. Taking the observed increase in basal OCR value, OCR/ECAR ratio, cAMP-response, and oligomycin-resistant respiration into consideration, these suggest that MDI-differentiated TECs possess a beige metabolic fingerprint in accordance with the up-regulation of beige-specific and beige-indicative markers shown above.
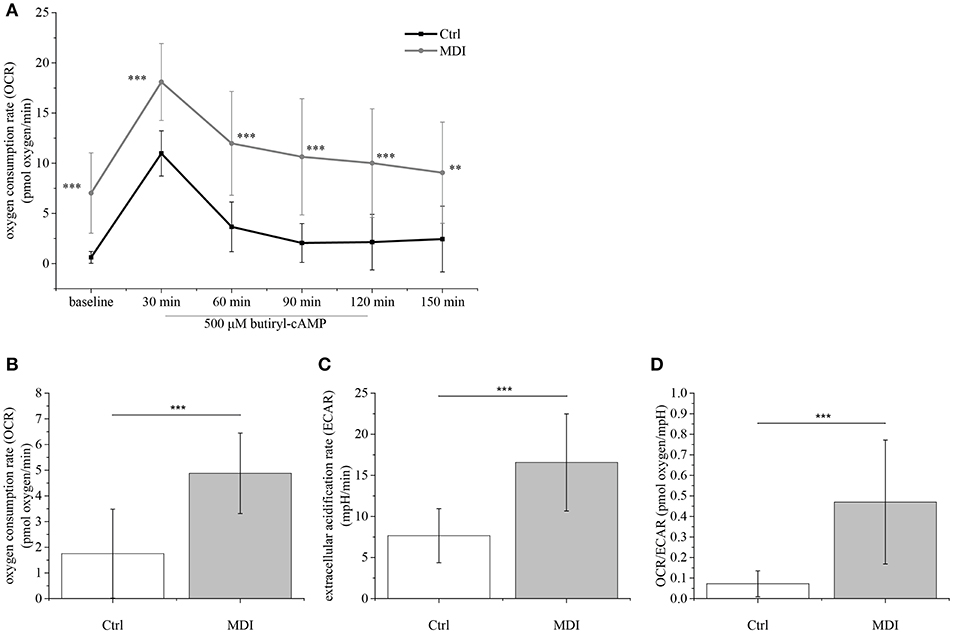
Figure 5. Metabolic parameters of steroid-induced TECs. Following pilot experiments, 15,000 cells / well were cultured for 9 days in MDI (or control) medium prior to Seahorse measurements. Baseline OCR was recorded followed by induction with cAMP (readings every 30 min) (A). Cells were treated with oligomycin to show oligomycin-resistant respiration indicating mitochondrial inner membrane leakage (B). ECAR was also determined (C) and the OCR/ECAR ratio was calculated (D). Significant differences are shown by asterisks (**p ≤ 0.01, ***p ≤ 0.001). Data were calculated from forty measurements, mean is shown. For exact numerical values and standard error of mean please refer to Supplementary Data Sheet.
Aged and Steroid-Induced TECs Show Beige Adipocyte Gene Expression Profile
Adult human and mouse thymus sections showed similar histological changes with age. Likewise, mouse and human steroid-induced TECs were also similar by immune-fluorescent staining. Next, TECs enriched from adult mice or Dx-treated (murine or human) TECs were subjected to gene expression analysis.
Changes in gene expression were further tested at the mRNA level in EpCAM1-enriched primary murine thymic epithelial cells from senior adult age (12 m) and steroid-induced TEP1 or 1889c cells for beige-specific (TBX1) and beige-indicative genes (UCP1, CD137, EAR2) (21–26). Enriched cells showed the up-regulation of both beige-specific and beige-indicative genes with age (1 vs. 12 months) as TBX1, UCP1, and EAR2 all showed significant elevation (p < 0.05 for all, Figure 6A), while CD137 activity remained unchanged. Gene expression analysis of mouse TEC line following Dx-treatment showed a similar tendency. as significant increase of TBX1 and UCP1 expression was detected (p < 0.01 and p < 0.05, respectively, Figure 6B), while CD137 and EAR2 were not altered. Likewise, the steroid-induced human TEC line showed significantly increased PPAR-gamma expression (p < 0.01) as reported previously for mouse TECs (4) and also significant increase of UCP-1 expression (p < 0.05) (Figure 6C), while CD137 and EAR2 remained identical. Please note the harmony of in vivo and in vitro data in both mouse and human species supporting our observations.
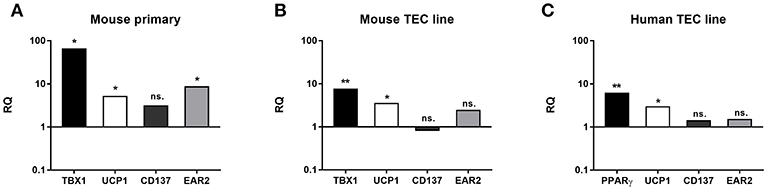
Figure 6. Beige adipocyte marker expression in aged or steroid-induced, mouse, and human TECs. Marker expression was evaluated by qRT-PCR from sorted TECs of mice (A). TBX-1, UCP-1 and EAR-2 showed significant increase with age (1 m vs 12 m). CD137 remained unchanged. Marker expression was evaluated by qRT-PCR in Dx-induced mouse TEP1 cells (B) and human 1889c cells (C), respectively. In mouse TEP1 cells TBX-1 and UCP-1 showed significant increase with Dx-induction. CD137 and EAR-2 did not present significant difference. In human 1889c cells PPAR-gamma and UCP-1 showed significant increase with Dx-induction. CD137 and EAR-2 did not present significant difference. Relative quantity values (RQ) are shown where Y = 1 represents young adult (A) or control expression levels (B,C), respectively. Significant differences are shown by asterisks (*p ≤ 0.05, **p ≤ 0.01). Please not that Y-axis is logarithmic. For exact numerical values and standard error of mean please refer to Supplementary Data Sheet containing both RQ and Ct/SD values for all experiments and target genes.
Steroid-Induced TECs Show Beige Adipocyte miRNA Profile
There is a significant difference between white, brown and beige adipose tissue miRNA profile. Seeking further evidence we have characterized the miRNA profile of Dx-induced human TECs (1889c).
We have elaborated two distinct platforms (Figure 7) for complete human miRNome analysis. For both platforms increased copy numbers are shown in red, while decreased copy numbers are shown in green (heat map). QuantStudio miRNA (QS) panels (A and B, Figures 7A,B) evaluate 768 miRNA entities, while the NanoString (NS) cartridge measures copy numbers of 880 miRNA entries (Figure 7C). Of note QS is amplification- (PCR) based while NS is amplification free. QS provides enhanced sensitivity, NS ensures unmatched signal-to-noise ratio. Accordingly, QS identified more miRNA species with occasional out-of-scale activities (shown in white) while NS recognized less species with a compressed scale of activities relative to QS. An overlap of the recognized miRNA species identified by at least one platform or evaluated by both platforms similarly is summarized by Table 2. The table connects the identified miRNA species with context-relevant function based on literature search. Of note, several of the recognized species have relevance to thymus senescence with special focus on adipose tissue development, epithelial-to-mesenchymal transition, cell proliferation and senescence.
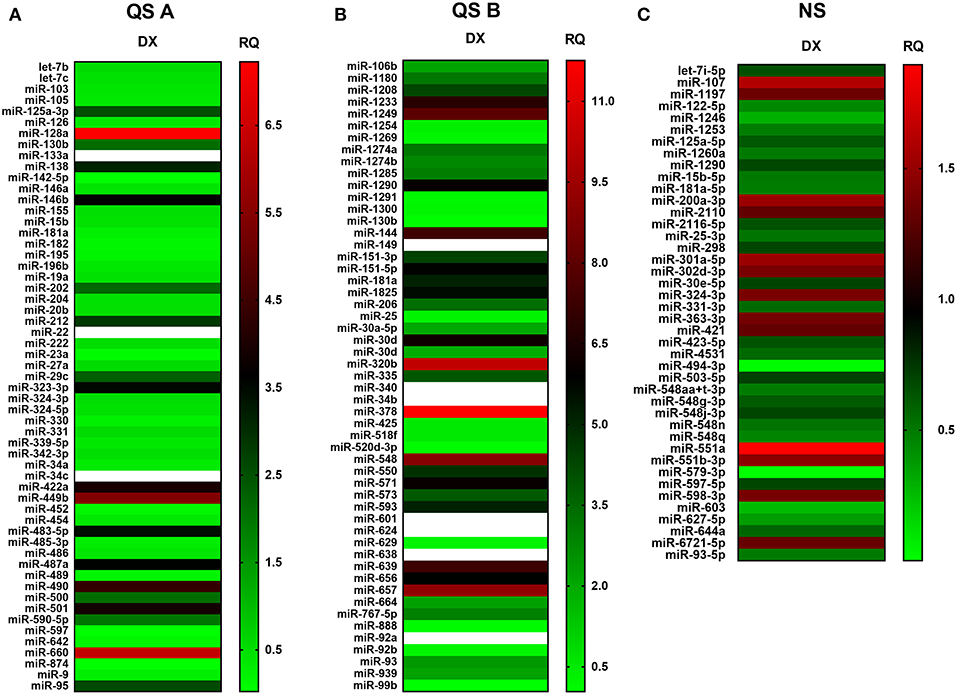
Figure 7. miRNA profile of steroid-induced TECs. miRNA profile of Dx-treated human 1889c cells measured by Quantstudio 12K Flex Pool A (A), Pool B (B) and NanoString nCounter SPRINT Profiler (C). Heat-map representation shows miRNA species with most significant changes in copy number. Relative quantity values are presented (ctrl = 1). Up-regulation of miRNA species is shown in red while down-regulation is shown in green. Out-of-scale RQ values are shown in white. Pilot study is shown, for exact numerical values please refer to Supplementary Data Sheet.

Table 2. Overlap of QS- and NS-based miRNA results with functional and literature annotation.
Discussion
Thymic Tissue Samples and Steroid-Induced TECs Show Beige Adipocyte Markers
TBX-1 has been extensively studied for its role in the thymic context during embryonic organogenesis, but not in the adult thymus undergoing adipose involution (11–15). Using human and mouse thymus sections we show that TBX-1 expression persists throughout adulthood with a transient decrease in expression (23 years of age in human and 12 months of age in mouse) based on our pilot studies. This persistence of thymic TBX-1 expression raises the possibility of an alternative role in adulthood. This hypothesis is supported by reports showing that (1) once the thymus has been formed TBX-1 suppresses FoxN1 (key transcription factor of thymic epithelial identity) and (2) TBX-1 has a key and specific role in beige adipose tissue development (17–21). This plausible connection is supported by our results as further beige-indicative markers (UCP-1, EAR2) show increasing mRNA levels with age. This is in harmony with the fact that the thymus resides in the mediastinum and secretes FGF21, both reported to promote the emergence of beige adipose tissue (25). The in vitro model system of aging (Dx-treated mouse TEP1 or human 1889c cells) show similar molecular and cellular changes. Immune-fluorescent histology shows the presence of TBX-1 both in control conditions and following Dx-treatment. UCP-1 protein expression, on the other hand, significantly increases following Dx-treatment. Protein level data are in accordance with mRNA results as both TBX-1 and UCP-1 showed an increase following Dx-treatment (both in mouse and human). The above molecular changes are accompanied by evident phenotypical changes: the appearance of typical intracellular multi-locular neutral lipid deposits (characteristic to brown/beige adipose tissue) as shown by LipidTox staining and transmission electron microscopy. Taken together, these data suggest that thymic adipose tissue emerging with senescence and modeled by steroid-induced TECs show beige adipocyte features.
Steroid-Induced TECs Show Beige Adipocyte Metabolic Profile
There is profound difference between white and brown/beige adipose tissues with respect to metabolic traits (23). Basal respiration (OCR) is significantly lower in white fat cells than in brown/beige fat cells. Also, UCP-mediated uncoupled respiration rate (resistant to inhibition by oligomycin) is characteristic to brown/beige fat cells and not observed in white fat cells (32). Furthermore, in brown/beige fat cells cAMP-induced mitochondrial oxidation is elevated compared to white fat cells (33). Having analyzed these metabolic parameters, our data suggest that adipocyte differentiation in our model system shows beige bias as indicated by elevated basal OCR, increased OCR/ECAR ratio, enhanced cAMP-response and oligomycin-resistant respiration. Our metabolic readouts are in accordance with the recorded beige adipose tissue markers, morphological characteristics and gene expression profiles.
Steroid-Induced TECs Show Beige Adipocyte miRNA Profile
Unbiased dual platform complete miRNome analysis identified a number of context-relevant miRNA copy number alterations. Of note, miR-27a and miR-106b are beige adipose tissue regulators and miR-155 is an inhibitor of brown/beige adipose tissue formation (36, 46, 53). From a broad pan-adipocyte perspective, miR-128a-3p, miR-1825, miR-301a-5p, miR-30d, miR-425-5p, miR-550a, and miR92b-3p also influence adipose tissue formation and show changes in the current experimental setting (40, 43, 48, 49, 54, 55, 62, 66, 67). Furthermore, a cornerstone of thymus adipose involution: epithelial-to-mesenchymal transition (EMT), operates via miR-105-5p, miR-200a-3p, miR-597-5p, miR-888, and miR-99b, all demonstrating changes in copy number in steroid-induced TECs (35, 36, 50, 63, 65, 69, 70). Taking a final expansion of interest, from a senescent perspective miR-125a-3p, miR-125a-5p, miR-15b-5p, miR-181a-5p, miR-323-3p, and miR-331-3p affect cellular / tissue level senescence with focus on the thymus and also show significant changes (36, 39, 40, 45, 47, 56–58). In summary, steroid-treatment in TECs affects the same miRNA species that were reported in connection with senescence-related thymus adipose involution that apparently yields beige adipose tissue.
Expanding Overlap Between Metabolism and Immunity
Overlap of metabolism and immunity has already been raised decades ago, and this inter-disciplinary field has recently become a prominent research area. For example, both previous and recent papers discussed overlap between the neuroendocrine and immune systems with regard to melatonin (71–73). Melatonin—mainly produced by the pineal gland, but also expressed by the thymus in small amounts—has been reported to have an immune-modulatory effect, enhancing immune functions with Th1 bias. Accordingly, anti-viral and anti-cancer defense is boosted by melatonin and age-related loss of melatonin production partly explains elevated incidence of infection and cancer observed with senescence. Protection from cancer metastasis development in the central nervous system (CNS) implies proper blood-brain barrier (BBB) function (74–76). BBB function, CNS function and immune status are all controlled by metabolic interplays involving small molecules such as lactate. Local tissue lactate concentration has been reported to have important role in immune regulation, its accumulation promoting autoimmune reactions (77, 78). Intercellular immune modulatory signals triggered by metabolically active small molecules are transmitted in cells through signaling pathways. An important pathway connecting metabolism and immunity utilizes mechanistic target of rapamycin (mTOR). It was shown that mTOR senses certain small nutrients (amino acids) and thus affects immune tolerance through regulatory T-cells (79, 80). Mammalian immunity heavily relies on both the innate and the adaptive branch. Within innate immunity macrophages have an important role in connecting metabolism and immunity. It has also been reported that carbohydrate metabolism significantly affects inflammation via macrophages (81).
Carbohydrates are also basic metabolic fuels. The mammalian immune system is a costly defense system with regard to T-cell development and selection taking place in the thymus, where approx. Ninety-five percent of developing thymocytes are deleted being useless or potentially autoimmune. However, the adaptive branch heavily relies on the constant supply of fresh naïve and scrupulously selected T-cells to prevent infection, cancer and autoimmunity from developing. Severe negative imbalance in energy expenditure (due to fasting or malnutrition) has long been known to hamper thymus function and immunity (82). In contrast, currently, global human population is more threatened by obesity than fasting along with its reported negative effects on thymus function (1, 83). Fashionable countermeasures of obesity include e.g., applying diet to induce ketosis. Ketosis has been reported to enhance FGF21 secretion, known to promote white adipose tissue browning especially in the mediastinal context, where the thymus also resides (25, 84). Further options of white adipose tissue browning include interventions e.g., irisin (exercise hormone) treatment (32). However, since irisin promotes beige adipose tissue development it may also impair thymus function via promoting adipose involution identical to thymus senescence.
Our study highlights another potential intersection of immunity and metabolism via the dual role of TBX-1 during thymus development and senescence. TBX-1 shows bimodal expression (high expression in early and late ages, with a transient decrease in-between) in both mouse and human. It is conceivable that TBX-1 plays a role in thymus organogenesis early on (early “immune” peak) and thymic adipose involution later on (late “metabolic” peak). This dualism may be unique to the thymus due to the observed “beige” adipose involution process.
With senescence the thymus suffers adipose involution. Impaired thymic niche leads to decreased naïve T-cell output. This in turn weakens T cell-mediated anti-viral and anti-cancer defense, and elevates the chances of autoimmune disorders due to dysfunctional T-cell selection. Therefore, thymic adipose tissue emerging with age impairs immune homeostasis and the maintenance of tolerance. Our results indicate that thymic adipose tissue shows “beige” characteristics by molecular, cellular and metabolic profiling. Our research contributes to the breadth of overlap between metabolism and immune homeostasis.
Data Availability
All datasets generated for this study are included in the manuscript and/or the Supplementary Files.
Ethics Statement
Mice were kept in the Laboratory Animal Core Facility of the University. Experimental procedures were carried out according to the 1988/XXVIII act of the Hungarian Parliament on Animal Protection (243/1988) which complies with recommendations of the Helsinki Declaration. All animal experiments were performed with the consent of the Ethics Committee on Animal Research of the University (ref. no.: #BA02/2000-46/2016). Formalin-fixed, paraffin-embedded (FFPE) human thymus samples from 18, 23, 42, 44, and 58 years of age were provided by the Department of Pathology, Faculty of Medicine, University of Pecs, Hungary. Experiments involving human samples were performed with the consent of the Regional and Local Ethics Committee of Clinical Centre of the University (ref. no.: 6069/2016) according to their guidelines. All subjects gave written informed consent in accordance with the Declaration of Helsinki.
Author Contributions
KB performed most histological, molecular biology, and statistics work in the project and was involved in manuscript preparation. DE performed all human IHC work. AP and PB were responsible for preparative Seahorse measurements. KG performed statistical analysis. DB was involved in experiments performed on human 1889c cells. JP was involved in planning experiments and manuscript preparation as well as local supervision of respective department. KK was involved in histological, molecular biology, and statistics work, also in planning experiments and manuscript preparation, and supervised the project.
Funding
Scientific research support was provided by the Hungarian National Science Foundation (No. 78310) and PTE AOK KA-2016-16 to KK. The project was also supported by the University of Pecs in the frame of Pharmaceutical Talent Center program and the Viral Pathogenesis Talent Center program via KK. The Janos Bolyai Scholarship of the Hungarian Academy of Sciences and Bolyai+ 2018/2019 (UNKP-18-4 2018/2019 new national excellence program of the ministry of human capacities) also supported KK. JP was also supported by the European Union and the State of Hungary, co-financed by the European Social Fund in the framework of, TAMOP-4.2.2. A-11/1/KON-2012-0024 and TAMOP-4.2.4.A/2-11/1-2012-0001 National Excellence Program and PTE AOK-KA-2013/22. Further grant support was provided to PB by NKFIH K108308, C120732, TAMOP-4.2.2.A-11/1/KONV-2012-0025. The project was also supported by the UNKP-18-3 2018/2019 new national excellence program of the ministry of human capacities to KG. Research funding was also provided by University of Pecs Biomedical Engineering Project to JP and KK.
Conflict of Interest Statement
The authors declare that the research was conducted in the absence of any commercial or financial relationships that could be construed as a potential conflict of interest.
Acknowledgments
The authors wish to thank Hajnalka Abraham MD, PhD (Central Electron Microscope Laboratory, University of Pecs, Hungary) for the technical aid in taking transmission electron microscope images. The thymic carcinoma cell line 1889c was kindly provided by Prof Ralf J. Riecker (Institute of Pathology, University Hospital, Heidelberg, Germany). The authors wish to thank Ricky Odedra (Humeltis Ltd) and prof. Mary Keen (University of Birmingham, UK) for improving the manuscript using their native speaker skills. The present scientific contribution is dedicated to the 650th anniversary of the foundation of the University of Pecs, Hungary.
Supplementary Material
The Supplementary Material for this article can be found online at: https://www.frontiersin.org/articles/10.3389/fendo.2019.00369/full#supplementary-material
References
1. Yang H, Youm Y-H, Vandanmagsar B, Rood J, Kumar KG, Butler AA, et al. Obesity accelerates thymic aging. Blood. (2009) 114:3803–12. doi: 10.1182/blood-2009-03-213595
2. Dixit VD. Thymic fatness and approaches to enhance thymopoietic fitness in aging. Curr Opin Immunol. (2010) 22:521–8. doi: 10.1016/j.coi.2010.06.010
3. Yang H, Youm Y-H, Dixit VD. Inhibition of thymic adipogenesis by caloric restriction is coupled with reduction in age-related thymic involution. J Immunol. (2009) 183:3040–52. doi: 10.4049/jimmunol.0900562
4. Talaber G, Kvell K, Varecza Z, Boldizsar F, Parnell SM, Jenkinson EJ, et al. Wnt-4 protects thymic epithelial cells against dexamethasone-induced senescence. Rejuvenation Res. (2011) 14:241–8. doi: 10.1089/rej.2010.1110
5. Youm Y-H, Yang H, Amin R, Smith SR, Leff T, Dixit VD. Thiazolidinedione treatment and constitutive-PPARgamma activation induces ectopic adipogenesis and promotes age-related thymic involution. Aging Cell. (2010) 9:478–89. doi: 10.1111/j.1474-9726.2010.00574.x
6. Kvell K, Varecza Z, Bartis D, Hesse S, Parnell S, Anderson G, et al. Wnt4 and LAP2alpha as pacemakers of thymic epithelial senescence. PLoS ONE. (2010) 5:e10701. doi: 10.1371/journal.pone.0010701
7. Ernszt D, Banfai K, Kellermayer Z, Pap A, Lord JM, Pongracz JE, et al. PPARgamma deficiency counteracts thymic senescence. Front Immunol. (2017) 8:1515. doi: 10.3389/fimmu.2017.01515
8. Palmer DB. The effect of age on thymic function. Front Immunol. (2013) 4:316. doi: 10.3389/fimmu.2013.00316
9. Bertho JM, Demarquay C, Moulian N, Van Der Meeren A, Berrih-Aknin S, Gourmelon P. Phenotypic and immunohistological analyses of the human adult thymus: evidence for an active thymus during adult life. Cell Immunol. (1997) 179:30–40. doi: 10.1006/cimm.1997.1148
10. George AJ, Ritter MA. Thymic involution with ageing: obsolescence or good housekeeping? Immunol Today. (1996) 17:267–72. doi: 10.1016/0167-5699(96)80543-3
11. Steinmann GG. Changes in the human thymus during aging. Curr Top Pathol. (1986) 75:43–88. doi: 10.1007/978-3-642-82480-7_2
12. Gao S, Li X, Amendt BA. Understanding the role of Tbx1 as a candidate gene for 22q11.2 deletion syndrome. Curr Allergy Asthma Rep. (2013) 13:613–21. doi: 10.1007/s11882-013-0384-6
13. Farley AM, Morris LX, Vroegindeweij E, Depreter MLG, Vaidya H, Stenhouse FH, et al. Dynamics of thymus organogenesis and colonization in early human development. Development. (2013) 140:2015–26. doi: 10.1242/dev.087320
14. Jerome LA, Papaioannou VE. DiGeorge syndrome phenotype in mice mutant for the T-box gene, Tbx1. Nat Genet. (2001) 27:286–91. doi: 10.1038/85845
15. Sirianni MC, Businco L, Seminara R, Aiuti F. Severe combined immunodeficiencies, primary T-cell defects and DiGeorge syndrome in humans: characterization by monoclonal antibodies and natural killer cell activity. Clin Immunol Immunopathol. (1983) 28:361–70. doi: 10.1016/0090-1229(83)90103-4
16. Reeh KAG, Cardenas KT, Bain VE, Liu Z, Laurent M, Manley NR, et al. Ectopic TBX1 suppresses thymic epithelial cell differentiation and proliferation during thymus organogenesis. Development. (2014) 141:2950–8. doi: 10.1242/dev.111641
17. Wu J, Boström P, Sparks LM, Ye L, Choi JH, Giang A-H, et al. Beige adipocytes are a distinct type of thermogenic fat cell in mouse and human. Cell. (2012) 150:366–76. doi: 10.1016/j.cell.2012.05.016
18. Giralt M, Villarroya F. White, brown, beige/brite: different adipose cells for different functions? Endocrinology. (2013) 154:2992–3000. doi: 10.1210/en.2013-1403
19. Symonds ME. Brown adipose tissue growth and development. Scientifica. (2013) 2013:305763. doi: 10.1155/2013/305763
20. Cinti S. Adipocyte differentiation and transdifferentiation: plasticity of the adipose organ. J Endocrinol Invest. (2002) 25:823–35. doi: 10.1007/BF03344046
21. Berg JM, Tymoczko JL, Stryer L. Biochemistry. 5th ed, section 18.6. New York, NY: WH Freeman and Co (2002).
22. Peláez-García A, Barderas R, Batlle R, Viñas-Castells R, Bartolomé RA, Torres S, et al. A proteomic analysis reveals that Snail regulates the expression of the nuclear orphan receptor nuclear receptor subfamily 2 group F member 6 (Nr2f6) and interleukin 17 (IL-17) to inhibit adipocyte differentiation. Mol Cell Proteomics. (2015) 14:303–15. doi: 10.1074/mcp.M114.045328
23. Cereijo R, Giralt M, Villarroya F. Thermogenic brown and beige/brite adipogenesis in humans. Ann Med. (2015) 47:169–77. doi: 10.3109/07853890.2014.952328
24. Poher A-L, Altirriba J, Veyrat-Durebex C, Rohner-Jeanrenaud F. Brown adipose tissue activity as a target for the treatment of obesity/insulin resistance. Front Physiol. (2015) 6:4. doi: 10.3389/fphys.2015.00004
25. Gaborit B, Venteclef N, Ancel P, Pelloux V, Gariboldi V, Leprince P, et al. Human epicardial adipose tissue has a specific transcriptomic signature depending on its anatomical peri-atrial, peri-ventricular, or peri-coronary location. Cardiovasc Res. (2015) 108:62–73. doi: 10.1093/cvr/cvv208
26. Langhi LGP, Andrade LR, Shimabukuro MK, van Ewijk W, Taub DD, Borojevic R, et al. Lipid-laden multilocular cells in the aging thymus are phenotypically heterogeneous. PLoS ONE. (2015) 10:e0141516. doi: 10.1371/journal.pone.0141516
27. Beardsley TR, Pierschbacher M, Wetzel GD, Hays EF. Induction of T-cell maturation by a cloned line of thymic epithelium (TEPI). Proc Natl Acad Sci USA. (1983) 80:6005–9. doi: 10.1073/pnas.80.19.6005
28. Ehemann V, Kern MA, Breinig M, Schnabel PA, Gunawan B, Schulten H-J, et al. Establishment, characterization and drug sensitivity testing in primary cultures of human thymoma and thymic carcinoma. Int J cancer. (2008) 122:2719–25. doi: 10.1002/ijc.23335
29. Belharazem D, Grass A, Paul C, Vitacolonna M, Schalke B, Rieker RJ, et al. Increased cFLIP expression in thymic epithelial tumors blocks autophagy via NF-κB signalling. Oncotarget. (2017) 8:89580–94. doi: 10.18632/oncotarget.15929
30. Meggyes M, Lajko A, Palkovics T, Totsimon A, Illes Z, Szereday L, et al. Feto-maternal immune regulation by TIM-3/galectin-9 pathway and PD-1 molecule in mice at day 14.5 of pregnancy. Placenta. (2015) 36:1153–60. doi: 10.1016/j.placenta.2015.07.124
31. Gratzner HG, Ahmad PM, Stein J, Ahmad F. Flow cytometric analysis of DNA replication during the differentiation of 3T3-L1 preadipocytes. Cytometry. (1985) 6:563–9. doi: 10.1002/cyto.990060610
32. Kristóf E, Doan-Xuan Q-M, Bai P, Bacso Z, Fésüs L. Laser-scanning cytometry can quantify human adipocyte browning and proves effectiveness of irisin. Sci Rep. (2015) 5:12540. doi: 10.1038/srep12540
33. Abdul-Rahman O, Kristóf E, Doan-Xuan Q-M, Vida A, Nagy L, Horváth A, et al. AMP-Activated Kinase (AMPK) activation by AICAR in human white adipocytes derived from pericardial white adipose tissue stem cells induces a partial beige-like phenotype. PLoS ONE. (2016) 11:e0157644. doi: 10.1371/journal.pone.0157644
34. Trajkovski M, Hausser J, Soutschek J, Bhat B, Akin A, Zavolan M, et al. MicroRNAs 103 and 107 regulate insulin sensitivity. Nature. (2011) 474:649–53. doi: 10.1038/nature10112
35. Jin X, Yu Y, Zou Q, Wang M, Cui Y, Xie J, et al. MicroRNA-105 promotes epithelial-mesenchymal transition of nonsmall lung cancer cells through upregulating Mcl-1. J Cell Biochem. (2019) 120:5880–8. doi: 10.1002/jcb.27873
36. Goody D, Pfeifer A. MicroRNAs in brown and beige fat. Biochim Biophys Acta Mol Cell Biol Lipids. (2019) 1864:29–36. doi: 10.1016/j.bbalip.2018.05.003
37. Kolhe R, Mondal AK, Pundkar C, Periyasamy-Thandavan S, Mendhe B, Hunter M, et al. Modulation of miRNAs by vitamin C in human bone marrow stromal cells. Nutrients. (2018) 10:186. doi: 10.3390/nu10020186
38. Li XJ, Ren ZJ, Tang JH, Yu Q. Exosomal MicroRNA MiR-1246 promotes cell proliferation, invasion and drug resistance by targeting CCNG2 in breast cancer. Cell Physiol Biochem. (2017) 44:1741–8. doi: 10.1159/000485780
39. Holly AC, Grellscheid S, van de Walle P, Dolan D, Pilling LC, Daniels DJ, et al. Comparison of senescence-associated miRNAs in primary skin and lung fibroblasts. Biogerontology. (2015) 16:423–34. doi: 10.1007/s10522-015-9560-5
40. Du J, Xu Y, Zhang P, Zhao X, Gan M, Li Q, et al. MicroRNA-125a-5p affects adipocytes proliferation, differentiation and fatty acid composition of porcine intramuscular fat. Int J Mol Sci. (2018) 19:501. doi: 10.3390/ijms19020501
41. Tryggestad JB, Vishwanath A, Jiang S, Mallappa A, Teague AM, Takahashi Y, et al. Influence of gestational diabetes mellitus on human umbilical vein endothelial cell miRNA. Clin Sci. (2016) 130:1955–67. doi: 10.1042/CS20160305
42. Kumar S, Reddy PH. Are circulating microRNAs peripheral biomarkers for Alzheimer's disease? Biochim Biophys Acta. (2016) 1862:1617–27. doi: 10.1016/j.bbadis.2016.06.001
43. Wotschofsky Z, Gummlich L, Liep J, Stephan C, Kilic E, Jung K, et al. Integrated microRNA and mRNA signature associated with the transition from the locally confined to the metastasized clear cell renal cell carcinoma exemplified by miR-146-5p. PLoS ONE. (2016) 11:e0148746. doi: 10.1371/journal.pone.0148746
44. Dhahbi JM, Spindler SR, Atamna H, Yamakawa A, Guerrero N, Boffelli D, et al. Deep sequencing identifies circulating mouse miRNAs that are functionally implicated in manifestations of aging and responsive to calorie restriction. Aging. (2013) 5:130–41. doi: 10.18632/aging.100540
45. Terlecki-Zaniewicz L, Lämmermann I, Latreille J, Bobbili MR, Pils V, Schosserer M, et al. Small extracellular vesicles and their miRNA cargo are anti-apoptotic members of the senescence-associated secretory phenotype. Aging. (2018) 10:1103–32. doi: 10.18632/aging.101452
46. Chen Y, Siegel F, Kipschull S, Haas B, Fröhlich H, Meister G, et al. miR-155 regulates differentiation of brown and beige adipocytes via a bistable circuit. Nat Commun. (2013) 4:1769. doi: 10.1038/ncomms2742
47. Xu M, Zhang X, Hong R, Su D-M, Wang L. MicroRNAs regulate thymic epithelium in age-related thymic involution via down- or upregulation of transcription factors. J Immunol Res. (2017) 2017:2528957. doi: 10.1155/2017/2528957
48. Raghavachari N, Liu P, Barb JJ, Yang Y, Wang R, Nguyen QT, et al. Integrated analysis of miRNA and mRNA during differentiation of human CD34+ cells delineates the regulatory roles of microRNA in hematopoiesis. Exp Hematol. (2014) 42:14–27.e1–2. doi: 10.1016/j.exphem.2013.10.003
49. Stace CL, Ktistakis NT. Phosphatidic acid- and phosphatidylserine-binding proteins. Biochim Biophys Acta. (2006) 1761:913–26. doi: 10.1016/j.bbalip.2006.03.006
50. Becker LE, Takwi AAL, Lu Z, Li Y. The role of miR-200a in mammalian epithelial cell transformation. Carcinogenesis. (2015) 36:2–12. doi: 10.1093/carcin/bgu202
51. Chen Y-J, Chang W-A, Huang M-S, Chen C-H, Wang K-Y, Hsu Y-L, et al. Identification of novel genes in aging osteoblasts using next-generation sequencing and bioinformatics. Oncotarget. (2017) 8:113598–613. doi: 10.18632/oncotarget.22748
53. Kim SY, Kim AY, Lee HW, Son YH, Lee GY, Lee J-W, et al. miR-27a is a negative regulator of adipocyte differentiation via suppressing PPARγ expression. Biochem Biophys Res Commun. (2010) 392:323–8. doi: 10.1016/j.bbrc.2010.01.012
54. Nowak WN, Taha H, Kachamakova-Trojanowska N, Stepniewski J, Markiewicz JA, Kusienicka A, et al. Murine bone marrow mesenchymal stromal cells respond efficiently to oxidative stress despite the low level of heme oxygenases 1 and 2. Antioxid Redox Signal. (2018) 29:111–27. doi: 10.1089/ars.2017.7097
55. Nunez Lopez YO, Garufi G, Pasarica M, Seyhan AA. Elevated and correlated expressions of miR-24, miR-30d, miR-146a, and SFRP-4 in human abdominal adipose tissue play a role in adiposity and insulin resistance. Int J Endocrinol. (2018) 2018:7351902. doi: 10.1155/2018/7351902
56. Nidadavolu LS, Niedernhofer LJ, Khan SA. Identification of microRNAs dysregulated in cellular senescence driven by endogenous genotoxic stress. Aging. (2013) 5:460–73. doi: 10.18632/aging.100571
57. Maes OC, Sarojini H, Wang E. Stepwise up-regulation of microRNA expression levels from replicating to reversible and irreversible growth arrest states in WI-38 human fibroblasts. J Cell Physiol. (2009) 221:109–19. doi: 10.1002/jcp.21834
58. Morita K, Fujii T, Itami H, Uchiyama T, Nakai T, Hatakeyama K, et al. NACC1, as a target of MicroRNA-331-3p, regulates cell proliferation in urothelial carcinoma cells. Cancers. (2018) 10:347. doi: 10.3390/cancers10100347
59. Cheng Y, Mai J, Hou T, Ping J. MicroRNA-421 induces hepatic mitochondrial dysfunction in non-alcoholic fatty liver disease mice by inhibiting sirtuin 3. Biochem Biophys Res Commun. (2016) 474:57–63. doi: 10.1016/j.bbrc.2016.04.065
60. de Almeida RC, Chagas VS, Castro MAA, Petzl-Erler ML. Integrative analysis identifies genetic variants associated with autoimmune diseases affecting putative MicroRNA binding sites. Front Genet. (2018) 9:139. doi: 10.3389/fgene.2018.00139
61. Zhuo X, Zhou W, Li D, Chang A, Wang Y, Wu Y, et al. Plasma microRNA expression signature involving miR-548q, miR-630 and miR-940 as biomarkers for nasopharyngeal carcinoma detection. Cancer Biomark. (2018) 23:579–87. doi: 10.3233/CBM-181852
62. Heilmeier U, Hackl M, Skalicky S, Weilner S, Schroeder F, Vierlinger K, et al. Serum miRNA signatures are indicative of skeletal fractures in postmenopausal women with and without type 2 diabetes and influence osteogenic and adipogenic differentiation of adipose tissue-derived mesenchymal stem cells in vitro. J Bone Miner Res. (2016) 31:2173–92. doi: 10.1002/jbmr.2897
63. Xie L, Jiang T, Cheng A, Zhang T, Huan P, Li P, et al. MiR-597 targeting 14-3-3σ enhances cellular invasion and EMT in Nasopharyngeal carcinoma cells. Curr Mol Pharmacol. (2018) 12:105–114. doi: 10.2174/1874467212666181218113930
64. Wang P, Wang H, Li C, Zhang X, Xiu X, Teng P, et al. Dysregulation of microRNA-657 influences inflammatory response via targeting interleukin-37 in gestational diabetes mellitus. J Cell Physiol. (2019) 234:7141–8. doi: 10.1002/jcp.27468
65. Huang S, Cai M, Zheng Y, Zhou L, Wang Q, Chen L. miR-888 in MCF-7 side population sphere cells directly targets E-cadherin. J Genet Genomics. (2014) 41:35–42. doi: 10.1016/j.jgg.2013.12.002
66. Maes OC, An J, Sarojini H, Wu H, Wang E. Changes in MicroRNA expression patterns in human fibroblasts after low-LET radiation. J Cell Biochem. (2008) 105:824–34. doi: 10.1002/jcb.21878
67. Wang Z, Li Q, Chamba Y, Zhang B, Shang P, Zhang H, et al. Identification of genes related to growth and lipid deposition from transcriptome profiles of pig muscle tissue. PLoS ONE. (2015) 10:e0141138. doi: 10.1371/journal.pone.0141138
68. Chen G, Du C, Shen Z, Peng L, Xie H, Zang R, et al. MicroRNA-939 inhibits cell proliferation via targeting LRSAM1 in Hirschsprung's disease. Aging. (2017) 9:2471–9. doi: 10.18632/aging.101331
69. Dalmasso G, Thu Nguyen HT, Yan Y, Laroui H, Srinivasan S, Sitaraman SV, et al. MicroRNAs determine human intestinal epithelial cell fate. Differentiation. (2010) 80:147–54. doi: 10.1016/j.diff.2010.06.005
70. Li Y-J, Wang Y, Wang Y-Y. MicroRNA-99b suppresses human cervical cancer cell activity by inhibiting the PI3K/AKT/mTOR signaling pathway. J Cell Physiol. (2019) 234:9577–91. doi: 10.1002/jcp.27645
71. Mocchegiani E, Malavolta M, Costarelli L, Giacconi R, Piacenza F, Lattanzio F, et al. Is there a possible single mediator in modulating neuroendocrine-thymus interaction in ageing? Curr Aging Sci. (2013) 6:99–107. doi: 10.2174/1874609811306010013
72. Srinivasan V, Spence DW, Trakht I, Pandi-Perumal SR, Cardinali DP, Maestroni GJ. Immunomodulation by melatonin: its significance for seasonally occurring diseases. Neuroimmunomodulation. (2008) 15:93–101. doi: 10.1159/000148191
73. Espino J, Pariente JA, Rodríguez AB. Oxidative stress and immunosenescence: therapeutic effects of melatonin. Oxid Med Cell Longev. (2012) 2012:670294. doi: 10.1155/2012/670294
74. Mauro C, De Rosa V, Marelli-Berg F, Solito E. Metabolic syndrome and the immunological affair with the blood-brain barrier. Front Immunol. (2014) 5:677. doi: 10.3389/fimmu.2014.00677
75. Tang C-Y, Mauro C. Similarities in the metabolic reprogramming of immune system and endothelium. Front Immunol. (2017) 8:837. doi: 10.3389/fimmu.2017.00837
76. Wang T, Liu G, Wang R. The intercellular metabolic interplay between tumor and immune cells. Front Immunol. (2014) 5:358. doi: 10.3389/fimmu.2014.00358
77. Pucino V, Bombardieri M, Pitzalis C, Mauro C. Lactate at the crossroads of metabolism, inflammation, and autoimmunity. Eur J Immunol. (2017) 47:14–21. doi: 10.1002/eji.201646477
78. Haas R, Smith J, Rocher-Ros V, Nadkarni S, Montero-Melendez T, D'Acquisto F, et al. Lactate regulates metabolic and pro-inflammatory circuits in control of T cell migration and effector functions. PLoS Biol. (2015) 13:e1002202. doi: 10.1371/journal.pbio.1002202
79. Howie D, Waldmann H, Cobbold S. Nutrient sensing via mTOR in T cells maintains a tolerogenic microenvironment. Front Immunol. (2014) 5:409. doi: 10.3389/fimmu.2014.00409
80. Cobbold SP, Adams E, Farquhar CA, Nolan KF, Howie D, Lui KO, et al. Infectious tolerance via the consumption of essential amino acids and mTOR signaling. Proc Natl Acad Sci USA. (2009) 106:12055–60. doi: 10.1073/pnas.0903919106
81. Nagy C, Haschemi A. Time and demand are two critical dimensions of immunometabolism: the process of macrophage activation and the pentose phosphate pathway. Front Immunol. (2015) 6:164. doi: 10.3389/fimmu.2015.00164
82. Faulk WP, Paes RP, Marigo C. The immunological system in health and malnutrition. Proc Nutr Soc. (1976) 35:253–61. doi: 10.1079/PNS19760044
83. Castro É, Silva TEO, Festuccia WT. Critical review of beige adipocyte thermogenic activation and contribution to whole-body energy expenditure. Horm Mol Biol Clin Investig. (2017) 31. doi: 10.1515/hmbci-2017-0042
Keywords: thymus senescence, beige adipose tissue, TBX-1, UCP-1, PPARgamma
Citation: Banfai K, Ernszt D, Pap A, Bai P, Garai K, Belharazem D, Pongracz JE and Kvell K (2019) “Beige” Cross Talk Between the Immune System and Metabolism. Front. Endocrinol. 10:369. doi: 10.3389/fendo.2019.00369
Received: 11 March 2019; Accepted: 24 May 2019;
Published: 18 June 2019.
Edited by:
Jie Chen, Xiamen University, ChinaReviewed by:
Lluis Tort, Autonomous University of Barcelona, SpainMark Klitgaard Nøhr, University of Copenhagen, Denmark
Copyright © 2019 Banfai, Ernszt, Pap, Bai, Garai, Belharazem, Pongracz and Kvell. This is an open-access article distributed under the terms of the Creative Commons Attribution License (CC BY). The use, distribution or reproduction in other forums is permitted, provided the original author(s) and the copyright owner(s) are credited and that the original publication in this journal is cited, in accordance with accepted academic practice. No use, distribution or reproduction is permitted which does not comply with these terms.
*Correspondence: Krisztian Kvell, a3ZlbGwua3Jpc3p0aWFuQHB0ZS5odQ==