 Natalie K. Y. Wee
 Madelyn R. Lorenz
 Yusuf Bekirov
 Mark F. Jacquin3
 Erica L. Scheller
- 1Division of Bone and Mineral Diseases, Department of Medicine, Washington University School of Medicine, St. Louis, MO, United States
- 2Department of Reconstructive Sciences, UConn Health, Farmington, CT, United States
- 3Department of Neurology, Washington University School of Medicine, St. Louis, MO, United States
- 4Department of Cell Biology and Physiology, Washington University School of Medicine, St. Louis, MO, United States
Bone marrow adipose tissue (BMAT) is increased in both obesity and anorexia. This is unique relative to white adipose tissue (WAT), which is generally more attuned to metabolic demand. It suggests that there may be regulatory pathways that are common to both BMAT and WAT and also those that are specific to BMAT alone. The central nervous system (CNS) is a key mediator of adipose tissue function through sympathetic adrenergic neurons. Thus, we hypothesized that central autonomic pathways may be involved in BMAT regulation. To test this, we first quantified the innervation of BMAT by tyrosine hydroxylase (TH) positive nerves within the metaphysis and diaphysis of the tibia of B6 and C3H mice. We found that many of the TH+ axons were concentrated around central blood vessels in the bone marrow. However, there were also areas of free nerve endings which terminated in regions of BMAT adipocytes. Overall, the proportion of nerve-associated BMAT adipocytes increased from proximal to distal along the length of the tibia (from ~3–5 to ~14–24%), regardless of mouse strain. To identify the central pathways involved in BMAT innervation and compare to peripheral WAT, we then performed retrograde viral tract tracing with an attenuated pseudorabies virus (PRV) to infect efferent nerves from the tibial metaphysis (inclusive of BMAT) and inguinal WAT (iWAT) of C3H mice. PRV positive neurons were identified consistently from both injection sites in the intermediolateral horn of the spinal cord, reticular formation, rostroventral medulla, solitary tract, periaqueductal gray, locus coeruleus, subcoeruleus, Barrington's nucleus, and hypothalamus. We also observed dual-PRV infected neurons within the majority of these regions. Similar tracings were observed in pons, midbrain, and hypothalamic regions from B6 femur and tibia, demonstrating that these results persist across mouse strains and between skeletal sites. Altogether, this is the first quantitative report of BMAT autonomic innervation and reveals common central neuroanatomic pathways, including putative “command” neurons, involved in coordinating multiple aspects of sympathetic output and facilitation of parallel processing between bone marrow/BMAT and peripheral adipose tissue.
Introduction
Within the peripheral nervous system, sympathetic adrenergic signals are transmitted by several distinct sets of ganglia, which regulate regions in the head, trunk, viscera, and limbs. Common higher order processing centers are needed to ensure rapid, precise coordination of whole-body responses such as changes in vascular tone and energy metabolism. Consistent with this, the central nervous system (CNS) is recognized as a key mediator of peripheral adipose tissue function (1–7). The bone marrow is also an important site of peripheral adiposity with evidence for unique regulation and function [reviewed in (8)]. However, to date, very little is known about the neural control of bone marrow adipose tissue (BMAT) or its relationship to other adipose tissue depots across the central neuraxis.
The existence and prevalence of sympathetic neurons within the skeleton and bone marrow is well established (9–12). Ducy et al. first functionally demonstrated that central leptin administration reduced bone mass (13). This was later followed by other studies demonstrating that this effect was mediated via sympathetic nerves and modulation of β-adrenergic signaling (14, 15). Centrally, key neuropeptides associated primarily with the hypothalamus (e.g., NPY, CART, AgRP, POMC) have also been implicated in regulating bone homeostasis [reviewed in (16)]. Despite current work linking both the hypothalamus and sympathetic nerves to modulation of the bone microenvironment, the central regulatory regions influencing the skeleton are still relatively undefined.
We hypothesized that shared central neural pathways, relative to white adipose tissue (WAT), may be involved in BMAT regulation. To test this hypothesis, we performed viral transneuronal tract tracing from bone marrow and inguinal WAT. Viral tract tracing is a tool used to identify neural circuits. In particular, attenuated pseudorabies virus (PRV) recombinants such as the PRV-Bartha strain are well-established tracers that can be used for multi-synaptic directional tracing (17–19). After local PRV injection, all exposed viral axons within the site are infected. The virus then traffics to the cell body, replicates, and spreads across retrograde efferent synapses. This facilitates multi-synaptic tracing through the spinal cord and CNS. Whilst sensory cell bodies can be infected with PRV, they will not sort viral particles into central axons across afferent synapses and thus, viral transmission terminates in these cells. These properties make PRV tracers ideal for identifying and mapping efferent pathways from peripheral tissues, inclusive of those within the sympathetic nervous system (SNS).
Several previous reports have used tracing techniques to begin to map the higher order autonomic networks that regulate bone, adipose tissues, and other organs (4, 5, 20–27). However, shared regulatory regions between bone marrow/BMAT and peripheral WAT have not been identified. Thus, in this study, we first determined the proportion of BMAT adipocytes that are innervated by the SNS in C3H/HeJ (C3H) and C57BL/6J (B6) mice. Then, we used PRV to trace efferent neuroanatomical circuits from both tibial bone marrow (inclusive of BMAT) and inguinal WAT of C3H animals. Tracing from B6 femur/tibia was used as a control to examine strain- and skeletal site-specificity. To accomplish this, we used replication competent, isogenic, attenuated strains of the PRV virus (PRV-Bartha) in which the gG locus had been replaced with a fluorescent reporter (28).
Methods
Mice
The Institutional Animal Care and Use Committee (IACUC) at Washington University in St. Louis approved all procedures, and these experiments were performed in AAALAC accredited facilities. For all experiments, C3H/HeJ (C3H, Stock:000659) and C57BL/6J (B6, Stock:000664) mice were obtained from Jackson Labs; mice were acclimatized for 1 week prior to experiments. Mice were housed on a 12-h light/dark cycle at 70 ± 2 degrees Fahrenheit and fed standard chow (LabDiet® 5053). Relative to B6 mice, C3H mice are known to have a significant expansion of BMAT in the proximal tibia by 12-weeks of age (29).
Retrograde Viral Tract Tracing
Mice at 12-weeks of age underwent surgery and were euthanized for analysis 5–6 days after viral infection. This timing is sufficient to allow for retrograde transsynaptic transport of virus through 3 synaptic relays, up to 4 orders of neurons (1). Two isogenic pseudorabies retrograde tracing viruses were obtained from the NIH Center for Neuroanatomy with Neurotropic Viruses (CNNV): PRV-152 (30, 31) and PRV-614 (28). The PRV-152 virus has EGFP as the reporter, while mRFP is the reporter for PRV-614. C3H: Half the mice received PRV-152 into the tibia and PRV-614 into iWAT; whilst the other half received PRV-614 into the tibia and PRV-152 into iWAT. B6: Half the mice received PRV-152 into the proximal tibia and PRV-614 into distal femur; whilst the other half received PRV-614 into tibia and PRV-152 into femur. Figure 1A lists the viral loads injected at each site (fat vs. bone). A drilled bone defect model was used to place virus directly in bone using a pulled glass needle, microinjector, and stereotaxic apparatus to deliver 0.10 μL (PRV-152) or 0.15 μL (PRV-614) of viral solution at depths of 2.5, 3, and 3.5 mm from the top of the bone including the cartilage (Figures 1B–D). The injection site was sealed with bone wax to prevent leakage of the virus. For iWAT injections, 0.15 μL (PRV-152) or 0.20 μL (PRV-614) of virus was injected using a pulled glass needle at each of four sites along the length of the iWAT. All mice were given Buprenorphine SR (ZooPharm, 1.0 mg/kg) and monitored daily post-surgery until euthanasia. In our hands, 25% of injected C3H mice and 36% of injected B6 mice did not display evidence of infection in the brain. This could be due to failed ejection of the viral solution from the microinjector tip, failed viral infection, replication and/or spread, or mis-injection into the circulation. Previous work has shown that IV injection of PRV does not cause central neuronal infection (32).
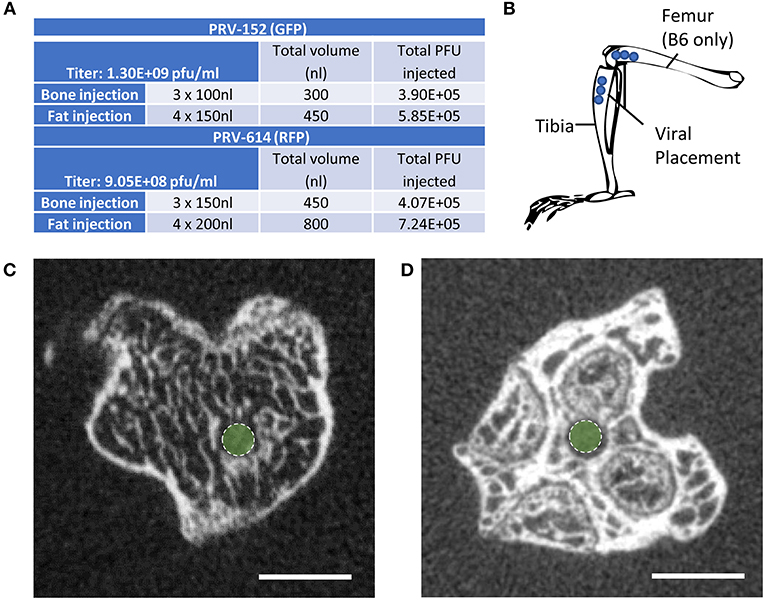
Figure 1. Virus placement and weight loss. (A) Viral titers and injection volumes. (B) Virus placement in the tibia at depths of 2.5, 3.0, and 3.5 mm from the top of the tibia or femur. Access to the tibial bone marrow was gained at the knee between the medial and lateral tibial condyles (B6 and C3H mice). Access to the femoral bone marrow was also via the joint surface (B6 mice only). (C) Representative computed tomography image of the needle tract into the tibial metaphysis (green dot). A pulled glass microinjector was used to minimize any disturbance to the surrounding bone and marrow. (D) Representative computed tomography of the needle tract into the femur (green dot).
Tissue Collection
Mice were sedated with Ketamine/Xylazine and perfused through the left ventricle with 25 mL of phosphate buffered solution (PBS) followed by 25 mL 4% paraformaldehyde (PFA) at a rate of 5.0 mL per minute using a peristaltic pump. Tissues were post-fixed overnight in 4% PFA and then placed in PBS for storage or processed and analyzed as described below.
MicroCT
Post-fixation, bones were embedded in 2% agarose gel. The proximal ends of the tibiae were scanned at 20 μm voxel resolution using a Scanco μCT 40 (Scanco Medical AG) calibrated using a hydroxyapatite phantom. Scans were used to verify placement of the needle into the bone (Figures 1C,D).
Immunostaining and Analysis
Tibia
To assess skeletal innervation, whole tibiae from 13-week old C3H and B6 male mice were sectioned transversely at 50 μm along the length of the bone. Tissues were processed in 30% sucrose and embedded in Tissue-Plus OCT compound (Fisher Scientific, Hampton, New Hampshire, USA, 23-730-571) prior to cutting. Sections were blocked in 10% normal donkey serum (Sigma, St. Louis, MO, USA, D9663) in TNT buffer (0.1M Tris-HCl pH 7.4; 0.15 NaCl; 0.05% Tween-20). The sections were then incubated for 48-h with primary antibodies to tyrosine hydroxylase (TH) and perilipin (Supplemental Table 1). Following three rinses in TNT buffer, primary antibody staining was visualized using fluorescently-tagged secondary antibodies. The sections were rinsed again with TNT buffer and incubated in DAPI (1:1,000 dilution; Sigma, St. Louis, MO, USA, D9542) for 5-min before mounting with Fluoromount-G (ThermoFisher Scientific, Waltham, Massachusetts, USA, 00-4958-02). Tiled sections were imaged at 10X on a Nikon spinning disk confocal microscope. Images were reconstructed and analyzed in ImageJ/FIJI (33). The number of perilipin positive adipocytes was counted manually in each section and the proportion adjacent to a TH+ axon was recorded (<5 μm spacing). It is important to note that only TH+ structures the bone marrow with a size and morphology that was consistent with an autonomic axon fiber were considered in our analysis (size ~1 μm in diameter, fibrous/branching, no nuclei—see Figure 2A as an example).
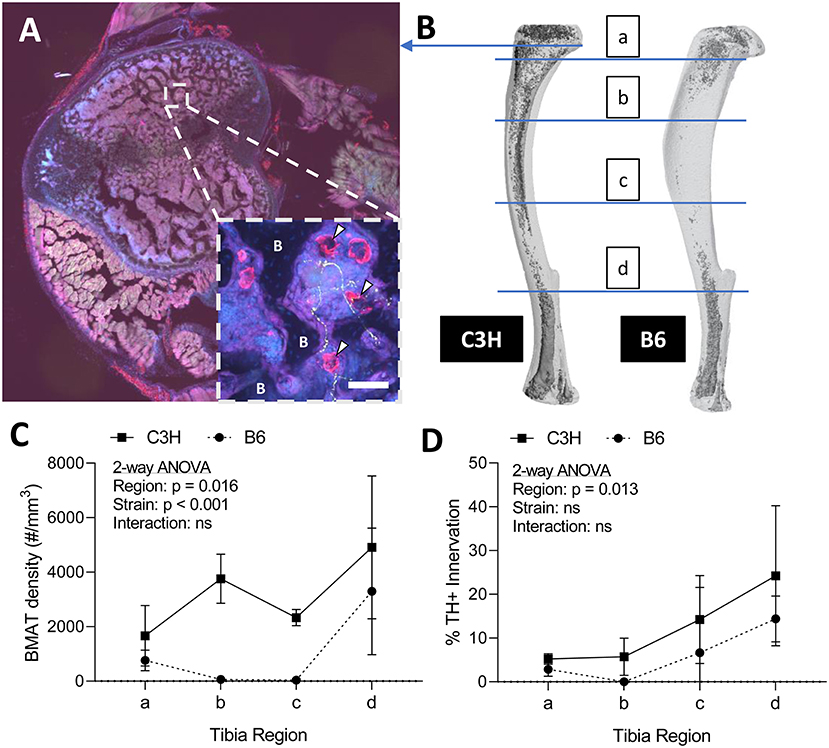
Figure 2. Innervation of BMAT adipocytes by sympathetic autonomic nerves. (A) Cross-section of the proximal tibial metaphysis with immunohistochemical stains for adipocytes (perilipin, red) and sympathetic adrenergic nerves (tyrosine hydroxylase, green) overlaid with dapi (blue). In some regions, perilipin+ adipocytes are observed immediately adjacent to TH+ axons (~1 μm in diameter, fibrous/branching, representative inset, white arrowheads). B, bone. Scale bar = 50 μm. (B) Representative distribution of bone marrow adipose tissue (BMAT) in a C3H and B6 male, 13-week old tibiae. Osmium stain and CT reconstruction. Immunohistochemical sections along the length of the tibia were analyzed for adiposity and TH+ innervation as indicated. (C) The number of perilipin positive adipocytes in a full tibial cross-section (see example in A) was counted in each region as indicated in B and normalized to the volume of the bone marrow. As previously reported Scheller et al. (29), C3H mice had increased density of BMAT adipocytes along the length of the tibia relative to B6 animals (2-way ANOVA). (D) In the same regions, the number of adipocytes <5 μm from a TH+ nerve were counted and expressed relative to the total number of adipocytes within the section [“% BMAT Innervation (TH+)”]. Despite differences in adipocyte density, the proportion of BMAT adipocytes that were adjacent to a TH+ axon remained relatively consistent between strains. In addition, the % of innervated BMAT adipocytes was highest in distal regions of the tibia of both B6 and C3H mice. N = 3, C3H; N = 5, B6. 2-way repeated measures ANOVA. Graphed as mean ± SD.
Spinal Cord
After perfusion, processing in 30% sucrose, and embedding in Tissue-Plus OCT compound, whole embedded spines were stored at −80°C until sectioning. The entire spinal cord was sectioned at 50 μm on a cryostat (Leica CM1850) and then collected onto Superfrost charged slides (Fisher Scientific, Hampton, New Hampshire, USA, 12-550-15). Every 8th section was stained. The sections were thawed at room temperature for 10-min, prior to immunostaining. Sections were first blocked in 10% normal donkey in TNT buffer. The sections were then incubated for 48-h in primary antibodies against RFP and GFP (Supplemental Table 1). Following three rinses in TNT buffer, primary antibody staining was visualized using fluorescently-tagged secondary antibodies. The sections were rinsed again with TNT buffer and incubated in DAPI for 5 min before mounting with Fluoromount-G. The sections were imaged with a Hamamatsu 2.0-HT NanoZoomer at 20x magnification. Spinal cord sections were analyzed using the Allen Spinal Cord Atlas as a reference database (34).
Brain
Dry ice (solid CO2) was crushed to make a powder; each brain was rolled in the CO2 and then left to freeze solid on dry ice. Each sample was mounted using Tissue-Plus OCT compound to a H/I Cryo-Histomat MK-3 (Hacker Instruments, Winnsboro, South Carolina, USA) and cut into slices of 30 μm thickness. Sections were split into six series and stored in cryoprotectant solution (0.2M phosphate buffer pH 7.4, ethylene glycol, sucrose) until stained. Sections were washed in TNT buffer and blocked in 0.1M PBS with 0.05% Tween 20 and 5% normal donkey serum. Primary antibodies to GFP, RFP, and/or TH were diluted in 0.1M PBS with 0.05% Tween 20 and 1% normal donkey serum and were incubated overnight at 4°C (Supplemental Table 1). Following rinsing in TNT buffer, sections were incubated with secondary antibody for 1-h at room temperature (Supplemental Table 1). Sections were then incubated with DAPI (1:1,000) and then arranged onto slides and coverslipped with Fluoromount-G. Imaging was performed with a Hamamatsu 2.0-HT NanoZoomer at 20x magnification. Sections spanning the entire brain were matched to images in The Mouse Brain in Stereotaxic Coordinates Brain by Paxinos and Franklin (35) in order to identify traced central sites. For figure generation, a subset of sections were imaged at 10X magnification on a Leica confocal microscope.
Statistics
Statistics were performed in GraphPad Prism®. Statistical tests are indicated in the figure legends. An unpaired t-test was used to assess differences in body mass.
Results
Sympathetic Adrenergic Innervation of Tibial BMAT Adipocytes in C3H and B6 Mice
Sympathetic adrenergic axons in bone and adipose tissues are rich in TH+ varicosities and terminate as free nerve endings (9, 36, 37). The proximity of the axon facilitates diffusion of neurotransmitters and subsequent actions on surrounding target cells, such as adipocytes. Thus, we performed immunohistochemical analysis of TH+ adrenergic nerve fibers and quantified their relationship to perilipin positive BMAT adipocytes at four sites along the length of the tibia. Consistent with previous reports (9, 38), we found that many of the TH+ axons were concentrated around central blood vessels in the bone marrow. However, there were also sparse areas of free nerve endings, particularly in the proximal metaphysis, which terminated in regions of BMAT adipocytes (Figure 2A). The relationship of BMAT adipocytes with TH+ axons was further explored by quantifying the percent of BMAT adipocytes that were directly adjacent to an axon (<5 μm away) along the length of the tibia in both C3H and B6 mice (Figures 2B–D). These included all adipocytes along the length of the neuron, not just at the axon terminal. As expected, the tibial adipocyte density was significantly greater in C3H mice relative to B6, particularly within the diaphysis (Figure 2C). However, despite this difference in density, the proportion of innervated BMAT adipocytes was comparable between strains and increased gradually from proximal to distal along the length of the tibia (Figure 2D). Specifically, from the proximal metaphysis to the region of the tibia/fibula junction, innervation increased from 5.2 ± 1.2% to 24.2 ± 16.0% in the C3H mice and 2.9 ± 1.4% to 14.4 ± 4.5% in B6 (Figure 2D).
PRV Tracing Identifies Central Pathways Mediating Efferent Innervation of Bone Marrow (Inclusive of BMAT) and iWAT
Infection Rate and Viral Characteristics
Male C3H mice at 12-weeks of age were injected with isogenic PRV viruses as detailed in Figures 1A,B. Half received PRV-152 (EGFP) into tibia and PRV-614 (mRFP) into iWAT, and the other half had PRV-614 (mRFP) into tibia and PRV-152 (EGFP) into iWAT. Though not uniformly reported or discussed in previous publications, PRV infection causes weight loss, lethargy, and eventually death in experimental animals (5, 19). C3H animals that were positively infected with one or both viruses demonstrated weight loss of 15 ± 1.6%, whilst mice negative for viral infection lost <3.9 ± 0.6% body weight (p = 0.003). At the end of the experiment, 75% of mice demonstrated positive infection with at least one virus that had progressed to the brain. Upon μCT verification of needle placement, one mouse was excluded due to needle perforation through the tibial cortical bone. The results from the remaining animals are described below.
Spinal Cord
Autonomic pathways consist of a two-neuron relay, which connects the tissue of interest to the spinal cord. In our experiments, the spinal cord was examined using serial thick frozen sections from the upper thoracic to the lower sacral regions. Labeling was observed to some extent at all levels of the thoracic, lumbar, and sacral spinal cord, except for the lowest sacral portions. Though a unilateral predominance was generally noted, the majority of the cases had progressed to a point where bilateral spread was evident. In all cases, cellular staining was notable in the sympathetic preganglionic neurons (SPNs) of the intermediolateral (IML) nuclei (Figure 3A). Connections from the IML were commonly present across the intercalated nucleus and labeling was also prominent within the central autonomic nucleus (lamina X). In the surrounding white matter, positive axons were noted to be crossing the lateral funiculus from the surface of the spinal cord (Figure 3B).
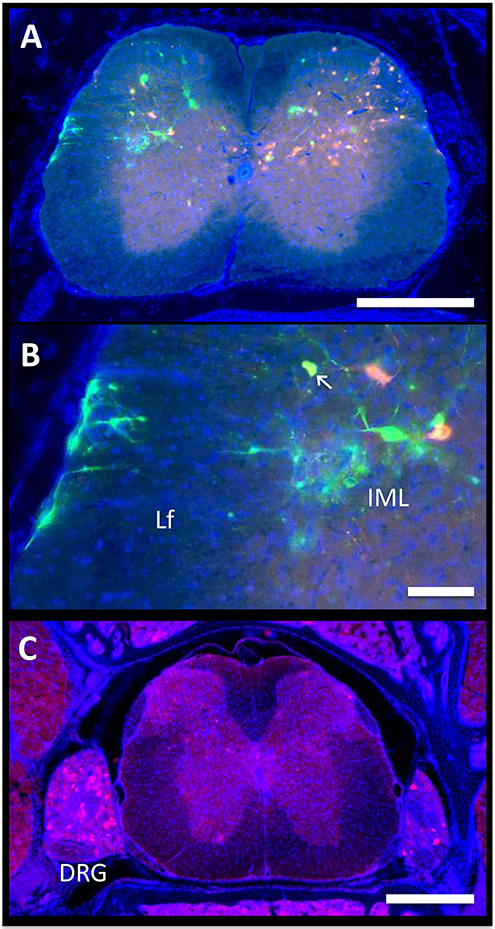
Figure 3. Spinal cord. The axon of the most distal neuron within bone or fat, also known as the postganglionic autonomic neuron, connects to its cell body in the sympathetic chain ganglia. Within the ganglion, this cell body synapses with a new neuron, the sympathetic preganglionic neuron (SPN). The cell bodies of the SPNs are located in the spinal cord in the intermediolateral (IML) nuclei. Spinal cord neurons are then controlled by supraspinal circuits from the brain, which send target axons to synapse on SPNs through descending pathways. These are ultimately responsible for the coordinated regulation of neuro-skeletal and neuro-adipose tissue interactions. (A,B) In the presented case, PRV-614 (RFP) was injected into the tibia, whilst PRV-152 (GFP) was injected into iWAT. Yellow neurons are neurons that have become infected with both viruses (arrow). Scale bar = 500 μm (A) and 100 μm (B). Lf, lateral funiculus. (C) We observed positive cells within dorsal root ganglia (DRG) ipsilateral to the site of infection. In some cases, we also observed positive DRG cells on the contralateral side. However, spread to the brain through ascending spinal cord pathways was not noted. Representative image, PRV-614 (RFP) into iWAT. Scale bar = 500 μm.
Positive axons were also observed in the lateral reticulospinal tract just outside of the IML, in laminae II, V, and VII, and occasionally in the ventral horn. In mice where dual labeling was present in the brain, the staining pattern was the same as described above. In addition, though the majority of labeled neurons in the spinal cord were of a single color/origin, a small subset of dual-labeled neurons was present.
Lastly, given our cross-sectional analysis paradigm, we were able to observe several of the dorsal root ganglia. Though the PRV virus used is only capable of crossing between neurons at retrograde synapses of efferent axons, it initially infects all axons within the target tissue, including sensory afferent neurons. Consistent with this, we observed positive staining in a subset of the dorsal root ganglia; infection within contralateral ganglia was also present in some cases (Figure 3C). However, further spread from these neurons through anterograde spinal cord pathways was not noted.
Medulla, Pons, and Midbrain
The spinal cord connects to the brainstem at the base of the skull, transitioning into the medulla. Consistent with previous studies (4, 5, 20–27), PRV infection occurred bilaterally within the brain, even though only the right tibia and right iWAT were injected. A summary of traced brain regions and their incidence is presented in Table 1. Within the medulla, we observed pronounced positive staining in the area postrema (AP), the nucleus of the solitary tract (NTS), including the medial and ventrolateral parts, and the reticular formation of the medulla, originating from both regions of BMAT and iWAT (Figures 4A,B; Table 1). Within the median reticular formation, the nucleus raphe obscurus (ROb), the raphe pallidus (RPa) and nucleus raphe magnus (RMg) were consistently traced with PRV (Figures 4A–C). Moderate staining was also consistently observed between samples in the gigantocellular reticular nucleus (GRN) and the lateral paragigantocellular nucleus (LPGi) (Figures 4A,B). Adjacent to the reticular formation, staining from bone marrow/BMAT and iWAT was notable in the rostroventral medulla (RVLM) (Figure 4B). In the pons, located between the medulla and the midbrain, tracing was prominent from both injection sites within the locus coeruleus (LC), subcoeruleus (SLC), and Barrington's nucleus (BN) (Figures 4C, 5A,B). As performed previously (22, 39), co-stains with TH were used to distinguish these three regions (Figure 5). In the midbrain, positive infection from bone marrow and iWAT was detected in the periaqueductal gray (PAG) (Figures 6A–C). Staining within the PAG was predominantly identified in the dorsomedial, lateral, and the ventrolateral areas.
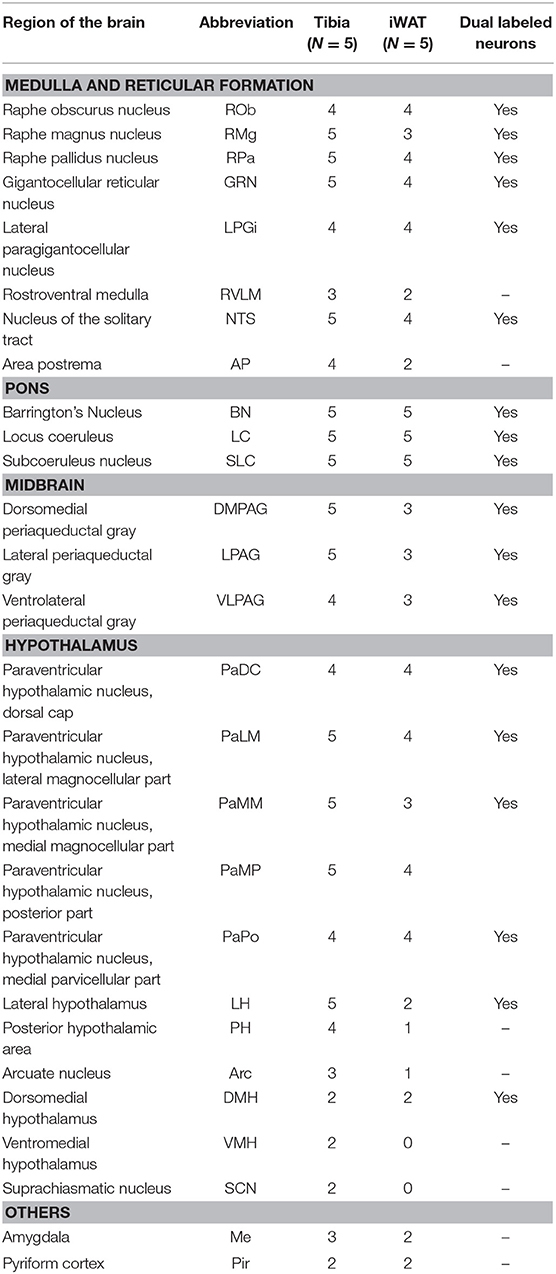
Table 1. Traced brain regions from C3H tibial bone marrow [tibia, inclusive of bone marrow adipose tissue (BMAT)] and inguinal white adipose tissue (iWAT).
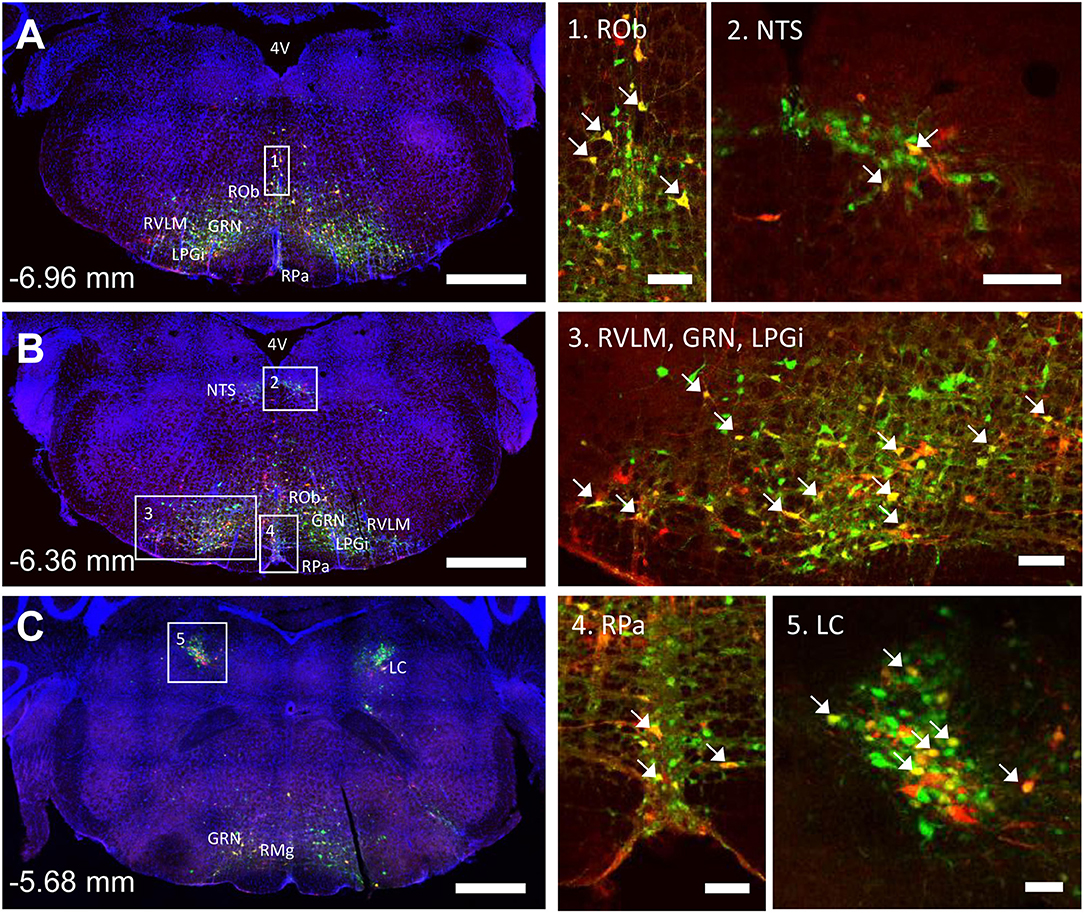
Figure 4. Co-infection of neurons from bone marrow/BMAT and iWAT in the medulla and pons. In the presented case, green neurons are traced from the tibia, whilst red neurons are from iWAT. Yellow neurons are those that have become infected with both viruses (white arrows). (A,B) Brainstem medulla, scale bar = 1 mm. (C) Pons, scale bar = 1 mm. Insets, scale = 100 μm: (1) Raphe obscurus (ROb), (2) nucleus of the solitary tract (NTS), (3) gigantocellular reticular nucleus (GRN), lateral paragigantocellular nucleus (LPGi) and rostral ventrolateral medulla (RVLM), (4) raphe pallidus (RPa), and (5) locus coeruleus (LC). RMg, raphe magnus.
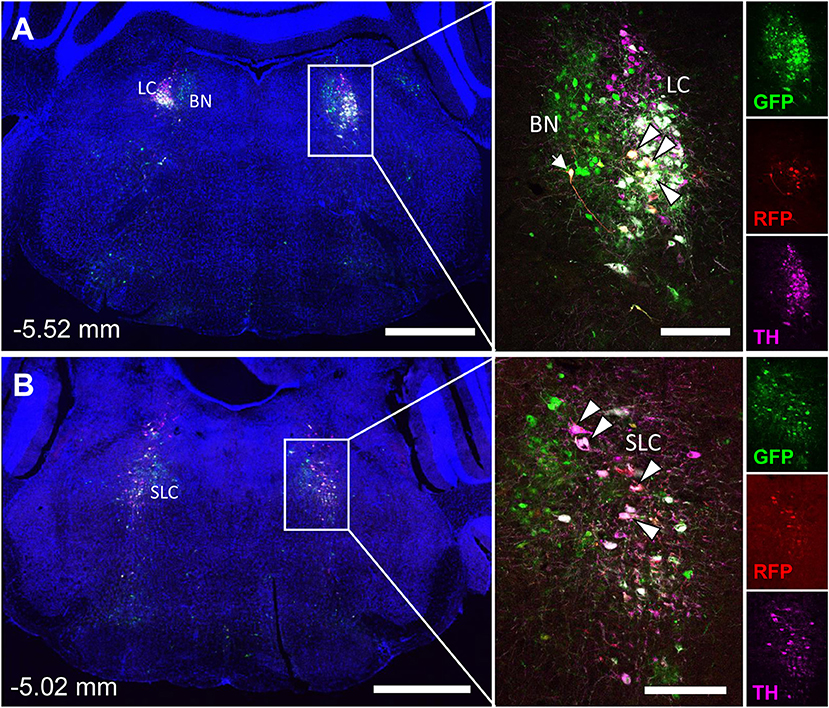
Figure 5. Tyrosine hydroxylase staining identifies co-infected ‘command neurons' in the locus coeruleus (LC), subcoeruleus (SLC), and Barrington's nucleus (BN). In the presented case, green neurons are traced from the tibia, whilst red neurons are from iWAT. A co-stain for tyrosine hydroxylase (TH) was used to define the boundaries of the locus coeruleus and subcoeruleus (LC and SLC, TH+) relative to Barrington's nucleus (BN, TH–). Yellow neurons are those that have become infected with both viruses without co-staining for tyrosine hydroxylase (TH) (white arrow). White neurons are those that are triple positive for GFP, RFP, and TH—indicating co-infection of a TH+ neuron within the LC or SLC as indicated (white arrowheads with black borders). (A) Overview of pons including the locus coeruleus (LC) and Barringtons nucleus (BN) at −5.52 mm from bregma. Scale bars: 1 mm and 200 μm (inset). (B) Overview of pons including the subcoeruleus (SLC) at −5.02 mm from bregma. Scale bars: 1 mm and 200 μm (inset). Individual channels for GFP (green), RFP (red), and TH (magenta) are shown for reference.
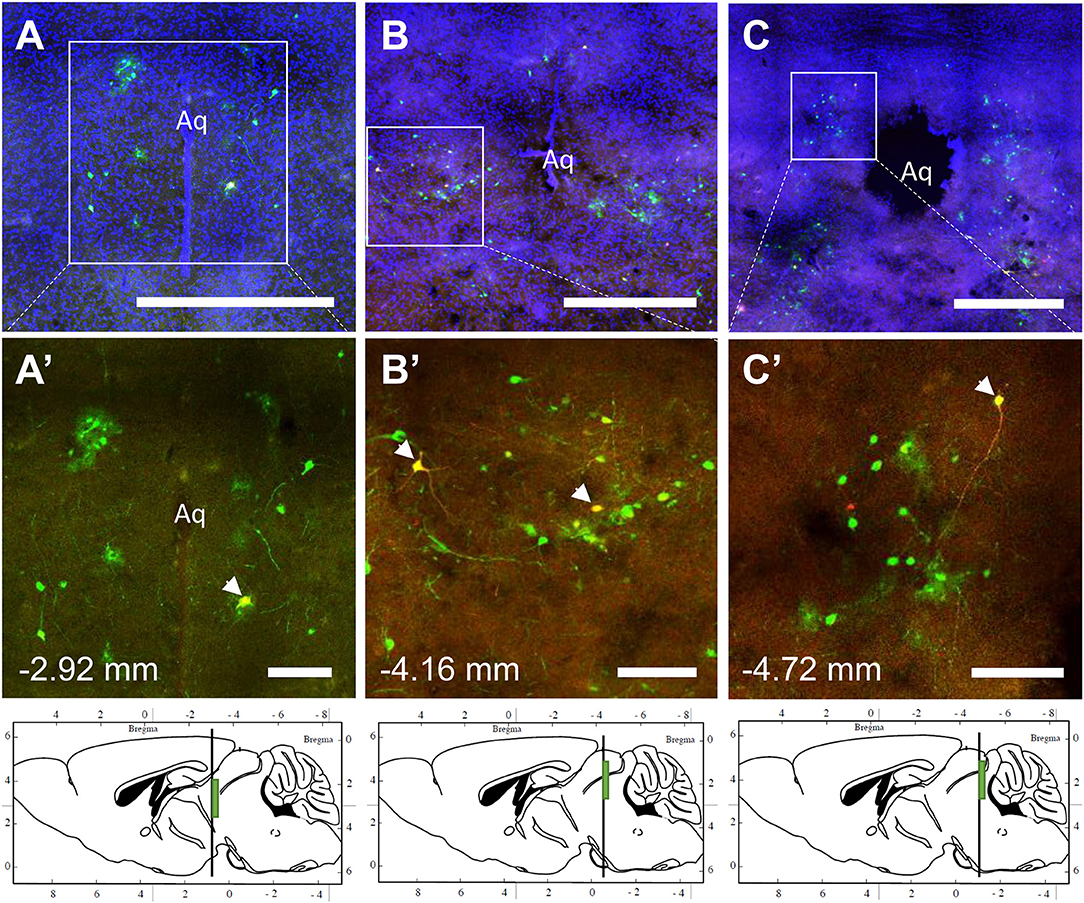
Figure 6. Co-infection of neurons from bone marrow/BMAT and iWAT in the periaqueductal gray (PAG). In the presented case, green neurons are traced from the tibia, whilst red neurons are from iWAT. Yellow neurons are those that have become infected with both viruses (white arrows). (A–C) Overview of tracing around the central aqueduct (Aq) at three regions including −2.92, −4.16, and −4.72 mm from bregma. Scale bar = 1 mm. (A'–C') Magnified insets showing individually traced neurons and those with co-infection from both sites (arrowheads). Scale bar = 200 μm. Green boxes on the sagittal sections denote the relative location of the displayed regions.
In multi-labeled samples, dual infected neurons from both injection sites were present in the medullary reticular formation (ROb, RMg, RPa, GRN, LPGi) and NTS (Figure 4). We similarly observed a subset of pontine LC, SLC, and BN neurons that were co-infected with viruses originating from bone marrow and iWAT (Figure 5). Lastly, several dual traced neurons were present in the PAG (Figure 6).
Hypothalamus and Forebrain
PRV infection was prominent within the hypothalamus, most notably within the paraventricular hypothalamus (PVH) (Figure 7; Supplemental Figures 1, 2). Infection of the PVH was bilateral from both bone marrow and iWAT; however, there was typically a discernable difference with a greater number of neurons stained on one side than the other (Supplemental Figure 1). This may be due to the virus crossing the midline via interneurons and then proceeding up into the brain, thus viral infection may lag on contralateral side, leading to the observed difference. In dual positive-infected mice, we observed a substantial number of neurons arising from the tibial injection and a number of neurons arising from iWAT in both posterior and medial parts of the PVH (Figures 7A–C). Again, similar to regions of the medulla and pons, we also identified neurons that were co-infected with both viruses (Figure 7; Table 1). Other regions of the hypothalamus with positive PRV infection include the lateral hypothalamus (LH), posterior hypothalamic area (PH), arcuate nucleus (ARC), dorsomedial hypothalamus (DMH), ventromedial hypothalamus (VMH), and suprachiasmatic nucleus (SCN) (Figure 7; Table 1). Lastly, we found robust labeling of neurons in the amygdala in a subset of animals (Figure 7B; Supplemental Figure 3). In close proximity to the amygdala, PRV-infected neurons were also present in the pyriform cortex in a 2/5 tracings from bone marrow/BMAT and iWAT (Table 1; Supplemental Figure 3).
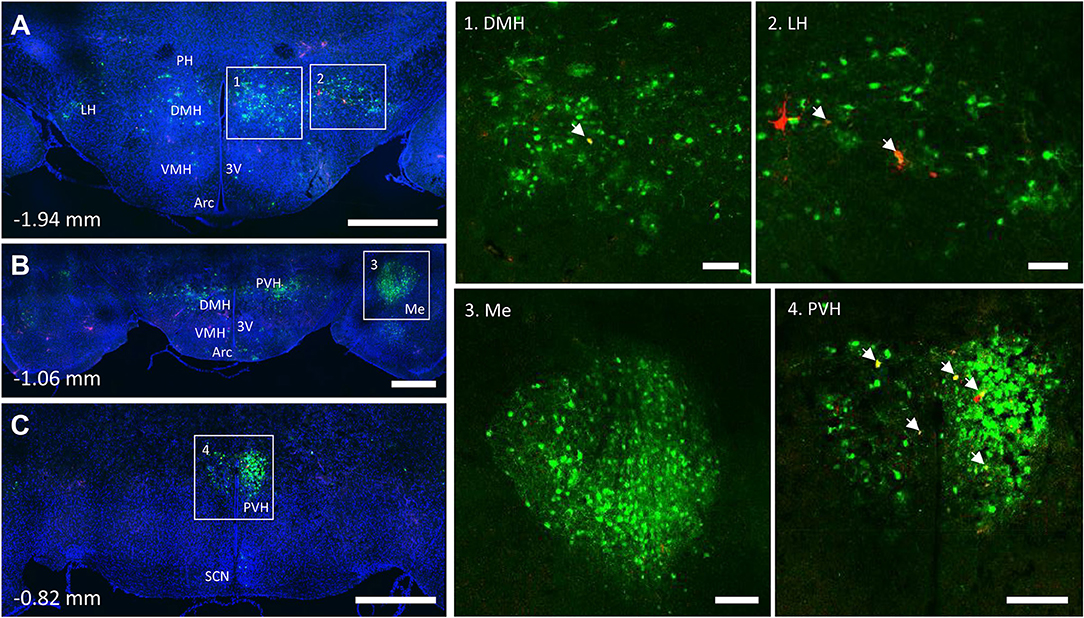
Figure 7. Co-infection of neurons from bone marrow/BMAT and iWAT in the hypothalamus. In the presented case, green neurons are traced from the tibia, whilst red neurons are from iWAT. Yellow neurons are those that have become infected with both viruses (white arrows). (A) Overview of hypothalamic tracing at −1.94 mm from bregma. Scale bar = 1 mm. (B) Overview of hypothalamic tracing, including amygdala, at −1.06 mm from bregma. Scale bar = 1 mm. (C) Medial portion of the paraventricular hypothalamus and suprachiasmatic nucleus at −0.82 mm from bregma. Scale bar = 1 mm. Insets: (1) dorsomedial hypothalamus (DMH), scale = 100 μm, (2) lateral hypothalamus (LH), scale = 100 μm, (3) amygdala (Me), scale = 200 μm and (4) paraventricular hypothalamus (PVH), scale = 200 μm. Regions identified include: third ventricle (3V), arcuate nucleus (Arc), dorsomedial hypothalamus (DMH), lateral hypothalamus (LH), amygdala (Me), posterior hypothalamus (PH), paraventricular hypothalamus (PVH), and suprachiasmatic nucleus (SCN).
PRV Tracing From B6 Femur and Tibia Mimics That Observed From C3H Mice
To examine the strain- and skeletal site-specificity of PRV, we traced to the brain from the proximal tibia and distal femur of a matched set of male 12-week-old, B6 mice. As above, some mice received PRV-152 (EGFP) into tibia and PRV-614 (mRFP) into femur while in others this was reversed. At the end of the experiment, needle placement was confirmed with μCT. Due to minor issues with tissue processing, the medulla and reticular formation could not be included in these analyses. However, in the pons, infection from the tibia and femur was observed in the BN, LC, and SLC (Table 2). Staining from both sites was also identified in the midbrain, specifically within the PAG (Table 2). As in C3H mice, the hypothalamus contained positive PRV infection predominantly in the PVH (Table 2; Supplemental Figure 4). Additional traced neurons were identified in the LH, PH, DMH, and SCN from a subset of animals (Table 2). Lastly, one of four cases from the tibia and two of three from the femur resulted in PRV infection in the amygdala (Table 2).
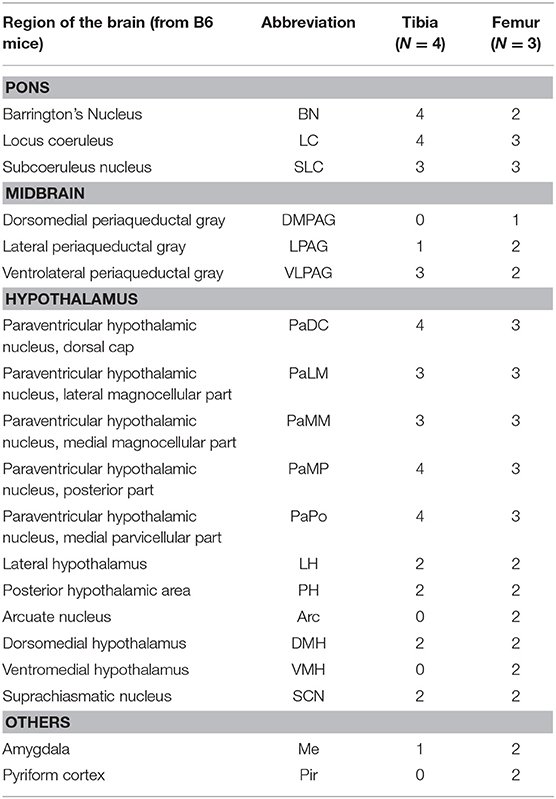
Table 2. Traced brain regions—B6 tibia and femur bone marrow (inclusive of BMAT).
Discussion
Shared innervation has been established between peripheral WAT and BAT adipose tissues (1–7). However, to date, our understanding of neural interactions with bone marrow/BMAT has been limited. We have previously demonstrated that cold exposure, a model of elevated sympathetic tone and catecholamine release, depleted BMAT from the proximal end of the tibia (29). More recently, it was shown that bone marrow adipocytes respond to isoproterenol (pan-adrenergic agonist—β1, β2, and β3) by increased phospho-hormone sensitive lipase, whilst the response following treatment with a β3 agonist, a major regulator of lipolysis in other adipose tissues, was present at a lower level (40). Together, this information suggests that there is likely some shared regulation of adipose tissues within the body but also that there may be subtle differences between BMAT and other adipose depots. Building on previous work, this study has been able to establish the presence of shared autonomic pathways between BMAT and iWAT. Dual labeled “command” neurons were noted regions such as the reticular formation, NTS, LC, PBN, SLC, BN, and hypothalamus—indicating that common neurons may be involved in the central regulation of both sites. Though the prevalence of dual infection reflects a wide range of variables including initial infection and viral trafficking, the overlap in our current study appears to range from 7 to 18% depending on the region (Figures 4–7). This is consistent with previous work on dual injections of PRV into different adipose depots which identified an incidence of 5–55% of dual-infected neurons, indicative of shared innervation between fat depots (41). The results provide the foundation for future studies to evaluate the functional roles of the identified central regulatory regions on BMAT, particularly within the contexts of shared regulation of WAT, bone, and bone marrow.
Innervation of BMAT
The presence of sympathetic neurons in the skeleton is well established (9–12). Similarly, the innervation of WAT adipocytes is well-documented (42, 43). In WAT, EM studies demonstrate that ~5% of WAT adipocytes are immediately adjacent to a sympathetic nerve axon (43). By contrast, beige or brown adipocytes have an innervation rate that approaches 100%, often with multiple nerve fibers per cell (43, 44). Our results suggest that TH+ innervation of BMAT is more similar to what has been documented for WAT, with ~5–25% of the BMAT adipocytes located immediately adjacent to a TH+ axon (Figure 2). This helps to define when and where locally-released neurotransmitters have the potential to act directly on the cells. Conversely, it suggests that upwards of 70% of BMAT adipocytes are relatively disconnected from the local adrenergic nerve supply (though regulatory impulses could be communicated indirectly or by diffusion). In the metaphysis, TH+ axons were occasionally observed to branch and terminate in regions of BMAT. In the diaphysis, the trajectory of the axons was generally restricted to the arterial vasculature, with less branching. It is unknown whether positioning of a BMAT adipocyte near an axon along its length vs. at the termini impacts the ability of the neuron to act on the cell. In other organ systems, axons have been shown to release neurotransmitters along their entire length (45). More work is needed, however, based on this data it is clear that TH+ neurons are well-positioned to signal to a subset of BMAT cells.
Shared Pathways—Vasoregulatory Responses
A key strength of these experiments is our ability to examine the results within the context of the extensive range of previously published PRV tracing studies across most major organ systems. Upon doing so, several patterns emerge. First, there are multiple regions that have been traced in nearly all studies to date. This includes early infection in areas of the pontine and medullary reticular formation, RVLM, raphe nuclei, and PVH from organs including spleen (21, 22), kidney (23, 24), adrenal gland (25), BAT (5, 27), sympathetic ganglia (25), pancreas (26), lumbar muscle (46), and iWAT/eWAT (4). These structures represent a common neural circuit controlling sympathetic autonomic outflow to a diverse set of organs (Figure 8). One likely explanation for this is the need for coordinated, whole-body regulation of vascular tone by the autonomic nervous system (47). For example, functional studies in cats and primates demonstrate that stimulation of the PVH causes systemic vasopressor responses that are mediated by the descending autonomic vasomotor fibers on the surface of the spinal cord, which synapse on SPNs in the IML to signal to peripheral tissues (48). In our study, this is consistent with prominent labeling in regions including the PVH (Figure 7), the surface of the lateral funiculus of the spinal cord, the SPNs of the IML nucleus and the medially associated cord/SPN regions such as the intercalated nucleus and central autonomic area (lamina X) (Figure 3) (49). Similarly, the pre-sympathetic neurons of the RVLM, traced from both sites in this study, are a key source of excitatory inputs to the SPNs in the spinal cord that help to maintain baseline arterial pressure (Figure 4) (50).
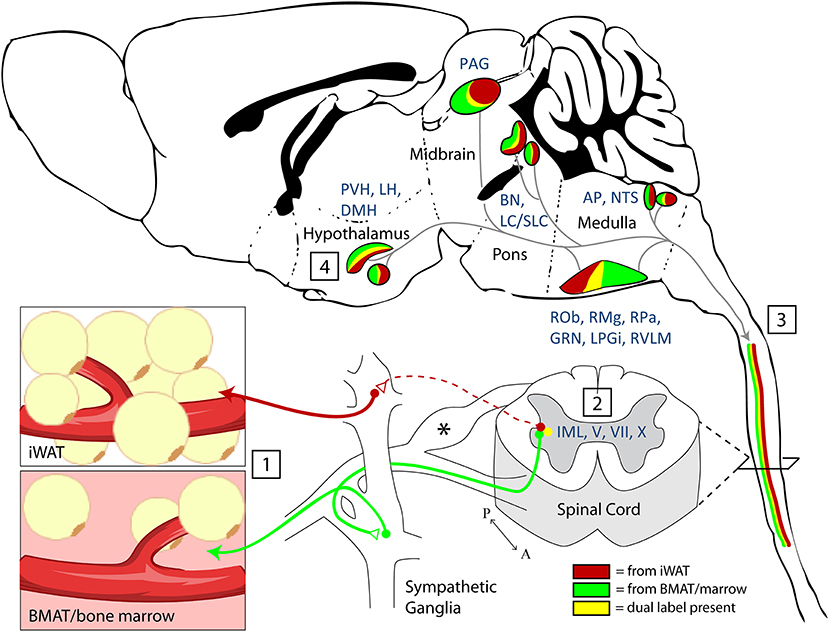
Figure 8. Summary and model. (1) Nerve endings were infected by PRV-bartha virus after local injection into inguinal white adipose tissue (iWAT) or regions of BMAT in the proximal tibia. (2) Infection of sympathetic post-ganglionic axons and their ganglionic cell bodies progressed to infect the sympathetic preganglionic neurons (SPNs) within the intermediolateral nucleus (IML) of the spinal cord. Infection within the spinal cord was also noted across the intercalated nucleus and in laminae V, VII, and X. *Infection was also present in the dorsal root ganglia. This is due to the ability of PRV-Bartha to infect free endings of afferent neurons. However, after this, it is not able to traffic across afferent synapses toward the brain. (3) Viral tracing ascended through efferent pathways to central brain regions (4). The full list of traced regions is available in Tables 1, 2. Functionally, traced central regions are capable of coordinating autonomic signals through shared pathways, which descend to the target tissues. These regions have previously been implicated in regulation of vascular tone, lipolysis, and bone turnover.
Many of these areas have also been implicated in reflex autonomic control of vascular tone, a collection of diverse mechanisms by which the body integrates information from peripheral sensory inputs to subsequently coordinate autonomic responses. Within the spinal cord, for example, stimulation of sensory roots can influence the activity of autonomic SPNs (48). Locally, this may be explained by modulation of SPNs by autonomic interneurons within the dorsal horn (Figure 3) [discussed in (51, 52)]. To date, pre-sympathetic interneurons have been identified in laminae V, VII, and X. In our study, we also observed tracing in these laminae (Figure 3), emphasizing the potential for integration and modulation of sensory and sympathetic signals to iWAT/BMAT within the spinal cord (48). Integration also occurs within the brain. From this study, labeled central sites including the LC, NTS, RVLM, and medullary raphae (ROb, RMg, RPa) have the potential to integrate peripheral sensory inputs (e.g., somatosensory stimuli, peripheral chemoreceptors, arterial baroreceptors) with subsequent regulation of autonomic responses, including vascular tone (47, 50, 53–55). Thus, our work puts bone marrow/BMAT and iWAT into the same vasoregulatory network as organs including the spleen, kidney, adrenal gland, BAT, muscle and pancreas; however, future functional studies are needed to explore differences, if any, in the magnitude and timing of centrally-evoked responses.
Shared Pathways—Energy Utilization and Lipolysis
Nerve endings in both WAT and bone marrow exist as free terminals and lack conventional synapses with surrounding cells [reviewed in (56)]. Thus, peripheral neurotransmission is mediated by bulk release and diffusion of signaling factors. The catecholamine norepinephrine has a well-established role in mediating SNS activity to peripheral tissues. Norepinephrine controls local SNS-mediated vasoregulation (57), SNS-mediated lipolysis (56, 58), and SNS-mediated thermogenesis/beiging (59). Though its expression is not restricted to neurons, there is also evidence that neuropeptide Y (NPY), another sympathetic neurotransmitter, can regulate peripheral adipose tissues both via central circuits and locally through direct actions on adipocytes and surrounding cells (60, 61). This emphasizes that those central pathways which cause bulk peripheral neurotransmitter release, as described above for vasoregulation, may also promote lipolysis and/or adipose tissue thermogenesis. Few studies have examined the effect of sympathetic neurotransmitters on BMAT directly and this is an area that could be the further explored in the future.
Central integration of peripheral inputs is similarly critical to ensure optimal autonomic contributions to energy partitioning. A key mediator of this relationship is the adipocyte-secreted hormone leptin. Our viral tracing demonstrated prominent labeling from iWAT and bone marrow/BMAT in leptin-responsive regions such as the PVH, ARC, DMH, VMH, and AP. In addition to known actions on food intake, leptin has been implicated in the central regulation of bone marrow and peripheral adipocytes. Studies examining leptin deficient models (ob/ob) have found increased BMAT (62, 63). Leptin treatment of ob/ob mice reduces BMAT number and size due to lipid mobilization and apoptosis whilst simultaneously increasing bone formation (63, 64). In addition, leptin delivery to the VMH of healthy rats for 5 days induces a significant depletion of peripheral fat pads and also BMAT (65); this functionally demonstrates that central regulatory regions such as the VMH, also identified in our study, can simultaneously influence both BMAT and peripheral adipose tissues.
Regulation of Skeletal Homeostasis
While our focus is on adipose tissue comparisons, it should be noted that the bone injections would label nerves that interact with a heterogeneous population of cells: bone cells, bone marrow, and BMAT. Signaling in the VMH, for example, may link bone marrow with splenic innervation. Functionally, the VMH has been shown to suppress splenic lymphocyte activity (66) and natural killer cell cytotoxicity (67) demonstrating a clear role for sympathetic regulation of hematopoietic cells in spleen that may mirror what has been described for bone marrow (68).
In addition to hematopoiesis, for the past two decades, there have been numerous studies demonstrating the effects of central regulation on bone mass; interactions between the brain and bone mass have primarily focused on the hypothalamus (13, 14, 69). Consistent with this, we observed robust staining from bone to hypothalamic regions: LH, PH, ARC, DMH, VMH, and SCN. To date, the arcuate nucleus has a well-established role in regulating bone mass through AgRP/NPY neurons (70, 71) and more recently Kiss neurons (72). Interestingly, deletion of the estrogen receptor from Kiss1 neurons had sex-specific effects on bone mass with females having a striking 500% increase in cancellous bone mass in the distal femur, whilst males had normal bone mass in comparison to control WT mice (72). These studies, while focused on a single regulatory center of the brain, the arcuate nucleus, demonstrate the potential impact of modulating neuronal activity on the bone microenvironment. This same region is strongly linked to the regulation of energy homeostasis and the modulation of BAT and WAT, thus is a good candidate to further study to elucidate the effect of arcuate neurons on BMAT.
Similar to other adipose tissues, the bone microenvironment is also influenced by circulating cues such as leptin, which can influence sympathetic tone and also act directly on progenitor cells within the skeleton [reviewed in (73)]. Early work by Karsenty et al. demonstrated that leptin could inhibit bone formation via a central hypothalamic relay (13); this work predominantly examined the effects on vertebral bone mass, a site in the mouse that does not typically have many bone marrow adipocytes. The effects of leptin on bone have been complicated and been much debated; in ob/ob mice restoration of peripheral leptin signaling has an anabolic effect on bone mass (74), which opposes the central effects. This was also demonstrated when Prrx1-cre or Col3.6-cre was used to remove the leptin receptor; these mice had a significant increase in bone mass (75, 76).
In addition to the hypothalamus, the area postrema (AP) is another region that can respond to physiological factors as they enter the CNS and can influence autonomic control (77). The subpostrema, a V-shaped area, is located adjacent to the AP and on the upper limit of the commissural part of the NTS; it too is involved in autonomic regulation and provides bidirectional connections between area postrema and the NTS (78). Recently, Zhang et al. determined that Neuropeptide FF receptor 2 (Npffr2) signaling regulated NPY neuron activity in the arcuate nucleus and influenced BAT activity via the PVH (79). In addition to Npffr2 expression in the ARC, retrograde tracing from the ARC demonstrated that brainstem regions such as the area postrema, subpostrema, and NTS could provide input and regulate ARC neurons (79). Npffr2 deficient mice on a high fat diet show increased adiposity, reduced whole body energy expenditure, reduced UCP-1 protein in BAT and increases in cancellous bone mass (79). This study shows that brainstem neurons are able to influence the hypothalamus and regulate the bone microenvironment.
Other factors also implicated in energy homeostasis have been shown to influence the bone microenvironment via central signaling. Kajimura et al. (80) showed that adiponectin could influence sympathetic tone by regulating neurons within the locus coeruleus; leading to an inhibition of bone formation and increased bone resorption through RANKL (80). Notably, the central actions of adiponectin were apparent in older adiponectin deficient mice and differed from younger mice. Young adiponectin deficient mice had reduced bone mass, consistent with the direct effects of adiponectin to inhibit proliferation and induce apoptosis in osteoblasts (80). Similarly, hypocretin (also known as orexin) has been reported to reduce serum leptin levels via central signaling and reduce cancellous bone mass (81). Although sympathetic tone was not evaluated in that study, the changes in central orexin signaling were abolished in leptin deficient (ob/ob) mice suggesting that changes in leptin levels are affecting sympathetic tone (81). These studies highlight the notion that peptides can act through multiple pathways and thus, our study is a good tool for identifying potential regulatory regions that influence BMAT to assist with examining and targeting these central effects.
Limitations
While we hypothesize that there may be unique sites that signal to the BMAT environment in a context-specific manner, our viral tract tracing is limited as it is only able to establish the presence of infection and co-infection vs. iWAT. For example, we identified infected neurons from bone marrow/BMAT in only 2 out of 5 cases of positive PRV infection in the VMH, but not when traced from iWAT (Table 1). However, previous work has shown that stimulation of the leptin-responsive neurons in the VMH significantly affects both WAT and BMAT adipose tissue depots (65). Thus, the absence of infection in neuronal tracing studies does not mean that a region is functionally unimportant. In addition, while we can focus and integrate information known about single neural sites, it is also important to consider that these central regulatory regions are connected and interact with each other, i.e., the arcuate nucleus sends projections to other regions within the hypothalamus (82), that subsequently project to other parts such as the locus coeruleus, solitary tract, and reticular formation. Thus, several regions may actually work together to regulate bone, bone marrow and BMAT. Lastly, though expression of TH has been widely used to characterize peripheral nerves within bone, bone marrow, and the periosteum (9, 11, 83, 84), it has the potential to be upregulated with nerve stimulation (85). Thus, it is possible that the proportion of TH+ nerve-associated BMAT adipocytes may be higher in settings of increased sympathetic tone.
Prospectus and Conclusion
A large proportion of work into understanding the neural regulation of adipose tissue was originally performed in Siberian hamsters. Siberian hamsters (Phodopus sungorus) display large variations in body composition depending on the photoperiod they are exposed to: hamsters exposed to long days can have around 50% adiposity whilst exposure to shorter days leads to around 20% adiposity (86, 87). This connection between circadian rhythm and adiposity suggested a potential role for the CNS in regulating adipose tissue. While there are distinctive roles of the SNS in regulating brown adipose tissue (BAT) function in comparison to WAT, PRV retrograde tracing reveals that the central regulatory regions are similar between these peripheral adipose depots (5, 27). Consistent with this, we demonstrate that PRV tracing from bone marrow/BMAT identifies many of the same regions. In addition, we define a novel population of dual PRV-infected “command” neurons that are connected to both bone marrow/BMAT and iWAT. These neurons may coordinate multiple aspects of sympathetic output and facilitate parallel processing for local effects such as lipolysis, thermogenesis and vasoregulation (88–92). Moving forward, more work is needed, both at the level of the brain and locally within the bone marrow, to understand how and in what contexts neural impulses are necessary regulators of BMAT function.
Data Availability Statement
The datasets generated for this study are available on request to the corresponding author.
Ethics Statement
The Institutional Animal Care and Use Committee (IACUC) at Washington University in St. Louis approved all procedures, and these experiments were performed in AAALAC accredited facilities.
Author Contributions
NW and ES conception of the work. NW, ML, YB, MJ, and ES acquisition and analysis of data, approved final copy of manuscript. NW, MJ, and ES interpretation of the data and drafting of the manuscript.
Funding
This work was funded by grants from the National Institutes of Health including R01NS091439, P40-RR018604, R00-DE024178, U01-DK116317, and P30-AR057235.
Conflict of Interest
The authors declare that the research was conducted in the absence of any commercial or financial relationships that could be construed as a potential conflict of interest.
Acknowledgments
We would like to thank Ron Perez and the Hope Center Neurosurgical Core at Washington University in St. Louis for assistance with the viral injections. Thank you to Zhaohua Wang for technical assistance with the dissections. We would like to thank the Hope Center Alafi Neuroimaging Core for access to the Nanozoomer. Viruses were obtained from the CNNV and we appreciate the feedback received from Dr. Lynn Enquist (cnnv.pitt.edu, funded by P40-RR018604).
Supplementary Material
The Supplementary Material for this article can be found online at: https://www.frontiersin.org/articles/10.3389/fendo.2019.00668/full#supplementary-material
Supplemental Figure 1. Paraventricular hypothalamus from all C3H mice injected with PRV into the tibia or iWAT. Medial portion of the paraventricular hypothalamus from each mouse injected with either PRV-152 (GFP) or PRV-614 (RFP) and the site of injection, tibia or iWAT. Scale bar: 1 mm.
Supplemental Figure 2. PRV infection from bone marrow/BMAT traces to various parts within paraventricular hypothalamus. PRV-152 (GFP) was injected into the tibia and the following sites showed PRV infection: (A) Suprachiasmatic nucleus (SCN) and paraventricular hypothalamic nuclei: dorsal cap (PaDC), lateral magnocellular part (PaLM), and medial magnocellular part (PaMM); (B) Posterior paraventricular hypothalamic nuclei: posterior part (PaMP) and medial parvicellular part (PaPo).
Supplemental Figure 3. Amygdala and pyriform cortex traced from tibia. (A) Overview of brain slice. (B) Amygdala. (C) Overview of pyriform cortex relative to amygdala. (D) Pyriform cortex.
Supplemental Figure 4. Paraventricular hypothalamus from all B6 mice injected with PRV into the tibia or iWAT. Medial portion of the paraventricular hypothalamus from each mouse injected with either PRV-152 (GFP) or PRV-614 (RFP) and the site of injection, tibia or iWAT. Scale bar: 1 mm.
Supplemental Table 1. Antibodies used for immunostaining.
References
1. Wiedmann NM, Stefanidis A, Oldfield BJ. Characterization of the central neural projections to brown, white, and beige adipose tissue. FASEB J. (2017) 31:4879–90. doi: 10.1096/fj.201700433R
2. Ryu V, Watts AG, Xue B, Bartness TJ. Bidirectional crosstalk between the sensory and sympathetic motor systems innervating brown and white adipose tissue in male Siberian hamsters. Am J Physiol Regul Integr Comp Physiol. (2017) 312:R324–37. doi: 10.1152/ajpregu.00456.2015
3. Ryu V, Bartness TJ. Short and long sympathetic-sensory feedback loops in white fat. Am J Physiol Regul Integr Comp Physiol. (2014) 306:R886–900. doi: 10.1152/ajpregu.00060.2014
4. Bamshad M, Aoki VT, Adkison MG, Warren WS, Bartness TJ. Central nervous system origins of the sympathetic nervous system outflow to white adipose tissue. Am J Physiol. (1998) 275:R291–9. doi: 10.1152/ajpregu.1998.275.1.R291
5. Bamshad M, Song CK, Bartness TJ. CNS origins of the sympathetic nervous system outflow to brown adipose tissue. Am J Physiol. (1999) 276:R1569–78. doi: 10.1152/ajpregu.1999.276.6.R1569
6. Bartness TJ, Ryu V. Neural control of white, beige and brown adipocytes. Int J Obesity Suppl. (2015) 5:S35–9. doi: 10.1038/ijosup.2015.9
7. Bartness TJ, Shrestha YB, Vaughan CH, Schwartz GJ, Song CK. Sensory and sympathetic nervous system control of white adipose tissue lipolysis. Mol Cell Endocrinol. (2010) 318:34–43. doi: 10.1016/j.mce.2009.08.031
8. Scheller EL, Cawthorn WP, Burr AA, Horowitz MC, MacDougald OA. Marrow adipose tissue: trimming the fat. Trends Endocrinol Metab. (2016) 27:392–403. doi: 10.1016/j.tem.2016.03.016
9. Mach DB, Rogers SD, Sabino MC, Luger NM, Schwei MJ, Pomonis JD, et al. Origins of skeletal pain: sensory and sympathetic innervation of the mouse femur. Neuroscience. (2002) 113:155–66. doi: 10.1016/S0306-4522(02)00165-3
10. Zhu Y, Ma Y, Elefteriou F. Cortical bone is an extraneuronal site of norepinephrine uptake in adult mice. Bone Rep. (2018) 9:188–98. doi: 10.1016/j.bonr.2018.11.002
11. Chartier SR, Mitchell SAT, Majuta LA, Mantyh PW. The changing sensory and sympathetic innervation of the young, adult and aging mouse femur. Neuroscience. (2018) 387:178–90. doi: 10.1016/j.neuroscience.2018.01.047
12. Robles H, Park S, Joens MS, Fitzpatrick JAJ, Craft CS, Scheller EL. Characterization of the bone marrow adipocyte niche with three-dimensional electron microscopy. Bone. (2019) 118:89–98. doi: 10.1016/j.bone.2018.01.020
13. Ducy P, Amling M, Takeda S, Priemel M, Schilling AF, Beil FT, et al. Leptin inhibits bone formation through a hypothalamic relay: a central control of bone mass. Cell. (2000) 100:197–207. doi: 10.1016/S0092-8674(00)81558-5
14. Takeda S, Elefteriou F, Levasseur R, Liu X, Zhao L, Parker KL, et al. Leptin regulates bone formation via the sympathetic nervous system. Cell. (2002) 111:305–17. doi: 10.1016/S0092-8674(02)01049-8
15. Elefteriou F, Ahn JD, Takeda S, Starbuck M, Yang X, Liu X, et al. Leptin regulation of bone resorption by the sympathetic nervous system and CART. Nature. (2005) 434:514–20. doi: 10.1038/nature03398
16. Wee NK, Kulkarni RN, Horsnell H, Baldock PA. The brain in bone and fuel metabolism. Bone. (2016) 82:56–63. doi: 10.1016/j.bone.2015.10.020
17. Card JP, Enquist LW. Transneuronal circuit analysis with pseudorabies viruses. Curr Protoc Neurosci. (2001) Chapter 1:Unit1.5. doi: 10.1002/0471142301.ns0105s09
18. Card JP, Enquist LW. Use and Visualization of Neuroanatomical Viral Transneuronal Tracers. In: Badoer E, editor. Visualization Techniques. Totowa, NJ: Humana Press (2012). p. 225–68.
19. Card JP, Enquist LW. Transneuronal circuit analysis with pseudorabies viruses. Curr Protoc Neurosci. (2014) 68:1.5.1–39. doi: 10.1002/0471142301.ns0105s68
20. Dénes A, Boldogkoi Z, Uhereczky G, Hornyák A, Rusvai M, Palkovits M, et al. Central autonomic control of the bone marrow: multisynaptic tract tracing by recombinant pseudorabies virus. Neuroscience. (2005) 134:947–63. doi: 10.1016/j.neuroscience.2005.03.060
21. Cano G, Sved AF, Rinaman L, Rabin BS, Card JP. Characterization of the central nervous system innervation of the rat spleen using viral transneuronal tracing. J Comp Neurol. (2001) 439:1–18. doi: 10.1002/cne.1331
22. Cano G, Card JP, Rinaman L, Sved AF. Connections of Barrington's nucleus to the sympathetic nervous system in rats. J Auton Nerv Syst. (2000) 79:117–28. doi: 10.1016/S0165-1838(99)00101-0
23. Schramm LP, Strack AM, Platt KB, Loewy AD. Peripheral and central pathways regulating the kidney: a study using pseudorabies virus. Brain Res. (1993) 616:251–62. doi: 10.1016/0006-8993(93)90216-A
24. Weiss ML, Chowdhury SI. The renal afferent pathways in the rat: a pseudorabies virus study. Brain Res. (1998) 812:227–41. doi: 10.1016/S0006-8993(98)00950-0
25. Strack AM, Sawyer WB, Hughes JH, Platt KB, Loewy AD. A general pattern of CNS innervation of the sympathetic outflow demonstrated by transneuronal pseudorabies viral infections. Brain Res. (1989) 491:156–62. doi: 10.1016/0006-8993(89)90098-X
26. Jansen AS, Hoffman JL, Loewy AD. CNS sites involved in sympathetic and parasympathetic control of the pancreas: a viral tracing study. Brain Res. (1997) 766:29–38. doi: 10.1016/S0006-8993(97)00532-5
27. Zhang Y, Kerman IA, Laque A, Nguyen P, Faouzi M, Louis GW, et al. Leptin-receptor-expressing neurons in the dorsomedial hypothalamus and median preoptic area regulate sympathetic brown adipose tissue circuits. J Neurosci. (2011) 31:1873–84. doi: 10.1523/JNEUROSCI.3223-10.2011
28. Banfield BW, Kaufman JD, Randall JA, Pickard GE. Development of pseudorabies virus strains expressing red fluorescent proteins: new tools for multisynaptic labeling applications. J Virol. (2003) 77:10106–12. doi: 10.1128/JVI.77.18.10106-10112.2003
29. Scheller EL, Doucette CR, Learman BS, Cawthorn WP, Khandaker S, Schell B, et al. Region-specific variation in the properties of skeletal adipocytes reveals regulated and constitutive marrow adipose tissues. Nat Commun. (2015) 6:7808. doi: 10.1038/ncomms8808
30. Demmin GL, Clase AC, Randall JA, Enquist LW, Banfield BW. Insertions in the gG gene of pseudorabies virus reduce expression of the upstream Us3 protein and inhibit cell-to-cell spread of virus infection. J Virol. (2001) 75:10856–69. doi: 10.1128/JVI.75.22.10856-10869.2001
31. Smith BN, Banfield BW, Smeraski CA, Wilcox CL, Dudek FE, Enquist LW, et al. Pseudorabies virus expressing enhanced green fluorescent protein: A tool for in vitro electrophysiological analysis of transsynaptically labeled neurons in identified central nervous system circuits. Proc Natl Acad Sci USA. (2000) 97:9264–9. doi: 10.1073/pnas.97.16.9264
32. Larsen PJ, Enquist LW, Card JP. Characterization of the multisynaptic neuronal control of the rat pineal gland using viral transneuronal tracing. Eur J Neurosci. (1998) 10:128–45. doi: 10.1046/j.1460-9568.1998.00003.x
33. Schindelin J, Arganda-Carreras I, Frise E, Kaynig V, Longair M, Pietzsch T, et al. Fiji: an open-source platform for biological-image analysis. Nat Methods. (2012) 9:676–82. doi: 10.1038/nmeth.2019
34. Allen Institute for Cell Science. Allen Spinal Atlas. Allen Brain Atlas. (2008) Available online at: http://mousespinal.brain-map.org/ (accessed March 31, 2019).
35. Paxinos and Franklin's the Mouse Brain in Stereotaxic Coordinates. 4th Edn. Available online at: https://www.elsevier.com/books/paxinos-and-franklins-the-mouse-brain-in-stereotaxic-coordinates/paxinos/978-0-12-391057-8 (accessed April 1, 2019).
36. Imai S, Tokunaga Y, Maeda T, Kikkawa M, Hukuda S. Calcitonin gene-related peptide, substance P, and tyrosine hydroxylase-immunoreactive innervation of rat bone marrows: an immunohistochemical and ultrastructural investigation on possible efferent and afferent mechanisms. J Orthop Res. (1997) 15:133–40. doi: 10.1002/jor.1100150120
37. Brazill JM, Beeve AT, Craft CS, Ivanusic JJ, Scheller EL. Nerves in bone: evolving concepts in pain and anabolism. J Bone Miner Res. (2019) 34:1393–406. doi: 10.1002/jbmr.3822
38. Martin CD, Jimenez-Andrade JM, Ghilardi JR, Mantyh PW. Organization of a unique net-like meshwork of CGRP+ sensory fibers in the mouse periosteum: implications for the generation and maintenance of bone fracture pain. Neurosci Lett. (2007) 427:148–52. doi: 10.1016/j.neulet.2007.08.055
39. Plummer NW, Scappini EL, Smith KG, Tucker CJ, Jensen P. Two subpopulations of noradrenergic neurons in the locus coeruleus complex distinguished by expression of the dorsal neural tube marker pax7. Front Neuroanat. (2017) 11:60. doi: 10.3389/fnana.2017.00060
40. Scheller EL, Khandaker S, Learman BS, Cawthorn WP, Anderson LM, Pham HA, et al. Bone marrow adipocytes resist lipolysis and remodeling in response to β-adrenergic stimulation. Bone. (2019) 118:32–41. doi: 10.1016/j.bone.2018.01.016
41. Nguyen NL, Randall J, Banfield BW, Bartness TJ. Central sympathetic innervations to visceral and subcutaneous white adipose tissue. Am J Physiol Regul Integr Comp Physiol. (2014) 306:R375–86. doi: 10.1152/ajpregu.00552.2013
42. Zeng W, Pirzgalska RM, Pereira MM, Kubasova N, Barateiro A, Seixas E, et al. Sympathetic neuro-adipose connections mediate leptin-driven lipolysis. Cell. (2015) 163:84–94. doi: 10.1016/j.cell.2015.08.055
43. Loncar D, Afzelius BA, Cannon B. Epididymal white adipose tissue after cold stress in rats. I. Nonmitochondrial changes. J Ultrastruct Mol Struct Res. (1988) 101:109–22. doi: 10.1016/0889-1605(88)90001-8
44. Lončar D, Bedrica L, Mayer J, Cannon B, Nedergaard J, Afzelius BA, et al. The effect of intermittent cold treatment on the adipose tissue of the cat. J Ultrastruct Mol Struct Res. (1986) 97:119–29. doi: 10.1016/S0889-1605(86)80012-X
45. Thyssen A, Hirnet D, Wolburg H, Schmalzing G, Deitmer JW, Lohr C. Ectopic vesicular neurotransmitter release along sensory axons mediates neurovascular coupling via glial calcium signaling. Proc Natl Acad Sci USA. (2010) 107:15258–63. doi: 10.1073/pnas.1003501107
46. Xiang HB, Liu C, Liu TT, Xiong J. Central circuits regulating the sympathetic outflow to lumbar muscles in spinally transected mice by retrograde transsynaptic transport. Int J Clin Exp Pathol. (2014) 7:2987–97.
47. Morrison SF. Medullary raphe neurons in autonomic regulation. In: NJ Dun, BH Machado, PM. Pilowsky, editors. Neural Mechanisms of Cardiovascular Regulation. Boston, MA: Springer (2004). p. 245–64. doi: 10.1007/978-1-4419-9054-9_11
48. Kerr FWL, Alexander S. Descending autonomic pathways in the spinal cord. Arch Neurol. (1964) 10:249–61. doi: 10.1001/archneur.1964.00460150019002
49. Vera PL, Ellenberger HH, Haselton JR, Haselton CL, Schneiderman N. The intermediolateral nucleus: an “open” or “closed” nucleus? Brain Res. (1986) 386:84–92. doi: 10.1016/0006-8993(86)90144-7
50. Zoccal DB, Furuya WI, Bassi M, Colombari DS, Colombari E. The nucleus of the solitary tract and the coordination of respiratory and sympathetic activities. Front Physiol. (2014) 5:238. doi: 10.3389/fphys.2014.00238
51. Deuchars SA. Multi-tasking in the spinal cord–do “sympathetic” interneurones work harder than we give them credit for? J Physiol. (2007) 580:723–9. doi: 10.1113/jphysiol.2007.129429
52. Deuchars SA. How sympathetic are your spinal cord circuits? Exp Physiol. (2015) 100:365–71. doi: 10.1113/EP085031
53. Elam M, Svensson TH, Thorén P. Locus coeruleus neurons and sympathetic nerves: activation by cutaneous sensory afferents. Brain Res. (1986) 366:254–61. doi: 10.1016/0006-8993(86)91302-8
54. Ruggiero DA, Underwood MD, Mann JJ, Anwar M, Arango V. The human nucleus of the solitary tract: visceral pathways revealed with an “in vitro” postmortem tracing method. J Auton Nerv Syst. (2000) 79:181–90. doi: 10.1016/S0165-1838(99)00097-1
55. McCulloch PF, Panneton WM, Guyenet PG. The rostral ventrolateral medulla mediates the sympathoactivation produced by chemical stimulation of the rat nasal mucosa. J Physiol. (1999) 516 (Pt 2):471–84. doi: 10.1111/j.1469-7793.1999.0471v.x
56. Bartness TJ, Liu Y, Shrestha YB, Ryu V. Neural innervation of white adipose tissue and the control of lipolysis. Front Neuroendocrinol. (2014) 35:473–93. doi: 10.1016/j.yfrne.2014.04.001
57. Kvietys PR. Extrinsic Vasoregulation: Neural and Humoral. (2010) Available online at: https://www.ncbi.nlm.nih.gov/books/NBK53091/
58. Brito NA, Brito MN, Bartness TJ. Differential sympathetic drive to adipose tissues after food deprivation, cold exposure or glucoprivation. Am J Physiol Regul Integr Comp Physiol. (2008) 294:R1445–52. doi: 10.1152/ajpregu.00068.2008
59. Cannon B, Nedergaard J. Nonshivering thermogenesis and its adequate measurement in metabolic studies. J Exp Biol. (2011) 214:242–53. doi: 10.1242/jeb.050989
60. Kuo LE, Kitlinska JB, Tilan JU, Li L, Baker SB, Johnson MD, et al. Neuropeptide Y acts directly in the periphery on fat tissue and mediates stress-induced obesity and metabolic syndrome. Nat Med. (2007) 13:803–11. doi: 10.1038/nm1611
61. Zhang L, Lee IC, Enriquez RF, Lau J, Vähätalo LH, Baldock PA, et al. Stress- and diet-induced fat gain is controlled by NPY in catecholaminergic neurons. Mol Metabol. (2014) 3:581–91. doi: 10.1016/j.molmet.2014.05.001
62. Hamrick MW, Pennington C, Newton D, Xie D, Isales C. Leptin deficiency produces contrasting phenotypes in bones of the limb and spine. Bone. (2004) 34:376–83. doi: 10.1016/j.bone.2003.11.020
63. Hamrick MW, Della-Fera MA, Choi YH, Pennington C, Hartzell D, Baile CA. Leptin treatment induces loss of bone marrow adipocytes and increases bone formation in leptin-deficient ob/ob mice. J Bone Miner Res. (2005) 20:994–1001. doi: 10.1359/JBMR.050103
64. Lindenmaier LB, Philbrick KA, Branscum AJ, Kalra SP, Turner RT, Iwaniec UT. Hypothalamic leptin gene therapy reduces bone marrow adiposity in ob/ob mice fed regular and high-fat diets. Front Endocrinol. (2016) 7:110. doi: 10.3389/fendo.2016.00110
65. Hamrick MW, Della Fera MA, Choi YH, Hartzell D, Pennington C, Baile CA. Injections of leptin into rat ventromedial hypothalamus increase adipocyte apoptosis in peripheral fat and in bone marrow. Cell Tissue Res. (2007) 327:133–41. doi: 10.1007/s00441-006-0312-3
66. Okamoto S, Ibaraki K, Hayashi S, Saito M. Ventromedial hypothalamus suppresses splenic lymphocyte activity through sympathetic innervation. Brain Res. (1996) 739:308–13. doi: 10.1016/S0006-8993(96)00840-2
67. Wrona D, Trojniar W. Suppression of natural killer cell cytotoxicity following chronic electrical stimulation of the ventromedial hypothalamic nucleus in rats. J Neuroimmunol. (2005) 163:40–52. doi: 10.1016/j.jneuroim.2005.02.017
68. Katayama Y, Battista M, Kao WM, Hidalgo A, Peired AJ, Thomas SA, et al. Signals from the sympathetic nervous system regulate hematopoietic stem cell egress from bone marrow. Cell. (2006) 124:407–21. doi: 10.1016/j.cell.2005.10.041
69. Rowe GC, Vialou V, Sato K, Saito H, Yin M, Green TA, et al. Energy expenditure and bone formation share a common sensitivity to AP-1 transcription in the hypothalamus. J Bone Miner Res. (2012) 27:1649–58. doi: 10.1002/jbmr.1618
70. Kim JG, Sun BH, Dietrich MO, Koch M, Yao GQ, Diano S, et al. Agrp neurons regulate bone mass. Cell Rep. (2015) 13:8–14. doi: 10.1016/j.celrep.2015.08.070
71. Baldock PA, Sainsbury A, Couzens M, Enriquez RF, Thomas GP, Gardiner EM, et al. Hypothalamic Y2 receptors regulate bone formation. J Clin Invest. (2002) 109:915–21. doi: 10.1172/JCI0214588
72. Herber CB, Krause WC, Wang L, Bayrer JR, Li A, Schmitz M, et al. Estrogen signaling in arcuate Kiss1 neurons suppresses a sex-dependent female circuit promoting dense strong bones. Nat Commun. (2019) 10:163. doi: 10.1038/s41467-018-08046-4
73. Wee NK, Baldock PA. The Skeletal Effects of Leptin. In: Blum EL, editor. Leptin: Biosynthesis, Functions and Clinical Significance. Endocrinology Research and Clinical Developments. Hauppauge, NY: Nova Science Publishers (2014). p. 129–40.
74. Iwaniec UT, Boghossian S, Lapke PD, Turner RT, Kalra SP. Central leptin gene therapy corrects skeletal abnormalities in leptin-deficient ob/ob mice. Peptides. (2007) 28:1012–9. doi: 10.1016/j.peptides.2007.02.001
75. Yue R, Zhou BO, Shimada IS, Zhao Z, Morrison SJ. Leptin receptor promotes adipogenesis and reduces osteogenesis by regulating mesenchymal stromal cells in adult bone marrow. Cell Stem Cell. (2016) 18:782–96. doi: 10.1016/j.stem.2016.02.015
76. Scheller EL, Song J, Dishowitz MI, Soki FN, Hankenson KD, Krebsbach PH. Leptin functions peripherally to regulate differentiation of mesenchymal progenitor cells. Stem Cells. (2010) 28:1071–80. doi: 10.1002/stem.432
77. Smith PM, Brzezinska P, Hubert F, Mimee A, Maurice DH, Ferguson AV. Leptin influences the excitability of area postrema neurons. Am J Physiol Regul Integr Comp Physiol. (2016) 310:R440–8. doi: 10.1152/ajpregu.00326.2015
78. Fodor M, Palkovits M, Gallatz K. Fine structure of the area subpostrema in rat. Open gate for the medullary autonomic centers. Ideggyogy Sz. (2007) 60:83–8.
79. Zhang L, Ip CK, Lee ICJ, Qi Y, Reed F, Karl T, et al. Diet-induced adaptive thermogenesis requires neuropeptide FF receptor-2 signalling. Nat Commun. (2018) 9:4722. doi: 10.1038/s41467-018-06462-0
80. Kajimura D, Lee HW, Riley KJ, Arteaga-Solis E, Ferron M, Zhou B, et al. Adiponectin regulates bone mass via opposite central and peripheral mechanisms through FoxO1. Cell Metab. (2013) 17:901–15. doi: 10.1016/j.cmet.2013.04.009
81. Wei W, Motoike T, Krzeszinski JY, Jin Z, Xie XJ, Dechow PC, et al. Orexin regulates bone remodeling via a dominant positive central action and a subordinate negative peripheral action. Cell Metab. (2014) 19:927–40. doi: 10.1016/j.cmet.2014.03.016
82. Bouret SG, Draper SJ, Simerly RB. Formation of projection pathways from the arcuate nucleus of the hypothalamus to hypothalamic regions implicated in the neural control of feeding behavior in mice. J Neurosci. (2004) 24:2797–805. doi: 10.1523/JNEUROSCI.5369-03.2004
83. Hill EL, Elde R. Distribution of CGRP-, VIP-, D beta H-, SP-, and NPY-immunoreactive nerves in the periosteum of the rat. Cell Tissue Res. (1991) 264:469–80. doi: 10.1007/BF00319037
84. Cherruau M, Morvan FO, Schirar A, Saffar JL. Chemical sympathectomy-induced changes in TH-, VIP-, and CGRP-immunoreactive fibers in the rat mandible periosteum: influence on bone resorption. J Cell Physiol. (2003) 194:341–8. doi: 10.1002/jcp.10209
85. Chevalier J, Derkinderen P, Gomes P, Thinard R, Naveilhan P, Vanden Berghe P, et al. Activity-dependent regulation of tyrosine hydroxylase expression in the enteric nervous system. J Physiol. (2008) 586:1963–75. doi: 10.1113/jphysiol.2007.149815
86. Wade GN, Bartness TJ. Effects of photoperiod and gonadectomy on food intake, body weight, and body composition in Siberian hamsters. Am J Physiol. (1984) 246:R26–30. doi: 10.1152/ajpregu.1984.246.1.R26
87. Bartness TJ, Hamilton JM, Wade GN, Goldman BD. Regional differences in fat pad responses to short days in Siberian hamsters. Am J Physiol. (1989) 257:R1533–40. doi: 10.1152/ajpregu.1989.257.6.R1533
88. Jansen AS, Nguyen XV, Karpitskiy V, Mettenleiter TC, Loewy AD. Central command neurons of the sympathetic nervous system: basis of the fight-or-flight response. Science. (1995) 270:644–6. doi: 10.1126/science.270.5236.644
89. Stefanidis A, Wiedmann NM, Adler ES, Oldfield BJ. Hypothalamic control of adipose tissue. Best Pract Res Clin Endocrinol Metab. (2014) 28:685–701. doi: 10.1016/j.beem.2014.08.001
90. Oldfield BJ, Allen AM, Davern P, Giles ME, Owens NC. Lateral hypothalamic “command neurons” with axonal projections to regions involved in both feeding and thermogenesis. Eur J Neurosci. (2007) 25:2404–12. doi: 10.1111/j.1460-9568.2007.05429.x
91. Krout KE, Mettenleiter TC, Loewy AD. Single CNS neurons link both central motor and cardiosympathetic systems: a double-virus tracing study. Neuroscience. (2003) 118:853–66. doi: 10.1016/S0306-4522(02)00997-1
Keywords: bone marrow adipose tissue, fat, brain-bone interactions, pseudorabies virus, viral tract tracing, energy metabolism, sympathetic nerve, autonomic nervous system
Citation: Wee NKY, Lorenz MR, Bekirov Y, Jacquin MF and Scheller EL (2019) Shared Autonomic Pathways Connect Bone Marrow and Peripheral Adipose Tissues Across the Central Neuraxis. Front. Endocrinol. 10:668. doi: 10.3389/fendo.2019.00668
Received: 26 April 2019; Accepted: 16 September 2019;
Published: 27 September 2019.
Edited by:
Stephanie Lucas, Université du Littoral Côte d'Opale, FranceReviewed by:
Christopher J. Madden, Oregon Health & Science University, United StatesKristy Townsend, University of Maine, United States
Copyright © 2019 Wee, Lorenz, Bekirov, Jacquin and Scheller. This is an open-access article distributed under the terms of the Creative Commons Attribution License (CC BY). The use, distribution or reproduction in other forums is permitted, provided the original author(s) and the copyright owner(s) are credited and that the original publication in this journal is cited, in accordance with accepted academic practice. No use, distribution or reproduction is permitted which does not comply with these terms.
*Correspondence: Erica L. Scheller, c2NoZWxsZXJAd3VzdGwuZWR1