 Adi Segev-Hadar
 Gertrude Alupo
 Kfir Tal
 Tali Nitzan
 Jakob Biran
- 1Department of Poultry and Aquaculture, Institute of Animal Science, Agricultural Research Organization, Rishon LeTsiyon, Israel
- 2Department of Animal Sciences, Robert H. Smith Faculty of Agriculture, Food and Environment, The Hebrew University of Jerusalem, Rehovot, Israel
The growth and differentiation factor Myostatin (MSTN, also known as GDF8) negatively regulates skeletal muscle development and growth in vertebrates. Most fish genomes contain two or more mstn genes, which are expressed in muscle and other tissues. Yet, in the genome of Nile tilapia (Oreochromis niloticus), which is one of the world's most important aquaculture fish species, only one mstn gene has previously been identified. Here, we identify a second mstn gene in Nile tilapia. We show that it clusters phylogenetically with other piscine mstn2 genes and that it shares chromosomal synteny with the human and zebrafish orthologs. We further show that mstn2 is not expressed in red or white muscles of Nile tilapia, but rather that its main site of expression is the brain. To determine which physiological functions are correlated with mstn expression, adult Nile tilapia were exposed to various environmental conditions and their effect on mstn1 and mstn2 expression in the brain and muscles was measured using real-time PCR. We found that the centrally- and muscle-expressed mstn genes differ in their responsiveness to diverse challenges, suggesting differential gene- and tissue-specific regulation of their expression. Metabolic and stress marker analyses showed that the altered mstn expression is not regulated by classical stress response. Taken together, our findings expand the understanding of the MSTN system in Nile tilapia and provide evolutionary insight into its function.
Introduction
Myostatin [MSTN, also known as growth and differentiation factor 8 (GDF8)] is a growth and differentiation factor of the TGF-β superfamily that inhibits skeletal muscle development and growth (1). MSTN is synthesized as a precursor protein, which gives rise to latency-associated peptide and mature MSTN peptide (2). The mammalian Mstn gene is mainly expressed in myogenic precursor cells of the myotome during somitogenesis and in muscle tissues of adult animals (1, 3–5). MSTN can act as a paracrine, autocrine, or endocrine substance (6). The mstn gene is highly conserved across vertebrate species, supporting its important function in regulating muscular development and growth (1, 7–11).
While mammalian genomes contain only one Mstn gene, most ray-finned fish possess at least two mstn paralogs (i.e., mstn1 and mstn2) and, in some species, up to four mstn genes can be identified (12, 13). Piscine mstns are differentially expressed in different muscle types and, unlike their mammalian orthologs, they are also expressed in the brain and other peripheral tissues (14–16). This tissue distribution suggests that mstns may also be involved in processes such as muscle regeneration, growth, and development of neurons in the brain, osmoregulation, homeostatic tissue growth, and reproduction (14, 15, 17–19). Nevertheless, mstn gene knockout in several fish species resulted in increased muscle mass, thus showing the evolutionarily conserved function of mstn as a key regulator of muscle growth (20–23).
mstn expression is differentially regulated according to species, phase of growth, tissue, nutritional state, stress level, temperature, and activity level (24–27). For example, overcrowding reduced mstn mRNA expression in zebrafish (Danio rerio) (28), whereas exposure of juvenile channel catfish (Ictalurus punctatus) to cold temperature for 28 days increased mstn mRNA expression in muscle tissues (24). mstn expression is increased in muscles of juvenile European sea bass (Dicentrarchus labrax) following prolonged fasting and returns to normal levels after refeeding (29). Thirty days fasting of Asian sea bass (Lates calcarifer) fry led to increased expression of mstn1 in the muscle and liver and decreased expression in the gills and brain. However, mstn2 expression increased in the gills and liver and remained constant in muscle and brain after long-term fasting (17). Five weeks fasting of juvenile armorhead catfish (Cranoglanis bouderius) led to a gradual decrease in mstn expression in muscle, brain and liver, which returned to baseline levels after 2 weeks of refeeding. mstnb expression increased in the initial fasting period but decreased later on through the prolonged fast (30). In Mozambique tilapia (Oreochromis mossambicus) larvae, starvation reduced mstn1 mRNA levels, accompanied by cortisol elevation. However, fasting of adult male Mozambique tilapia and rainbow trout (Oncorhynchus mykiss) had no significant effect on mstn expression in skeletal muscles (27, 31). This variability in piscine mstn responsiveness emphasizes the need to characterize the piscine MSTN system also in non-muscular tissues under various environmental conditions.
Nile tilapia (Oreochromis niloticus) is one of the most widely cultured fish species in extensive and highly intensive aquaculture systems and its genome has been fully sequenced (32–34). It was previously demonstrated that starvation affects mstn expression in white muscles of juvenile Nile tilapia (25). However, thus far only one tilapia mstn gene has been identified. Here, we report the identification of a non-muscular mstn2 gene in Nile tilapia and show that it shares phylogeny and chromosomal synteny with Mstn genes from invertebrates to mammals. Furthermore, we show that tilapia mstn1 and mstn2 differ in their responsiveness to environmental challenges in a tissue-specific manner. Lastly, we show that these effects are mediated by the homeostatic response of the animal to the changing environment and not due to stress response.
Materials and Methods
Animals and Treatments
The experiments were approved by the Agricultural Research Organization Committee for Ethics in Using Experimental Animals (approval number: 775/18 IL). Adult Nile tilapia (59.36 ± 2.1 g) were raised in cylindrical 250-liter tanks (n = 7–8 fish/treatment) for 5 weeks. Temperature was maintained at 24–26°C. Ammonia and nitrite levels were monitored. Fish were fed twice daily ad libitum with commercial tilapia feeds (Zemach Feed Mills™, Israel). Fish were acclimated to the experimental tanks for 1–2 weeks and then subjected for 3 weeks to one of the following treatments: 1. net chasing (10 min/twice daily); 2. 50% seawater (20 ppt; salinity was increased by 0.5% every 48 h during the first 7 days), 3. no feeding; 4. increased water temperature (34°C). Control group underwent no treatment. Each experiment was performed twice in succession and accumulated data from both procedures are presented (n = 9–15 fish/treatment). Tissue distribution analysis of mstn1 and mstn2 expression was performed using n = 3 fish/group/tissue with adult males displaying running milt and weighing 81.87 ± 6.6 g, adult females with fully developed ovaries and weighing 27.13 ± 7.2 g, juvenile males weighing 10.56 ± 1.8 g and juvenile females weighing 16.97 ± 4.4 g.
Identification of mstn Genes in Nile Tilapia
Database sequence searches for mstn genes in Nile tilapia were performed using the Basic Local Alignment Search tool (BLAST) package (NCBI, https://blast.ncbi.nlm.nih.gov/Blast.cgi) (35). Genomic synteny of mstn was manually analyzed using the UCSC genome browser (https://genome.ucsc.edu/) (36). Nucleotide sequences of the open reading frame of mstn genes from various organisms were aligned by MUSCLE and phylogenetic analysis was performed using MEGA version 7 (37).
Cloning
Nile tilapia total RNA was extracted from brain and muscle tissues using Trizol reagent (Life Technologies Corporation, Carlsbad, USA) according to the manufacturer's protocol and treated with Invitrogen TURBO DNA-free™ kit (Thermo Fisher Scientific, Vilnius, Lithuania) according to the manufacturer's protocol. cDNA was reverse-transcribed from 1 μg total RNA using High Capacity cDNA Reverse Transcription kit (Thermo Fisher Scientific, Vilnius, Lithuania). Specific primer pairs (Table 1) were used to amplify the full tilapia (ti) mstn2 open reading frame and part of the timstn1 reading frame. PCR products, amplified with DreamTaq Green PCR Master Mix (Thermo Fisher Scientific), were analyzed on 1% agarose (LifeGene, Modi'in, Israel) containing Redsafe™ stain (Intron Biotechnology, Korea) in 1× TAE (Tris-acetate acid-EDTA) buffer (Biological industries, Kibbutz Beit-Haemek, Israel). PCR products of the predicted amplicon size were extracted from the gel, cloned into pGEM-T easy vector (Promega, Wisconsin, U.S.A.) and sequenced using T7 and SP6 primers at Hy Laboratories Ltd. (Rehovot, Israel).
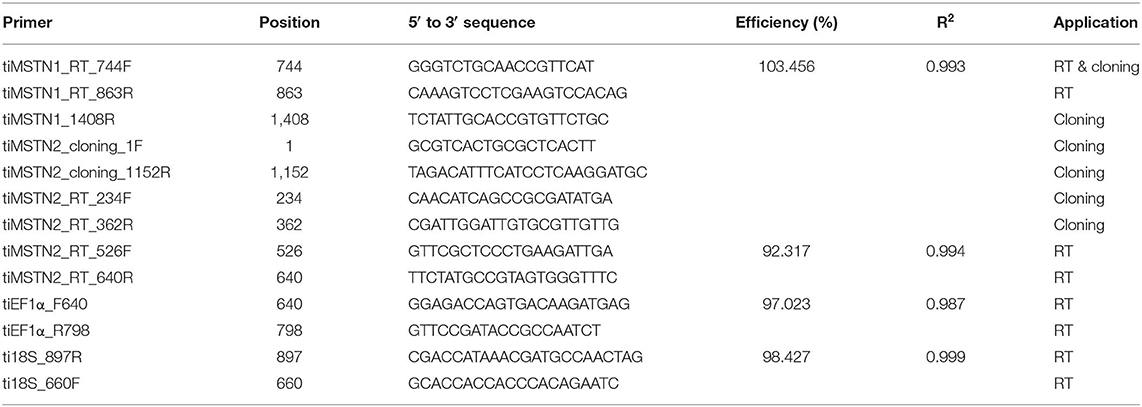
Table 1. Primers used for cloning and real-time PCR (RT).
Tissue and Blood Sample Collection
Blood samples were collected from the lateral vein using 1 mL heparinized syringes (200 IU/mL) attached to 25G needles. Plasma was separated from blood cells and platelets by centrifugation at 4°C/3.2 g for 20 min. Fish were subsequently harvested by decapitation and dissected to collect red muscle, white muscle, forebrain, midbrain, and hindbrain. As in other fish, hypothalamic nuclei of Nile tilapia are localized in the diencephalic compartment (38). Therefore, to analyze central mstn expression, the midbrain section containing the diencephalon and optic tectum was dissected from the hindbrain compartments (cerebellum and brain stem) and from the telencephalon and olfactory bulbs. Each brain region was placed in a separate tube. Tissue samples were snap-frozen in liquid nitrogen and stored at −80°C until further analysis. Plasma was stored at −20°C until analysis for triglycerides, total protein and cortisol was performed.
RNA Extraction and cDNA Synthesis
Tilapia total RNA was extracted using Trizol reagent (Life Technologies Corporation, Carlsbad, USA), according to the manufacturer's protocol. RNA quantity and purity were measured using a microplate spectrophotometer Epoch™ (BioTek instruments Inc. Winooski, USA). RNA integrity was assessed by running 1–1.5 μg of total RNA on 1% agarose (LifeGene, Modi'in, Israel) containing Redsafe™ stain (Intron Biotechnology, Korea) in 1× TAE (Tris-acetate acid-EDTA) buffer (Biological Industries, Kibbutz Beit-Haemek, Israel). Possible genomic DNA contamination was eliminated by treatment with Invitrogen TURBO DNA-free™ kit (Thermo Fisher Scientific, Vilnius, Lithuania) according to the manufacturer's protocol. DNase-free total RNA (0.5 μg) was reverse-transcribed using High Capacity cDNA Reverse Transcription kit (Thermo Fisher Scientific, Vilnius, Lithuania) according to the manufacturer's protocol. cDNA was stored at −20°C until quantitation by real-time PCR.
Real-Time PCR Analysis
Expression levels of timstn1 in red and white muscle and timstn1 and timstn2 in the brain were analyzed by quantitative PCR using a StepOnePlus™ Real-Time PCR System (Applied Biosystems, Inc. Foster City, CA, USA). Elongation factor 1 alpha (ef1α) and 18S served as reference genes (39). Each reaction consisted of 5 μL SYBR® green dye (Thermo Fisher Scientific, Vilnius, Lithuania), 0.75 μL of 3 μM forward and reverse primers of either timstn1, timstn2, 18s, or ef1α (Table 1), 0.5 μL of ultra-pure water (UPW) and 3 μL of cDNA template (diluted 1:20 in UPW for brain and white muscle and 1:10 for red muscle). Analysis was performed in duplicates. Controls without the cDNA were used to test for non-specific amplification. Specificity of the primers was validated by Sanger sequencing and melt curve analysis was used to confirm amplification of a single product. Amplification was performed under the following conditions; 95.0°C for 20 s, 40 cycles at 95.0°C for 3 s, and 60.0°C for 30 s, followed by one cycle at 95.0°C for 15 s and 60.0°C for 1 min, 95.0°C for 15 s for the generation of the melting curve. Fluorescence signals of the target, reference genes and control group were analyzed using StepOne software Version 2.3. Tissue distribution analysis had no clear baseline; therefore, relative quantification in various tissues was performed using 2−ΔC'T method (40). Relative quantification of within-tissue expression was determined using the 2−ΔΔCT method (41).
Quantification of Metabolites and Cortisol in Plasma
Plasma metabolites (triglycerides and total protein) were quantified by a photometric method using Cobas™ C111 Chemistry Analyzer (Roche Diagnostics International Ltd. Rotkruez, Switzerland). The system was calibrated using tetramethylammonium chloride (C.f.a.s Calibrator; Roche diagnostics GmbH, Mannheim Germany). Analytic controls (PreciControl ClinChem Multi 1 and 2; Roche diagnostics GmbH, Mannheim Germany) consisting of lyophilized human sera were used for quality control. Triglycerides were quantified using the TRIGL kit (Roche diagnostics GmbH, Mannheim, Germany) and total protein concentration was measured using the TP2 Kit (Roche diagnostics GmbH) according to the manufacturer's protocols. Steroid extraction for cortisol analysis was performed according to Aizen et al. (42) and cortisol concentrations were measured using a cortisol-specific ELISA according to the protocol published by Yeh et al. (43).
Statistical Analyses
Statistical analyses were performed using GraphPad Prism 7.01 software (GraphPad, San Diego, USA). Data are presented as mean ± SD. Significance of differential gene expression and metabolic parameters was determined by one-way ANOVA followed by Dunnett's multiple comparisons post-test.
Results
Identification of a Second mstn Gene in the Genome of Nile Tilapia
Nile tilapia mstn genes were sought using the previously identified Mozambique tilapia mstn mRNA sequence (AF197193) (15). A standard BLASTn search against the NR database of Nile tilapia yielded two predicted mstn mRNAs (XM_003458832 and XM_003446535), with the first hit matching the previously cloned mstn gene of Nile tilapia (KT987208). A wide-range phylogenetic analysis of the Mstn open reading frame (ORF) from invertebrates and lower vertebrates to mammals showed that the analyzed mstn sequences cluster into five main clades: 1. invertebrates mstn; 2. reptile and avian mstn; 3. mammalian Mstn; 4 piscine mstn1; 5. piscine mstn2. The previously identified tilapia mstn (timstn1) clustered with other piscine mstn1 ORFs, whereas the newly identified timstn clustered with mstn2 ORFs of various fish (Figure 1) and was therefore designated timstn2.
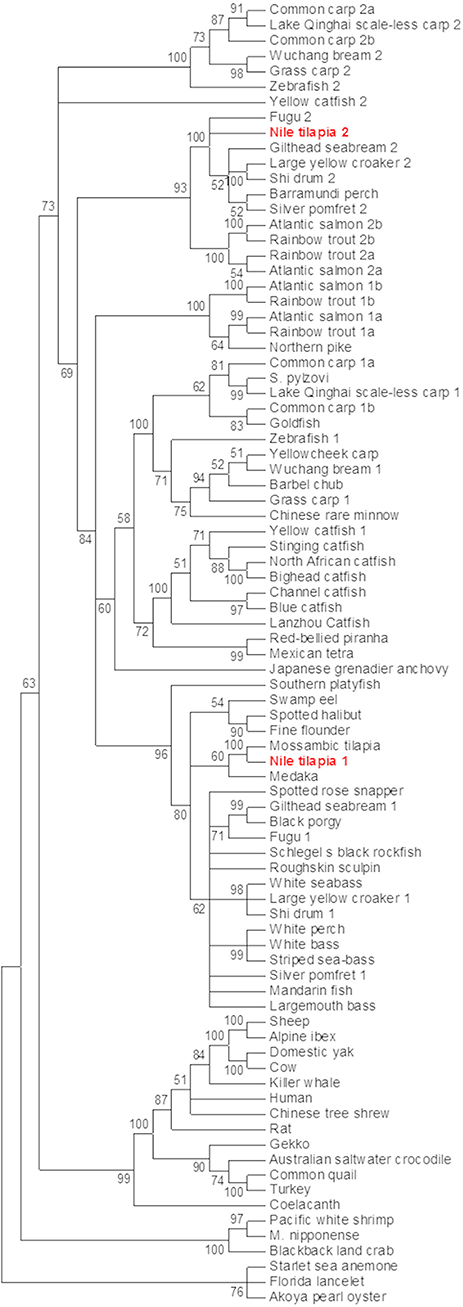
Figure 1. Phylogenetic analysis of mstn nucleotide sequences. The mstn genes cluster into five main clades including an invertebrate clade, a clade of reptiles and avians, a mammalian clade that also includes the ancient coelacanth fish, a clade of piscine mstn1 and a clade for piscine mstn2. Sequences used in this analysis are: Mozambique tilapia, Oreochromis mossambicus, AF197193; Lanzhou catfish, Silurus lanzhouensis, KU302769; Nile tilapia 1, Oreochromis niloticus, XM_003458832; Nile tilapia 2, Oreochromis niloticus, MN708486; Silver pomfret 1, Pampus argenteus, KM259900; Lake Qinghai scale-less carp 1, Gymnocypris przewalskii, KJ607138; Japanese grenadier anchovy, Coilia nasus, KF638401; Macrobrachium nipponense, KF530847; Roughskin sculpin, Trachidermus fasciatus, GU198192; goldfish, Carassius auratus, KC851952; Chinese rare minnow, Gobiocypris rarus, FJ482232; starlet sea anemone, Nematostella vectensis, AGL96595; common quail, Coturnix coturnix, AF407340; spotted rose snapper, Lutjanus guttatus, JX987064; spotted halibut, Verasper variegatus, JN226745; Barbel chub, Squaliobarbus curriculus, JN230816; Barramundi perch, Lates calcarifer HQ731440; cow, Bos taurus, GQ184147; yellowcheek carp, Elopichthys bambusa, HM461971; white perch, Morone Americana, AF290911; striped sea-bass, Morone saxatilis, AF290910; gilthead seabream 1, Sparus aurata, AF258448; white bass, Morone chrysops, AF197194; turkey, Meleagris gallopavo, AF019625; human, Homo sapiens, AF104922; Norway rat, Rattus norvegicus, AF019624; sheep, Ovis aries, AF019622; common carp 1a, Cyprinus carpio, GU014395; common carp 1b, Cyprinus carpio, GU014396; common carp 2a, Cyprinus carpio, GU014397; common carp 2b, Cyprinus carpio, GU0143958; yellow catfish 1, Tachysurus fulvidraco, DQ767966; Alpine ibex, Capra ibex, AY629305; Schlegel's black rockfish, Sebastes schlegelii, DQ423474; blackback land crab, Gecarcinus lateralis, EU432218; black porgy, Acanthopagrus schlegelii, DQ303480; white seabass, Atractoscion nobilis, AY966401; stinging catfish, Heteropneustes fossilis, HQ003245; North African catfish, Clarias gariepinus, KJ372760; swamp eel, Monopterus albus, KM103284; Akoya pearl oyster, Pinctada martensii, KJ579132; Schizopygopsis pylzovi, JX088635; bighead catfish, Clarias microcephalus, JX456396; Mandarin fish, Siniperca chuatsi, JF896453; blue catfish, Ictalurus furcatus, AY540992; largemouth bass, Micropterus salmoides, DQ666527; Florida lancelet, Branchiostoma floridae, XM_002599415; domestic yak, Bos grunniens, EU926669; zebrafish a, Danio rerio, NM_001004122; zebrafish b, Danio rerio NM_131019; fugu 2, Takifugu rubripes, NM_001032672; Lake Qinghai scale-less carp 2, Gymnocypris przewalskii, KP277103; grass carp 2, Ctenopharyngodon idella, KM874827; grass carp 1, Ctenopharyngodon idella, KM874826; Japanese medaka, Oryzias latipes, NM_001201499; yellow catfish 2, Tachysurus fulvidraco KF537384; shi drum 2, Umbrina cirrosa, JX002683; Wuchang bream 2, Megalobrama amblycephala, JQ065337; Wuchang bream 1, Megalobrama amblycephala, JQ065336; fugu 1, Takifugu rubripes, AY445322; fine flounder 1, Paralichthys adspersus, EU443627; Australian saltwater crocodile, Crocodylus porosus, XM_019554060; large yellow croaker 1, Larimichthys crocea, AY842933; red-bellied piranha, Pygocentrus nattereri, XM_017713514; gecko, Gekko japonicas, XM_015405581; Mexican tetra, Astyanax mexicanus, XM_007253246; coelacanth, Latimeria chalumnae, XM_005996542; Chinese tree shrew, Tupaia chinensis, XM_006147825; channel catfish, Ictalurus punctatus, XM_017469117; southern platyfish, Xiphophorus maculatus XM_014468464; gilthead seabream 2, Sparus aurata, AY046314; large yellow croaker 2, Larimichthys crocea, JF304776; Pacific white shrimp, Litopenaeus vannamei, JQ045427; northern pike, Esox Lucius, XM_010879812; killer whale, Orcinus orca, XM_004276934; shi drum 1, Umbrina cirrosa, AF316881; silver pomfret 2, Pampus argenteus, KT726407; rainbow trout 1a, Oncorhynchus mykiss,NM_001124282; rainbow trout 1b, Oncorhynchus mykiss,NM_001124283; rainbow trout 2a, Oncorhynchus mykiss,DQ417326; rainbow trout 2b (pseudogene), Oncorhynchus mykiss, DQ417327; Atlantic salmon 1a, Salmo salar, NM_001123634; Atlantic salmon 1b, Salmo salar, NM_001123549; Atlantic salmon 2a, Salmo salar, JN990763; Atlantic salmon 2b (pseudogene), Salmo salar, JN990773. Phylogenetic analysis was performed using MEGA7 software (37). The evolutionary history was inferred by using the maximum likelihood method based on the Tamura-Nei model (44). The percentage of replicate trees in which the associated taxa clustered together in the bootstrap test (500 replicates) are shown next to the branches (45). Initial tree(s) for the heuristic search were obtained automatically by applying Neighbor-Join and BioNJ algorithms to a matrix of pairwise distances estimated using the maximum composite likelihood (MCL) approach, and then selecting the topology with superior log likelihood value. The analysis involved 85 nucleotide sequences.
Although our analysis may have been biased by the increased number of piscine species, the results strongly support an early evolutionary event of mstn gene duplication in fish genomes. To further test this hypothesis, we analyzed the syntenic conservation between the timstns neighboring genes and zebrafish mstns genomic regions using the human MSTN gene as a reference. This analysis demonstrated high syntenic conservation between the chromosomal regions of human MSTN and zebrafish mstn1 (a.k.a. mstnb; NM_131019). Furthermore, syntenic conservation to the chromosomal region of the human MSTN gene was also found for both of the timstns and for zebrafish mstn2 (a.k.a. mstna; NM_001004122). The MFSD6 was identified in chromosomal region of the human MSTN, timstn2, zebrafish mstn1, and mstn2, whereas Nab1 gene was conserved in timstn2 and both of the zebrafish mstn genes (Figure 2A). These findings suggest that the mammalian Mstn gene shares a common ancestral gene with the piscine mstn genes and that both of the piscine mstn genes retained at least part of their chromosomal synteny during speciation events.
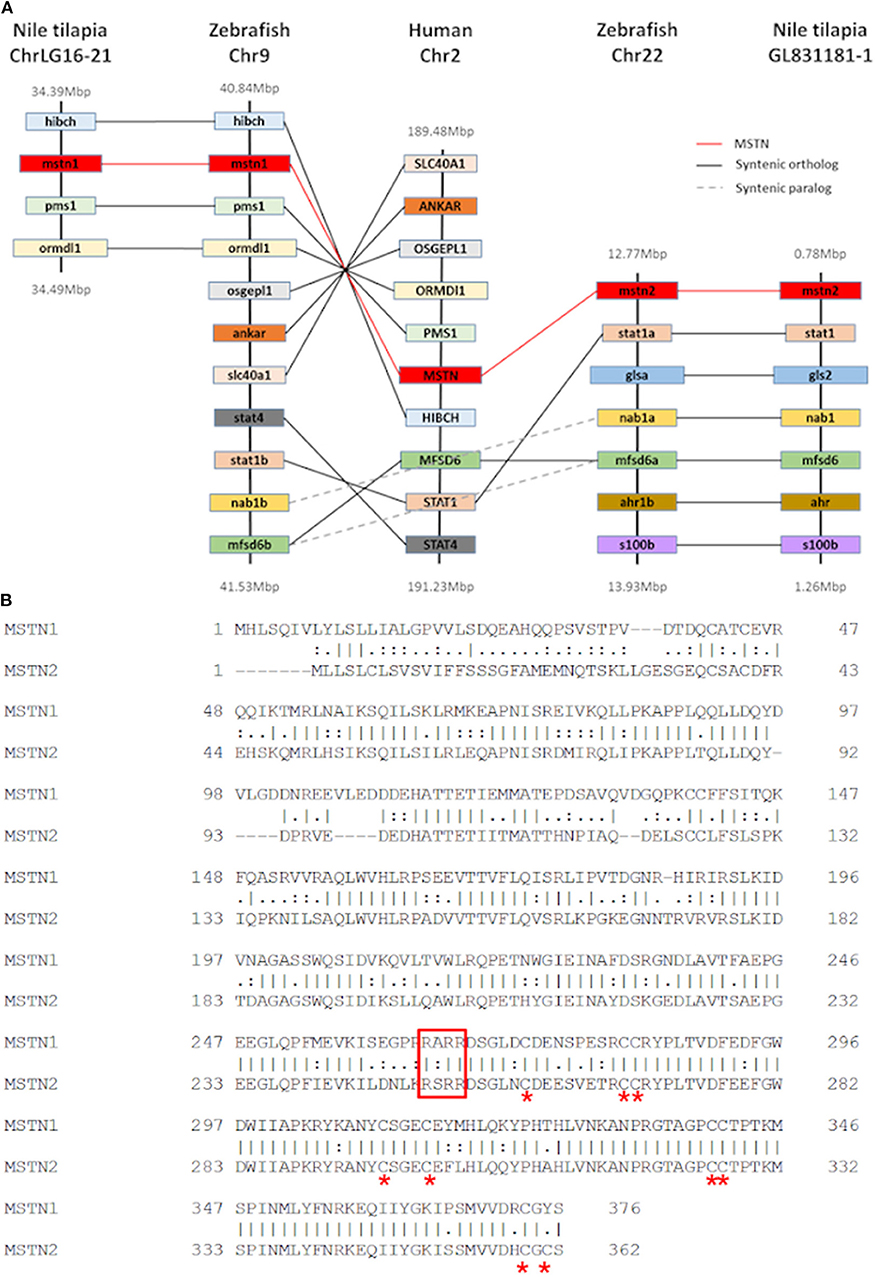
Figure 2. Conservation of tilapia mstn2. (A) Chromosomal synteny of Nile tilapia mstn1 and mstn2. Genes adjacent to mstn in the Nile tilapia, zebrafish and human genomes were manually identified using both USCS and ensembl genome browsers (https://genome.ucsc.edu/ and https://www.ensembl.org/index.html, respectively). The genes are named according to their annotation in the human genome. While Nab1 and MFSD6a genes were found to be syntenic in both piscine mstn genomic regions, most of the human MSTN neighboring genes were syntenic only to mstn1 or mstn2. (B) Pairwise alignment of tilapia Mstn1 and Mstn2 amino acid sequences illustrates the high similarity of the tilapia Mstn proteins. Red asterisk indicates conserved cysteine residues, which are important for Mstn peptide activity. The conserved proteolytic RXRR motif is indicated by a red rectangle.
While the Nile tilapia mstn1 gene has already been cloned, the timstn2 prediction was based on computational annotation. Although partial cloning of timstn1 was successful, our efforts to clone timstn2 from cDNA libraries of tilapia muscles failed. Nonetheless, the full ORF of timstn2 was cloned from brain cDNA library (accession no: MN708486), suggesting a differential role for timstn2. At the protein level, tiMstn1 and the newly cloned tiMstn2 shared 69% identity and 82% similarity, with higher homology in the C-termini of the peptide (Figure 2B; Table 2). Homology rate analysis showed that tiMstn peptide sequences share 63–86% homology and 78–92% similarity with MSTN peptides of other vertebrates, whereas tiMstn2 shared 60–76% homology and 74–86% similarity (Table 2). Moreover, both of the translated tiMstns possessed the characteristic MSTN cysteine residues and proteolytic RXRR site (Figure 2B) (16).
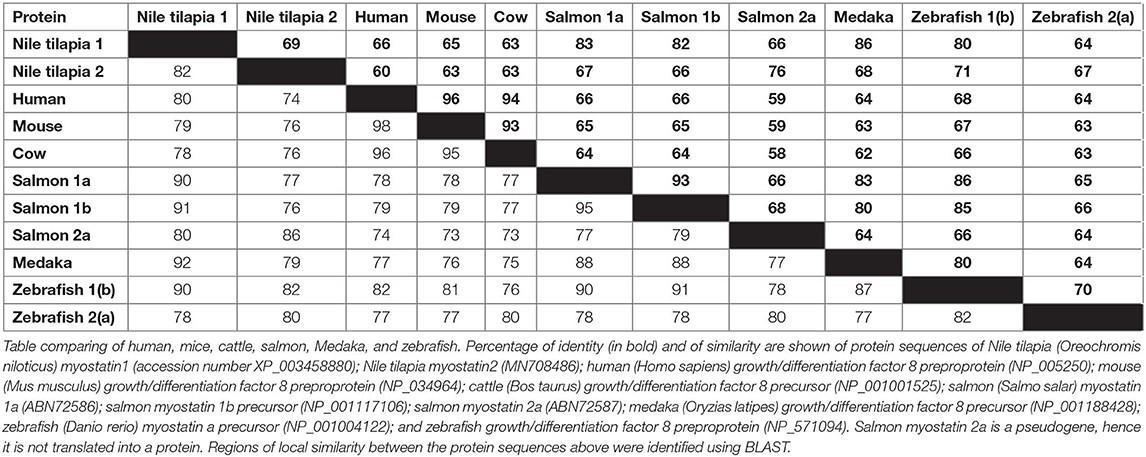
Table 2. Comparison of the homology of myostatin (MSTN) protein sequences in Nile tilapia with other species.
Tilapia mstn Genes Differ in Their Tissue Distribution
Piscine mstn genes are expressed in multiple tissues (16). Therefore, the identification of mstn gene duplication raises the question of whether both tilapia mstns regulate muscle development and growth. To address this point, we performed quantification of timstn1 and timstn2 mRNA expression in various tissues of Nile tilapia, using real-time PCR. Because tilapia males exhibit increased growth rate as compared to females and gonadal development was shown to influence muscle growth rate in tilapia (46, 47), we analyzed the expression of timstn1 and timstn2 in both sexes before and after sexual maturation. This analysis showed that male tilapia express higher levels of timstn1 in their white muscle than females before and after sexual maturation (Figure 3). The highest levels of timstn1 were found in white muscle tissue. Intermediate levels of timstn1 expression were found in the red muscle and brain of all groups, in the fat of mature males and in the testis of premature males. Low levels of timstn1 were found in the ovary of mature and premature females, the mature male testis and the liver of all groups. Interestingly, timstn2 was not expressed in red or white muscles and its highest expression was detected in the brains of all tested groups. Lower levels of timstn2 expression were detected also in the intestine and gonads before and after sexual maturation (Figure 3).
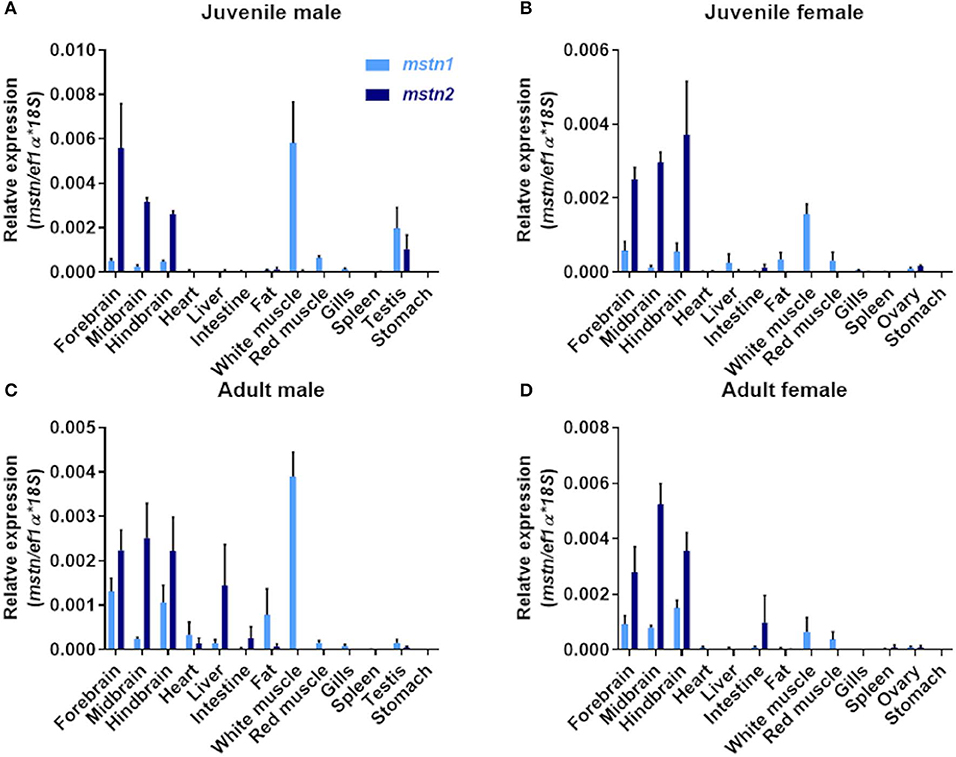
Figure 3. Localization of timstn1 and timstn2 mRNA in various tissues of Nile tilapia using real-time PCR. Expression levels of timstn1 and timstn2 were determined by real-time PCR in juvenile male (A), juvenile females (B), adult males (C), and adult females (D). The data are presented as mean ± SD.
Environmental Conditions Influence the Expression of mstn1 and mstn2 in the Brain and Muscles of Nile Tilapia
Fluctuations in environmental conditions are known to induce hypothalamic activity as part of the homeostatic response to the changes (48). In addition, the piscine cerebellum and, to a lesser extent, the telencephalon and diencephalon are major sites of adult brain neurogenesis, and adult brain size can also be affected by environmental conditions (49, 50). To test whether mstn is involved in the regulation of these functions, fish were exposed to various changes in conditions (see Materials and Methods) for 3 weeks and analyzed for timstn gene expression in the forebrain, midbrain and hindbrain. The results showed that increased water temperature led to increased timstn1 mRNA expression in all brain regions (Figures 4A–C). Additionally, increased salinity led to increased timstn1 expression in the forebrain and hindbrain compartments and net chasing treatment led to increased timstn1 expression in the hindbrain, with a strong trend for increased expression in the forebrain (Figures 4A,C). Similarly, timstn2 mRNA expression significantly increased in response to high water temperature in all brain regions (Figures 4D–F). Forebrain and hindbrain timstn2 expression rose in response to increased salinity; however, net chasing elicited timstn2 expression only in the hindbrain compartment (Figures 4D,F). Interestingly, lack of food for 3 weeks did not affect timstn1 or timstn2 mRNA expression in the tilapia brain.
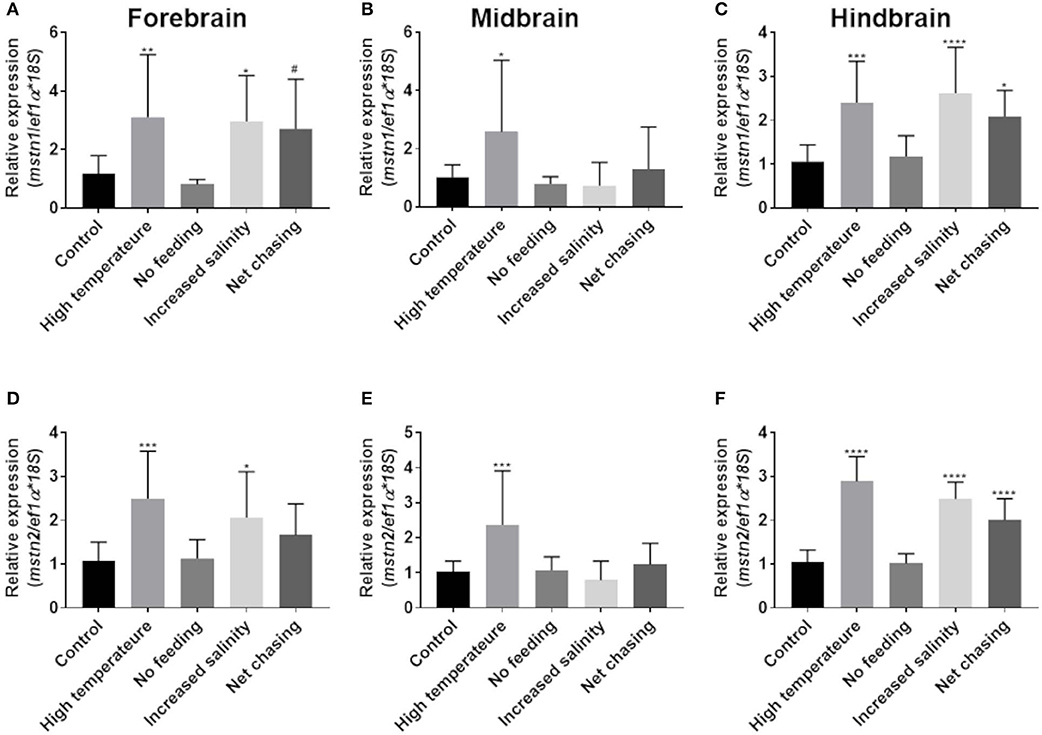
Figure 4. Environmental challenges affect the expression of timstn1 and timstn2 in Nile tilapia brain. Expression levels of timstn1 (A–C) and timstn2 (D–F) were determined by real-time PCR. Expression was analyzed in the fish forebrain (A,D), midbrain (B,E), and hindbrain (C,F). The data are presented as mean ± SD. *p < 0.05; **p < 0.01; ***p < 0.001; ****p < 0.0001; #p = 0.053.
Considering its highly conserved role in regulating muscle growth in various fish, we next examined how environmental challenges affect mstn expression in the Nile tilapia muscles. Having found that timstn2 is not expressed in the fish muscles (Figure 3), only timstn1 expression was analyzed. In white muscle tissue, timstn1 expression significantly increased in response to starvation, while other treatments did not affect its expression (Figure 5A). Similar results were seen in red muscle tissue, where only starvation elicited a significant increase in timstn1 expression. Interestingly, heat treatment led to a significant reduction of timstn1 expression in the red muscle (Figure 5B).
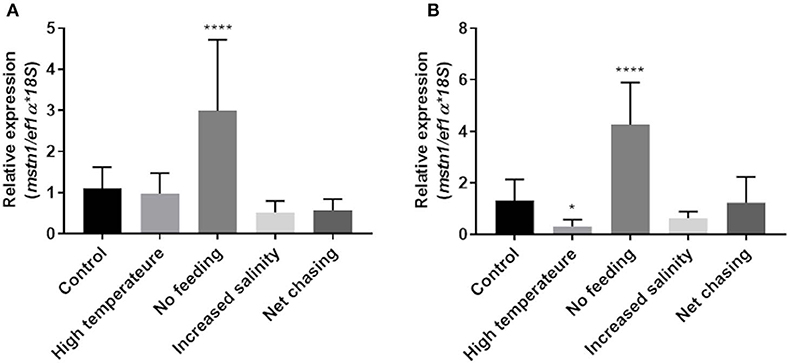
Figure 5. Environmental challenges affect the expression of timstn1 in Nile tilapia muscle tissues. Expression levels of timstn1 mRNA in the white muscle (A) and red muscle (B) were determined by real-time PCR. The data are presented as mean ± SD. *p < 0.05; ****p < 0.0001.
The Effect of Environmental Challenges on Protein and Triglyceride Metabolism
Stress induces a rise in cortisol that, in turn, influences metabolism of carbohydrates, lipids and proteins (51). Moreover, cortisol can influence mstn expression in several fish species, including tilapia (31, 52). Therefore, to examine the effect of the above-mentioned experimental challenges on energy metabolism in Nile tilapia, we analyzed total protein and triglyceride levels in the plasma. Our analysis revealed that total protein levels in plasma did not change in response to any of the experimental treatments (Figure 6A). Similarly, none of the experimental treatments affected plasma levels of triglycerides (Figure 6B). These findings were unexpected, as in an acute form, these challenges will induce a homeostatic stress response. We therefore tested cortisol levels in the plasmas of the experimental fish. Results showed a trend for increased cortisol levels in the no-feed treatment group, but no effect for any of the other treatments (Figure 6C).
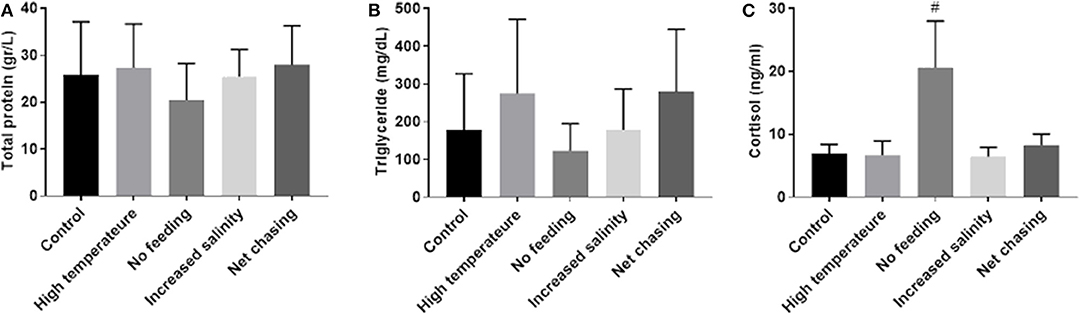
Figure 6. Metabolic parameters in plasma of Nile tilapia remained unchanged in response to various environmental conditions. Total protein (A) and triglyceride (B) levels were determined by photometric measurement. Plasma cortisol levels (C) were analyzed using a specific ELISA. The data are presented as mean ± SD. #p = 0.098.
Discussion
The majority of fish genomes contain multiple copies of mstn that are expressed in various tissues including the muscles, brain, gonads, liver and others. Moreover, within a given species, paralogous mstn genes may differ in their tissue distribution (16). This suggests that in addition to their role as key regulators of muscle development and growth, fish mstn genes may have pleiotropic roles in the brain and periphery (16). So far, only one mstn gene, namely mstn1, has been investigated in Nile tilapia (25, 26). Herein, we describe the identification of a second, non-muscular mstn gene in the genome of this species. We show that the newly identified timstn2 clusters phylogenetically with other known piscine mstn2 genes and that it is mainly expressed in the fish brain, suggesting its involvement in the regulation of central functions. We therefore exposed adult Nile tilapia to diverse environmental conditions and found that the expression of the two timstn genes varies with tissue and environmental conditions, supportive of separate regulatory mechanisms for each gene. Importantly, analysis of metabolic markers and cortisol demonstrated that the modified expression of timstn is not driven by classical stress response.
Phylogenetic analysis of mstn ORFs showed that piscine mstn genes form two clusters, one that contains mstn1 ORFs, including that of Nile tilapia, and another containing mstn2 ORFs, including the newly identified Nile tilapia mstn2. As demonstrated for other fish, the mstn gene duplication in tilapia is probably a result of a genome duplication event that occurred in a common ancestor during fish evolution (53). Furthermore, the two timstn genes share chromosomal synteny with zebrafish and human Mstn genes. At the peptide level, both tilapia Mstns share relatively high homology with MSTNs of other vertebrates.
Although piscine mstn genes were suggested to have pleiotropic functions, several works have demonstrated their importance as regulators of muscle mass in fish (17, 20, 54). Fish display significant change in growth rates following sexual maturation, and Nile tilapia males are known to grow faster than females (46, 47). Therefore, we analyzed the tissue distribution of the mstn genes in male and female tilapia before and after sexual maturation. Real-time PCR analysis showed that male tilapia expressed more timstn1 in their muscle than females before and after sexual maturation, suggesting sexual dimorphism in timstn1 expression. Similarly, female rare minnow (Gobiocypris rarus) expressed lower levels of mstn than the males in their muscles. Nonetheless, in both sexes mstn1 expression is highest in white muscles (55). Low to intermediate levels of timstn1 expression were found in red muscles and brain of all groups, in the fat of mature males, in the liver and in the gonads of both sexes at both developmental stages, suggesting the involvement of timstn1 in additional metabolic and reproductive functions. In both sexes and maturation stages, the highest expression of timstn2 was found in the brain. Importantly, timstn2 was not detected in red or white muscles of all tested groups. Low levels of timstn2 were also detected in the fish intestine and gonads, both before and after sexual development. A similar pattern was observed in 2-year-old gilthead seabream (Sparus aurata), where high mstn2 expression was evident in the brain with minimal expression in the gonads and no expression at all in the muscle (18). The presence of mstn2 in the brain and gonads suggests an additional role for MSTN in fish, such as neuronal development or regulation of reproductive functions.
Several studies have demonstrated that exposing fish to environmental challenges, such as food shortage or temperature changes, lead to alterations in mstn expression. Yet, the responsiveness of mstn seems to vary between species and challenges (16). We therefore tested how various environmental challenges influence mstn expression in the fish brain and muscles. Most of the challenges we employed elicit a homeostatic response in the hypothalamus (48). Therefore, we analyzed mstn expression separately in the forebrain, midbrain, and hindbrain. Exposing the fish to increased water temperature led to increased expression of timstn1 and timstn2 in the brain, indicating the involvement of the Nile tilapia Mstn system in the central response to environmental challenges. Conversely, high temperature treatment did not affect timstn1 expression in the white muscle and led to a significant decrease of timstn1 in the red muscle, suggesting that timstn1 expression is regulated in a tissue-specific manner. Exposing the fish to increased salinity led to increased expression of timstn1 and timstn2 in the forebrain and hindbrain, while net chasing elicited a significant increase in timstn1 and timstn2 expression only in the hindbrain. The hindbrain compartment comprises the cerebellum and brain stem, whereas the forebrain compartment contains the telencephalon and olfactory bulbs. The cerebellum and, to a lesser extent, the telencephalon are major sites for neurogenesis in the adult fish brain (50). Furthermore, it has been demonstrated that environmental conditions may affect brain size (49). Thus, the increased mstn expression in the hindbrain and forebrain suggests the involvement of these genes in the regulation of tilapia neurogenesis. Furthermore, the modified expression of mstn in the various brain compartments of Nile tilapia support different functions of the MSTN system according to the site of expression. The midbrain compartment included the fish hypothalamus and optic tectum. Thus, alterations in mstn expression in the tilapia midbrain could reflect involvement in the neuroendocrine homeostatic response to the altered environmental conditions. Whether the increased expression of tilapia mstns in the midbrain is neuroendocrine or mitogenesis-related by nature remains to be determined.
In the muscle, MSTN was shown to suppress satellite cell proliferation from fish to mammals (56, 57). Three weeks of starvation led to increased timstn1 expression in both red and white muscles. Considering the key role of mstn1 as a suppressor of muscle growth, this increase was probably intended to inhibit muscles growth during energetic shortage. The observed reduction in timstn1 expression in red muscle may support increased growth and metabolic rate of a poikilothermic animal in a warmer environment. Other treatments did not elicit timstn1 expression in white or red muscles. European sea bass larvae exposed to heat shock or handling did not display altered mstn expression; however, that analysis was performed on whole larvae and under acute challenges (58) and, therefore, it cannot be correlated with our findings. Taken together, these findings suggest that the expression of timstns in the fish brain and muscles is regulated by different mechanisms. These findings are in agreement with other studies in Asian sea bass fry and European sea bass (17, 29).
Environmental stressors stimulate the secretion of stress hormones such as cortisol. Once in circulation, cortisol initiates a secondary response, which involves metabolic changes with aim to restore homeostasis (51). It is not clear how chronic challenges of intensive handling, high salinity, temperature manipulation, and food deprivation affect plasma metabolites such as proteins and triglycerides in Nile tilapia. Skeletal muscle tissue is a major reservoir of body proteins, and muscle mass constitutes a large part of the fish body weight. Therefore, the fish body mass may be influenced by the degree of protein synthesis or degradation (59). Total protein and triglycerides levels in the fish plasma remained unaffected in all treatment groups. As the fish were fed ad libitum prior to the experimental starvation, it is possible that the energetic shortage was compensated by utilization of fat storage. This notion is further supported by the observed cortisol levels, which support low activity of the neuroendocrine stress axis. Taken together, these findings indicate that under the applied experimental conditions, alterations in timstn expression are not conveyed by stress responses to the challenges. Moreover, these alterations were probably part of the fish habituation to the new environmental conditions.
In summary, in this study we have identified a second mstn gene in the Nile tilapia genome and designated it timstn2. We have shown that timstn1 and timstn2 differ in their tissue distribution and between sexes, as well as in their responsiveness to environmental challenges. Furthermore, timstn1 expression in the fish brain was not correlated to its expression in the muscles, suggesting that the regulation of mstn genes expression in Nile tilapia is gene- and tissue-specific. As various environmental challenges affected the expression of both timstn genes, we suggest that the MSTN system is involved in the regulation of Nile tilapia response to external conditions.
Data Availability Statement
The datasets generated for this study can be found in the GenBank MN708486.
Ethics Statement
The animal study was reviewed and approved by Agricultural Research Organization (ARO) Committee for Ethics in Using Experimental Animals, Approval number: 775/18 IL.
Author Contributions
JB designed research. AS-H, GA, KT, and TN performed research. JB, AS-H, and GA analyzed data. JB and AS-H wrote the paper.
Funding
This research was funded by grant 20-04-0046 from the Chief Scientist of the Ministry of Agriculture andRural Development.
Conflict of Interest
The authors declare that the research was conducted in the absence of any commercial or financial relationships that could be construed as a potential conflict of interest.
References
1. McPherron AC, Lawler AM, Lee S-J. Regulation of skeletal muscle mass in mice by a new TGF-p superfamily member. Nature. (1997) 387:83–90. doi: 10.1038/387083a0
2. Sharma M, McFarlane C, Kambadur R, Kukreti H, Bonala S, Srinivasan S. Myostatin: expanding horizons. IUBMB Life. (2015) 67:589–600. doi: 10.1002/iub.1392
3. Amthor H, Otto A, Macharia R, McKinnell I, Patel K. Myostatin imposes reversible quiescence on embryonic muscle precursors. Dev Dyn. (2006) 235:672–80. doi: 10.1002/dvdy.20680
4. McPherron AC, Lee SJ. Double muscling in cattle due to mutations in the myostatin gene. Proc Natl Acad Sci USA. (1997) 94:12457–61. doi: 10.1073/pnas.94.23.12457
5. Rodgers BD, Garikipati DK. Clinical, agricultural, and evolutionary biology of myostatin: a comparative review. Endocr Rev. (2008) 29:513–34. doi: 10.1210/er.2008-0003
6. Elliott B, Renshaw D, Getting S, Mackenzie R. The central role of myostatin in skeletal muscle and whole body homeostasis. Acta Physiol. (2012) 205:324–40. doi: 10.1111/j.1748-1716.2012.02423.x
7. Kang J-D, Kim S, Zhu H-Y, Jin L, Guo Q, Li X-C, et al. Generation of cloned adult muscular pigs with myostatin gene mutation by genetic engineering. RSC Adv. (2017) 7:12541–9. doi: 10.1039/C6RA28579A
8. Lee J-H, Momani J, Kim YM, Kang C-K, Choi J-H, Baek H-J, et al. Effective RNA-silencing strategy of Lv-MSTN/GDF11 gene and its effects on the growth in shrimp, Litopenaeus vannamei. Comp Biochem Physiol B Biochem Mol Biol. (2015) 179:9–16. doi: 10.1016/j.cbpb.2014.09.005
9. Lv Q, Yuan L, Deng J, Chen M, Wang Y, Zeng J, et al. Efficient generation of myostatin gene mutated rabbit by CRISPR/Cas9. Sci Rep. (2016) 6:25029. doi: 10.1038/srep25029
10. Xu C. Analysis of myostatin gene structure, expression and function in zebrafish. J Exp Biol. (2003) 206:4067–79. doi: 10.1242/jeb.00635
11. Xu TS, Gu LH, Zhang XH, Ye BG, Liu XL, Hou SS. Characterization of myostatin gene (MSTN) of Pekin duck and the association of its polymorphism with breast muscle traits. Genet Mol Res. (2013) 12:3166–77. doi: 10.4238/2013.February.28.18
12. Kerr T, Roalson EH, Rodgers BD. Phylogenetic analysis of the myostatin gene sub-family and the differential expression of a novel member in zebrafish. Evol Dev. (2005) 7:390–400. doi: 10.1111/j.1525-142X.2005.05044.x
13. Rodgers BD, Roalson EH, Weber GM, Roberts SB, Goetz FW. A proposed nomenclature consensus for the myostatin gene family. Am J Physiol Endocrinol Metab. (2007) 292:E371–E2. doi: 10.1152/ajpendo.00395.2006
14. Amali AA, Lin CJ-F, Chen Y-H, Wang W-L, Gong H-Y, Lee C-Y, et al. Up-regulation of muscle-specific transcription factors during embryonic somitogenesis of zebrafish (Danio rerio) by knock-down of myostatin-1. Dev Dyn. (2004) 229:847–56. doi: 10.1002/dvdy.10454
15. Rodgers BD. Isolation and characterization of myostatin complementary deoxyribonucleic acid clones from two commercially important fish: Oreochromis mossambicus and Morone chrysops. Endocrinology. (2001) 142:1412–8. doi: 10.1210/endo.142.4.8097
16. Gabillard JC, Biga PR, Rescan PY, Seiliez I. Revisiting the paradigm of myostatin in vertebrates: insights from fishes. Gen Comp Endocrinol. (2013) 194:45–54. doi: 10.1016/j.ygcen.2013.08.012
17. De Santis C, Jerry DR. Differential tissue-regulation of myostatin genes in the teleost fish Lates calcarifer in response to fasting. Evidence for functional differentiation. Mol Cell Endocrinol. (2011) 335:158–65. doi: 10.1016/j.mce.2011.01.011
18. Maccatrozzo L, Bargelloni L, Cardazzo B, Rizzo G, Patarnello T. A novel second myostatin gene is present in teleost fish. FEBS Lett. (2001) 509:36–40. doi: 10.1016/S0014-579303124-6
19. Roberts SB, Goetz FW. Differential skeletal muscle expression of myostatin across teleost species, and the isolation of multiple myostatin isoforms. FEBS Lett. (2001) 491:212–6. doi: 10.1016/S0014-579302196-2
20. Chisada S-i, Okamoto H, Taniguchi Y, Kimori Y, Toyoda A, Sakaki Y, et al. Myostatin-deficient medaka exhibit a double-muscling phenotype with hyperplasia and hypertrophy, which occur sequentially during post-hatch development. Dev Biol. (2011) 359:82–94. doi: 10.1016/j.ydbio.2011.08.027
21. Wang C, Chen Y-L, Bian W-P, Xie S-L, Qi G-L, Liu L, et al. Deletion of mstna and mstnb impairs the immune system and affects growth performance in zebrafish. Fish Shellfish Immunol. (2018) 72:572–80. doi: 10.1016/j.fsi.2017.11.040
22. Zhong Z, Niu P, Wang M, Huang G, Xu S, Sun Y, et al. Targeted disruption of sp7 and myostatin with CRISPR-Cas9 results in severe bone defects and more muscular cells in common carp. Sci Rep. (2016) 6:22953. doi: 10.1038/srep22953
23. Kishimoto K, Washio Y, Yoshiura Y, Toyoda A, Ueno T, Fukuyama H, et al. Production of a breed of red sea bream Pagrus major with an increase of skeletal muscle mass and reduced body length by genome editing with CRISPR/Cas9. Aquaculture. (2018) 495:415–27. doi: 10.1016/j.aquaculture.2018.05.055
24. Weber TE, Bosworth BG. Effects of 28 day exposure to cold temperature or feed restriction on growth, body composition, and expression of genes related to muscle growth and metabolism in channel catfish. Aquaculture. (2005) 246:483–92. doi: 10.1016/j.aquaculture.2005.02.032
25. Nebo C, Portella MC, Carani FR, de Almeida FLA, Padovani CR, Carvalho RF, et al. Short periods of fasting followed by refeeding change the expression of muscle growth-related genes in juvenile Nile tilapia (Oreochromis niloticus). Comp Biochem Physiol B Biochem Mol Biol. (2013) 164:268–74. doi: 10.1016/j.cbpb.2013.02.003
26. Lima ECS, Povh JA, Otonel RAA, Leonhardt JH, Alfieri AA, Headley SA, et al. Morphology and muscle gene expression in GIFT and Supreme Nile tilapia varieties reared in two cultivation systems. Genet Mol Res. (2017) 16:gmr16019407. doi: 10.4238/gmr16019407
27. Chauvigné F, Gabillard JC, Weil C, Rescan PY. Effect of refeeding on IGFI, IGFII, IGF receptors, FGF2, FGF6, and myostatin mRNA expression in rainbow trout myotomal muscle. Gen Comp Endocrinol. (2003) 132:209–15. doi: 10.1016/S0016-648000081-9
28. Vianello S, Brazzoduro L, Dalla Valle L, Belvedere P, Colombo L. Myostatin expression during development and chronic stress in zebrafish (Danio rerio). J Endocrinol. (2003) 176:47–59. doi: 10.1677/joe.0.1760047
29. Terova G, Bernardini G, Binelli G, Gornati R, Saroglia M. cDNA encoding sequences for myostatin and FGF6 in sea bass (Dicentrarchus labrax, L.) and the effect of fasting and refeeding on their abundance levels. Domest Anim Endocrinol. (2006) 30:304–19. doi: 10.1016/j.domaniend.2005.08.003
30. Xie S, Zhou A, Feng Y, Wang Z, Fan L, Zhang Y, et al. Effects of fasting and re-feeding on mstn and mstnb genes expressions in Cranoglanis bouderius. Gene. (2019) 682:1–12. doi: 10.1016/j.gene.2018.09.050
31. Rodgers BD, Weber GM, Kelley KM, Levine MA. Prolonged fasting and cortisol reduce myostatin mRNA levels in tilapia larvae; short-term fasting elevates. Am J Physiol Regul Integr Comp Physiol. (2003) 284:R1277–86. doi: 10.1152/ajpregu.00644.2002
32. Bostock J, McAndrew B, Richards R, Jauncey K, Telfer T, Lorenzen K, et al. Aquaculture: global status and trends. Philoso Trans R Soc B Biol Sci. (2010) 365:2897–912. doi: 10.1098/rstb.2010.0170
33. Guyon R, Rakotomanga M, Azzouzi N, Coutanceau JP, Bonillo C, D'Cotta H, et al. A high-resolution map of the Nile tilapia genome: a resource for studying cichlids and other percomorphs. BMC Genomics. (2012) 13:222. doi: 10.1186/1471-2164-13-222
34. Soler L, Conte MA, Katagiri T, Howe AE, Lee BY, Amemiya C, et al. Comparative physical maps derived from BAC end sequences of tilapia (Oreochromis niloticus). BMC Genomics. (2010) 11:636. doi: 10.1186/1471-2164-11-636
35. Altschul SF, Madden TL, Schaffer AA, Zhang J, Zhang Z, Miller W, et al. Gapped BLAST and PSI-BLAST: a new generation of protein database search programs. Nucleic Acids Res. (1997) 25:3389–402. doi: 10.1093/nar/25.17.3389
36. Kent WJ, Sugnet CW, Furey TS, Roskin KM, Pringle TH, Zahler AM, et al. The human genome browser at UCSC. Genome Res. (2002) 12:996–1006. doi: 10.1101/gr.229102
37. Kumar S, Stecher G, Tamura K. MEGA7: molecular evolutionary genetics analysis version 7.0 for bigger datasets. Mol Biol Evol. (2016) 33:1870–4. doi: 10.1093/molbev/msw054
38. Simoes JM, Teles MC, Oliveira RF, Van der Linden A, Verhoye M. A three-dimensional stereotaxic MRI brain atlas of the cichlid fish Oreochromis mossambicus. PLoS ONE. (2012) 7:e44086. doi: 10.1371/journal.pone.0044086
39. Yang CG, Wang XL, Tian J, Liu W, Wu F, Jiang M, et al. Evaluation of reference genes for quantitative real-time RT-PCR analysis of gene expression in Nile tilapia (Oreochromis niloticus). Gene. (2013) 527:183–92. doi: 10.1016/j.gene.2013.06.013
40. Livak KJ, Schmittgen TD. Analysis of relative gene expression data using real-time quantitative PCR and the 2–ΔΔCT method. Methods. (2001) 25:402–8. doi: 10.1006/meth.2001.1262
41. Schmittgen TD, Livak KJ. Analyzing real-time PCR data by the comparative CT method. Nat Protoc. (2008) 3:1101–8. doi: 10.1038/nprot.2008.73
42. Aizen J, Kasuto H, Golan M, Zakay H, Levavi-Sivan B. Tilapia follicle-stimulating hormone (FSH): immunochemistry, stimulation by gonadotropin-releasing hormone, and effect of biologically active recombinant FSH on steroid secretion. Biol Reprod. (2007) 76:692–700. doi: 10.1095/biolreprod.106.055822
43. Yeh CM, Glock M, Ryu S. An optimized whole-body cortisol quantification method for assessing stress levels in larval zebrafish. PLoS ONE. (2013) 8:e79406. doi: 10.1371/journal.pone.0079406
44. Tamura K, Nei M. Estimation of the number of nucleotide substitutions in the control region of mitochondrial DNA in humans and chimpanzees. Mol Biol Evol. (1993) 10:512–26. doi: 10.1093/oxfordjournals.molbev.a040023
45. Felsenstein J. Confidence limits on phylogenies: an approach using the bootstrap. Evolution. (1985) 39:783–91. doi: 10.1111/j.1558-5646.1985.tb00420.x
46. Wan ZY, Xia JH, Lin G, Wang L, Lin VC, Yue GH. Genome-wide methylation analysis identified sexually dimorphic methylated regions in hybrid tilapia. Sci Rep. (2016) 6:35903. doi: 10.1038/srep35903
47. Bhatta S, Iwai T, Miura C, Higuchi M, Shimizu-Yamaguchi S, Fukada H, et al. Gonads directly regulate growth in teleosts. Proc Natl Acad Sci USA. (2012) 109:11408–12. doi: 10.1073/pnas.1118704109
48. Biran J, Blechman J, Wircer E, Levkowitz G. Development and function of the zebrafish neuroendocrine system. In: Ludwig M, Levkowitz G, editors. Model Animals in Neuroendocrinology: From Worm to Mouse to Man. Hoboken, NJ: Wiley-Blackwell (2018). p. 101–31.
49. Ebbesson LOE, Braithwaite VA. Environmental effects on fish neural plasticity and cognition. J Fish Biol. (2012) 81:2151–74. doi: 10.1111/j.1095-8649.2012.03486.x
50. Zupanc GKH. Neurogenesis and neuronal regeneration in the adult fish brain. J Comp Physiol A. (2006) 192:649. doi: 10.1007/s00359-006-0104-y
51. Mommsen TP, Vijayan MM, Moon TW. Cortisol in teleosts: dynamics, mechanisms of action, and metabolic regulation. Rev Fish Biol Fisher. (1999) 9:211–68. doi: 10.1023/A:1008924418720
52. Galt NJ, McCormick SD, Froehlich JM, Biga PR. A comparative examination of cortisol effects on muscle myostatin and HSP90 gene expression in salmonids. Gen Comp Endocrinol. (2016) 237:19–26. doi: 10.1016/j.ygcen.2016.07.019
53. Taylor JS. Genome duplication, a trait shared by 22,000 species of ray-finned fish. Genome Res. (2003) 13:382–90. doi: 10.1101/gr.640303
54. Sun Y, Yu X, Tong J. Polymorphisms in myostatin gene and associations with growth traits in the common carp (Cyprinus carpio L.). Int J Mol Sci. (2012) 13:14956–61. doi: 10.3390/ijms131114956
55. Yang Y, Peng K, Liu X, Zhao D, Duan J, Hu W, et al. Effects of sex steroids on expression of myostatin in rare minnow, Gobiocypris rarus. Aquaculture. (2012) 350–3:1–7. doi: 10.1016/j.aquaculture.2012.04.031
56. Garikipati DK, Rodgers BD. Myostatin inhibits myosatellite cell proliferation and consequently activates differentiation: evidence for endocrine-regulated transcript processing. J Endocrinol. (2012) 215:177–87. doi: 10.1530/JOE-12-0260
57. McCroskery S, Thomas M, Maxwell L, Sharma M, Kambadur R. Myostatin negatively regulates satellite cell activation and self-renewal. J Cell Biol. (2003) 162:1135–47. doi: 10.1083/jcb.200207056
58. Bertotto D, Poltronieri C, Negrato E, Richard J, Pascoli F, Simontacchi C, et al. Whole body cortisol and expression of HSP70, IGF-I and MSTN in early development of sea bass subjected to heat shock. Gene Comp Endocrinol. (2011) 174:44–50. doi: 10.1016/j.ygcen.2011.08.003
Keywords: homeostasis, myostatin (MSTN), nile tilapia (Oreochromis nilocticus), environmental challenges, gene duplication
Citation: Segev-Hadar A, Alupo G, Tal K, Nitzan T and Biran J (2020) Identification and Characterization of a Non-muscular Myostatin in the Nile Tilapia. Front. Endocrinol. 11:94. doi: 10.3389/fendo.2020.00094
Received: 02 December 2019; Accepted: 14 February 2020;
Published: 28 February 2020.
Edited by:
Krystyna Pierzchala-Koziec, University of Agriculture in Krakow, PolandReviewed by:
Honoo Satake, Suntory Foundation for Life Sciences, JapanLei Zhou, Guangxi University, China
Copyright © 2020 Segev-Hadar, Alupo, Tal, Nitzan and Biran. This is an open-access article distributed under the terms of the Creative Commons Attribution License (CC BY). The use, distribution or reproduction in other forums is permitted, provided the original author(s) and the copyright owner(s) are credited and that the original publication in this journal is cited, in accordance with accepted academic practice. No use, distribution or reproduction is permitted which does not comply with these terms.
*Correspondence: Jakob Biran, amFrb2JAdm9sY2FuaS5hZ3JpLmdvdi5pbA==