 Yujuan Xiang1,2†
 Wenzhong Zhou1,3†
 Xuening Duan4Zhimin Fan5Shu Wang6Shuchen Liu1,3Liyuan Liu1,2Fei Wang1,2Lixiang Yu1,2Fei Zhou1,2Shuya Huang1,2Liang Li1,2Qiang Zhang1,2Qinye Fu1,2Zhongbing Ma1,2Dezong Gao1,2Shude Cui7Cuizhi Geng8Xuchen Cao9Zhenlin Yang10Xiang Wang11Hong Liang12Hongchuan Jiang13Haibo Wang14Guolou Li15Qitang Wang16Jianguo Zhang17Feng Jin18Jinhai Tang19Fuguo Tian20Chunmiao Ye1,3
 Zhigang Yu1,21*
- 1Department of Breast Surgery, The Second Hospital of Shandong University, Jinan, China
- 2Institute of Translational Medicine of Breast Disease Prevention and Treatment, Shandong University, Jinan, China
- 3School of Medicine, Shandong University, Jinan, China
- 4Breast Disease Center, Peking University First Hospital, Beijing, China
- 5Department of Breast Surgery, The First Hospital of Jilin University, Changchun, China
- 6Breast Disease Center, Peking University People's Hospital, Beijing, China
- 7Department of Breast Surgery, Affiliated Tumor Hospital of Zhengzhou University, Zhengzhou, China
- 8Breast Center, The Fourth Hospital of Hebei Medical University, Shijiazhuang, China
- 9Department of Breast Surgery, Tianjin Medical University Cancer Institute and Hospital, Tianjin, China
- 10Department of Thyroid and Breast Surgery, The First Affiliated Hospital of Binzhou Medical University, Binzhou, China
- 11Department of Breast Surgery, Cancer Hospital, Chinese Academy of Medical Sciences, Beijing, China
- 12Department of General Surgery, Linyi People's Hospital, Linyi, China
- 13Department of General Surgery, Beijing Chaoyang Hospital, Beijing, China
- 14Breast Center, Qingdao University Affiliated Hospital, Qingdao, China
- 15Department of Breast and Thyroid Surgery, Weifang Traditional Chinese Hospital, Weifang, China
- 16Department of Breast Surgery, The Second Affiliated Hospital of Qingdao Medical College, Qingdao Central Hospital, Qingdao, China
- 17Department of General Surgery, The Second Affiliated Hospital of Harbin Medical University, Harbin, China
- 18Department of Breast Surgery, The First Affiliated Hospital of China Medical University, Shenyang, China
- 19Department of General Surgery, Nanjing Medical University Affiliated Cancer Hospital Cancer Institute of Jiangsu Province, Nanjing, China
- 20Department of Breast Surgery, Shanxi Cancer Hospital, Taiyuan, China
- 21Suzhou Institute, Shandong University, Suzhou, China
by Xiang, Y., Zhou, W., Duan, X., Fan, Z., Wang, S., Liu, S., et al. (2020) Front. Endocrinol. 10:905. doi: 10.3389/fendo.2019.00905
In the original article, there were mistakes in Table 6, Table 7, Table 9 as published. The numbers of patients in Table 6 and Table 9 were incorrect. The contents in Table 7 and Table 9 were repetitive to some degree in that we had shown the association between adiponectin with metabolic syndrome and HW phenotype. Therefore, for this Correction, we analyzed the association between adiponectin and metabolic syndrome, and the association in pre- and postmenopausal subgroups in Table 7. In Table 9, we converted the numerical variable into categorical variable, which should provide better guide for clinical practice. In our view, this avoids the repetition. These new tables appear below as Tables 6, 7, 9. The authors apologize for these errors and any confusion that may have arisen due to them and hopes these additional tables sufficiently addresses them.
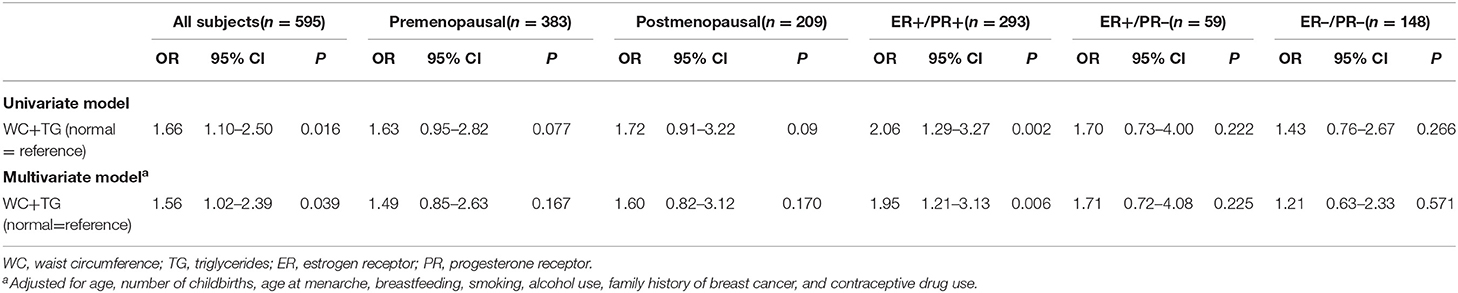
Table 6. Association between HW phenotype and breast cancer by logistic regression.

Table 7. Association between total adiponectin, HMW adiponectin, HMW/total ratio, and metabolic syndrome.
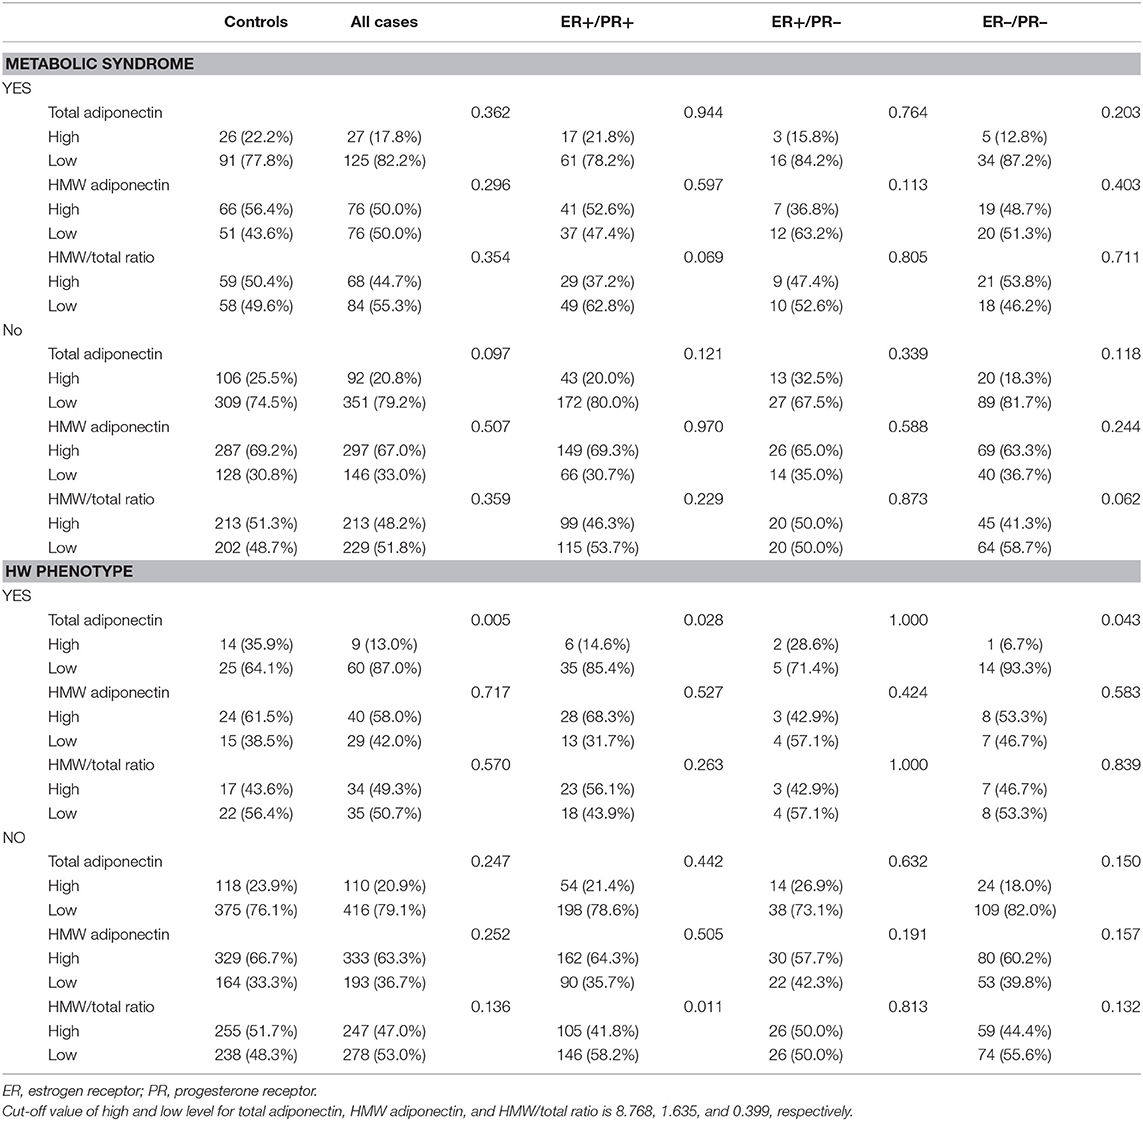
Table 9. The association among metabolic syndrome, breast cancer, and adiponectin.
In the original article, corresponding text of Table 6, Table 7, and Table 9 was corrected.
A correction has been made to Abstract, Results, Paragraph number 1:
In addition, total adiponectin levels among breast cancer patients were much lower than among controls (p = 0.005) only in the HW phenotype subgroup. Furthermore, the HW phenotype was associated with increased risk of estrogen receptor/progesterone receptor-positive (ER+/PR+) breast cancer, with a 95% (OR = 1.95, 95% CI:1.21–3.13) increase. However, there was no significant association between the HW phenotype and both ER+/PR– and ER–/PR– subtypes.
A correction has been made to Results, Cluster Mode of HW Phenotype Significantly Increases Breast Cancer Risk, Paragraph number 3:
HW phenotype was associated with ER+/PR+ breast cancer, with a 95% (OR = 1.95, 95% CI:1.21–3.13) increase in risk for women with a positive HW phenotype. However, there was no significant association between HW phenotype and both ER+/PR– and ER–/PR– subtypes.
A correction has been made to Results, Adiponectin Might Be the Mechanism Linking Metabolic Syndrome to Breast Cancer, Paragraph number 2:
total adiponectin levels among breast cancer patients were much lower than among the controls(p = 0.005) in the HW phenotype subgroup.
A correction has been made to Results, Adiponectin Might Be the Mechanism Linking Metabolic Syndrome to Breast Cancer, Paragraph number 3:
there was a significant difference of total adiponectin in ER+/PR+ (p = 0.028) and ER–/PR– (p = 0.043) breast cancer compared to the controls, who were much lower in the HW phenotype subgroup.
A correction has been made to Discussion, Paragraph number 6:
We revealed that HW phenotype was an independent risk factor for the ER+/PR+ subtype.
The authors apologize for this error and state that this does not change the scientific conclusions of the article in any way. The original article has been updated.
Keywords: breast cancer, metabolic syndrome, hypertriglyceridemic-waist phenotype, adiponectin, risk
Citation: Xiang Y, Zhou W, Duan X, Fan Z, Wang S, Liu S, Liu L, Wang F, Yu L, Zhou F, Huang S, Li L, Zhang Q, Fu Q, Ma Z, Gao D, Cui S, Geng C, Cao X, Yang Z, Wang X, Liang H, Jiang H, Wang H, Li G, Wang Q, Zhang J, Jin F, Tang J, Tian F, Ye C and Yu Z (2020) Addendum: Metabolic Syndrome, and Particularly the Hypertriglyceridemic-Waist Phenotype, Increases Breast Cancer Risk, and Adiponectin Is a Potential Mechanism: A Case–Control Study in Chinese Women. Front. Endocrinol. 11:227. doi: 10.3389/fendo.2020.00227
Received: 28 February 2020; Accepted: 30 March 2020;
Published: 04 June 2020.
Edited and reviewed by: Eva Surmacz, Allysta Pharmaceuticals, Inc., United States
Copyright © 2020 Xiang, Zhou, Duan, Fan, Wang, Liu, Liu, Wang, Yu, Zhou, Huang, Li, Zhang, Fu, Ma, Gao, Cui, Geng, Cao, Yang, Wang, Liang, Jiang, Wang, Li, Wang, Zhang, Jin, Tang, Tian, Ye and Yu. This is an open-access article distributed under the terms of the Creative Commons Attribution License (CC BY). The use, distribution or reproduction in other forums is permitted, provided the original author(s) and the copyright owner(s) are credited and that the original publication in this journal is cited, in accordance with accepted academic practice. No use, distribution or reproduction is permitted which does not comply with these terms.
*Correspondence: Zhigang Yu, eXpnQG1lZG1haWwuY29tLmNu
†These authors have contributed equally to this work and share first authorship