 Alexandra E. Butler1*
 Vimal Ramachandran2
 Thomas Keith Cunningham3
 Rhiannon David4
 Nigel J. Gooderham4Manasi Benurwar2
 Soha R. Dargham2
 Shahina Hayat2
 Thozhukat Sathyapalan3S Hani Najafi-Shoushtari2,5Stephen L. Atkin6
- 1Diabetes Research Center (DRC), Qatar Biomedical Research Institute (QBRI), Hamad Bin Khalifa University (HBKU), Qatar Foundation (QF), Doha, Qatar
- 2Division of Research, Weill Cornell Medicine-Qatar, Qatar Foundation, Education City, Doha, Qatar
- 3Academic Diabetes, Endocrinology and Metabolism, Hull York Medical School, University of Hull, Heslington, United Kingdom
- 4Department of Surgery & Cancer, Faculty of Medicine, Imperial College, London, United Kingdom
- 5Department of Cell and Developmental Biology, Weill Cornell Medicine, New York, NY, United States
- 6Postgraduate Studies and Research, Royal College of Surgeons Ireland, Al Muharraq, Bahrain
Background: Small noncoding microRNA (miRNA) have regulatory functions in polycystic ovary syndrome (PCOS) that differ to those in women without PCOS. However, little is known about miRNA expression in women with PCOS who are not insulin resistant (IR).
Methods: Circulating miRNAs were measured using quantitative polymerase chain reaction (qPCR) in 24 non-obese BMI and age matched women with PCOS and 24 control women. A miRNA data set was used to determine miRNA levels.
Results: Women with PCOS showed a higher free androgen index (FAI) and anti-mullerian hormone (AMH) but IR did not differ. Four miRNAs (miR-1260a, miR-18b-5p, miR-424-5p, and miR let-7b-3p) differed between control and PCOS women that passed the false discovery rate (FDR) out of a total of 177 circulating miRNAs that were detected. MiRNA let-7b-3p correlated with AMH in PCOS (p < 0.05). When the groups were combined, miR-1260a correlated with FAI and let-7b-3p correlated with body mass index (BMI) (p < 0.05). There was no correlation to androgen levels. Ingenuity pathway analysis showed that nine of the top 10 miRNAs reported were associated with inflammatory pathways.
Conclusion: When IR did not differ between PCOS and control women, only four miRNA differed significantly suggesting that IR may be a driver for many of the miRNA changes reported. Let-7b-3p was related to AMH in PCOS, and to BMI as a group, whilst miR-1260a correlated with FAI. Androgen levels, however, had no effect upon circulating miRNA profiles. The expressed miRNAs were associated with the inflammatory pathway involving TNF and IL6.
Introduction
In females of reproductive age, polycystic ovarian syndrome (PCOS) is the leading disorder of the endocrine system, affecting 9–21% of females and PCOS is a major cause of anovulatory infertility (1). Characteristic findings in PCOS include obesity, type 2 diabetes, hyperandrogenism, insulin resistance (IR), and hypercholesterolemia (2). Genetic factors, such as mutations, and changes in epigenetics and/or expression of non-coding RNAs, are thought to play a significant role in the etiology of PCOS (3–5).
MiRNAs are short (transcripts are ~22 nucleotides long) endogenous non-coding RNAs that bind (6) via their first eight bases to messenger RNA (mRNA) transcripts, resulting in post-transcriptional regulation of gene expression through mRNA degradation and translational repression (7–10). MiRNAs attenuate the expression of a multitude of target mRNAs regulating biological and cellular pathways. It is, therefore, not surprising that miRNAs play a role in obesity and related conditions such as insulin resistance, glucose intolerance, type 2 diabetes and dyslipidemias (11–15).
MiRNA expression in the serum of PCOS women is therefore likely to be complex, and studies in the literature appear discordant (16). It is reported that miR-21, miR-27b, miR-103, and miR-155 expression is altered in both obesity and in PCOS, and therefore indirectly in IR (17). MiR-93 has also been implicated in downregulating the expression of SLC2A4, an insulin-sensitive glucose transporter, in adipose tissue (18) where it is overexpressed in women with PCOS with insulin resistance (19), though how this relates to the circulating miRNA is unclear. Others have reported several tissue related miRNA to be associated with IR (6), examples being miR-135 in endothelial cells (20) and let7 in muscle cells (21).
It is therefore clear that miRNAs are related to insulin resistance, but no study has been undertaken to date to determine if miRNAs differ in a PCOS population that was not insulin resistant compared to a control population.
Materials and Methods
Study Design
This was a prospective cohort study and was performed from January 2014 to January 2016 within the Hull Hospitals following approval by the Yorkshire and The Humber NRES ethical committee, UK, and all women gave their written informed consent. All women attending the IVF clinic for treatment of their subfertility by means of assisted conception were approached, of whom 60 subjects (30 PCOS and 30 controls) agreed to participate and were concurrently recruited. Forty-eight women, 24 PCOS subjects and 24 normal controls, aged between 20–44 years who fulfilled the criteria of not having insulin resistance were included in the study (HOMA-IR less than 2). For the diagnosis of PCOS, two of three diagnostic criteria of the Rotterdam consensus were used; these criteria are (1) clinical and biochemical hyperandrogenemia, requiring a Ferriman-Gallwey score of >8 and a free androgen index of >4 respectively, (2) oligomenorrhea or amenorrhea and (3) polycystic ovaries seen on transvaginal ultrasound (22). Study participants had no other condition or illness and all women were on folic acid 400 µg daily, but no other medication. Testing was undertaken to ensure that no patient had any of the following endocrine conditions: non-classical 21-hydroxylase deficiency, hyperprolactinaemia, Cushing’s disease or an androgen-secreting tumour. Control women were age and body mass index (BMI) matched to the PCOS patients. Demographic data for both control and PCOS women is shown in Table 1.
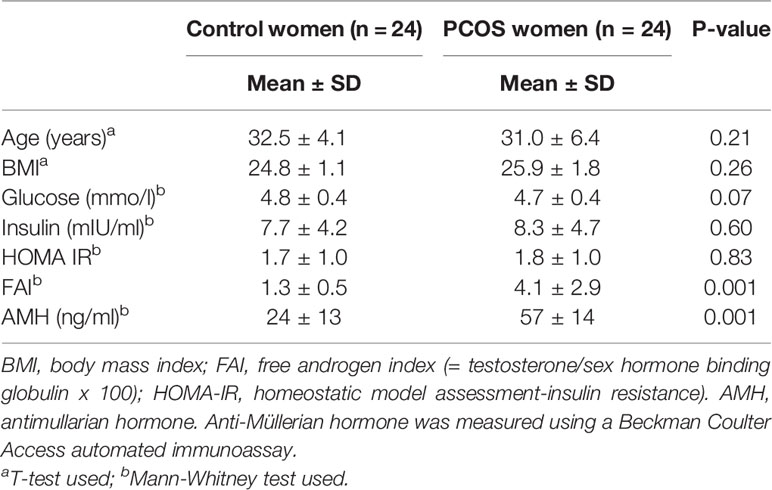
Table 1 Characteristics of control and PCOS subjects showing that whilst matched for age and body mass index, PCOS subjects had higher androgen (free androgen index) and anti-Mullerian hormone (AMH) levels.
The primary endpoint was the expression of miRNA between non-insulin resistant PCOS and age and BMI matched control subjects.
Sample Collection
Following an overnight fast, blood samples were taken in the follicular phase of the cycle. Serum was collected and stored frozen at -80°C for batch analysis. Serum testosterone was measured by isotope dilution liquid chromatography- tandem mass spectrometry (Waters Corporation, Manchester, UK). Sex hormone binding globulin (SHBG) was determined using an immunometric assay (following the manufacturer-recommended protocol), the fluorescence being detected using a DPC Immulite 2000 analyzer. The free androgen index (FAI) was calculated from the formula: total testosterone x100/SHBG. Serum insulin was determined by competitive chemiluminescent immunoassay using a DPC Immulite 2000 analyzer (Euro/DPC, Llanberis, UK) following the manufacturer-recommended protocol with no stated cross-reactivity with proinsulin; analytical sensitivity was 2 µU/ml and the coefficient of variation (CV) was 6%. Plasma glucose was measured using the manufacturer-recommended protocol on a Synchron LX 20 analyzer (Beckman-Coulter) with a CV of 1.2% at the mean glucose concentration of 5.3mmol/liter. Insulin resistance was calculated using the standard HOMA method [HOMA-IR = (insulin x glucose)/22.5]. Anti-Müllerian hormone was measured using a Beckman Coulter Access automated immunoassay; between run precision was <3% across the range measured (23).
MiRNA Profiling and Analysis
Total RNA was isolated from 200 µl plasma of each sample using the miRCURY RNA Isolation Kit - Biofluids (Exiqon; acquired by Qiagen) following the manufacturer-recommended protocol. An on-column DNase digestion was performed for 15 min during the RNA extraction procedure based on manufacturer guidelines to remove contaminating DNA. Since precise estimation of RNA concentration from biofluids such as plasma is difficult (24), reverse transcription was performed with equal volumes of RNA from each sample (4 µl of RNA in 20 µl reverse transcription reaction volume) using Exiqon Universal cDNA Synthesis Kit II following the manufacturer’s protocol. Such a method of inputting equal volumes of total RNA into the cDNA synthesis reaction has been described earlier (25). RNA integrity and reverse transcription efficiency were assessed using representative samples that were loaded on to miRNA QC PCR Panel (Exiqon). Quality control was ensured by monitoring diagnostic assays for miRNAs that are expressed in various tissues and present on the QC panel. Additionally, the QC panel also contains assays for the synthetic RNA isolation spike-ins, UniSp2, 4 and 5 (Exiqon), that were added prior to RNA isolation and the cDNA synthesis spike-ins, UniSP6 and cel-miR-39-3p (Exiqon), added prior to reverse transcription. To perform qPCR, 2x Exilent SYBR Green master mix (Exiqon) was mixed with fifty-fold diluted cDNA and 4 μl per 2 ml ROX Reference Dye (ThermoFisher Scientific) before loading on to Exiqon Serum/Plasma Focus microRNA PCR Panel, 384 well (V4.M). The Exiqon Serum/Plasma Focus microRNA PCR Panel used for miRNA profiling in this study contains primer sets for 179 circulating miRNAs in addition to assays for synthetic spike-ins and reference miRNAs. Amplification was performed using QuantStudio 12K Flex Real-Time PCR System (ThermoFisher Scientific) followed by pre-processing of raw data and statistical analysis using GenEx qPCR analysis software, version 6 (MultiD). Pre-processing of the raw data was conducted as follows. Inter-panel differences among runs were normalized with the UniSp3 spike-in contained on the panels. False positive amplifications were eliminated by running a no-template negative control panel and then setting a ΔCt of 1 between the sample and negative control for every miRNA assayed. To identify and leave out haemolysed samples, a ΔCt >7 between hsa-miR-23a-3p and hsa-miR-451a was set as a cutoff as described (26, 27). Data was normalized against the global mean of all expressed miRNAs with a Ct less than 35. Upon completion of pre-processing, samples were divided into two groups for statistical analysis, PCOS, and controls.
Ingenuity Pathway Analysis
Ingenuity Pathways Analysis (Qiagen, Redwood City, USA) was undertaken on the miRNA data. IPA is a web-based bioinformatics application in which the miRNA data is upload and that then generates lists of genes and allows interactive building of networks to represent biological systems. Pathways overrepresented by the FDR-significant miRNA changes at q<0.05 (28) were identified.
Statistics
No data on PCOS without insulin resistance and miRNA expression were available to undertake a formal power analysis on changes in miRNA expression levels; therefore, this study was conducted as a pilot study. Birkett and Day (29) have suggested a minimum of 20 degrees-of-freedom to allow an estimation of variance from which a larger trial could be powered; therefore, in this study, 24 subjects in each group were recruited. Statistical analysis was calculated using SPSS (v22, Chicago, Illinois). Data presentation: for continuous data, the descriptive data is here presented as mean ± SD. Students t-test was used to compare between means; Mann Whitney tests were used for data that violated the assumptions of normality when tested using the Kolmogorov-Smirnov test. Spearman’s correlation test was used to assess associations. An unpaired two-tailed t-test with Bonferroni correction was used in order to test any paired changes in miRNA expression levels between the PCOS and control women. False discovery rates (FDR) of q<0.05 (28) were taken as significant.
Results
Baseline data for the 24 PCOS patients and the 24 control patients are shown in Table 1, where it can be seen that the subjects were non-obese, matched for age and BMI, and were not insulin resistant.
Four miRNAs passed the false discovery rate (FDR) and differed between the PCOS subjects and controls, as shown in Table 2 and Figure 1. A total of 177 circulating miRNAs were detected (shown in Supplemental Table 1); the 4 miRNA that passed FDR p<0.05 that differed between normal women and PCOS were miR-1260a (p = 0.015), miR-18b-5p (p = 0.029), miR-424-5p (p = 0.038), and let-7b-3p (p = 0.042). Table 3 shows the correlation of the demographic features with the miRNAs. Let-7b-3p correlated with AMH in PCOS (p < 0.05), and when the groups were combined miR-1260a correlated with free androgen index (FAI) and AMH; let-7b-3p correlated with BMI (p < 0.05).
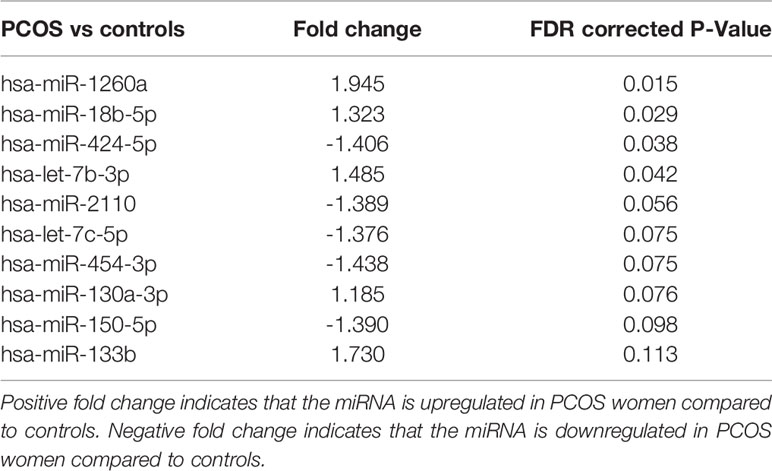
Table 2 Top 10 miRNA detected, four of which differed significantly between patients with and without PCOS matched for age and BMI.
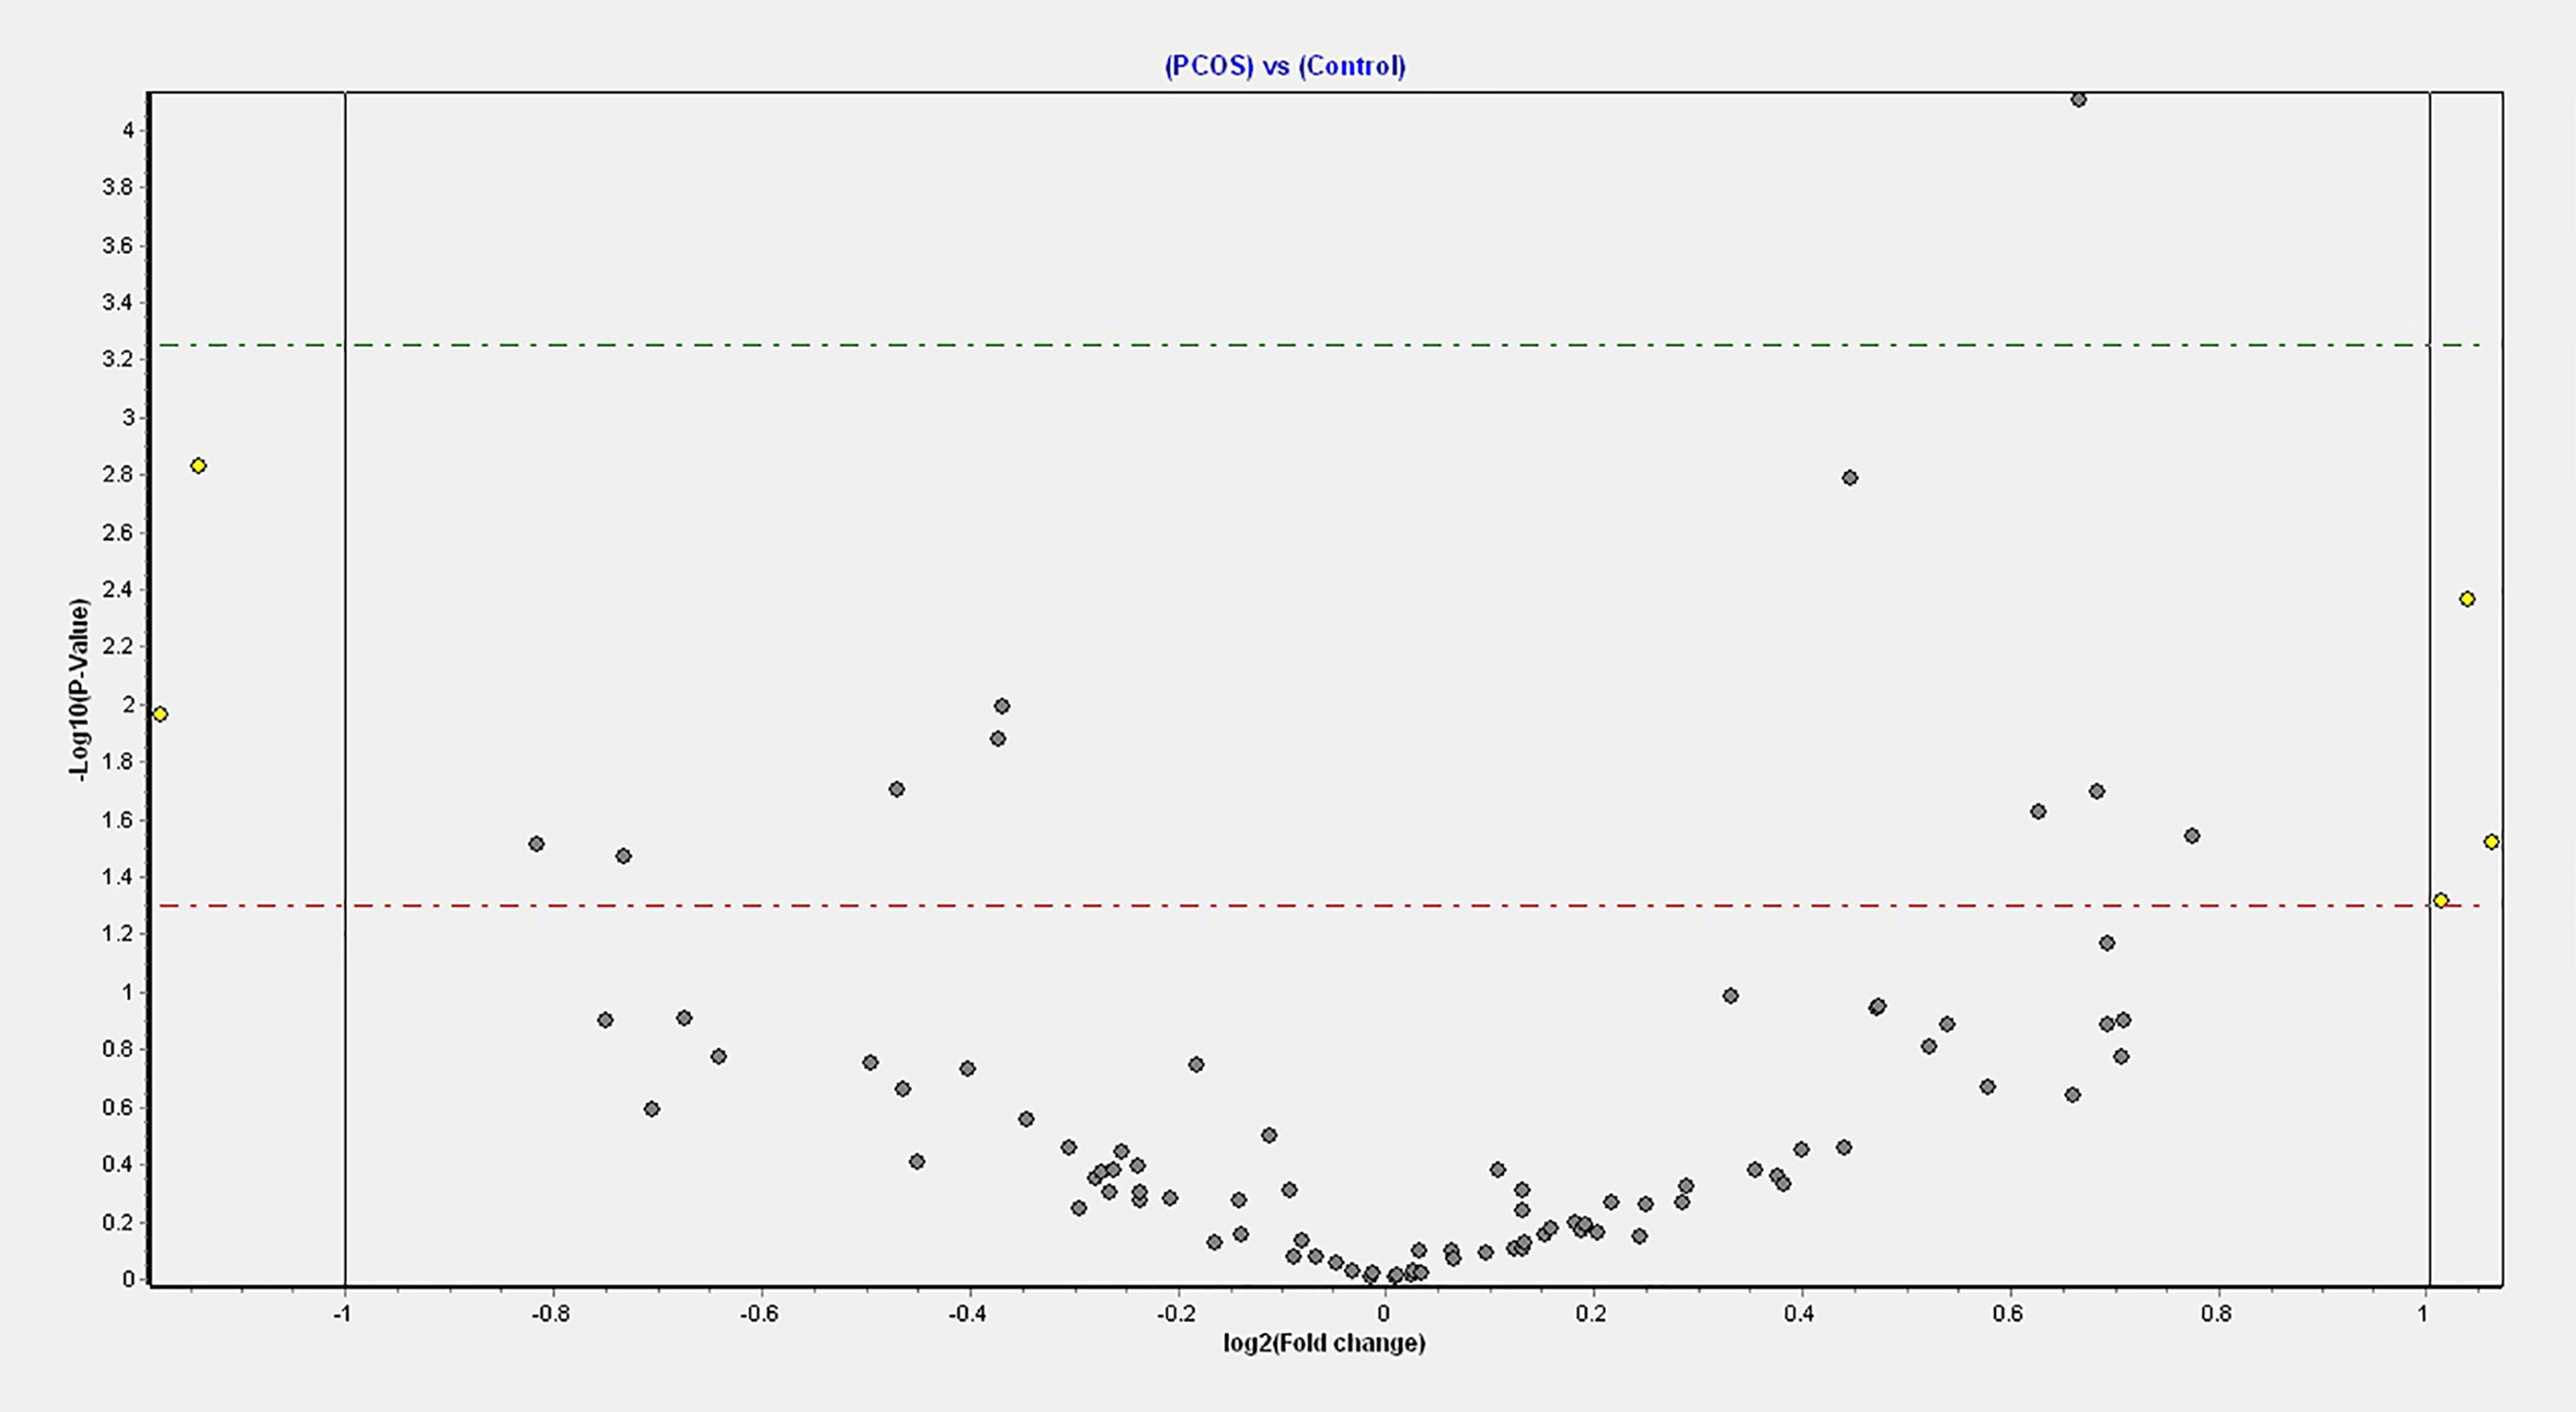
Figure 1 Volcano plot of fold changes in the key miRNAs that passed the FDR threshold and significance level.
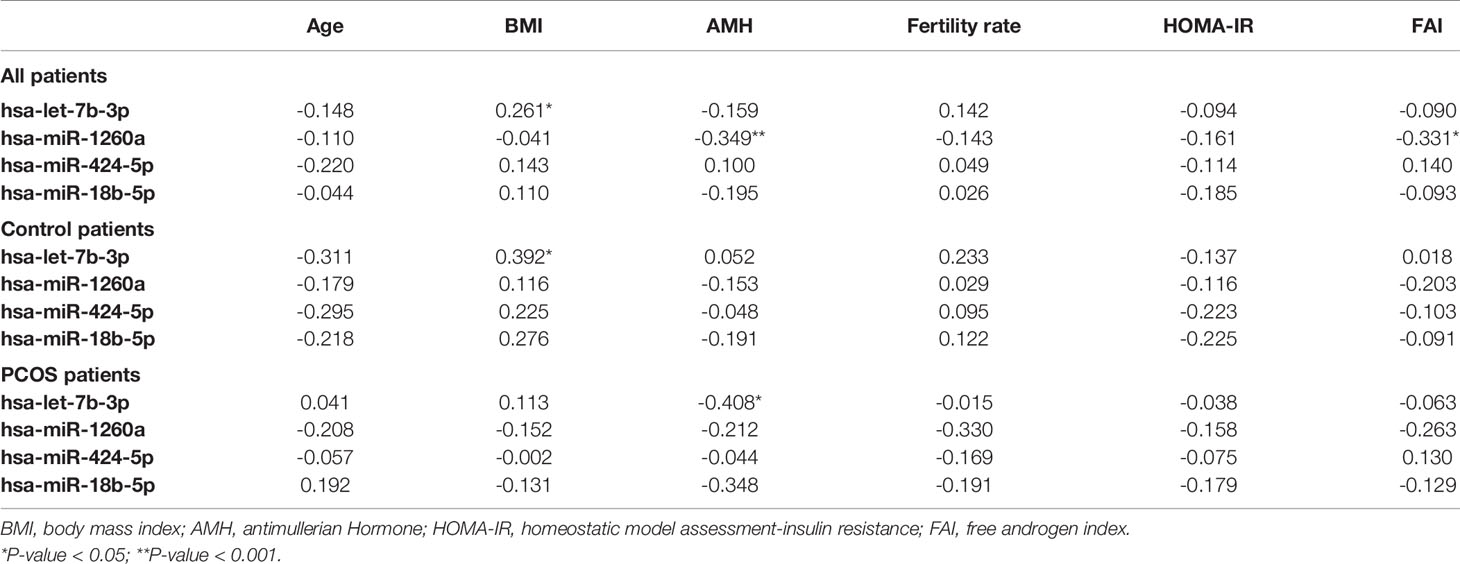
Table 3 Spearman correlations of demographics with top four significant miRNAs for both control and PCOS patients, control and PCOS patients alone.
It has been shown recently that differing noncoding RNA can act in a coordinated manner to form a regulatory noncoding RNA network interacting with other noncoding RNAs, such as microRNA and circularRNA that may then effect multiple downstream biological processes (30). Therefore, Ingenuity Pathway Analysis was undertaken for the top 10 miRNAs determined here. As shown in Figure 2, nine of the top 10 miRNAs showed functional connectivity as part of the regulatory network of genes involved in the pathway associated with inflammation and these included miR-1260a, miR-18b-5p, miR-424-5p, let-7b-3p, miR-2110, let-7c-5p, miR-130a-3p, miR-150-5p, and miR-133b; however, CRP as a marker of inflammation did not differ between groups (Table 1).
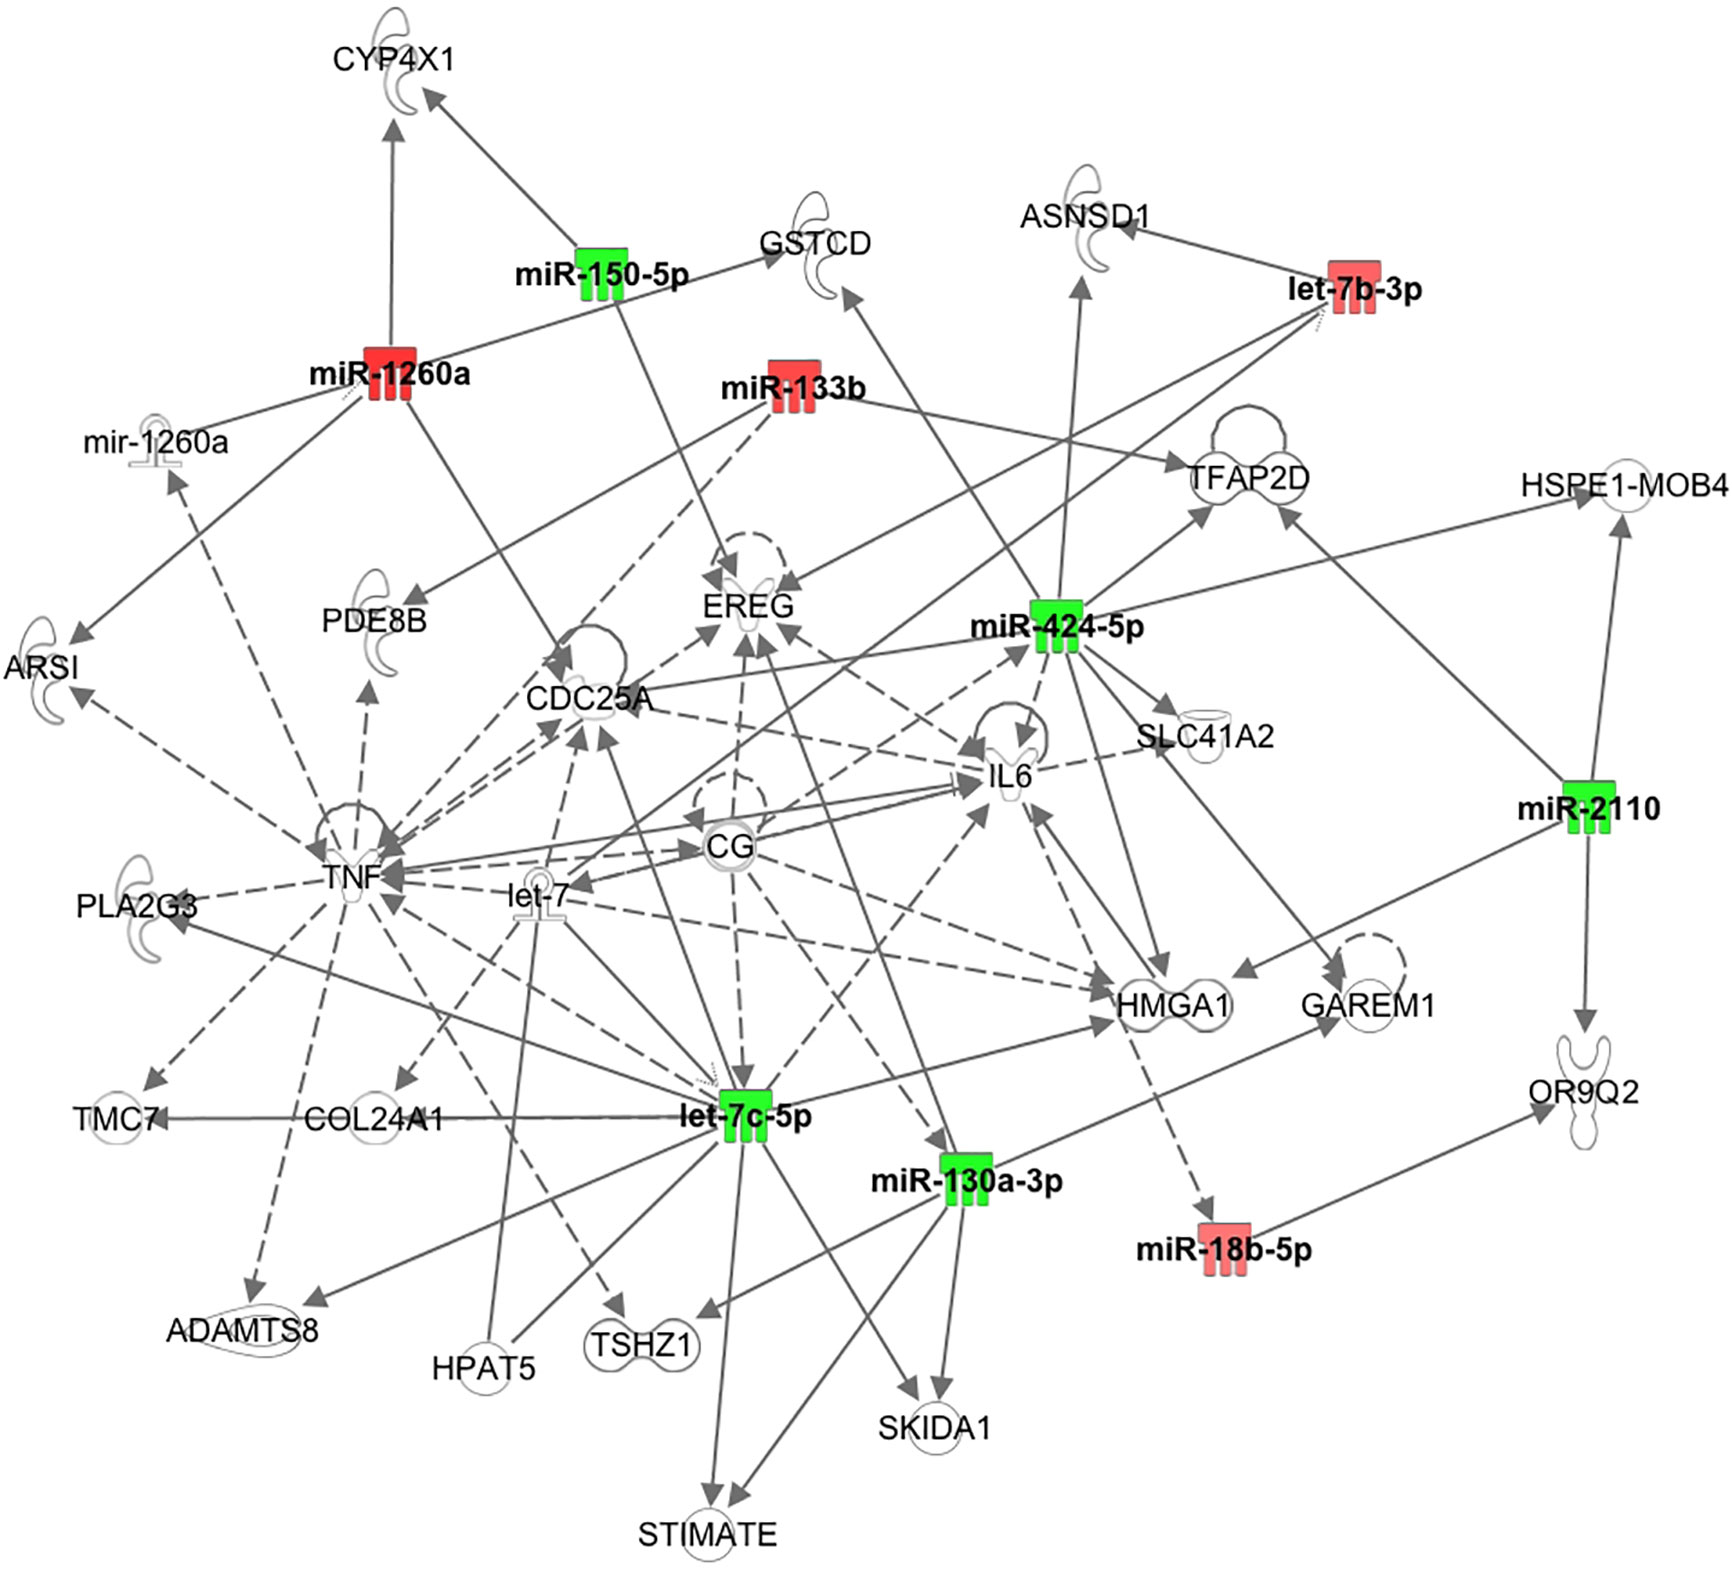
Figure 2 Pathway connections for the inflammatory pathways for the top 10 miRNAs showing nine were associated with the pathway relating to tumor necrosis factor and interleukin 6.
Discussion
In this non-obese, non-insulin resistant cohort of women with PCOS, four miRNAs showed significantly altered expression compared to the control women: miR-1260a, miR-18b-5p, miR-424-5p, and let-7b-3p. When obesity and insulin resistance are taken into account, it is likely that these four miRNA are specifically related to PCOS. Further, it is of interest that let-7b-3p correlated with AMH in PCOS women, as AMH has been suggested as a biomarker of PCOS though of low sensitivity (31, 32). When weight matched obese PCOS and control women are compared, the number of miRNA that differ between groups are much fewer than those previously reported in the literature (33), and none of the miRNA reported for that obese cohort differed in this study. As expected, several of the miRNA found in the obese study previously reported were associated with insulin resistance (34) whilst the four miRNA described here were not.
The strength of this study was the homogenous control and PCOS populations studied; however, this was a selected PCOS population that may not be generalizable. In addition, this pilot study was limited by having a small number of subjects, yet clearly showed that miRNAs do differ between PCOS and control women when age, BMI and insulin resistance are accounted for. However, functional studies are required to determine the role of each of the miRNA reported here.
In this study, analysis of the combined PCOS and control women revealed that miR-1260a correlated with FAI and AMH, but this correlation was not found in obesity with insulin resistance (33). It is reported that miR-1260a is associated with type 2 diabetes (35) as is miR-424 (36), whilst miR-let 7 has been associated with a reduction in insulin signaling (36). MiR-let-7b-3p correlated with BMI for these normal weight subjects, a correlation that appeared to be lost in obese subjects (33).
Recent evidence indicates that long-noncoding RNA, circular RNA and microRNA may act together as a functional regulatory network (30) and therefore the function of an individual miRNA may not be evident. In addition, with so few studies to date, individual microRNA may not obviously map its function to the disease process under study. This may be seen here for the miRNAs that differed between the women with and without PCOS: miR-1260a has been reported to be associated with prostate and lung cancer and aortic aneurysms (37–39); similarly, miR-18b-5p has been associated with oncogenic activity (40). MiR-424-5p may stimulate an immune effect through the mTOR pathway (41) and it has been shown that mTOR signaling was responsible for excessive follicle activation and growth in an animal model of PCOS (42). Let-7b-3p has been associated with several malignancies including melanoma, lung cancer and ovarian serous carcinoma (genecards.org).
The Ingenuity Pathway Analysis revealed that nine of the top 10 miRNA identified here showed functional connectivity as part of a regulatory network of genes predominantly associated with central regulators of inflammation through tumour necrosis factor (TNF) and interleukin 6 (IL6), though serum levels of both have been reported not to differ between PCOS and control women (43). Of note, CRP as a marker of inflammation did not differ between groups in this study. It has been suggested that chronic low grade inflammation may mediate the effect of sympathetic dysfunction on hyperandrogenism and insulin resistance (44).
Our findings are discrepant to others where serum miR-21 (45) and miR-6767-5p (46) are elevated, whilst miR-320 is lowered in PCOS (47); the likely explanation for this is that these miR are associated with an increased BMI (48). As noted above, miR-93 and miR-223 may play a role in insulin resistance (19) and did not differ in this study, likely because insulin resistance did not differ between the PCOS and control women.
This study indirectly supports the concept that PCOS women are characterized by different phenotypes: one hyperandrogenic (women included in this study) and the other hyperinsulinemic with insulin resistance (excluded in this study) (49). Therefore, the miRNA expression may significantly differ between these two phenotypes corroborating that the pathogenetic pathway could be different and therefore subjects may respond differently to treatment (50–52).
These results may be generalisable to a Caucasian population of non-insulin resistant women with PCOS, but clarification is needed to determine if there are ethnic differences as seen for other metabolic parameters (53).
In conclusion, only four of the 177 miRNAs expressed differed significantly in non- insulin resistant women with and without PCOS when age and BMI were matched. Let-7b-3p was related to AMH in PCOS, and to BMI as a group, whilst miR-1260a correlated with FAI. Nine of the 10 expressed miRNAs showed functional connectivity with the inflammatory pathway involving TNF and IL6.
Data Availability Statement
The data that support the findings of this study are available upon request from the corresponding author AB YWViOTEwMTFAZ21haWwuY29t.
Ethics Statement
The studies involving human participants were reviewed and approved by The Yorkshire and The Humber NRES ethical committee, UK. The patients/participants provided their written informed consent to participate in this study.
Author contributions
AB contributed to data analysis and wrote the manuscript. VR, MB, and SHN-S performed the miRNA measurements. VR, TC, RD, NG, and MB contributed to data analysis. TS contributed to study design and supervised sample collection. SD undertook the statistical analysis and SH performed the ingenuity pathway analysis. SA designed the studies, supervised the work, contributed to data analysis, and was involved in preparation of the manuscript. All authors contributed to the article and approved the submitted version.
Conflict of Interest
The authors declare that the research was conducted in the absence of any commercial or financial relationships that could be construed as a potential conflict of interest.
Acknowledgments
The authors declare that there is no conflict of interest that could be perceived as prejudicing the impartiality of the paper reported. SA is the guarantor of this work and, as such, had full access to all the data in the study and takes responsibility for the integrity of the data and the accuracy of the data analysis.
Supplementary Material
The Supplementary Material for this article can be found online at: https://www.frontiersin.org/articles/10.3389/fendo.2020.571357/full#supplementary-material
References
1. Azziz R, Woods KS, Reyna R, Key TJ, Knochenhauer ES, Yildiz BO. The prevalence and features of the polycystic ovary syndrome in an unselected population. J Clin Endocrinol Metab (2004) 89(6):2745–9. doi: 10.1210/jc.2003-032046
2. Franks S. Polycystic ovary syndrome. N Engl J Med (1995) 333(13):853–61. doi: 10.1056/NEJM199509283331307
3. Shi Y, Zhao H, Shi Y, Cao Y, Yang D, Li Z, et al. Genome-wide association study identifies eight new risk loci for polycystic ovary syndrome. Nat Genet (2012) 44(9):1020–5. doi: 10.1038/ng.2384
4. Wang XX, Wei JZ, Jiao J, Jiang SY, Yu DH, Li D. Genome-wide DNA methylation and gene expression patterns provide insight into polycystic ovary syndrome development. Oncotarget (2014) 5(16):6603–10. doi: 10.18632/oncotarget.2224
5. Sorensen AE, Wissing ML, Salö S, Englund ALM, Dalgaard LT. MicroRNAs Related to Polycystic Ovary Syndrome (PCOS). Genes (Basel) (2014) 5(3):684–708. doi: 10.3390/genes5030684
6. Nigi L, Grieco GE, Ventriglia G, Brusco N, Mancarella F, Formichi C, et al. MicroRNAs as Regulators of Insulin Signaling: Research Updates and Potential Therapeutic Perspectives in Type 2 Diabetes. Int J Mol Sci (2018) 19(12):3705–29. doi: 10.3390/ijms19123705
7. Lee Y, Kim M, Han J, Yeom K-H, Lee S, Baek SH, et al. MicroRNA genes are transcribed by RNA polymerase II. EMBO J (2004) 23(20):4051–60. doi: 10.1038/sj.emboj.7600385
8. Bartel DP. MicroRNAs: genomics, biogenesis, mechanism, and function. Cell (2004) 116(2):281–97. doi: 10.1016/S0092-8674(04)00045-5
9. Kim VN, Han J, Siomi MC. Biogenesis of small RNAs in animals. Nat Rev Mol Cell Biol (2009) 10(2):126–39. doi: 10.1038/nrm2632
10. Krol J, Loedige I, Filipowicz W. The widespread regulation of microRNA biogenesis, function and decay. Nat Rev Genet (2010) 11(9):597–610. doi: 10.1038/nrg2843
11. Ortega FJ, Mercader JM, Catalán V, Moreno-Navarrete JM, Pueyo N, Sabater M, et al. Targeting the circulating microRNA signature of obesity. Clin Chem (2013) 59(5):781–92. doi: 10.1373/clinchem.2012.195776
12. Karbiener M, Fischer C, Nowitsch S, Opriessnig P, Papak C, Ailhaud G, et al. microRNA miR-27b impairs human adipocyte differentiation and targets PPARgamma. Biochem Biophys Res Commun (2009) 390(2):247–51. doi: 10.1016/j.bbrc.2009.09.098
13. Plaisance V, Abderrahmani A, Perret-Menoud V, Jacquemin P, Lemaigre F, Regazzi R, et al. MicroRNA-9 controls the expression of Granuphilin/Slp4 and the secretory response of insulin-producing cells. J Biol Chem (2006) 281(37):26932–42. doi: 10.1074/jbc.M601225200
14. Lu H, Buchan RJ, Cook SA. MicroRNA-223 regulates Glut4 expression and cardiomyocyte glucose metabolism. Cardiovasc Res (2010) 86(3):410–20. doi: 10.1093/cvr/cvq010
15. Esau C, Davis S, Murray SF, Yu XX, Pandey SK, Pear M, et al. miR-122 regulation of lipid metabolism revealed by in vivo antisense targeting. Cell Metab (2006) 3(2):87–98. doi: 10.1016/j.cmet.2006.01.005
16. Salas-Huetos A, James ER, Aston KI, Jenkins TG, Carrell DT, Yeste M. The Expression of miRNAs in Human Ovaries, Oocytes, Extracellular Vesicles, and Early Embryos: A Systematic Review. Cells (2019) 8(12):1564–87. doi: 10.3390/cells8121564
17. Murri M, Insenser M, Fernández-Durán E, San-Millán JL, Escobar-Morreale HF. Effects of polycystic ovary syndrome (PCOS), sex hormones, and obesity on circulating miRNA-21, miRNA-27b, miRNA-103, and miRNA-155 expression. J Clin Endocrinol Metab (2013) 98(11):E1835–44. doi: 10.1210/jc.2013-2218
18. Chen YH, Heneidi S, Lee J-M, Layman LC, Stepp DW, Gamboa GM, et al. miRNA-93 inhibits GLUT4 and is overexpressed in adipose tissue of polycystic ovary syndrome patients and women with insulin resistance. Diabetes (2013) 62(7):2278–86. doi: 10.2337/db12-0963
19. Wu HL, Heneidi S, Chuang TY, Diamond MP, Layman LC, Azziz R, et al. The expression of the miR-25/93/106b family of micro-RNAs in the adipose tissue of women with Polycystic Ovary Syndrome. J Clin Endocrinol Metab (2014) 99:E2754–61. doi: 10.1210/jc.2013-4435
20. Nigro C, Mirra P, Prevenzano I, Leone A, Fiory F, Longo M, et al. miR-214-Dependent Increase of PHLPP2 Levels Mediates the Impairment of Insulin-Stimulated Akt Activation in Mouse Aortic Endothelial Cells Exposed to Methylglyoxal. Int J Mol Sci (2018) 19(2):522–37. doi: 10.3390/ijms19020522
21. Zhu H, Shyh-Chang N, Segrè AV, Shinoda G, Shah SP, Einhorn WS, et al. The Lin28/let-7 axis regulates glucose metabolism. Cell (2011) 147(1):81–94. doi: 10.1016/j.cell.2011.08.033
22. Rotterdam ESHRE/ASRM-Sponsored PCOS Consensus Workshop Group. Revised 2003 consensus on diagnostic criteria and long-term health risks related to polycystic ovary syndrome (PCOS). Hum Reprod (2004) 19(1):41–7. doi: 10.1093/humrep/deh098
23. Sathyapalan T, Al-Qaissi A, Kilpatrick ES, Dargham SR, Atkin SL. Anti-Mullerian hormone measurement for the diagnosis of polycystic ovary syndrome. Clin Endocrinol (Oxf) (2018) 88(2):258–62. doi: 10.1111/cen.13517
24. miRCURY LNA miRNA PCR – Exosomes, Serum/Plasma and Other Biofluid Samples Handbook. Redwood City, CA, USA: Qiagen (2019) p. 15–6.
25. Mitchell PS, Parkin RK, Kroh EM, Fritz BR, Wyman SK, Pogosova-Agadjanyan EL, et al. Circulating microRNAs as stable blood-based markers for cancer detection. Proc Natl Acad Sci (2008) 105(30):10513–8. doi: 10.1073/pnas.0804549105
26. Blondal T, Nielsen SJ, Baker A, Andreasen D, Mouritzen P, Teilum MW, et al. Assessing sample and miRNA profile quality in serum and plasma or other biofluids. Methods (2013) 59(1):S1–6. doi: 10.1016/j.ymeth.2012.09.015
27. Shah JS, Soon PS, Marsh DJ. Comparison of Methodologies to Detect Low Levels of Hemolysis in Serum for Accurate Assessment of Serum microRNAs. PLoS One (2016) 11(4):e0153200. doi: 10.1371/journal.pone.0153200
28. Benjamini Y, Hochberg Y. Controlling the false discovery rate: a practical and powerful approach to multiple testing. J R Stat Soc Ser B (1995) 57(1):289–300. doi: 10.1111/j.2517-6161.1995.tb02031.x
29. Birkett MA, Day SJ. Internal pilot studies for estimating sample size. Stat Med (1994) 13(23-24):2455–63. doi: 10.1002/sim.4780132309
30. Kleaveland B, Shi CY, Stefano J, Bartel DP. A Network of Noncoding Regulatory RNAs Acts in the Mammalian Brain. Cell (2018) 174(2):350–362.e17. doi: 10.1016/j.cell.2018.05.022
31. Iliodromiti S, Kelsey TW, Anderson RA, Nelson SM. Can anti-Mullerian hormone predict the diagnosis of polycystic ovary syndrome? A systematic review and meta-analysis of extracted data. J Clin Endocrinol Metab (2013) 98(8):3332–40. doi: 10.1210/jc.2013-1393
32. Quinn MM, Kao C-N, Ahmad AK, Haisenleder DJ, Santoro N, Eisenberg E, et al. Age-stratified thresholds of anti-Mullerian hormone improve prediction of polycystic ovary syndrome over a population-based threshold. Clin Endocrinol (Oxf) (2017) 6:733–40. doi: 10.1111/cen.13415
33. Butler AE, Ramachandran V, Hayat S, Dargham SR, Cunningham TK, Benurwar M, et al. Expression of microRNA in follicular fluid in women with and without PCOS. Sci Rep (2019) 9(1):16306. doi: 10.1038/s41598-019-52856-5
34. Choi H, Koh HWL, Zhou L, Cheng H, Loh TP, Rizi EP, et al. Plasma Protein and MicroRNA Biomarkers of Insulin Resistance: A Network-Based Integrative -Omics Analysis. Front Physiol (2019) 10:379. doi: 10.3389/fphys.2019.00379
35. Krauskopf J, de Kok TM, Schomaker SJ, Gosink M, Burt DA, Chandler P, et al. Serum microRNA signatures as “liquid biopsies” for interrogating hepatotoxic mechanisms and liver pathogenesis in human. PLoS One (2017) 12(5):e0177928. doi: 10.1371/journal.pone.0177928
36. Deng J, Guo F. MicroRNAs and type 2 diabetes. ExRNA (2019) 1(1):36. doi: 10.1186/s41544-019-0038-5
37. Said R, Garcia-Mayea Y, Trabelsi N, Setti Boubaker N, Mir C, Blel A, et al. Expression patterns and bioinformatic analysis of miR-1260a and miR-1274a in Prostate Cancer Tunisian patients. Mol Biol Rep (2018) 45(6):2345–58. doi: 10.1007/s11033-018-4399-x
38. Xu L, Xu X, Huang H, Ma Z, Zhang S, Niu P, et al. MiR-1260b promotes the migration and invasion in non-small cell lung cancer via targeting PTPRK. Pathol Res Pract (2018) 214(5):776–83. doi: 10.1016/j.prp.2018.02.002
39. Cheuk BL, Cheng SW. Identification and characterization of microRNAs in vascular smooth muscle cells from patients with abdominal aortic aneurysms. J Vasc Surg (2014) 59(1):202–9. doi: 10.1016/j.jvs.2013.02.244
40. Xue F, Xu YH, Shen CC, Qin ZL, Zhou HB, et al. Non-coding RNA LOXL1-AS1 exhibits oncogenic activity in ovarian cancer via regulation of miR-18b-5p/VMA21 axis. BioMed Pharmacother (2020) 125:109568. doi: 10.1016/j.biopha.2019.109568
41. Wang G, Yan Y, Xu N, Hui Y, Yin D. Upregulation of microRNA-424 relieved diabetic nephropathy by targeting Rictor through mTOR Complex2/Protein Kinase B signaling. J Cell Physiol (2019) 234(7):11646–53. doi: 10.1002/jcp.27822
42. Jiang ZZ, Hu M-W, Ma X-X, Schatten H, Fan H-Y, Wang Z-B, et al. LKB1 acts as a critical gatekeeper of ovarian primordial follicle pool. Oncotarget (2016) 7(5):5738–53. doi: 10.18632/oncotarget.6792
43. Sathyapalan T, Javed Z, Kilpatrick ES, Coady A-M, Atkin SL. Endocannabinoid receptor blockade increases vascular endothelial growth factor and inflammatory markers in obese women with polycystic ovary syndrome. Clin Endocrinol (Oxf) (2017) 86(3):384–7. doi: 10.1111/cen.13239
44. Shorakae S, Ranasinha S, Abell S, Lambert G, Lambert E, de Courten B. Inter-related effects of insulin resistance, hyperandrogenism, sympathetic dysfunction and chronic inflammation in PCOS. Clin Endocrinol (Oxf) (2018) 89(5):628–33. doi: 10.1111/cen.13808
45. Jiang L, Li W, Wu M, Cao S. Ciculating miRNA-21 as a Biomarker Predicts Polycystic Ovary Syndrome (PCOS) in Patients. Clin Lab (2015) 61(8):1009–15. doi: 10.7754/Clin.Lab.2015.150122
46. Song DK, Sung YA, Lee H. The Role of Serum MicroRNA-6767-5p as a Biomarker for the Diagnosis of Polycystic Ovary Syndrome. PLoS One (2016) 11(9):e0163756. doi: 10.1371/journal.pone.0163756
47. Rashad NM, Ateya MA-M, Saraya YS, Elnagar WM, Helal KF, Lashin ME-B. Association of miRNA - 320 expression level and its target gene endothelin-1 with the susceptibility and clinical features of polycystic ovary syndrome. J Ovarian Res (2019) 12(1):39. doi: 10.1186/s13048-019-0513-5
48. Ji C, Guo X. The clinical potential of circulating microRNAs in obesity. Nat Rev Endocrinol (2019) 15(12):731–43. doi: 10.1038/s41574-019-0260-0
49. Sathyapalan T, Al-Qaissi A, Kilpatrick ES, Dargham SR, Keevil B, Atkin SL. Salivary and serum androgens with anti-Mullerian hormone measurement for the diagnosis of polycystic ovary syndrome. Sci Rep (2018) 8(1):3795. doi: 10.1038/s41598-018-22176-1
50. Chae SJ, Kim JJ, Choi YM, Hwang KR, Jee BC, Ku SY, et al. Clinical and biochemical characteristics of polycystic ovary syndrome in Korean women. Hum Reprod (2008) 23(8):1924–31. doi: 10.1093/humrep/den239
51. Pehlivanov B, Orbetzova M. Characteristics of different phenotypes of polycystic ovary syndrome in a Bulgarian population. Gynecol Endocrinol (2007) 23(10):604–9. doi: 10.1080/09513590701536246
52. Alviggi C, Conforti A, De Rosa P, Strina I, Palomba S, Vallone R, et al. The Distribution of Stroma and Antral Follicles Differs between Insulin-Resistance and Hyperandrogenism-Related Polycystic Ovarian Syndrome. Front Endocrinol (Lausanne) (2017) 8:117. doi: 10.3389/fendo.2017.00117
Keywords: microRNA, polycystic ovary syndrome, non-obese, insulin sensitivity, anti-Mullerian hormone, female
Citation: Butler AE, Ramachandran V, Cunningham TK, David R, Gooderham NJ, Benurwar M, Dargham SR, Hayat S, Sathyapalan T, Najafi-Shoushtari SH and Atkin SL (2020) Increased MicroRNA Levels in Women With Polycystic Ovarian Syndrome but Without Insulin Resistance: A Pilot Prospective Study. Front. Endocrinol. 11:571357. doi: 10.3389/fendo.2020.571357
Received: 10 June 2020; Accepted: 08 September 2020;
Published: 30 September 2020.
Edited by:
Marc Yeste, University of Girona, SpainReviewed by:
Albert Salas-Huetos, Harvard University, United StatesAlessandro Conforti, University of Naples Federico II, Italy
Copyright © 2020 Butler, Ramachandran, Cunningham, David, Gooderham, Benurwar, Dargham, Hayat, Sathyapalan, Najafi-Shoushtari and Atkin. This is an open-access article distributed under the terms of the Creative Commons Attribution License (CC BY). The use, distribution or reproduction in other forums is permitted, provided the original author(s) and the copyright owner(s) are credited and that the original publication in this journal is cited, in accordance with accepted academic practice. No use, distribution or reproduction is permitted which does not comply with these terms.
*Correspondence: Alexandra E. Butler, YWViOTEwMTFAZ21haWwuY29t; YWJ1dGxlckBoYmt1LmVkdS5xYQ==