 Yingying Wang1,2
 Xiaolian Dong3Chaowei Fu1,2Meifang Su4Feng Jiang1,2
 Dongli Xu5Rui Li1,2Peixin Huang6
 Na Wang1,2*Yue Chen7Qingwu Jiang1,2
- 1Department of Epidemiology, School of Public Health, Fudan University, Shanghai, China
- 2Key Laboratory of Public Health Safety of Ministry of Education, School of Public Health, Fudan University, Shanghai, China
- 3Department of Chronic Disease Control and Prevention, Deqing County Center for Disease Control and Prevention, Huzhou, China
- 4Department of Chronic Disease Control and Prevention, Yuhuan City Center for Disease Control and Prevention, Taizhou, China
- 5Department of Chronic Disease Control and Prevention, Minhang District Center for Disease Control and Prevention, Shanghai, China
- 6Department of Chronic Disease Control and Prevention, Haimen City Center for Disease Control and Prevention, Nantong, China
- 7School of Epidemiology and Public Health, Faculty of Medicine, University of Ottawa, Ottawa, ON, Canada
Background: Thyroid volume (Tvol) is associated with many factors, but the current reference values for Tvol in children with sufficient iodine intake are inappropriate and need to be updated. Moderate changes in thyroid morphology and accentuated increases in body fat percentage occur during puberty as an adaption of the body and sexual development occurs. This study aimed to evaluate the influences of physical growth on Tvol and propose an easily applicable method for conducting Tvol assessments in pubertal girls with sufficient iodine intake.
Methods
A cohort study was conducted on 481 pubertal girls in East China from 2017 to 2019. B-ultrasound was used to assess Tvol. Multiple linear regression models were used to estimate the associations of Tvol enlargement (dTvol) with changes in height (dH), weight (dW), waist circumference (dW), body mass index (dBMI), and body surface area (dBSA). Thyroid volume indexes (TVIs), including height thyroid volume index (HVI), weight and height thyroid volume index (WHVI), body mass index thyroid index (BMIV), and body surface area thyroid index (BSAV), were calculated to explore an appropriate method for Tvol assessments by Spearman correlation analyses.
Results: Tvol, height, weight, BMI, and BSA increased significantly from baseline to follow-up (P<0.001). The associations between dTvol and physical growth were only observed in the 13 to 14-year-old group. dH, dW,dBMI, and dBSA were positively related to dTvol, with the maximum β of 5.74 (95%CI: 2.54 to 8.94) on dBSA, while dWC was negatively related to dTvol (β= -0.05, 95%CI: -0.08 to -0.03). Both dHVI and dBSAV were not associated with dH, dW, dBMI, or dBSA in both age groups (P>0.05).
Conclusions: Thyroid volume was associated with physical growth in pubertal girls in East China, both age and anthropometric measurements must be comprehensively considered to establish the reference values for Tvol. HVI, and BSAV may be better indicators for Tvol assessments in pubertal girls.
Introduction
Goiter is considered one of the most common thyroid disorders in children and adolescents (1). Childhood goiter is linked to increased risks for thyroid cancer in adulthood (2), and the association may be more pronounced in female patients, due to the critical role of estrogen in thyroid tissues (3). Estrogen increases many-fold across pubertal development and stimulates thyroid cell proliferation and growth by binding to estrogen receptor (ER) (4). Puberty is initiated in late childhood through a cascade of neuroendocrine changes, resulting in extensive physical growth, sexual maturation, and surged estrogen levels in girls (5). Generally, moderate changes in thyroid morphology and accentuated increases in body fat percentage occur during puberty as an adaption to the body and sexual development (6).
Thyroid volume (Tvol) determined by B-ultrasound is strongly related to age, gender, puberty, body mass index (BMI), body surface index (BSA), and iodine nutrition status (7–9). Tvol also tends to increase with age in childhood (10). However, there exist many controversial issues in defining the reference values for Tvol in children, several studies have reported that the goiter rates were widely divergent when assessed both by using the regional reference values and the World Health Organization (WHO) reference values (11, 12), which were established in 2004 based on 3529 children living in areas with long-standing iodine sufficiency after adjustment for age and BSA (13). In addition, young people experience an accelerating secular trend for physical growth over two decades, and the pattern of physical growth is different between boys and girls (14). In addition, the current Chinese official reference values for Tvol in children are inappropriate. They were updated in 2007 but only considered age, ignoring physical growth factors (15) Therefore, more reasonable reference values for Tvol in children are warranted.
Previous studies have reported effective applications for assessing four types of thyroid volume index, including height volume index (HVI), weight-and-height volume index (WHVI), body mass volume index (BMIV), and body surface area volume index (BSAV) (16, 17). Based on a cohort in East China, this study aimed to estimate the correlations between Tvol and physical growth in pubertal girls with sufficient iodine intake, and propose an effective method for applying Tvol assessments in childhood for future study.
Materials and Methods
Study Design and Subjects
Four regions in East China (Minhang District in Shanghai City, Haimen City in Jiangsu Province, and Yuhuan City and Deqing County both in Zhejiang Province) were selected by a purposive sampling method. These four regions have different family iodized-salt consumption proportions (ISCP, 85%-90% for Minhang and Yuhuan, >90% for Haimen and Deqing). A detailed description of the study design and sampling method has been reported previously (18). A total of 481 girls in Grade 7 from a junior middle school from each site, who were mainly local residents, were selected in the cohort after excluding those with any previous history of iodine supplement consumption, thyroid disorders, or pituitary abnormalities. The baseline and follow-up investigation were conducted between October and November in 2017 and 2019, respectively, with the consistent investigation content. Ultimately, 435 girls had completed information on thyroid B-ultrasound and physical examinations. The response rate was 91.27%. A flow chart is presented in Figure 1.
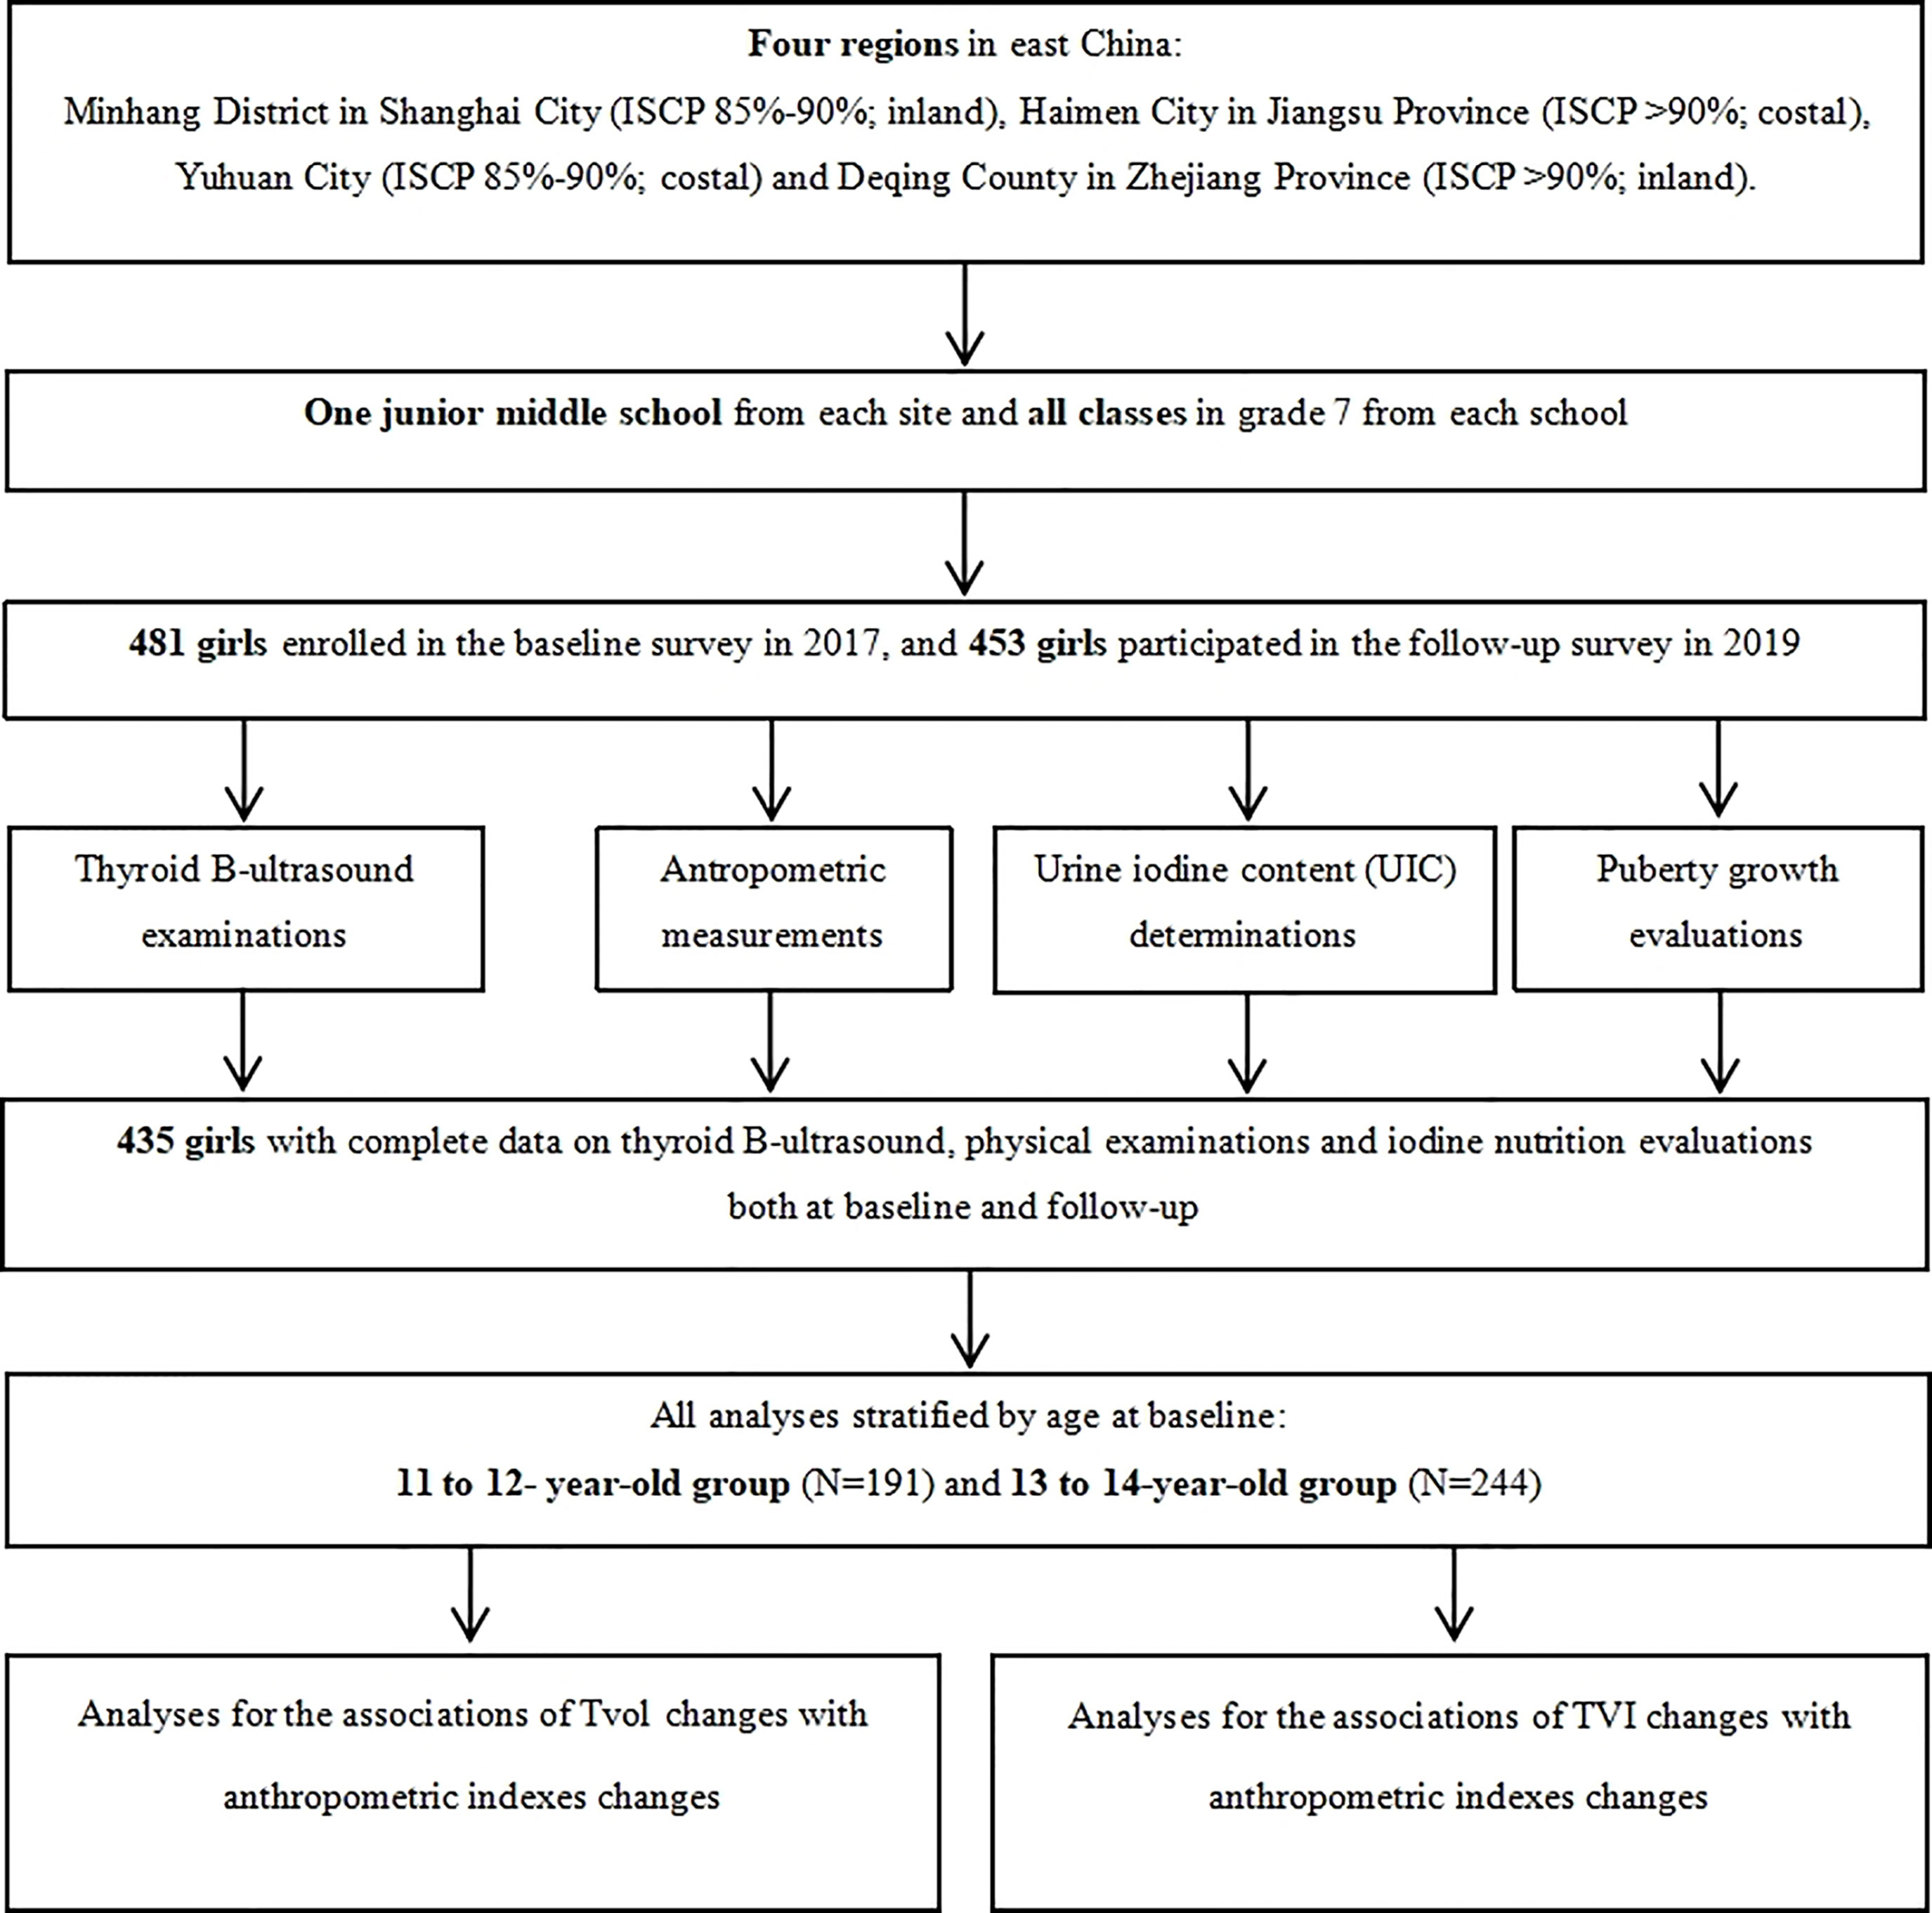
Figure 1 A flow chart for the study.
Thyroid B-Ultrasound Examinations
B-ultrasound has been an established tool for Tvol assessments (19). All participants, sitting upright with the neck completely extended, were received thyroid B-ultrasound examinations using a real-time sector scanner with a 7.5 MHz/40mm probe linear transducer and a standard technique (20). For each thyroid lobe, the maximal width (w, mm) was determined in the transverse section, and the maximal length (l, mm) and depth (d, mm) were measured in the longitudinal section, recorded to the nearest 0.01mm. Tvol was the sum of the volume of two lobes and calculated according to the function: VL/R(ml)= 0.479×l×w×t÷1000, V(ml)= VL+VR (21).
Anthropometric Measurements
Measurements for standing height (H, cm), weight (W, kg), and waist circumferences (WC, cm) were performed by trained health professionals using uniform anthropometric instruments. Height and WC were recorded to the nearest 0.1 cm, as well as weight was recorded to the nearest 0.1 kg. Body mass index (BMI) was calculated as weight in kilograms divided by the square of height in meters: BMI [kg/m (2)] =W÷(H÷100) (2); Body surface area (BSA) was calculated by the following formula: BSA (m2) =0.0061×H+0.0128×W-0.1529 (H: height, cm; W: weight, cm).
Thyroid Volume Index Calculations
Four thyroid volume indexes, including height volume index (HVI), weight and height volume index (WHVI), BMI volume index (BMIV) and BSA volume index (BSAV) were calculated as follows: (1) HVI = V÷H×100; (2) WHVI = V÷ (W×H)×1000; (3) BMIV = V÷BMI×10; (4) BSAV = V÷BSA, V: thyroid volume, ml; H: height, cm; W: weight, kg; BMI: body mass index. kg/m2; BSA: body surface area, m2 (17).
Urine Iodine Content (UIC) Determinations
Casual morning urine samples on a Monday and a Thursday (as the representatives for home diets and school canteen diets, respectively), approximately 10 to 12 ml, were obtained from all participants at each survey and then kept frozen at -80°C. The collected samples were determined for urine iodine content (UIC) by the method of inductively coupled plasma mass spectrometry (ICP-MS), and urine creatinine concentrations (UCr) by colorimetric enzymatic assay. Daily urine iodine output (DUIO) and weighted daily urine iodine output (WDUIO) were calculated to evaluate iodine nutrition: (1) daily urine iodine output: DUIO (μg) = MCr×1000×UIC÷UCr (18), MCr: daily urine creatinine output, mmol/day, MCr = EXP(0.0102×H-0.6854) (22); H: height, cm; UIC: urine iodine concentration, µg/L; UCr: urine creatinine content, µmol/L); (2) weighted daily urine iodine output: WDUIO (μg) =2/7× DUIO on Monday + 5/7× DUIO on Thursday (18).
Puberty Growth Evaluations
The Puberty development scale (PDS) was used to evaluate the puberty development at each investigation. Puberty category scores (PCS) were calculated according to the total scores of three items including menarche (score 0 or 1, namely “without or with”), breast development (score 1 to 5), and body hair growth (score 1 to 4) (23).
Statistical Analysis
Data on 435 girls with completed information of thyroid B-ultrasound and physical examinations were used for statistical analyses. Participants in our study were divided into two groups according to baseline age: Group 1, 11 to 12-year-old, and Group 2, 13 to 14-year-old.
Changes in each indicator were calculated using the following formula: dX = XFollow-up - XBaseline, X refers to Tvol, H, W, WC, BMI, BSA, HVI, WHVI, BMIV, BSAV, PCS, or WDUIO, respectively. Wilcoxon matched-pairs signed-ranks test and paired t-test were used to compare Tvol, urine iodine output, and anthropometric indexes, respectively, between baseline and follow-up.
Multiple linear regression analyses were used to estimate the associations between Tvol changes (dTvol) and changes in the anthropometric indexes (dH, dW, dWC, dBMI, and dBSA) after adjustment for puberty development and urine iodine levels.
Spearman correlation analyses were used to evaluate the associations between changes in the thyroid volume indexes (dHVI, dWHVI, dBMIV, and dBSAV) and changes in the anthropometric indexes (dH, dW, dWC, dBMI, and dBSA).
The level of statistical significance was defined as α = 0.05 of two-side probability. All analyses were performed using R program (version 4.0.4, R Foundation for Statistical Computing, Vienna, Austria), and all figures were performed by using GraphPad Prism software (version 7, GraphPad Prism, California, USA).
Results
Distributions of Tvol and Anthropometric Indexes
Of 435 girls, Tvol, height, weight, BMI, BSA, and PCS increased significantly from baseline to follow-up in both age groups (P<0.001). The 13 to 14-year-old group had a slightly higher dTvol, but it was not significant (P>0.05), compared to the 11 to 12-year-old group. Changes in anthropometric indexes except BMI were higher in the 11 to 12-year-old group than that in the 13 to 14-year-old group (P<0.001) (Table 1). The associations between Tvol and anthropometric indexes for the two investigations are shown in Figure 2.
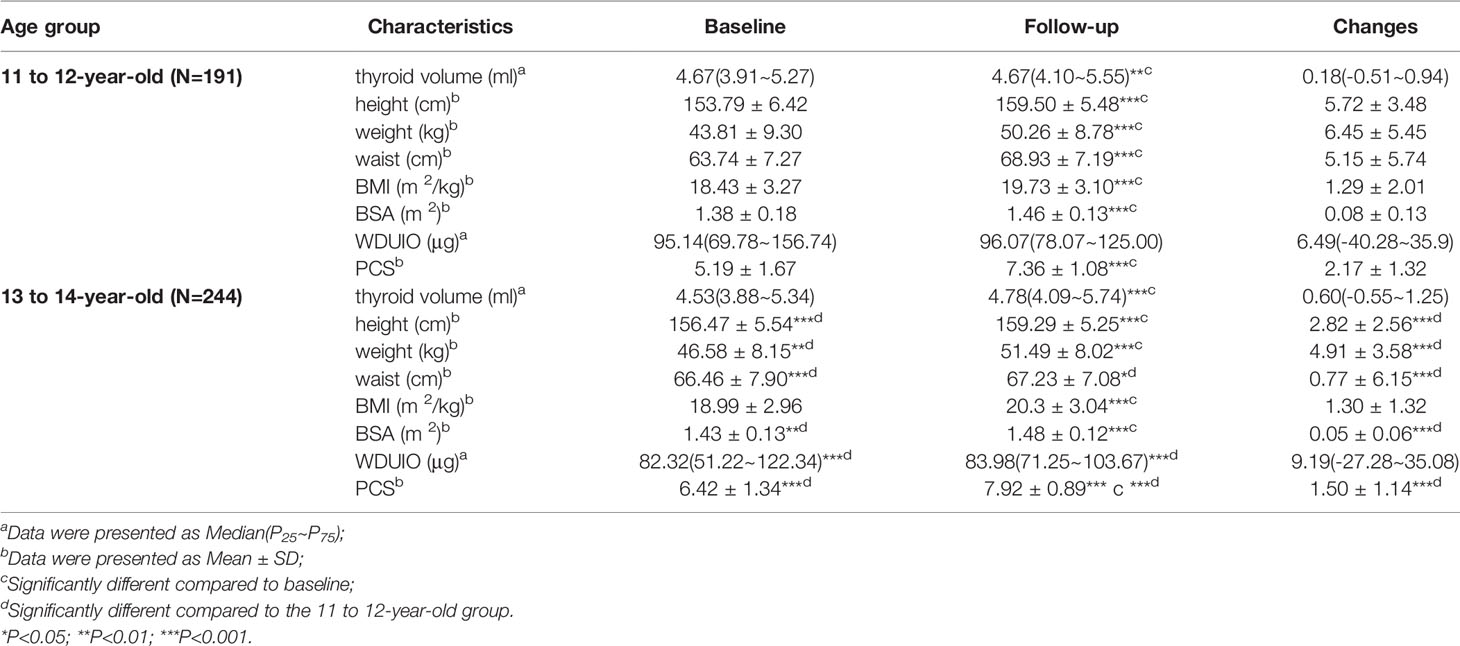
Table 1 Distributions of Tvol, anthropometric indexes and other relative variables among 435 girls.
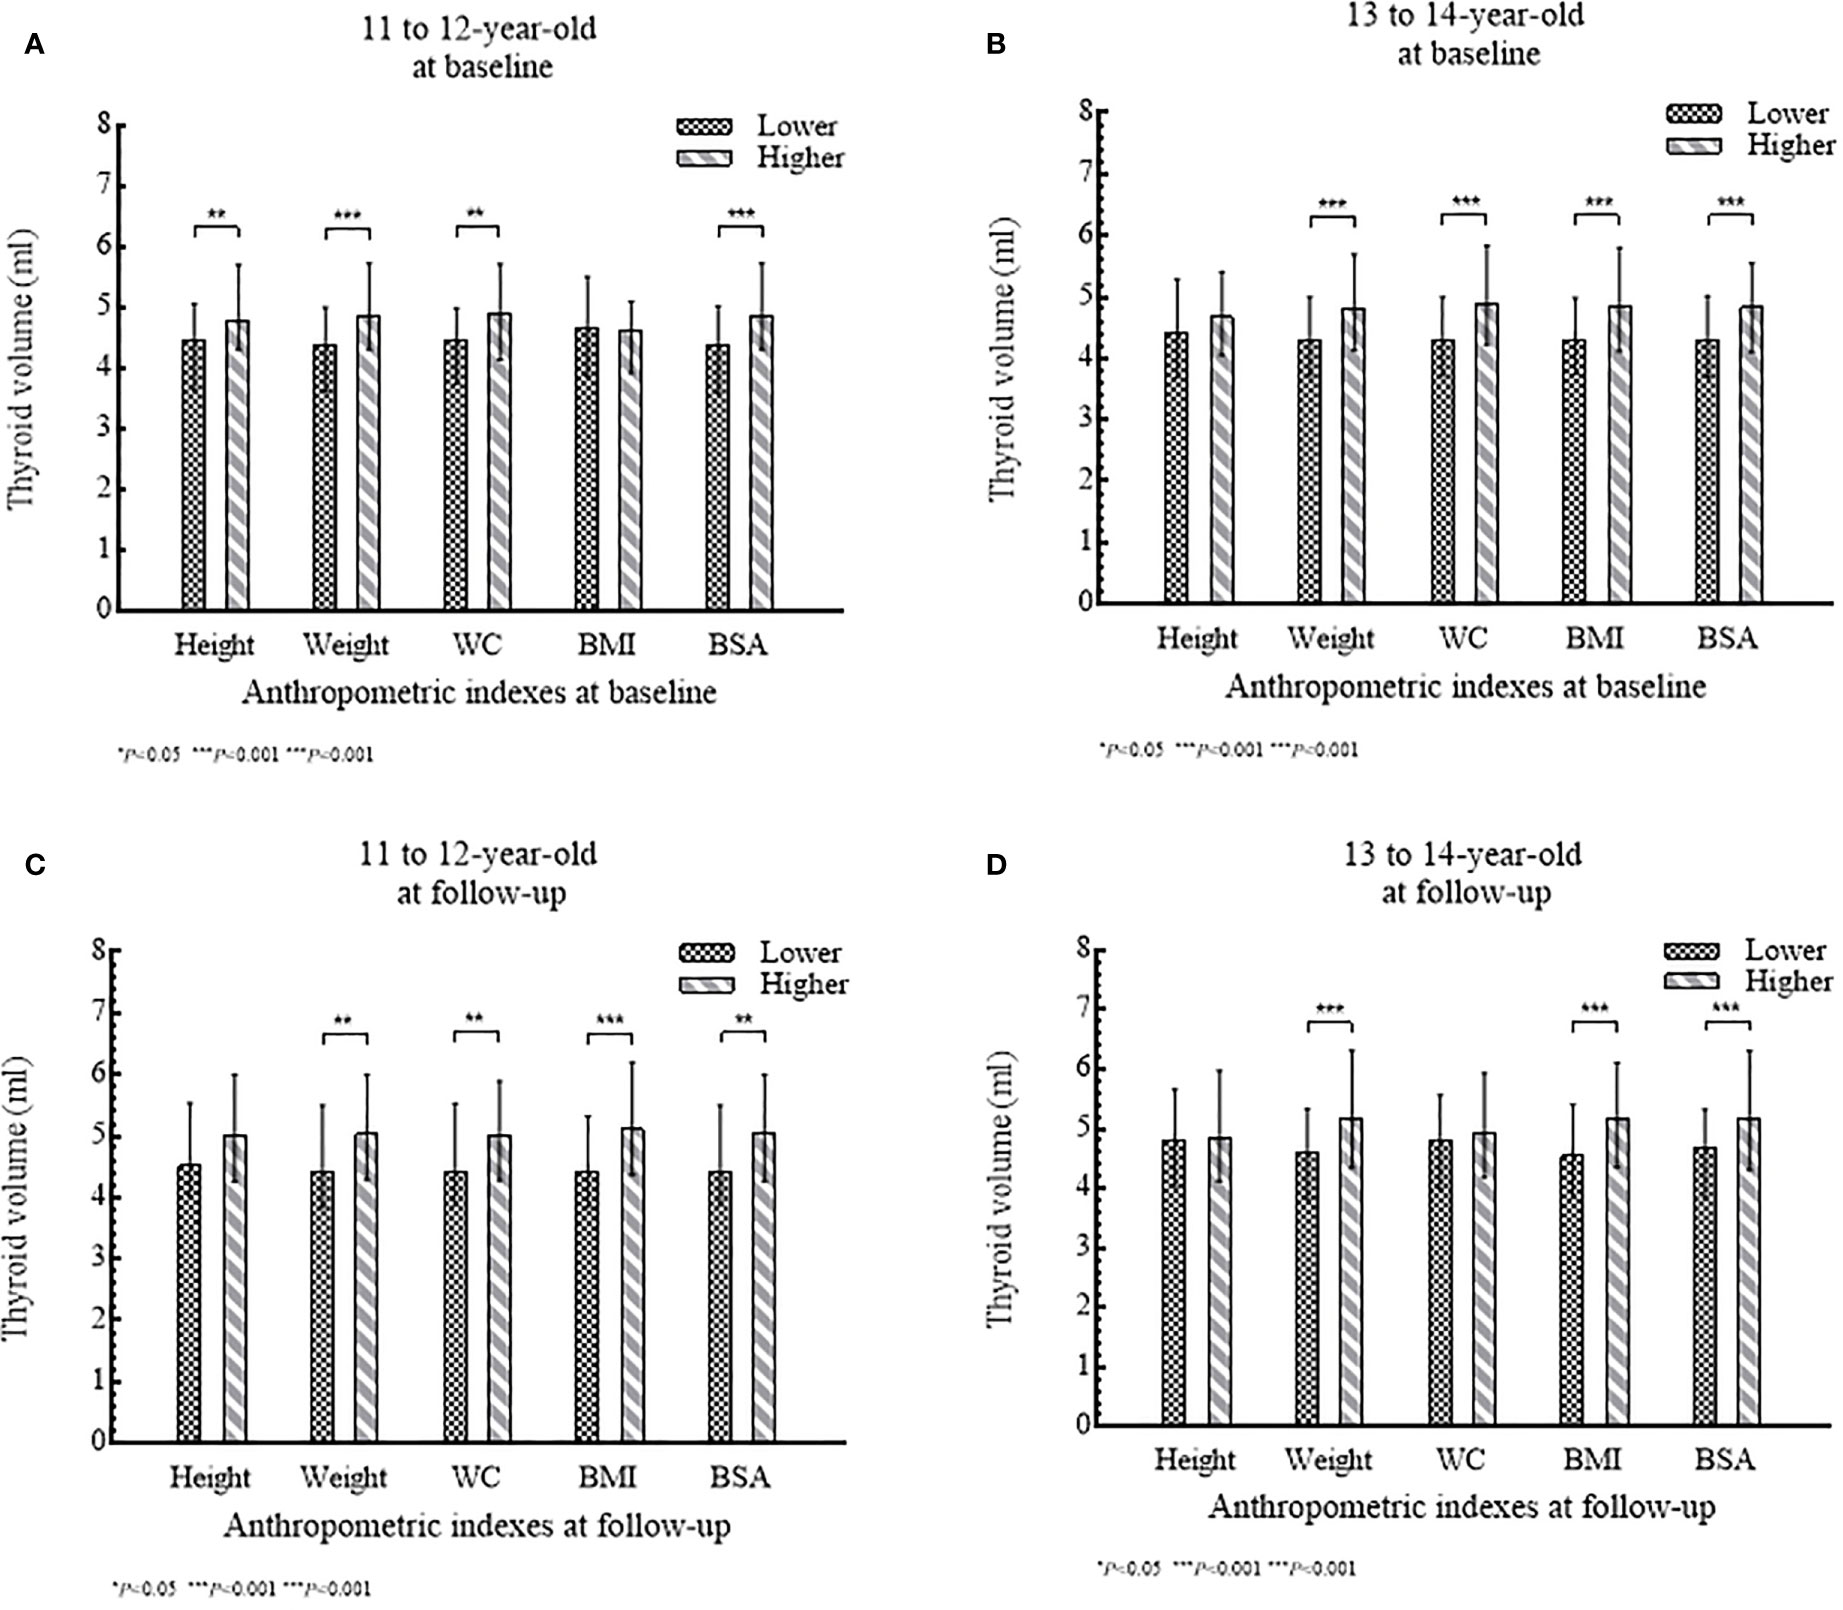
Figure 2 (A–D) Tvol according to anthropometric index (lower level or higher level) stratified by age group: (A) and (B) at baseline; (C) and (D) at follow-up.
Associations of Tvol Changes (dTvol) With Anthropometric Indexes Changes (dH, dW, dWC, dBMI, and dBSA)
After being adjusted for age, changes in puberty development, and urine iodine levels, the results of multiple linear regression analyses suggested that the influence of anthropometric indexes changes (dH, dW, dWC, dBMI, and dBSA) on dTvol were observed in girls in the 13 to 14-year-old group. Increased height, weight, BMI, and BSA may stimulate Tvol enlargement, with the maximum β of 5.74 (95%CI:2.54 to 8.94) on dBSA in Model 2. However, dWC was negatively associated with dTvol (β= -0.05, 95%CI: -0.08 to -0.03).
Further stratified analyses were conducted in girls with menarche or not at baseline, as well as those from area with different proportions of iodized-salt consumption. The positive associations between dTvol and dH or dBSA were found in the 11 to 12-year-old group from Haimen or Deqing (Table 2). Among the 13 to 14-year-old group, compared with girls who experienced menarche at baseline, dTvol in girls without menarche were more likely to be affected by changes in anthropometric indexes, with the maximum β of 9.78 (95%CI: 4.41 to 15.14) on dBSA in Model 2 (Table 3).
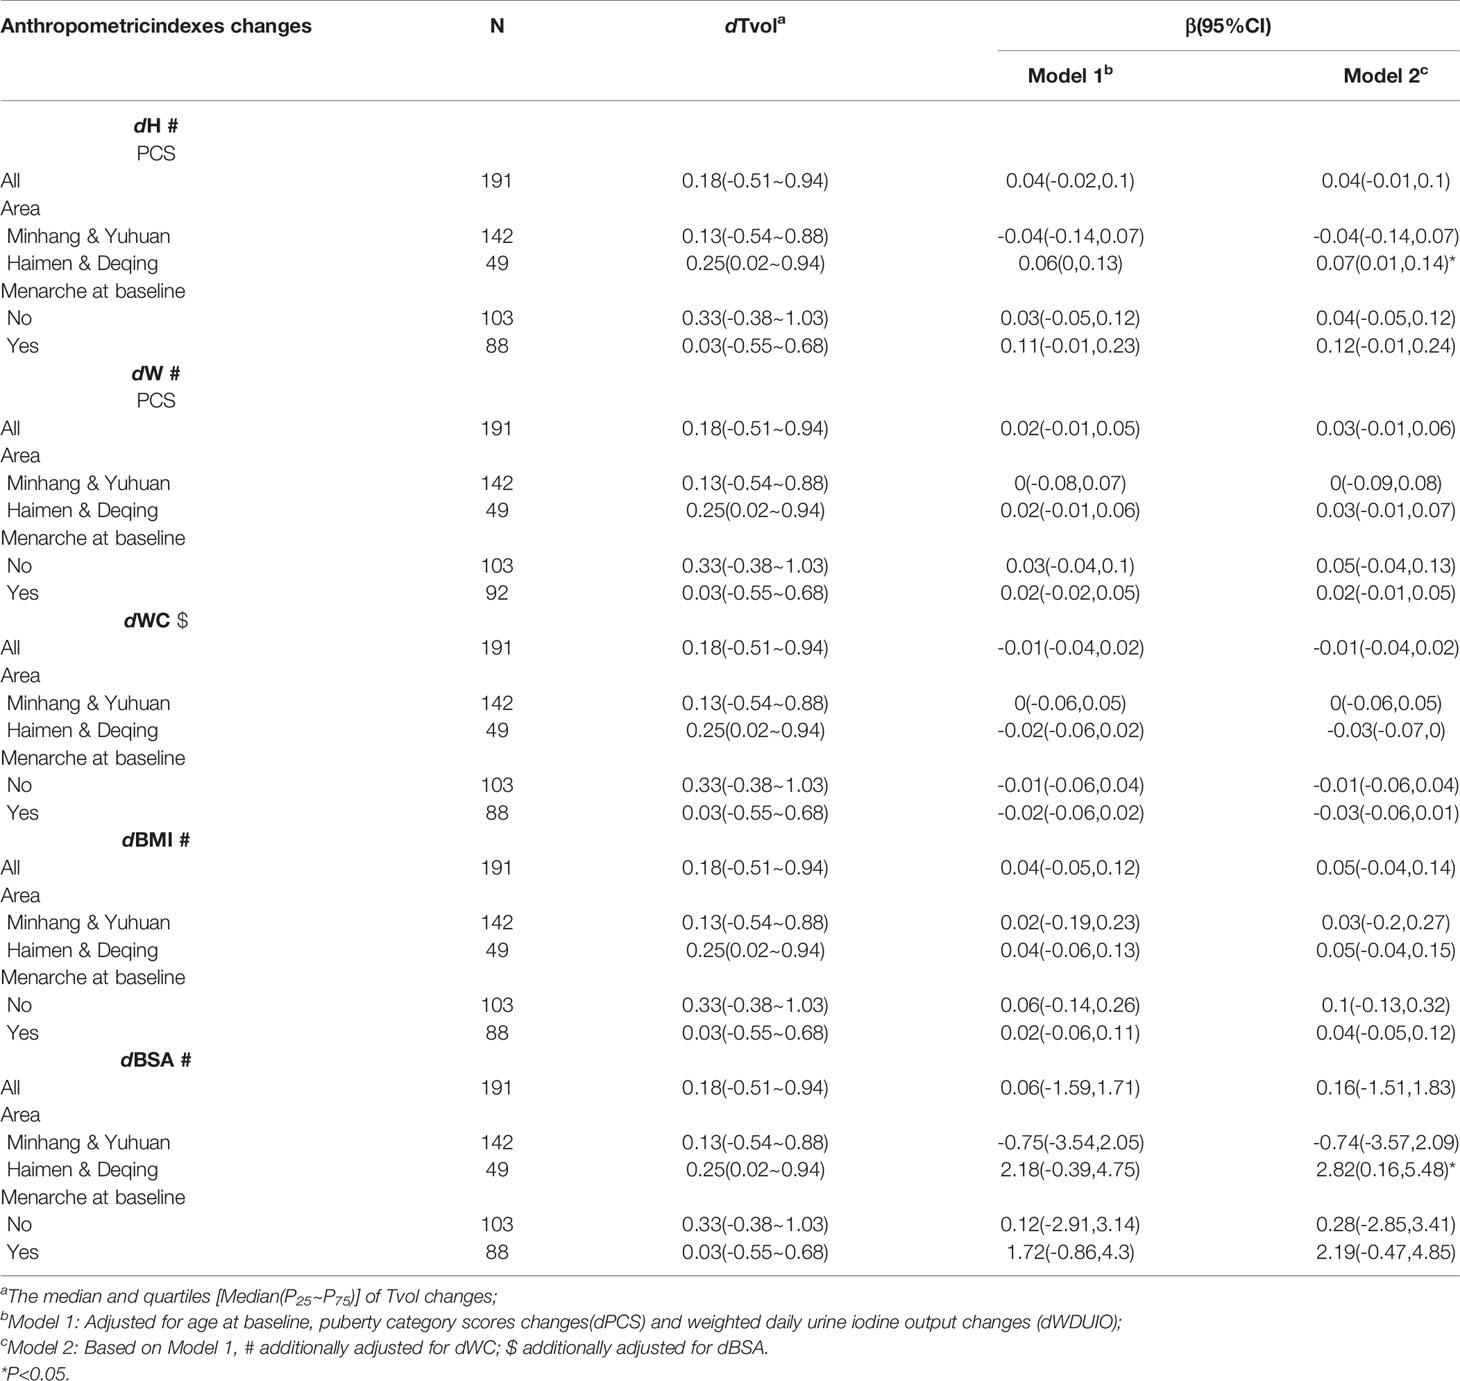
Table 2 Regression coefficients (βs) and 95% confidence intervals (95% CIs) for Tvol changes with anthropometric indexes changes by multiple linear regression models in 11 to 12-year-old group.
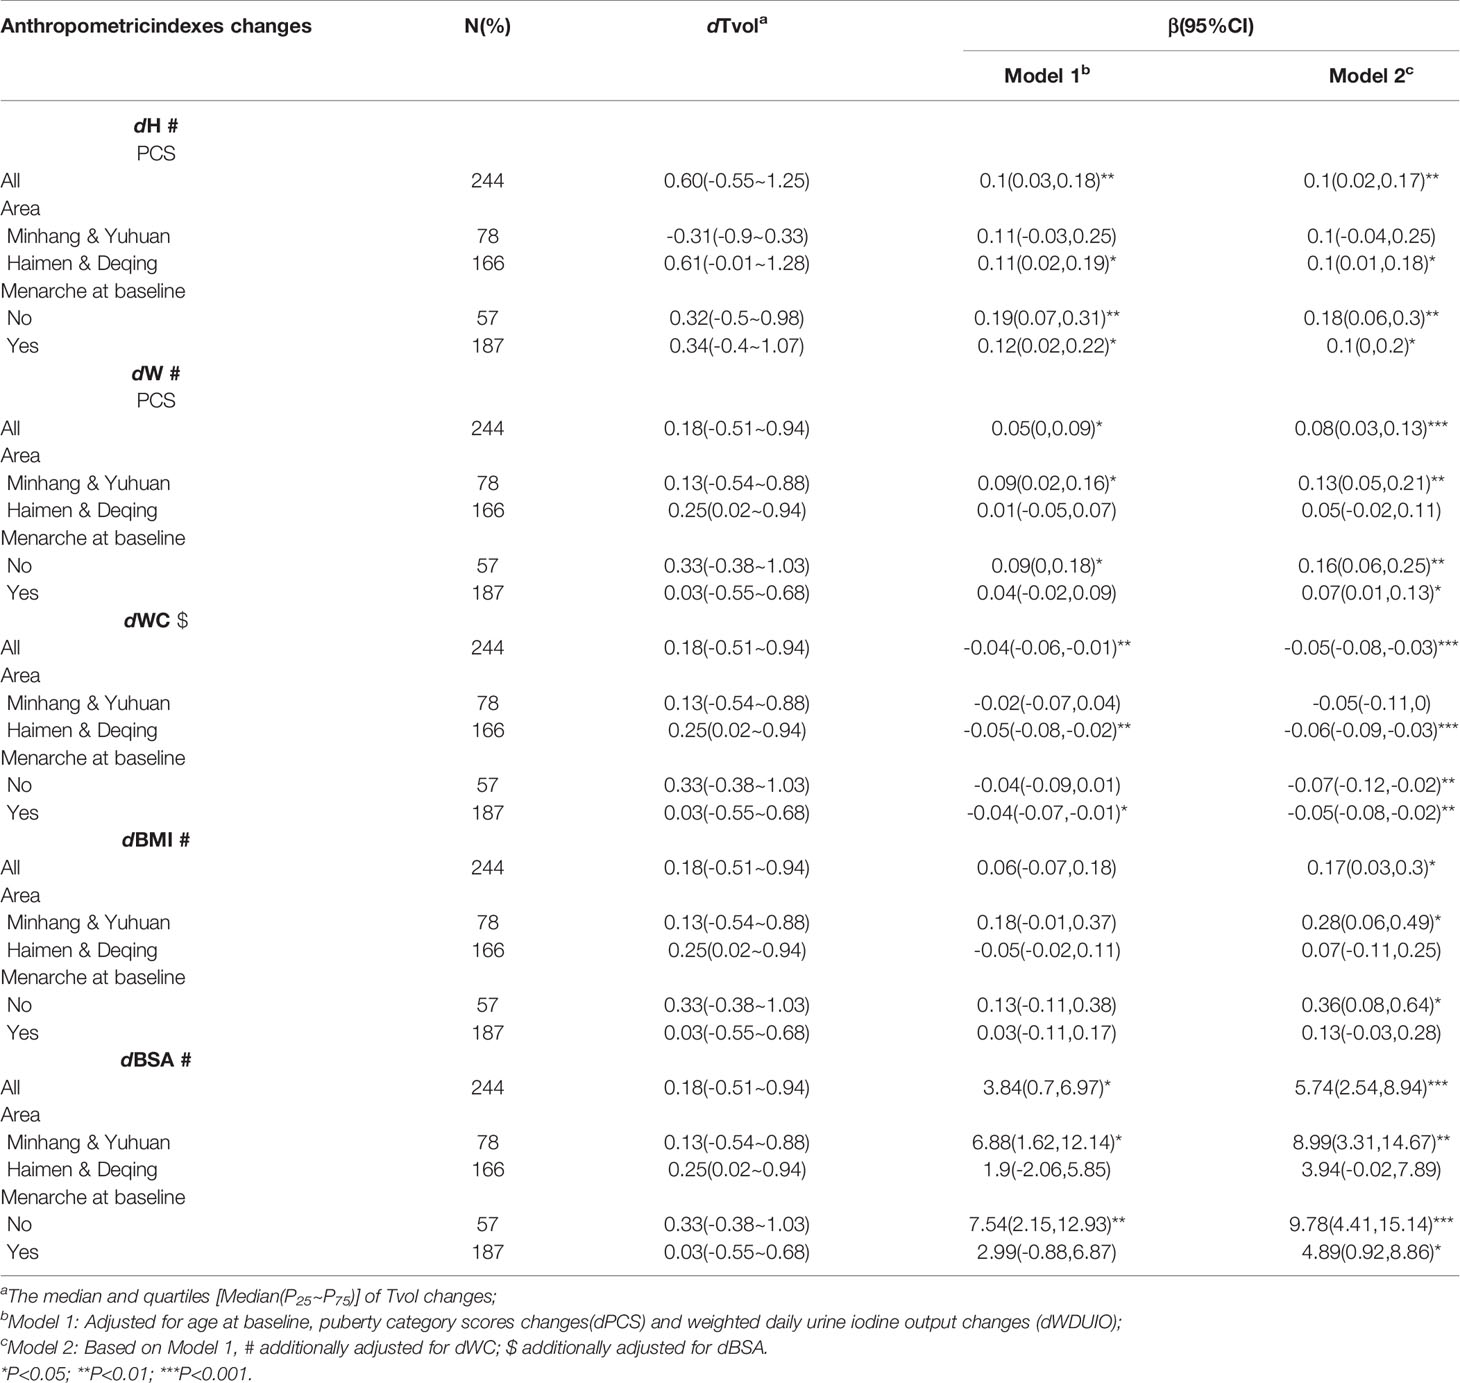
Table 3 Regression coefficients (βs) and 95% confidence intervals (95% CIs) for Tvol changes with anthropometric indexes changes by multiple linear regression models in 13 to 14-year-old group.
Associations of Thyroid Volume Indexes Changes (dHVI, dWHVI, dBMIV, and dBSAV) With Anthropometric Indexes Changes (dH, dW, dWC, dBMI, and dBSA)
The heatmap of spearman correlation analyses indicates the independence for dHVI and dBSAV (Figure 3). Among the 11- to 12-year-old group, neither dHVI nor dBSAV were associated with all anthropometric indexes (dH, dW, dWC, dBMI, and dBSA) (P>0.05), with the modulus of correlation coefficients (ρs) less than 0.10. Among the 13- to 14-year-old group, neither dHVI nor dBSAV were associated with dH, dW, dBMI, and dBSA (P>0.05). On the contrary, dWHVI was negatively related to all anthropometric indexes, with the maximum ρ modulus of -0.30 with dWC in the 13- to 14-year-old group.
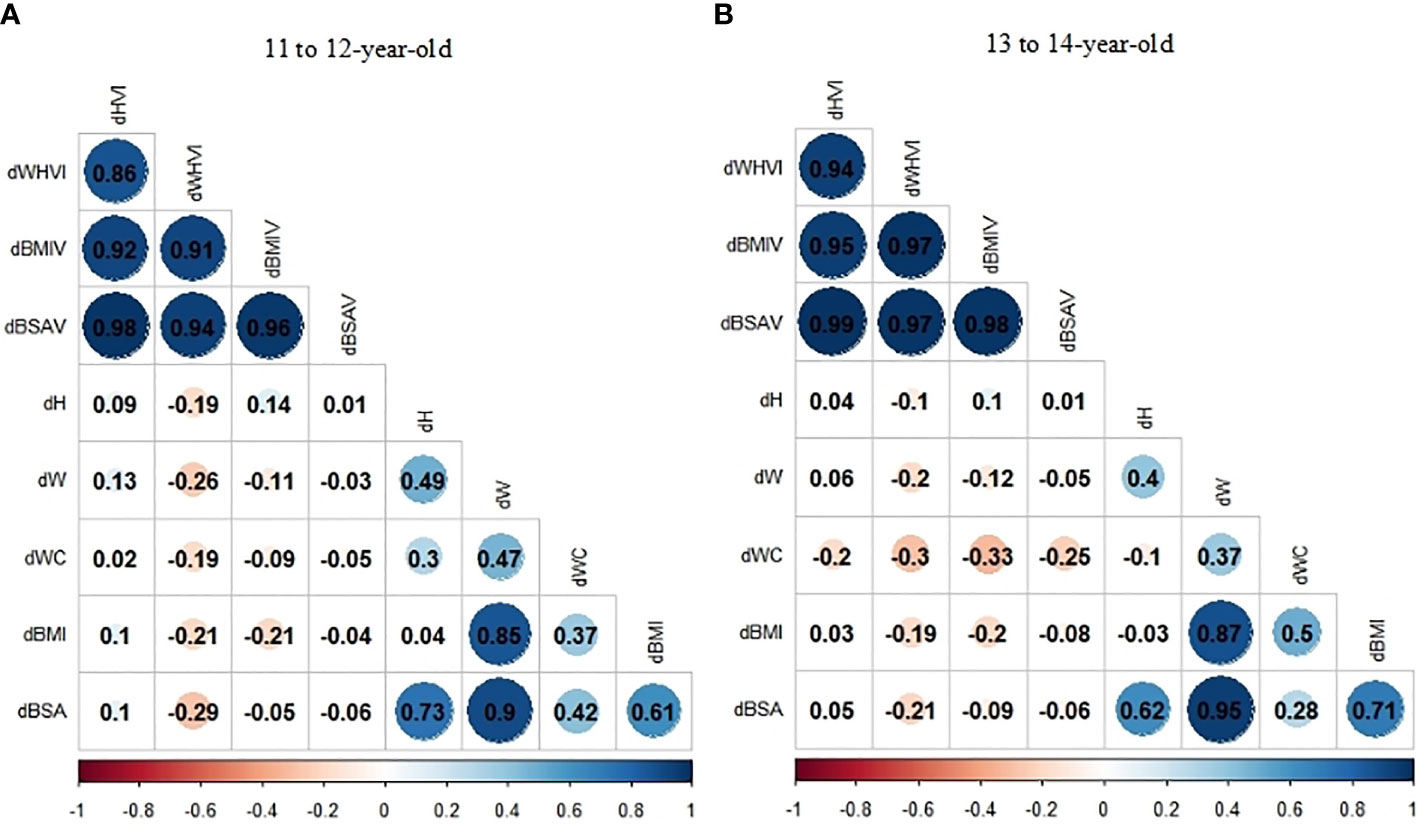
Figure 3 (A, B) Correlation coefficients (ρs) of the relationship between thyroid volume indexes (TVI) changes and anthropometric indexes changes stratified by age group by Spearman correlation analyses: (A)11 to 12-year-old group; (B) 13 to 14-year-old group.
Therefore, HVI and BSAV may be better indicators for establishing reference values for Tvol, with fewer associations with physical growth. The percentiles for HVI and BSAV by age are presented in Table 4.
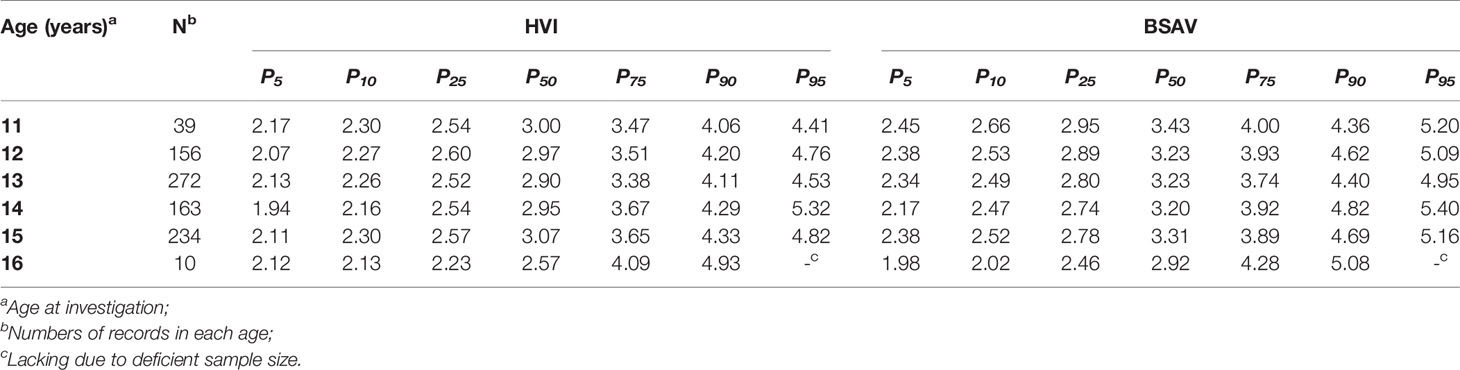
Table 4 Percentile values for height thyroid volume index (HVI) and body surface area thyroid volume index (BSAV) stratified by age in girls aged 11 to 16 years.
Discussions
Tvol is influenced by iodine nutrition status (24) and non-iodine factors (25). In this longitudinal cohort study, given the appropriate proportions of iodized-salt consumption in all sites, and the iodine-sufficient status for the target population, the effects of iodine-deficiency on Tvol are lesser discussed.
In our study, an increasing trend for Tvol, height, weight, WC, BMI, and BSA were observed during the study progress. We found that changes in height, weight, BMI, and BSA were positively related to Tvol enlargement, which was consistent with the results in children aged 8 to 10 years from East China in previous studies (16, 17). Similarly, positive correlations between Tvol and height or weight were also reported in Brazilian children aged 6 to 14 years by Svensson et al. (26), and in Swedish children aged 7 to 18 years by Lisboa (27). BSA was calculated according to height and weight and considered as a key predictor for Tvol, followed by age (8, 28). BMI can be seen as the adjusted-weight by height and the most frequently-used indicator to evaluate obesity status (29), larger Tvol was observed in the BMI-based obese children by Soydan et al. (30) Accentuated increases in body fat percentage occurs after the onset of puberty, when sex differences in overall and regional body composition become more visible, and girls may have more than twice the fat mass index (FMI) of boys (31). Adipocytes secrete a larger number of inflammatory cytokines, impairing sodium/iodine symporter function and accelerating thyrocyte proliferation (32). Another hypothesis is that leptin, a hormone produced by adipocytes, stimulates TSH secretion by hypothalamic-pituitary axis. TSH can stimulate the growth and metabolic activity of thyroid follicular cells (33). Therefore, more attention should be paid to body composition changes and body fat accumulation in pubertal girls to promptly recognize and reduce the risk for abnormal thyroid enlargement.
However, we found that dWC was negatively associated with dTvol. An appropriate interpretation of the results is that compared to other anthropometric indexes, which are based on height or weight, WC may represent physical growth in the horizontal dimension. In addition, the influences of anthropometric characteristics on Tvol in our study were established only in the 13 to 14-year-old group but not in the 11 to 12-year-old group. The landmarks of the pubertal events in girls are peak height velocity (PHV) and menarche. Menarche is a rather late event in puberty and usually occurs 6 months after PHV (34), which can be achieved at around 12 years old (35). Girls in the 11 to 12-year-old group were more likely to be in the early pubertal stage with less estrogen accumulation and lower baseline anthropometric characteristics values than the 13 to 14-year-old group. In stratified analyses, we further found the positive associations between dTvol and dH or dBSA in the 11 to 12-year-old group living in Haimen or Deqing, the areas with >90% iodized-salt consumption proportion, but there was no interaction between anthropometric indexes and area factor.
Chen et al. found that the goiter rates were widely divergent when assessed by WHO criterion and by Chinese criterion (33% vs. 10.9%) (24), the current WHO reference values for Tvol in children were proposed in 2004 based on age and BSA (13), while the Chinese criterion were established in 2007 based on age (15), meaning that the reference intervals for Tvol need to be adjusted and updated. In our study, the appropriate age-specific thyroid volume indexes (TVIs) are proposed. Consistent with previous studies (36, 37), HVI and BSAV are well-applicable for Tvol assessments in pubertal girls.
There exists some limitations in our study. First, subjects were residing in the iodine-sufficient regions in East China, so the reference values established in our study may not be fully applicable to other populations, but the thyroid volume indexes, after adjusting for the influences of physical growth, are worthy of being recommended. Second, due to the non-substantial sample size, subjects were divided into different age stratification with an interval of every two years as opposed to one year. Third, we failed to observe evident associations between dTvol and changes in the anthropometric indexes in the 11 to 12-year-old group, and we would expand the sample size for further observations and discussions in future studies. To our knowledge, this is one of few studies that explore the relationship between Tvol and physical growth in pubertal girls. It is important to consider youths in this age group who are in a critical growth period with increasing FMI and increasing Tvol, and the results from this study provide some evidence for goiter assessments in children during puberty.
Conclusions
Thyroid volume is associated with physical growth in pubertal girls in East China, and both age and anthropometric measurements must be comprehensively considered to establish the reference values for Tvol. HVI and BSAV may be better indicators for Tvol assessments in pubertal girls.
Data Availability Statement
The datasets for this article are not publicly available because it contains personal information of participants. Requests to access the datasets should be directed to NW, bmEud2FuZ0BmdWRhbi5lZHUuY24=.
Ethics Statement
The study was approved by the ethical review board of School of Public Health of Fudan University (#2012-03-0350S). Written informed consent to participate in this study was provided by the participants’ legal guardian/next of kin.
Author Contributions
XD, MS, DX, JQ, NW, and QJ contributed to the study design. YW, CF, FJ, RL, and NW contributed to data acquisition and collection. YW, NW, and YC contributed to data analysis and interpretation. YW, NW, and YC drafted the manuscript. All authors contributed to the article and approved the submitted version.
Funding
This work was supported by grants from the National Natural Science Foundation of China (Grant No. 81602806).
Conflict of Interest
The authors declare that the research was conducted in the absence of any commercial or financial relationships that could be construed as a potential conflict of interest.
Acknowledgments
We gratefully acknowledge all the staff who participated in this project, including health workers in Deqing County Center for Disease Control and Prevention, Yuhuan City Center for Disease Control and Prevention, Minhang District Center for Disease Control and Prevention, and Haimen City Center for Disease Control and Prevention, and those from local community health centers.
Abbreviations
Tvol, thyroid volume; H, height; W, weight; WC, waist circumference; BMI, body mass index; BSA, body surface area; TVI, thyroid volume index; HVI, height volume index; WHVI, weight height volume index; BMIV, body mass volume index; BSAV, body surface area volume index; DUIO, daily urine iodine output; WDUIO, weighted daily urine iodine output; UIC, urine iodine content; UCr, urine creatinine content; PDS, puberty development scale; PCS, pubertal category scores; ISCP, iodized-salt consumption proportions; ICP-MS, inductively coupled plasma mass spectrometry; PHV, peak height velocity; FMI, fat mass index.
References
1. Hanley P, Lord K, Bauer AJ. Thyroid Disorders in Children and Adolescents a Review. JAMA Pediatr (2016) 170(10):1008–19. doi: 10.1001/jamapediatrics.2016.0486
2. Wasikowa R, Iwanicka Z, Zak T, Lukienczuk T, Sawicz-Birkowska K. Nodular Goiter and Thyroid Carcinoma in Children and Adolescents in a Moderate Endemic Area (Lower Silesia-Sudeten Endemia) in the Last Twelve Years. J Pediatr Endocr Metab (1999) 12(5):645–52. doi: 10.1515/JPEM.1999.12.5.645
3. Derwahl M, Nicula D. Estrogen Its Role in Thyroid Cancer. Endocr-Relat Cancer (2014) 21(5):T273–83. doi: 10.1530/ERC-14-0053
4. Santin AP, Furlanetto TW. Role of Estrogen in Thyroid Function and Growth Regulation. J Thyroid Res (2011) 2011:875125. doi: 10.4061/2011/875125
5. Hoyt LT, Falconi AM. Puberty and Perimenopause: Reproductive Transitions and Their Implications for Women’s Health. Soc Sci Med (2015) 132:103–12. doi: 10.1016/j.socscimed.2015.03.031
6. Fleury Y, van Melle G, Woringer V, Gaillard RC, Portmann L. Sex-Dependent Variations and Timing of Thyroid Growth During Puberty. J Clin Endocr Metab (2001) 86(2):750–4. doi: 10.1210/jc.86.2.750
7. Kaloumenou I, Alevizaki M, Ladopoulos C, Antoniou A, Duntas LH, Mastorakos G, et al. Thyroid Volume and Echostructure in Schoolchildren Living in an Iodine-Replete Area: Relation to Age, Pubertal Stage, and Body Mass Index. Thyroid (2007) 17(9):875–81. doi: 10.1089/thy.2006.0327
8. Zou Y, Ding G, Lou X, Zhu W, Mao G, Zhou J, et al. Factors Influencing Thyroid Volume in Chinese Children. Eur J Clin Nutr (2013) 67(11):1138–41. doi: 10.1038/ejcn.2013.173
9. Xiu L, Zhong G, Ma X. Urinary Iodine Concentration (UIC) Could Be a Promising Biomarker for Predicting Goiter Among School-Age Children: A Systematic Review and Meta-Analysis. PloS One (2017) 12(3):e0174095. doi: 10.1371/journal.pone.0174095
10. Sea JH, Ji H, You SK, Lee JE, Lee SM, Cho HH. Age-Dependent Reference Values of the Thyroid Gland in Pediatric Population; From Routine Computed Tomography Data. Clin Imaging (2019) 56:88–92. doi: 10.1016/j.clinimag.2019.04.001
11. Fuse Y, Saito N, Tsuchiya T, Shishiba Y, Irie M. Smaller Thyroid Gland Volume With High Urinary Iodine Excretion in Japanese Schoolchildren: Normative Reference Values in an Iodine-Sufficient Area and Comparison With the WHO/ICCIDD Reference. Thyroid (2007) 17(2):145–55. doi: 10.1089/thy.2006.0209
12. Mo Z, Lou X, Mao G, Wang Z, Zhu W, Chen Z, et al. Larger Thyroid Volume and Adequate Iodine Nutrition in Chinese Schoolchildren: Local Normative Reference Values Compared With WHO/IGN. Int J Endocrinol (2016) 2016:8079704. doi: 10.1155/2016/8079704
13. Zimmermann MB, Ito Y, Hess SY, Fujieda K, Molinari L. High Thyroid Volume in Children With Excess Dietary Iodine Intakes. Am J Clin Nutr (2005) 81(4):840–4. doi: 10.1093/ajcn/81.4.840
14. Chen Tian J, Ji Cheng Y. Secular Change in Stature of Urban Chinese Children and Adolescents, 1985-2010. Biomed Environ Sci (2013) 26(1):13–22. doi: 10.3967/0895-3988.2013.01.002
15. Ministry of Health of the People’s Republic of China. WS 276-2007 Diagnostic Criteria for Endemic Goiter [S]. Beijing: People’s Medical Publishing House (2007).
16. Wang N, Liu P, Zhao Q, Zhao Y, Jiang F, Fang H, et al. An Assessment of Association of Thyroid Volume With Growth Indicators and Comparison of Different Thyroid Volume Indexes in School-Aged Children. Zhonghua Liu Xing Bing Xue Za Zhi (2015) 36(3):237–40.
17. Wang YY, Ni Gedeli A, Fu CW, Jiang F, Zhao Q, Wang N, et al. A Cohort Study on the Association Between Dynamics of Thyroid Volume and the Changes of Physical Growth as Well as the Comparison of Different Thyroid Volume Indexes in School-Aged Children. Chin J Epidemiol (2018) 39(12):1544–8.
18. Wang YY, Dong XL, Fu CW, Su MF, Jiang F, Xu DL, et al. Thyroid Stimulating Hormone (TSH) is Associated With General and Abdominal Obesity: A Cohort Study in School-Aged Girls During Puberty in East China. Front Endocrinol (2020) 11:620. doi: 10.3389/fendo.2020.00620
19. Zygmunt A, Adamczewski Z, Zygmunt A, Karbownik-Lewinska M, Lewinski A. The Influence of the Manner of Performing the Thyroid Ultrasound Examination on the Reliability of the Assessment of the Thyroid Size in School-Aged Children. Horm Res Paediatr (2017) 87(6):368–76. doi: 10.1159/000473877
20. Sholosh B, Borhani AA. Thyroid Ultrasound Part 1: Technique and Diffuse Disease. Radiol Clin North Am (2011) 49(3):391–416, v. doi: 10.1016/j.rcl.2011.02.002
21. Brunn J, Block U, Ruf G, Bos I, Kunze WP, Scriba PC. Volumetric Analysis of Thyroid Lobes by Real-Time Ultrasound (Author’s Transl). Dtsch Med Wochenschr (1981) 106(41):1338–40. doi: 10.1055/s-2008-1070506
22. Remer T, Neubert A, Maser-Gluth C. Anthropometry-Based Reference Values for 24-H Urinary Creatinine Excretion During Growth and Their Use in Endocrine and Nutritional Research. Am J Clin Nutr (2002) 75(3):561–9. doi: 10.1093/ajcn/75.3.561
23. Koopman-Verhoeff ME, Gredvig-Ardito C, Barker DH, Saletin JM, Carskadon MA. Classifying Pubertal Development Using Child and Parent Report: Comparing the Pubertal Development Scales to Tanner Staging. J Adolesc Health (2020) 66(5):597–602. doi: 10.1016/j.jadohealth.2019.11.308
24. Chen W, Li X, Wu Y, Bian J, Shen J, Jiang W, et al. Associations Between Iodine Intake, Thyroid Volume, and Goiter Rate in School-Aged Chinese Children From Areas With High Iodine Drinking Water Concentrations. Am J Clin Nutr (2017) 105(1):228–33. doi: 10.3945/ajcn.116.139725
25. Knudsen N, Laurberg P, Perrild H, Bulow I, Ovesen L, Jorgensen T. Risk Factors for Goiter and Thyroid Nodules. Thyroid (2002) 12(10):879–88. doi: 10.1089/105072502761016502
26. Lisböa HR, Gross JL, Orsolin A, Fuchs S. Clinical Examination is Not an Accurate Method of Defining the Presence of Goitre in Schoolchildren. Clin Endocrinol (Oxf) (1996) 45(4):471–5. doi: 10.1046/j.1365-2265.1996.8200830.x
27. Svensson J, Nilsson PE, Olsson C, Nilsson JA, Lindberg B, Ivarsson SA. Interpretation of Normative Thyroid Volumes in Children and Adolescents: is There a Need for a Multivariate Model? Thyroid (2004) 14(7):536–43. doi: 10.1089/1050725041517066
28. Chen W, Zhang Q, Wu Y, Wang W, Wang X, Pearce EN, et al. Shift of Reference Values for Thyroid Volume by Ultrasound in 8-to 13-Year-Olds With Sufficient Iodine Intake in China. Thyroid (2019) 29(3):405–11. doi: 10.1089/thy.2018.0412
29. Wang YY, Jiang YG, Wang N, Zhu MY, Liu X, Wang RP, et al. Central But Not General Obesity is Positively Associated With the Risk of Hyperhomocysteinemia in Middle-Aged Women. Nutrients (2019) 11(7). doi: 10.3390/nu11071614
30. Soydan L, Eren Ozturk H, Onal ZE, Nuhoglu C. Associations of Thyroid Volume and Function With Childhood Obesity. Acta Endocrinol (Buchar) (2019) -5(1):123–8. doi: 10.4183/aeb.2019.123
31. Santos LP, Santos IS, Matijasevich A, Barros AJD. Changes in Overall and Regional Body Fatness From Childhood to Early Adolescence. Sci Rep (2019) 9(1):1888. doi: 10.1038/s41598-019-38486-x
32. Frühbeck G, Gómez-Ambrosi J, Muruzábal FJ, Burrell MA. The Adipocyte: A Model for Integration of Endocrine and Metabolic Signaling in Energy Metabolism Regulation. Am J Physiol Endocrinol Metab (2001) 280(6):E827–847. doi: 10.1152/ajpendo.2001.280.6.E827
33. Betry C, Challan-Belval MA, Bernard A, Charrie A, Drai J, Laville M, et al. Increased TSH in Obesity: Evidence for a BMI-Independent Association With Leptin. Diabetes Metab (2015) 41(3):248–51. doi: 10.1016/j.diabet.2014.11.009
34. Karapanou O, Papadimitriou A. Determinants of Menarche. Reprod Biol Endocrinol (2010) 8:115. doi: 10.1186/1477-7827-8-115
35. Boeyer ME, Middleton KM, Duren DL, Leary EV. Estimating Peak Height Velocity in Individuals: A Comparison of Statistical Methods. Ann Hum Biol (2020) 47(5):434–45. doi: 10.1080/03014460.2020.1763458
36. Zhou J, Huang X, Zhu W, Qin G. Study on the Upper Limit and Its Revision Method of Normal Thyroid Volume of Children of 8-10 Years-Old in Zhejiang Province. Wei Sheng Yan Jiu (2007) 36(4):517–9.
Keywords: thyroid volume, thyroid volume index, anthropometric index, puberty, girls
Citation: Wang Y, Dong X, Fu C, Su M, Jiang F, Xu D, Li R, Huang P, Wang N, Chen Y and Jiang Q (2021) Associations Between Thyroid Volume and Physical Growth in Pubertal Girls: Thyroid Volume Indexes Need to Be Applied to Thyroid Volume Assessments. Front. Endocrinol. 12:662543. doi: 10.3389/fendo.2021.662543
Received: 01 February 2021; Accepted: 13 April 2021;
Published: 19 May 2021.
Edited by:
Christoph Reiners, University Hospital Würzburg, GermanyReviewed by:
Stefano Spiezia, Local Health Authority Naples 1 Center, ItalyGiorgio Radetti, Ospedale di Bolzano, Italy
Copyright © 2021 Wang, Dong, Fu, Su, Jiang, Xu, Li, Huang, Wang, Chen and Jiang. This is an open-access article distributed under the terms of the Creative Commons Attribution License (CC BY). The use, distribution or reproduction in other forums is permitted, provided the original author(s) and the copyright owner(s) are credited and that the original publication in this journal is cited, in accordance with accepted academic practice. No use, distribution or reproduction is permitted which does not comply with these terms.
*Correspondence: Na Wang, bmEud2FuZ0BmdWRhbi5lZHUuY24=