 Yaming Liu1
 Djorde Antonijević1,2,3,4
 Ruining Li1
 Yuxuan Fan1Ksenija Dukić2
 Milutin Mićić2
 Genyu Yu1
 Zhiyu Li5
 Marija Djurić2
 Yifang Fan1*
- 1Foot Research Laboratory, School of Physical Education and Sport Science, Fujian Normal University, Fuzhou, China
- 2Laboratory for Anthropology, Institute for Anatomy, School of Medicine, University of Belgrade, Belgrade, Serbia
- 3Laboratory for Atomic Physics, Institute for Nuclear Science “Vinca”, University of Belgrade, Belgrade, Serbia
- 4School of Dental Medicine, University of Belgrade, Belgrade, Serbia
- 5College of Foreign Studies, Jinan University, Guangzhou, China
The aim of the present paper is to determine the sex of the individual using three-dimensional geometric and inertial analyses of metatarsal bones. Metatarsals of 60 adult Chinese subjects of both sexes were scanned using Aquilion One 320 Slice CT Scanner. The three-dimensional models of the metatarsals were reconstructed, and thereafter, a novel software using the center of mass set as the origin and the three principal axes of inertia was employed for model alignment. Eight geometric and inertial variables were assessed: the bone length, bone width, bone height, surface-area-to-volume ratio, bone density, and principal moments of inertia around the x, y, and z axes. Furthermore, the discriminant functions were established using stepwise discriminant function analysis. A cross-validation procedure was performed to evaluate the discriminant accuracy of functions. The results indicated that inertial variables exhibit significant sexual dimorphism, especially principal moments of inertia around the z axis. The highest dimorphic values were found in the surface-area-to-volume ratio, principal moments of inertia around the z axis, and bone height. The accuracy rate of the discriminant functions for sex determination ranged from 88.3% to 98.3% (88.3%–98.3% cross-validated). The highest accuracy of function was established based on the third metatarsal bone. This study showed for the first time that the principal moment of inertia of the human bone may be successfully implemented for sex estimation. In conclusion, the sex of the individual can be accurately estimated using a combination of geometric and inertial variables of the metatarsal bones. The accuracy should be further confirmed in a larger sample size and be tested or independently developed for distinct population/age groups before the functions are widely applied in unidentified skeletons in forensic and bioarcheological contexts.
1 Introduction
“Virtopsy” is a term introduced in forensics and bio-archeology to describe the application of the three-dimensional (3D) cross-section imaging (CSI) analysis of human remains. These techniques include organs’ 3D reconstruction and precise quantitative measurements based on multi-slice computed tomography or magnetic resonance imaging data (1). Indeed, the replacement of traditional postmortem techniques with CSI examination has been recommended by scientific, cultural, and humanitarian groups due to its non-invasiveness, digital nature, and 3D reconstruction opportunities (2). Literature data provide numerous evidences that CSI reconstruction is useful for the analysis of the neuronal morphology, bones, and teeth (3–8). For instance, the possibility to estimate a person’s age by assessment of dental pulp volume or sex by calculating long bone’s metrical quantities has been documented (9–13).
Sex estimation of skeletal remains is a basic element in creating a biological profile in archeology and forensics (14, 15). The estimation relies heavily on the analysis of the pelvic and cranial features (7, 16). However, in reality, it is not rare that the discovered skeletal remains are incomplete and consequently investigators have to focus on the remaining bones (17). In this context, metatarsal bones with small quantity and surface area are more likely to be preserved intact and in some cases they present the only option for sex estimation (18). The prevalence of metatarsal bones at archeological sites ranges between 43% and 89%, considerably more than that of other bones. For example, in seven forensics cases in Northern Italy 97.1% metatarsal bones were present, including 100% first metatarsal bones (19).
Research has already proven the accuracy of virtual sex assessment using CSI of metatarsal bones. For instance, metatarsals’ linear measurements such as maximum length, width of head, and width of base are shown to provide accurate sex estimation (17). In addition, the volume of the first metatarsal bone and the torsion of the second metatarsal bone were employed to establish successful sex and aging protocols (19, 20). The accuracy of currently available geometric protocols is approximately 80%, which gives room for further improvements (19). Sex estimation can be accurately performed using the DNA analysis, which highly depends on the quantity and quality of DNA samples; however, it is not an applicable method to accurately identify sex of human skeletal remains, since the DNA begins to degrade immediately after the cells die (21). Although bone and teeth can provide some protection against DNA degradation, the environment for preservation is highly demanding, such as temperature, moisture levels, oxygen levels, soil composition, and pH value (22). Y chromosome deletions or mutations in the priming or binding sites can lead to incorrect estimation of sex and reduce the accuracy of DNA analysis (23–25). Studies show that the accuracy of DNA analysis in determining the sex of ancient human remains ranges from 52% to 95% (23–25). For bone fossils, the older the fossil, the lower the amount of extractable DNA. No extractable DNA was left in bone fossil between 200,000 and 500,000 years ago (26). Furthermore, the process of DNA extraction is destructive (22, 27), which is not feasible when preservation of ancient skeletal remains is required (28). Therefore, when we attempt to determine the sex of bone fossils, the advantages of morphology and inertia variables will be more obvious.
The current investigation seeks to test the hypothesis that 3D reconstruction of metatarsal bones might present a promising alternative to traditionally employed methods for forensics and archeological sex estimation. More precisely, this study aims to define physical metatarsal bone quantities of interest for the discrimination between male and female subjects. To this purpose, 60 subjects’ metatarsals (n = 600) were scanned using computed tomography and virtually analyzed with an intention to identify quantitative measurements referring to the sex of the individual. In addition to normalizing bone’s sexual identifying geometric variables (bone length, width, height, surface area, and volume), this study was specifically designed to increase the sex determination accuracy by including the inertial variables—three principal moments of inertia (PMI) relative to their principal axes of inertia (PAI) (x, y, and z).
2 Subjects and Methods
2.1 Subjects
We recruited subjects from our university who volunteered to participate in this program. Sixty healthy adults (30 males and 30 females) from Fujian Normal University were selected. Their mean age was 20.9 ± 3.0 years, mean height 170.9 ± 9.9 cm, and mean weight 62.5 ± 10.6 kg. The detailed characteristics of male and female subjects are shown in Table S1 (Supplementary File III). The study received approval from the Ethical Committee of Fujian Normal University. The subjects provided fully informed consent to participate in the study by signing a written consent form. Then, a questionnaire was distributed to volunteer students to exclude those with lower limb injury history. Each potential subject’s annual medical report was checked to exclude those with disease or trauma in their nervous and/or musculoskeletal system.
2.2 Scanning Procedure
Subjects were scanned using Aquilion One 320 Slice CT Scanner (Toshiba, Japan). The scan settings were as follows: tube voltage of 120 kV, tube current exposure time of 50 mAs, layer distance of 0.45–50 mm, pixel size of 0.46 ± 0.02 mm, and automatic threshold between -1024 and 4145 Hounsfield units (HU). The scanning was conducted along the transect of both feet, from top to bottom. The scanning posture of 60 subjects is shown in Supplementary File I; Figures S1A, B.
2.3 Definition of Coordinate System of Metatarsal Bones
The 3D models were constructed using Mimics software system (Mimics Research 17.0 for X64; Materialise, Leuven, Belgium). The reconstructed metatarsal bones are shown in Supplementary File I; Figures S2A, B. Software solution was employed to position the 3D models of 600 metatarsals (Supplementary File II). In brief, software includes setting the direction and order of three coordinate axes of the metatarsal. Specifically, by going through the center of mass (COM) of the metatarsal, the PAI set to go from metatarsal head to base was the z axis, with the direction from the head to the base as the positive direction; the PAI set to go from plantar to dorsal was the x axis; and the PAI set to go from the medial metatarsal body to lateral was the y axis.
The bone length, width, height, bone density, surface area, volume, and three PMIs around the x, y, and z axes were obtained from the positioned metatarsal bones (Supplementary File I; Figures S3A, B).
2.4 Extracting Biometric Sex Estimation Identifiers
The bone length, width, height, surface area, and volume were extracted automatically from Mimics software (Supplementary File I; Figure S4) and from the 3D models of metatarsal bones described in Section 2.3.
2.4.1 Normalization of Linear Variables
Equation (1) was used to normalize the linear measurements and to eliminate the effect from subjects’ body height difference, possible sub-voxel scanning accuracy (29, 30), and possible voxel order of magnitude errors from segmentation accuracy derived from both segmentations alone or non-detected subject micro-movement during the scanning procedure (31):
where Lp, Wp, and Hp refer to the length, width, and height of the positioned bone, and Ln, Wn, and Hn those of the normalized, respectively.
2.4.2 Normalization of Inertial Variables
The Hounsfield number of a CT scan is a product of radiation dose and attenuation coefficient (derived from density and atomic number) of the scanned material (32). In our case, it is influenced by bone density, body mass and size, and again possible micro-movement of the subjects during scanning procedure, which can create voxel order of magnitude geometric dimension errors on the 3D model derived from the scan by altering the valve of HU and thus threshold and segmentation procedures. As we derive the mass of 3D models of metatarsal bones from the HU used for the segmentation procedure to calculate the PAI, Equation (2) was employed to eliminate those effects (31) and to normalize inertial variables:
2.4.3 Calculation of Surface-Area-to-Volume Ratio
The surface-area-to-volume ratio (SA: V) of 3D reconstruction of the metatarsal bone was calculated, as shown in Equation (3):
where S refers to the surface area of metatarsal bone, and V to the volume of metatarsal bone.
2.4.4 Calculation of Bone Density
The bone density of the 3D reconstructed metatarsal bone was calculated, shown in Equation (4):
where , gi stands for the gray value of the volume element, gw that of water. The equipment has been calibrated; the gray value of the air is set to 0, and that of the water is 1024. N refers to the number of bone’s volume elements.
2.5 Parameter Setting of the Reconstruction
The same parameter settings were used to reconstruct all metatarsal bones. Specifically, in the Mimics software, the “Predefined Thresholds Sets: Bone (CT),” “Fill holes,” and “Keep largest” options of “Thresholding” were not selected. The operations of “Local Thresholding,” “Region Growing,” and “Dynamic Region Growing” were not performed. In “Morphology Operations,” the operation was set to “Close” to operate the selected metatarsal.
2.6 Statistical Analysis
To test the influence of the reconstruction parameter setting on the consistency of reconstructed metatarsal geometric measurements, intraclass correlation coefficient (ICC) analysis was performed on the length, width, height, surface area, volume, and SA: V of 60 metatarsal bones from previous research (33), where the reconstruction parameter settings were the same as this study, and 60 metatarsal bones were scanned and reconstructed twice.
The assumption of normality and homogeneity of variances were tested by the Shapiro–Wilk test and Levene’s test, respectively (Supplementary File III; Tables S3–S5). The comparisons of measurement values between sexes were evaluated with the independent sample t-test analysis when data were normal distribution and homoscedasticity. The Mann–Whitney U test was performed when data were non-normal distribution, and the results of Welch’s test would be accepted when data were heteroscedasticity. The statistical level was determined as p < 0.05. The sexual dimorphism index (SDI) was determined as (Xm - Xf/Xm + Xf) × 100, where Xm and Xf are the mean values of the male and female groups, respectively (34). SDI represents the degree of variation between sexes. When males’ variables were larger than those of the females’, the SDI value was positive; otherwise, it was negative. The closer it got to zero, the less significant the difference between the male and the female was. The correlation between subjects’ characteristics and bone variables was evaluated by Spearman’s correlation coefficient (35).
To determine the best sex-discriminatory variables, the stepwise discriminant function analysis (SDFA) (Wilk’s lambda) was performed for each left and right metatarsal bone. The assumption tests including multivariate normality, multicollinearity, multivariate outliers within groups, homogeneity of variances/covariances, and linearity were conducted prior to the performance of the SDFA. Multivariate normality was assessed by Mardia’s skewness and kurtosis (36). A Mahalanobis distance test was used to detect multivariate outliers (37). The Pearson correlation test was performed to test multicollinearity among variables (38). Homogeneity of variance–covariance matrices and linearity were evaluated by Box’s M test and matrix scatter plots, respectively. Data analyses were processed with SPSS 23.0 (IBM Corp.).
Prior probability was set as “all group equal” for all analyses. The smaller value of the function’s Wilks’ lambda indicates greater discriminatory ability of the function. The standardized canonical discriminant coefficients imply contribution of each variable. The higher the value, the greater the contribution of the variable. The structure matrix demonstrates the correlation between each variable and the discriminant function. The closer the value of the variable to 1, the stronger the correlation. Unstandardized coefficients are utilized to form the discriminant function and calculate the discriminant function score (Y). The form of function is Y = a1x1 + a2x2 +···+ anxn + C (a1 - an = unstandardized coefficients, x1-xn = variables, n = the number of variables, and C = the constant value). A “leave one out classification” procedure is performed in order to estimate the accuracy rate of the original sample and the sample created by cross-validation.
3 Results
The original and positioned scanning postures of the investigated metatarsal bones are shown in Figure 1. Figure 2 shows the process of bones’ alignment in the x, y, and z planes.
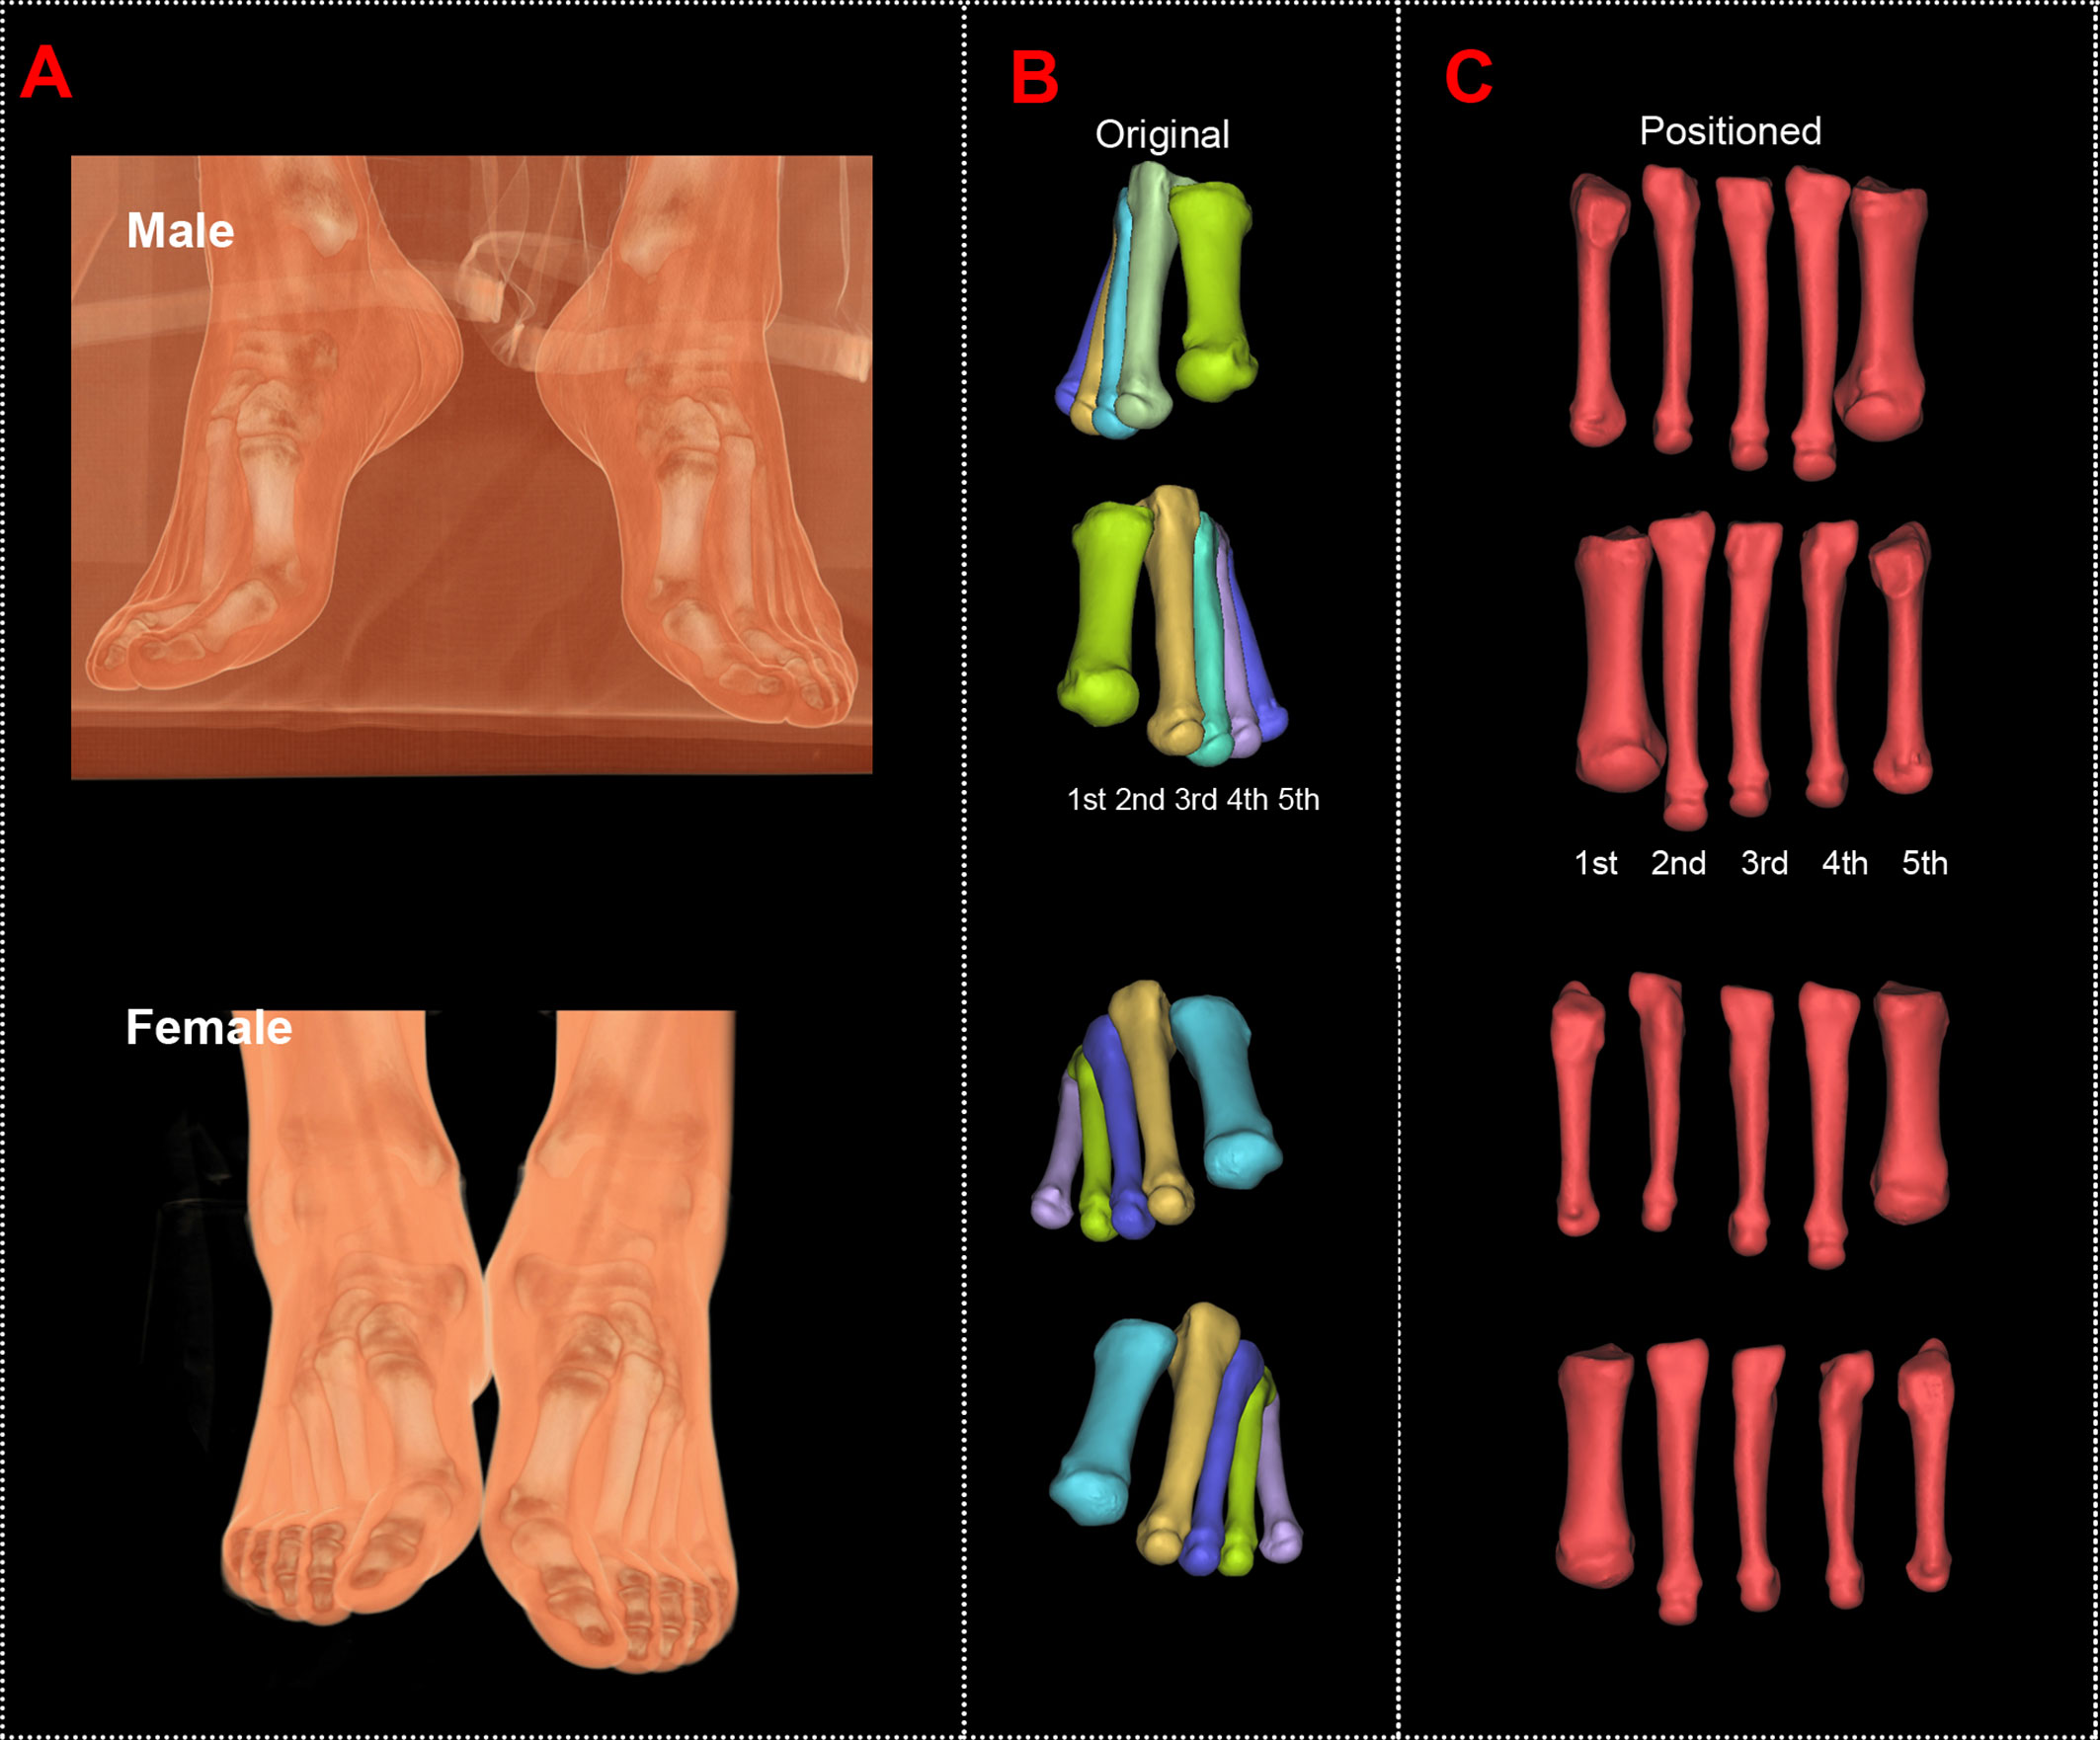
Figure 1 Computed tomography reconstructions of the original and positioned scanning posture of the investigated metatarsal bones. (A) Scanning postures of a male and a female subject. (B) Reconstructed first to fifth metatarsal bones of the male and female subjects. (C) Positioned first to fifth metatarsal bones of the male and female subjects.
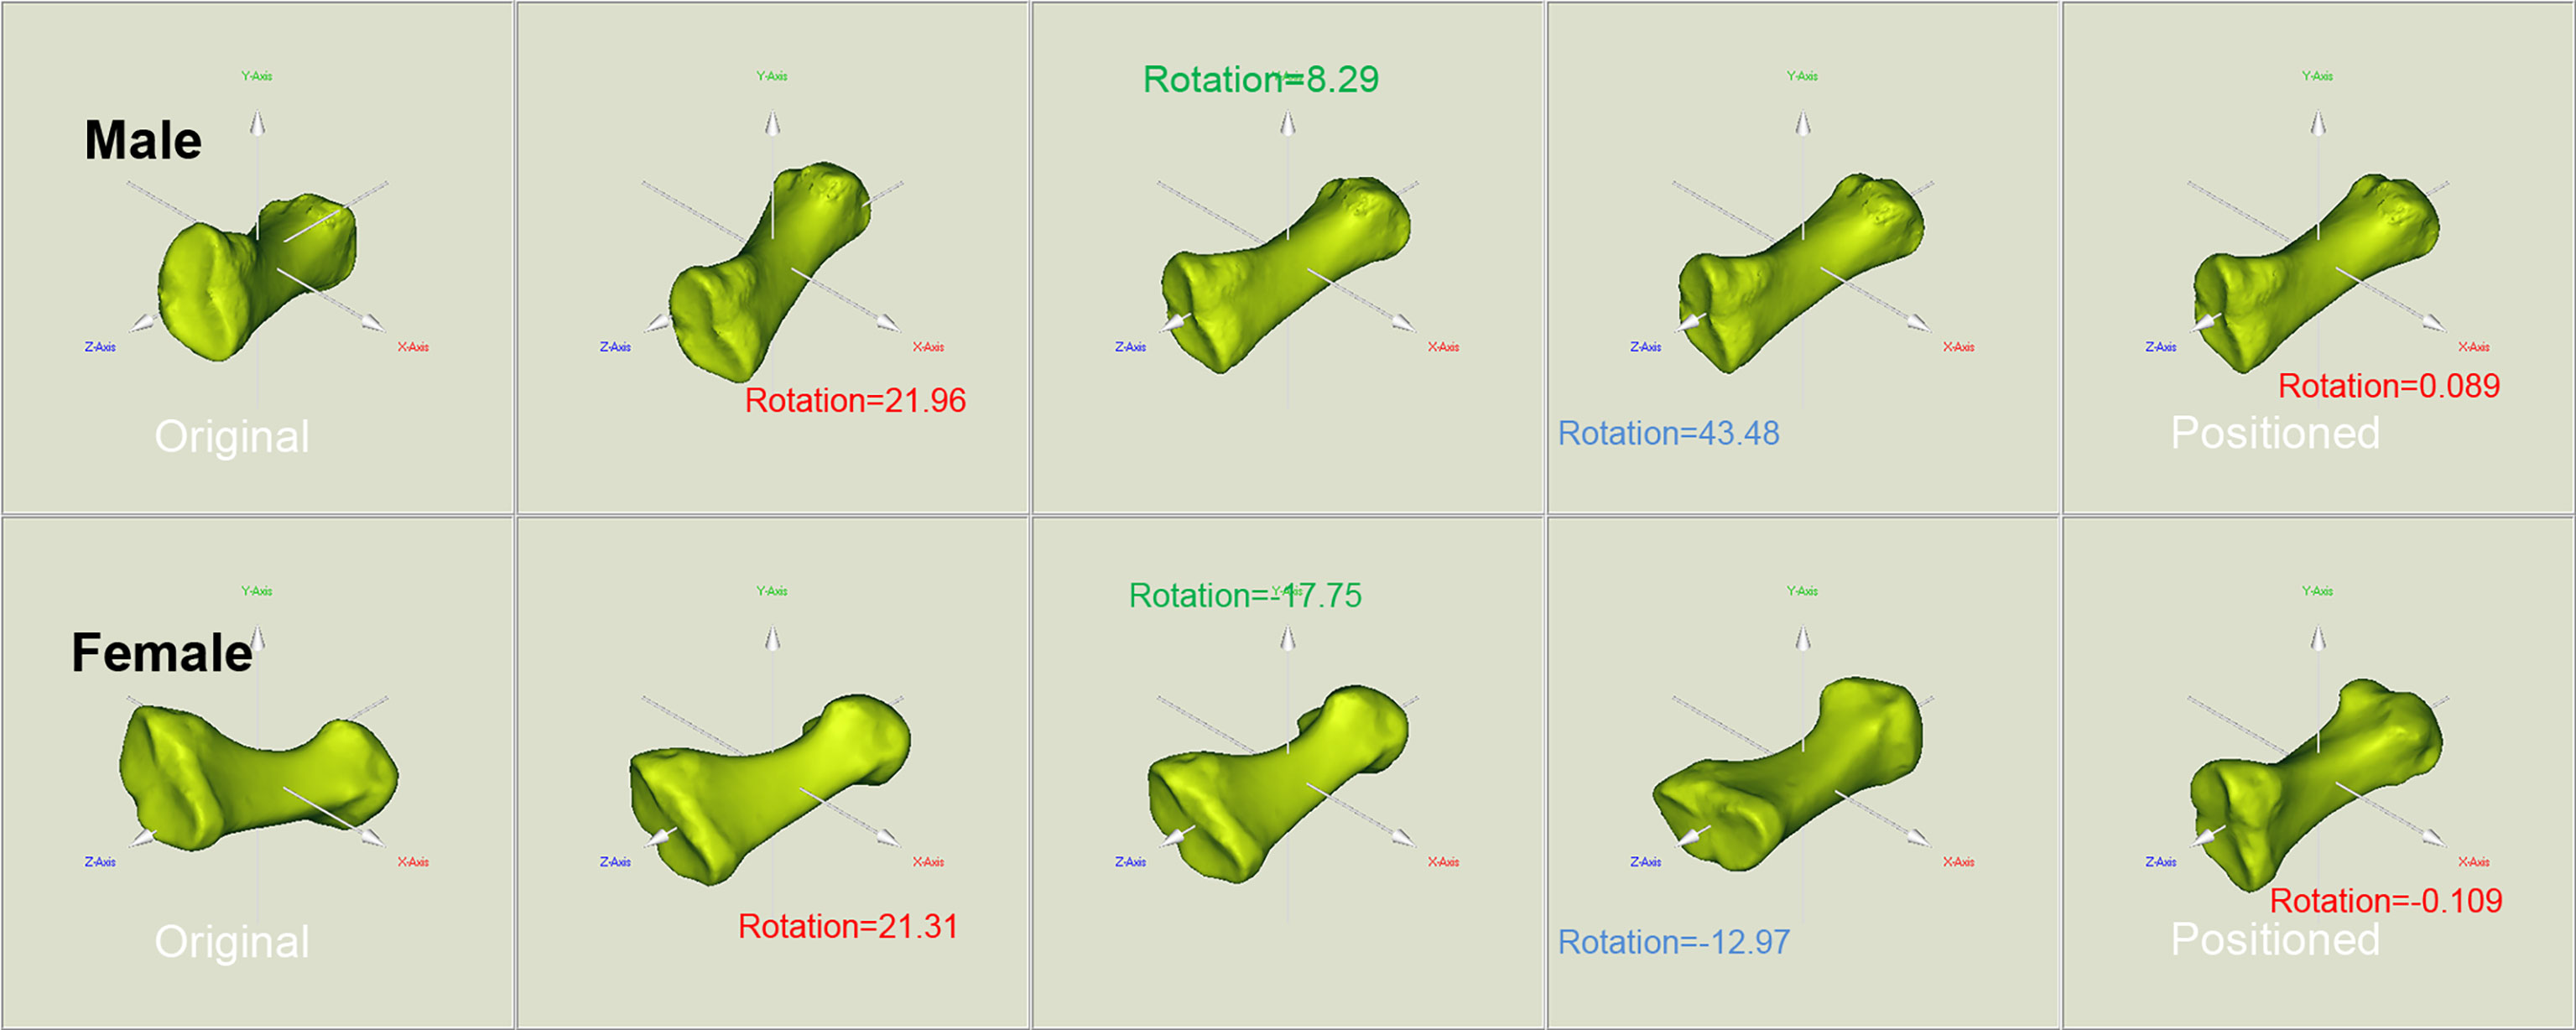
Figure 2 Positioning of the reconstructed bone alongside the body coordinate system of the male and female metatarsals. To facilitate the location and orientation positioning, COMs were aligned and the PAIs were used to define the coordinate system within each metatarsal. The rotation around the x, y, and z axes allows to achieve the alignment of the investigated metatarsals.
Shown in Table S2 are the ICC analysis results of the length, width, height, surface area, volume, and SA: V of the reconstructed metatarsal bones from two scans. The best consistency is shown in bone length, up to 1.00. The volume of the third metatarsal presents the lowest ICC, i.e., 0.81. The ICC values of the remaining measurements range from 0.91 to 0.99. It is worth noting that the ICC values of SA: V are between 0.93 and 0.98, higher than those of surface area and volume.
Tables 1–3 reveal the descriptive results and SDI values of eight variables of both sides of the investigated metatarsal bones between sexes. The highest SDIs were found in SA: V (-6.055% – -7.656% and -6.227 – - 7.949% from the left and right sides, respectively), PMIz (3.797%–5.455% and 2.564%–7.692% from the left and right sides, respectively), and height (1.292%–2.389% and 1.026%–2.235% from the left and right sides, respectively). SA: V and PMIz show greater sexual dimorphism than linear variables. Of note is that the SDI values of bone length, SA: V, PMIx, and PMIy were negative, indicating a larger value of females than that of males.
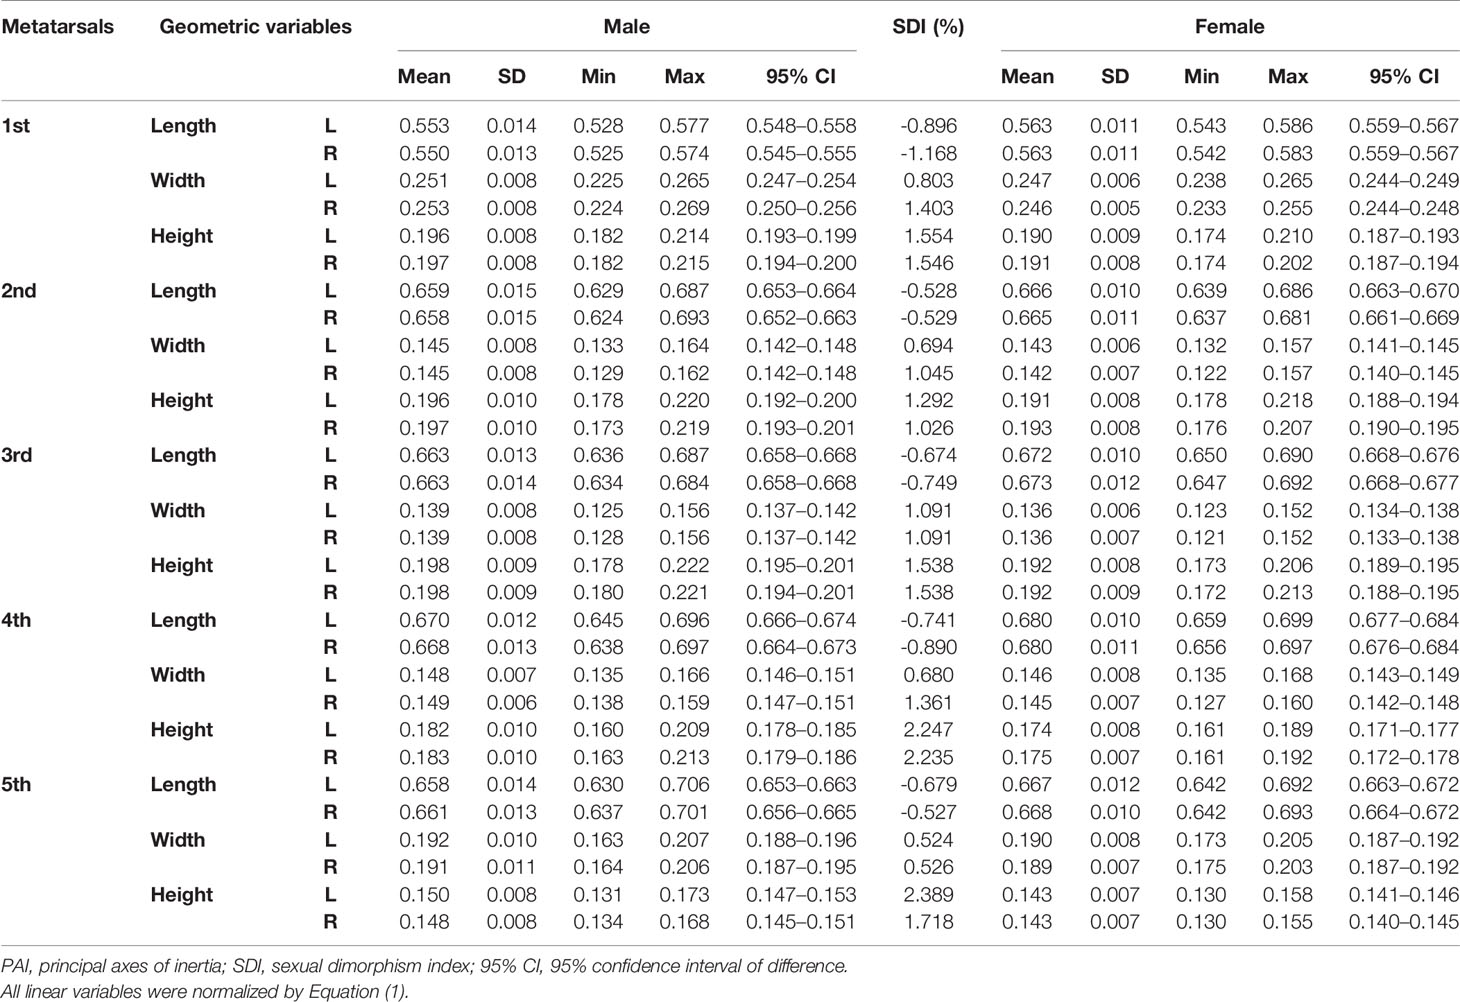
Table 1 Descriptive results of normalized length, width, and height of metatarsal bone in vivo based on its PAI.
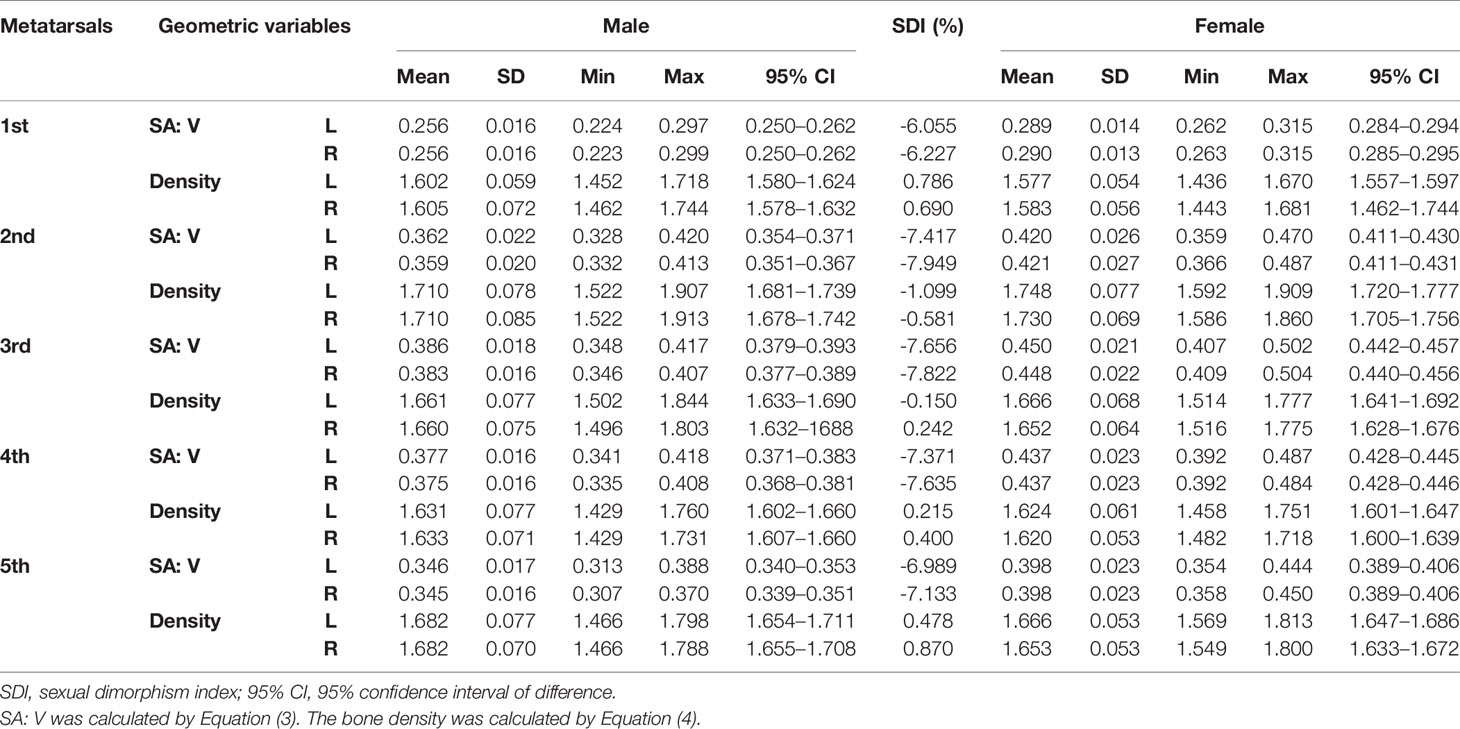
Table 2 Descriptive results of SA: V (mm-1) and bone density (HU/1024) of metatarsal bone in vivo.
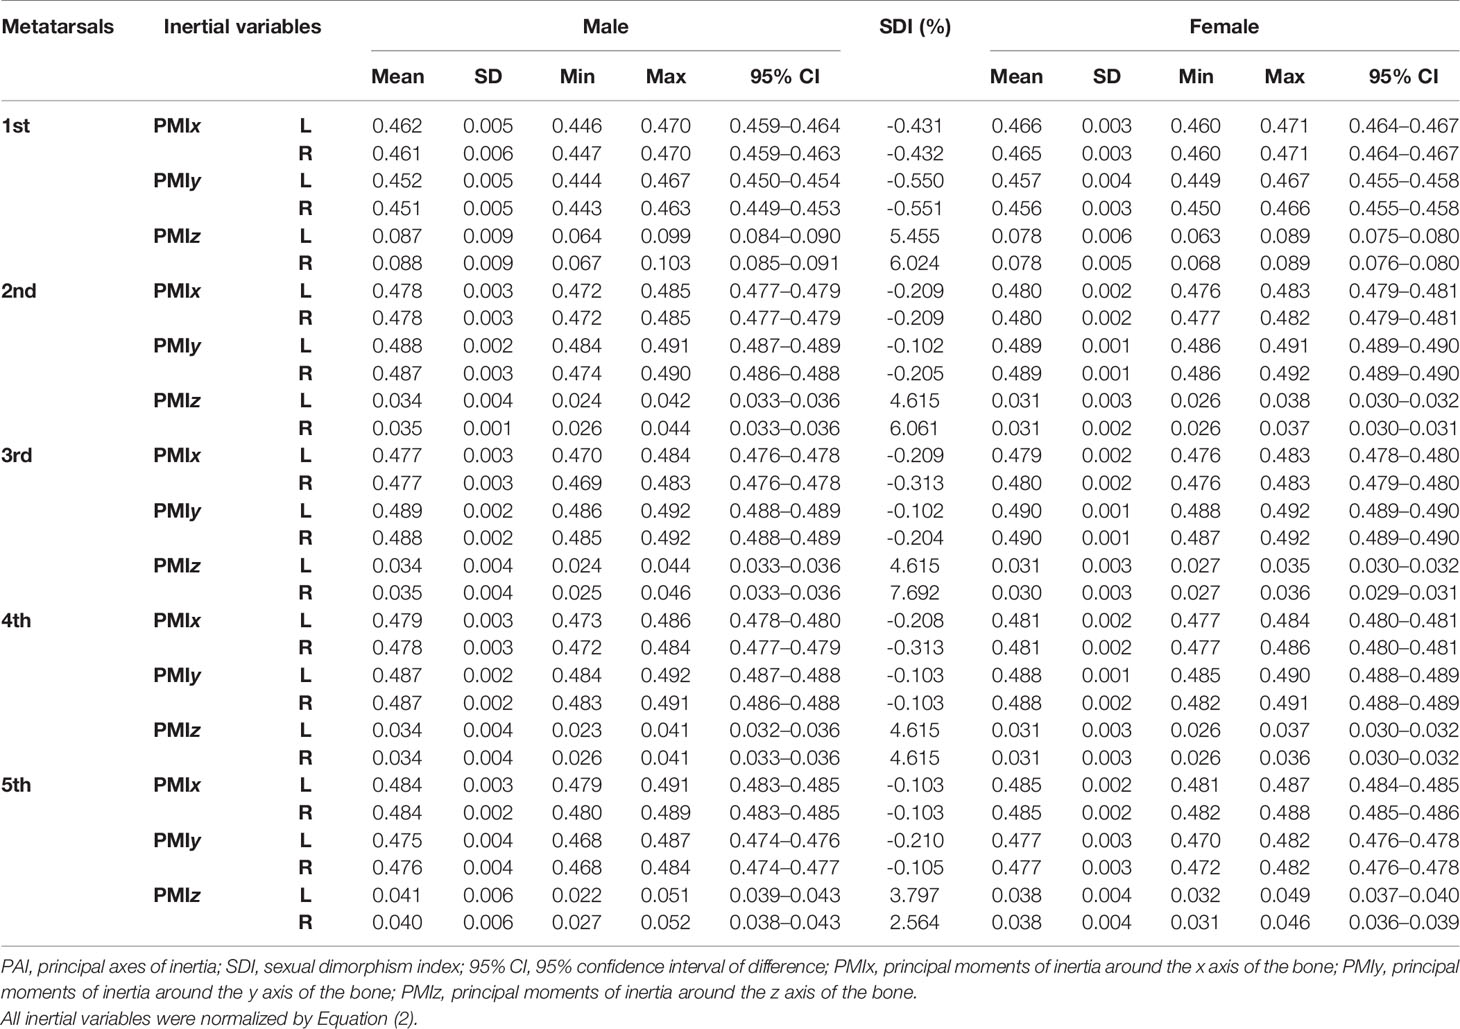
Table 3 Descriptive results of three normalized PMIs of metatarsal bone in vivo based on its PAI.
Tables 4–7 present independent sample t-test and Mann–Whitney U test results of eight variables of both sides of the investigated metatarsal bones between sexes. Highly significant sexual differences were found in SA: V of all metatarsals and in PMIs of the first to fourth metatarsals; in length of the first, third, and fourth metatarsals; in height of the first, fourth, and fifth metatarsals of both sides; and in width of the first metatarsal of the right side (p < 0.01). Sexual differences were found in length of the second and fifth metatarsals, in height of the third metatarsal, and in PMIz of the fifth metatarsal of both sides (p < 0.05). Sexual differences from the left side were found in width of the first metatarsal, in height of the second metatarsal, and in PMIy of the fifth metatarsal (p < 0.05). Significant differences from the right side were found in width of the fourth metatarsal and in PMIx and in bone density of the fifth metatarsal (p < 0.05). The first metatarsal was the most sexually dimorphic of five metatarsals, showing significant sexual differences of all variables except bone density, followed by the third metatarsal with statistical difference in bone height, length, SA: V, and PMIs.
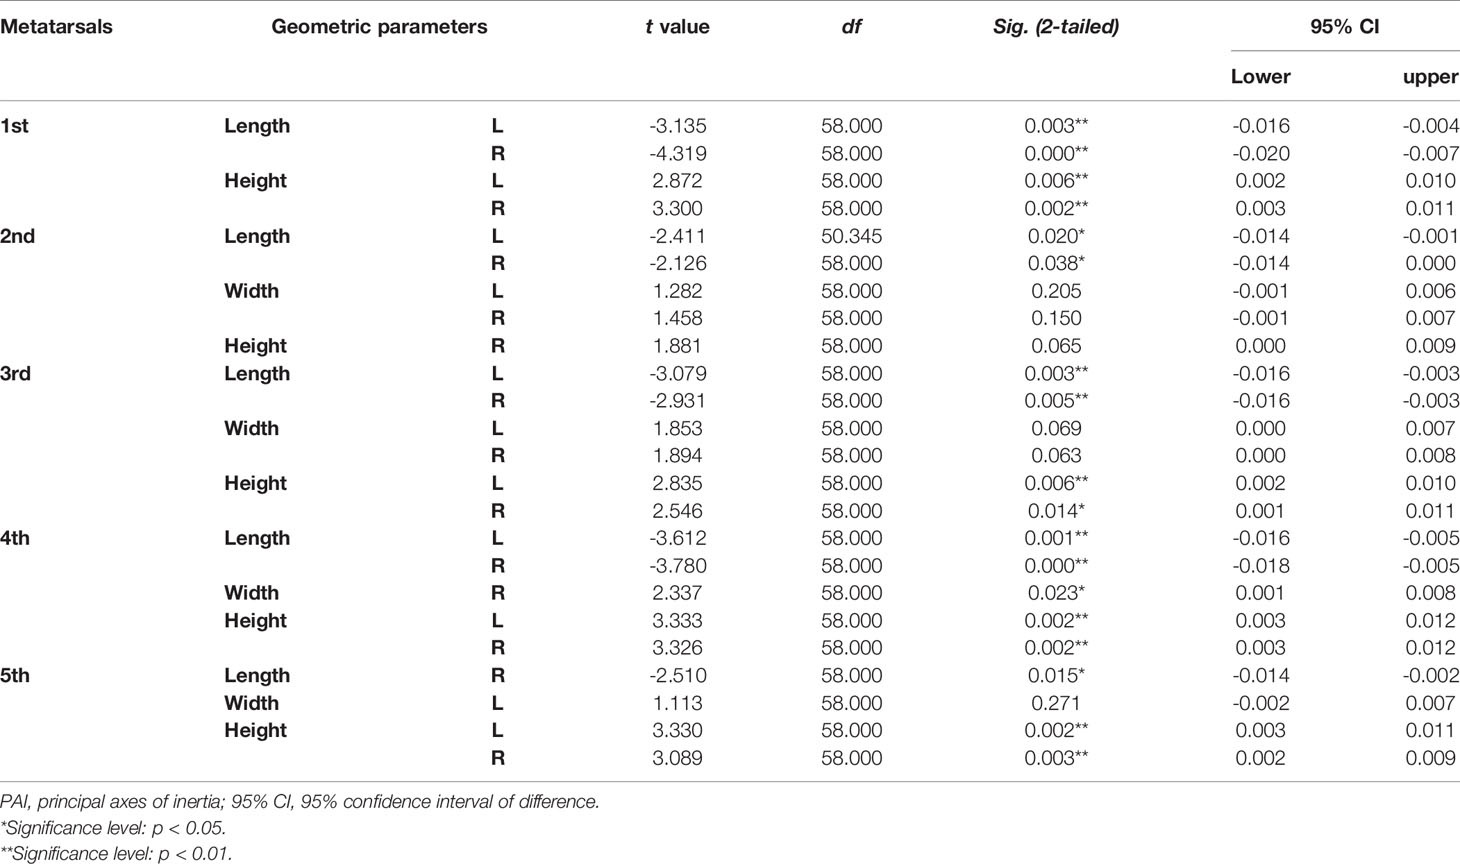
Table 4 Independent sample t-test results of normalized length, width, and height of metatarsal bone in vivo based on its PAI between sexes.
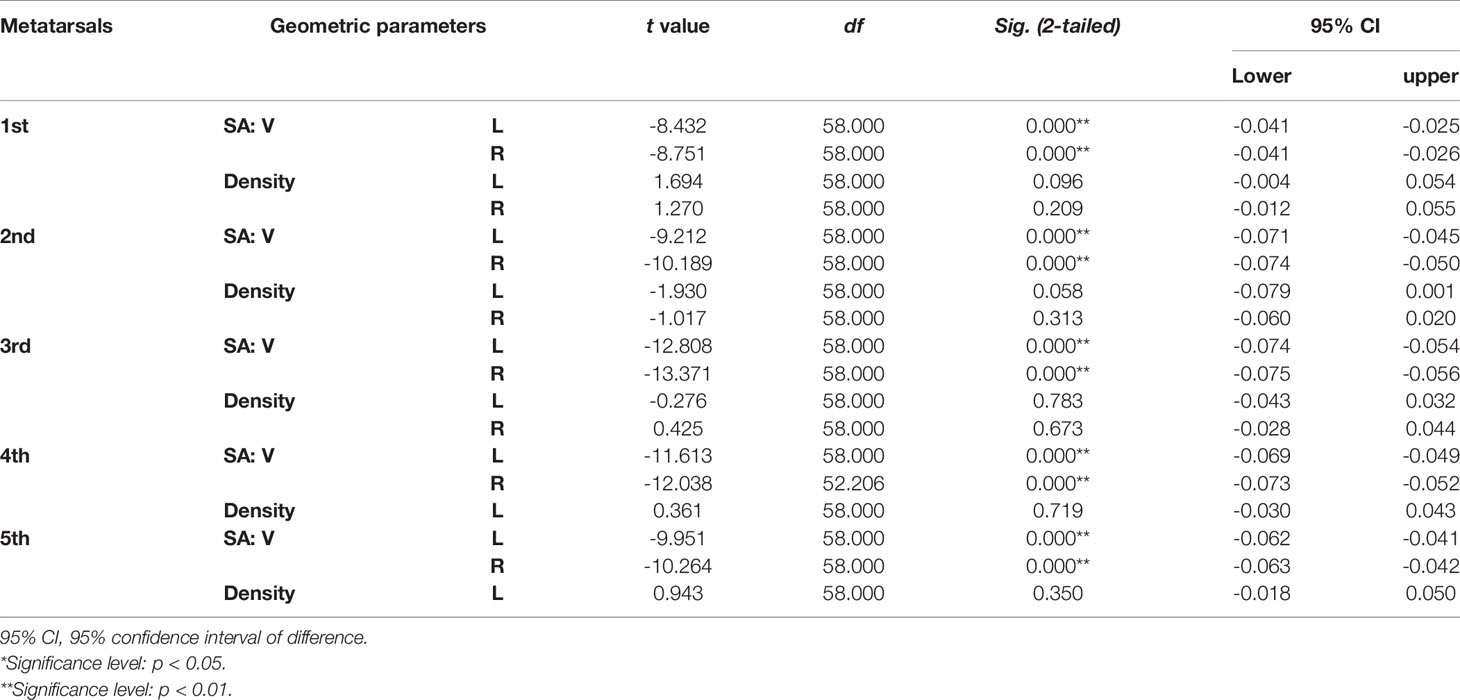
Table 5 Independent sample t-test results of SA: V (mm-1) and bone density (HU/1024) of metatarsal bone in vivo between sexes.
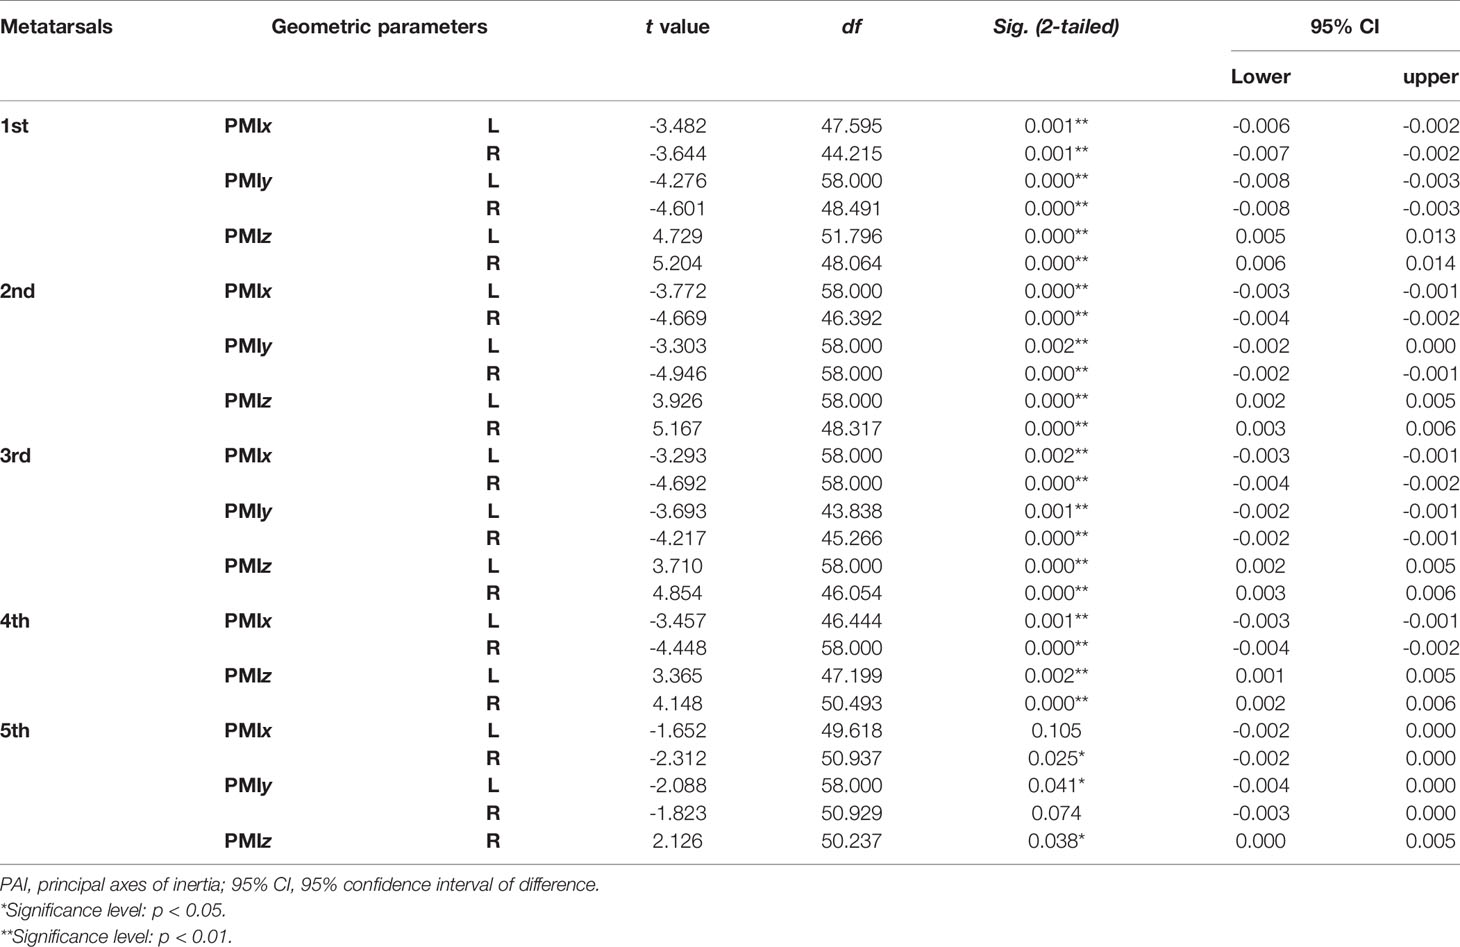
Table 6 Independent sample t-test results of normalized PMIs of metatarsal bone in vivo based on its PAI between sexes.
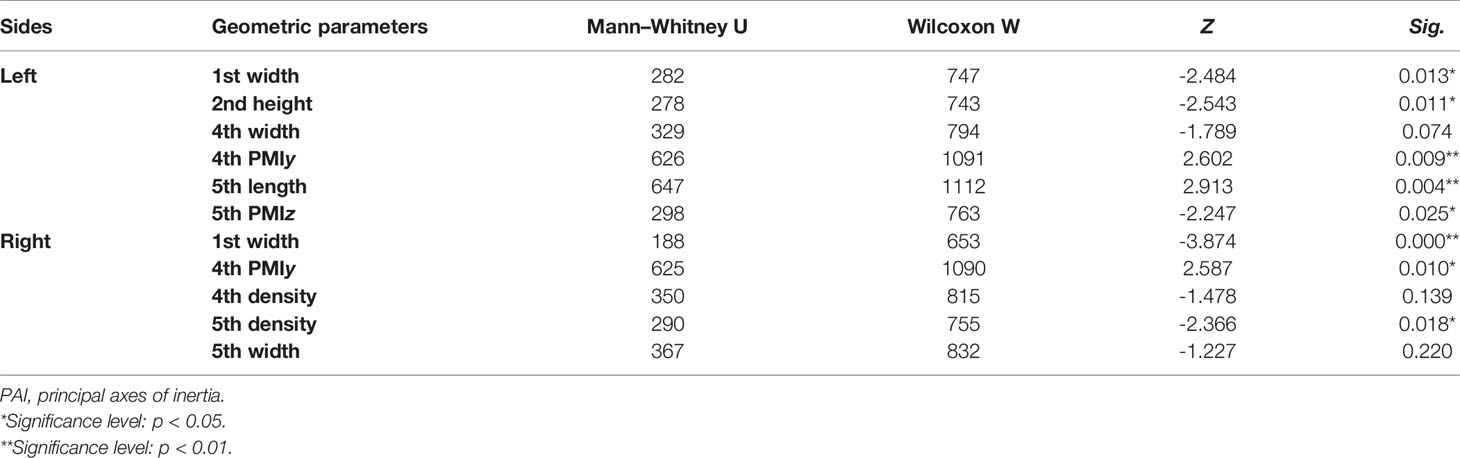
Table 7 Mann-Whitney U test results of variables of metatarsal bone in vivo based on its PAI between sexes.
The subjects’ body height and weight showed low correlations (|rs| < 0.40) with variables except SA: V (0.60 <|rs| < 0.81). Length presented multicollinearity with some variables (|rp| > 0.80), and PMIx, PMIy showed a high correlation with PMIz (|rp| > 0.80) (Supplementary File III; Tables S6–S15). Considering the high SDI and significant sexual difference by the independent t-test, the width, height, PMIz, bone density, and SA: V were selected as independent variables for the SDFA. The probability of variables was more than 0.001, indicating the absence of outlier in the samples. Two multivariate outliers were identified and removed in our study, which were found in the first metatarsal bone of the left and right sides, respectively. The homogeneity of variance matrices was evaluated by Box’s M with p > 0.001 for both sides in our analysis (Supplementary File III; Table S16). The multivariate normality of variables was found in the first metatarsal of the left side and in the second to fourth metatarsals of the right side (Supplementary File III; Table S17). Linearity among five variables was presented in matrix scatter plots (Supplementary File III; Figures S5A, B).
Tables 8A, B describe the SDFA results for sex determination. The results of standardized canonical discriminant coefficients and structure matrix show that SA: V has the highest correlation with discriminant functions and thus contributes most to sex estimation.
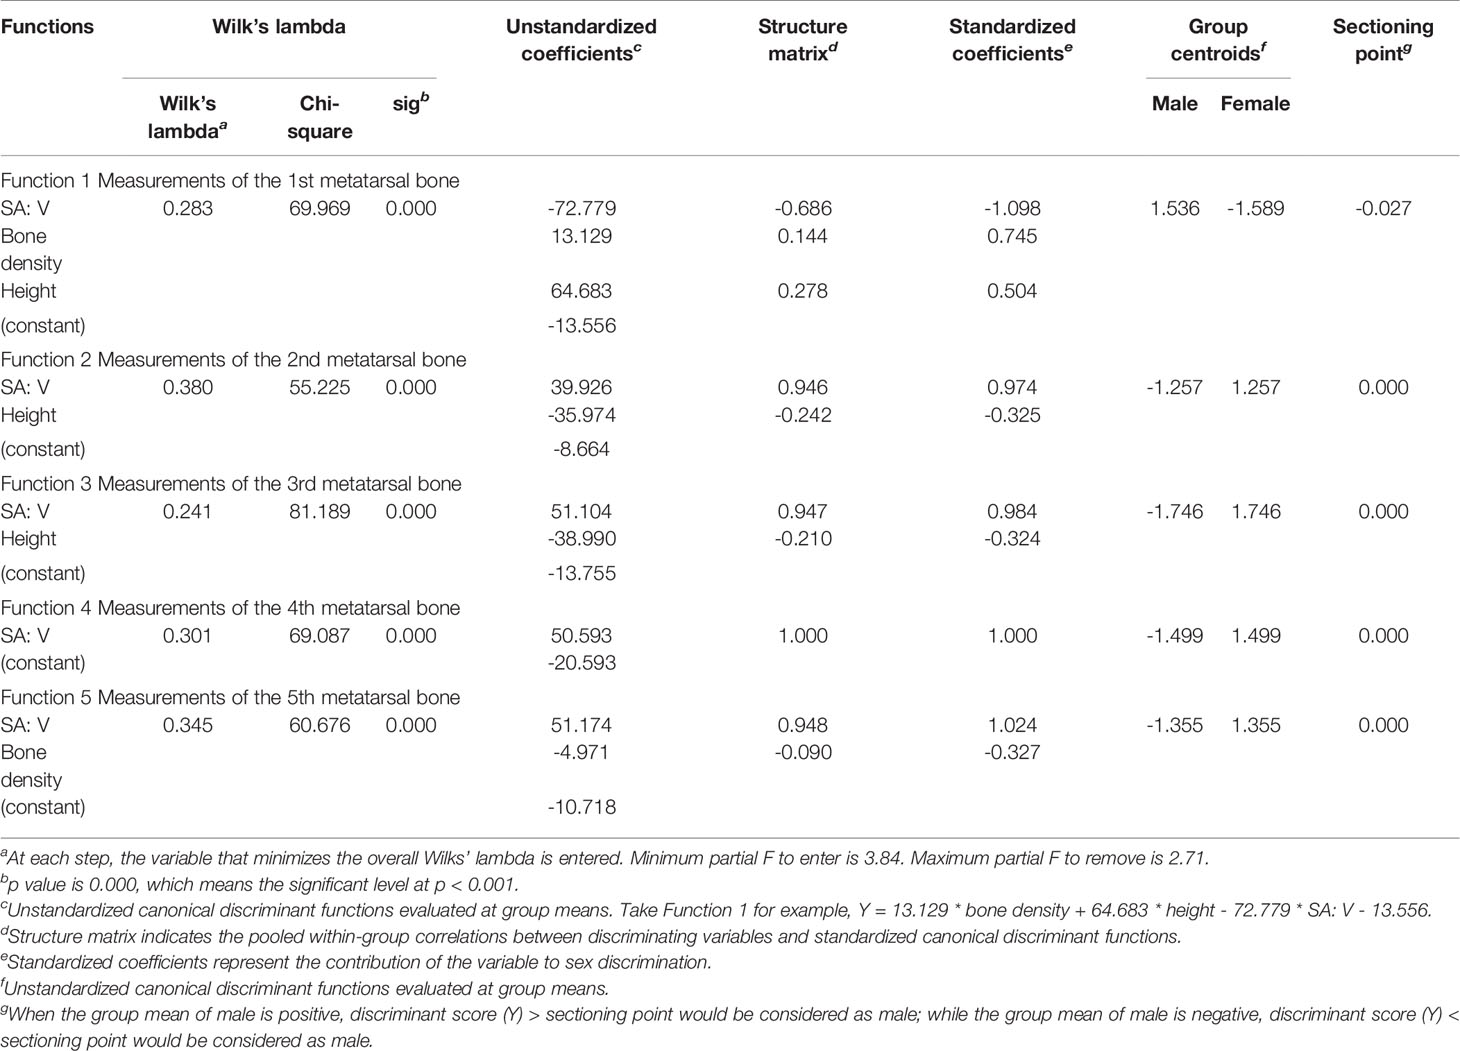
Table 8A Stepwise discriminant function analysis for left metatarsal bone.

Table 8B Stepwise discriminant function analysis for right metatarsal bone.
The accuracies of discriminant functions based on original samples and cross-validated samples are reported in Tables 9A, B. The sex determination accuracies of the original samples were between 88.3% and 98.3% of both sides. Moreover, the percentage of correct classification of cross-validated samples was also between 88.3% and 98.3% of both sides. No significant variance was observed in accuracies between the original samples and the cross-validated samples, revealing the steady predication ability of the discriminant functions. The highest accuracy was found in the third and fourth metatarsal bone of the right side—98.3% in our cases. The accuracy of the right side was slightly higher than that of the left side.
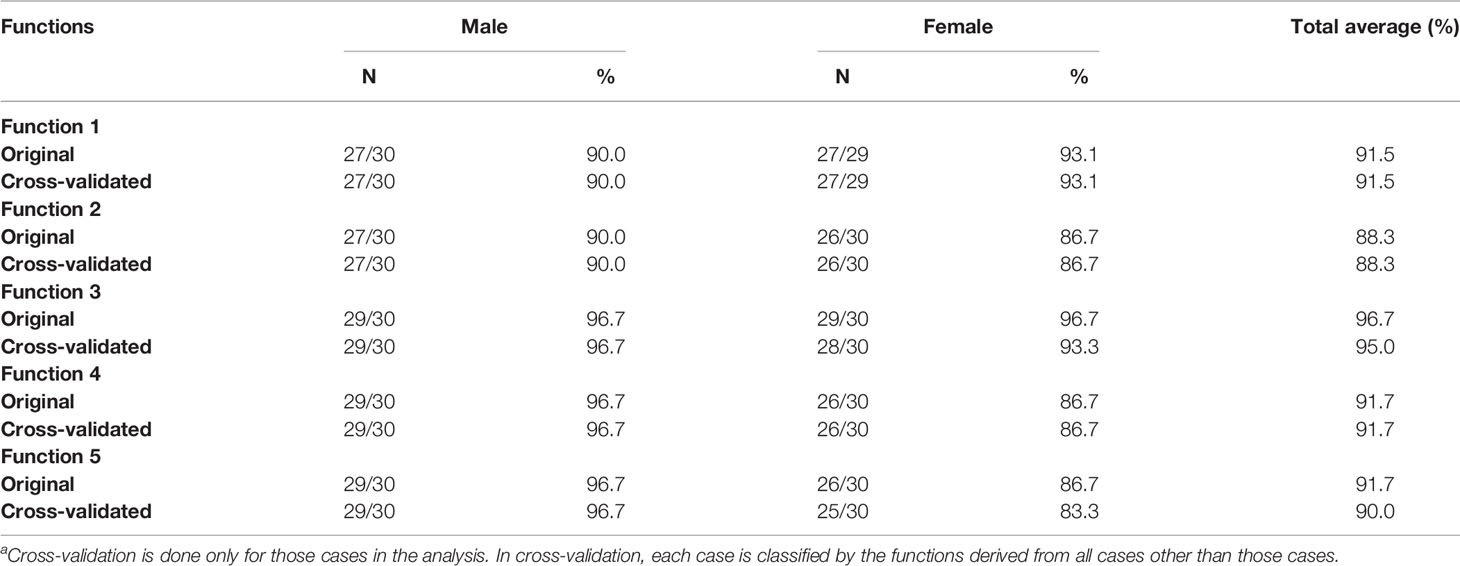
Table 9A Accuracy of classification results of the original and cross-validated samples (left side)a.
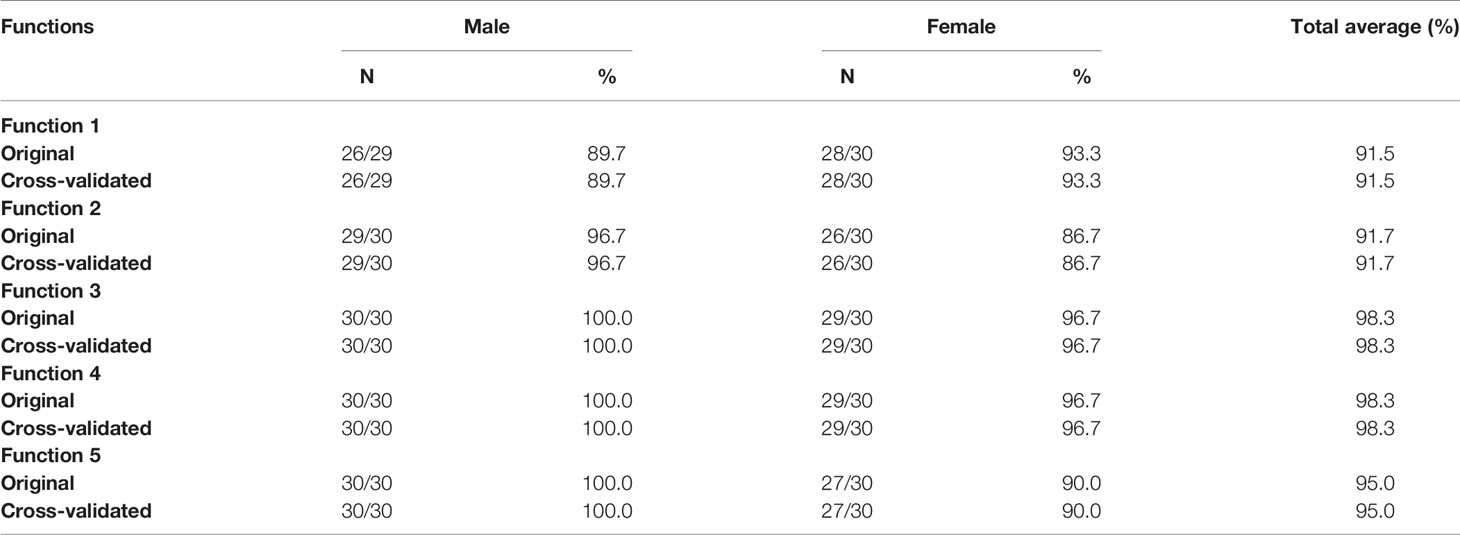
Table 9B Accuracy of classification results of the original and cross-validated samples (right side).
4 Discussion
Parameters such as the voltage, parameter of field of view, and reconstruction settings influence the accuracy of measurements (length, width, height, surface area, and volume) during the 3D reconstruction of bone. The ICC values of bone length, width, and height presented high consistency of metatarsal measurements between two reconstructions while the ICC values of surface area and volume were lower than those of linear measurements. Volume is a higher-order quantity compared to length, width, and height. For example, the ICC value of the side length of a square is 0.91, while that of its volume is 0.75. The ICC value of SA: V was also calculated, and the lowest ICC values rose to 0.93, indicating that SA: V has higher consistency than surface area and volume. Therefore, SA: V instead of surface area and volume was used in this study. Parameters such as field of view and voltage were not set the same in the two scans, which also affected the ICC values of the reconstructed metatarsal measurements. From this view, the ICC values of metatarsals’ measurements between two reconstructions were high, indicating that the reconstructed 3D bone model was precise under these reconstruction parameter settings. It is reasonable to assume that the parameter setting mentioned in Methods generated an accurate reconstruction model.
The sexual dimorphism in the human skeleton system is well studied (10, 39–46). Researchers keep on exploring the potential of bones in sex estimation, for instance, mandible (47), long bones of the upper limb (44, 46, 48), metacarpals and phalanges (45), pelvis (41, 42), tibia (9), metatarsal (19, 49, 50), and proximal foot phalanges (51). The accuracy of sex estimation provided by different parts of the bone varied ranged from 66% to 99%. For metatarsal bone, this study showed for the first time that the SA: V and PMIz of metatarsal bone with significant sexual dimorphism may be successfully implemented for sex estimation. The discriminant accuracy of metatarsal’s geometric and inertial variables of Chinese samples in this study were between 88.3% and 98.3%, which were comparable to the accuracy reported in the Portuguese Caucasian population (83.0%–100.0%) (49), the Greek samples (80.7%–90.1%) (17), the Iranian population (82.6%–86.9%) (50), and the Egyptian population (81.3%–97.5%) (52). The accuracy variation can be found in different populations, indicating that the classification accuracy of metatarsal bone was population-specific. Gibelli et al. reported the superiority of linear measurements over volumetric measurements in sex estimation (19). In our study, the SA: V and PMIz of five metatarsal bones showed greater sexual dimorphism than linear variables and SA: V contributes most to sex estimation. The discriminant function based on SA: V provided 91.7% accuracy (91.7% cross-validated). Studies found that SA: V would decrease with increasing body size as trabeculae became thicker (53–55). In our cases, high and negative correlations (0.60 <|rs| < 0.81) were found between SA: V and body weight as well as between SA: V and body height, indicating that high classification accuracy and significant sexual dimorphism of the SA: V value may arise from the differences in body size between males and females. On the other hand, normalized linear and inertial variables presented low correlations (|rs| < 0.4) with body height and weight, suggesting that normalized bone height and PMIz value were less likely affected by the differences in individuals’ height and weight in sex estimation.
It is known from the natural principles that form follows the function. Loading can significantly modify bone shape and mass, and this influence is long-lasting (56). Bone robusticity is generally considered as an important indicator of the magnitude and nature of the force that acts on the bone, providing information about the habitual behavior of organism (57–59). Some studies reported the sexual differences in robusticity of hand and foot bones (17, 51, 60). In our study, high SDIs of bone height and PMIz may reflect differences in genetics and physical activity level between sexes. In linear measurements, higher SDI values were found in bone height other than in bone width and length, which was consistent with findings of the literature (17, 50). Ruff et al. found that the diaphyseal cross-sectional size changed significantly with the increase of mechanical load (body weight increase) (61). Similar results were discovered by Lieberman et al., reporting a significant change in the diaphyseal cross-sectional geometry of limb bone of sheep after 3 months’ moderate exercise (62). PMI is associated with bone morphology and mass distribution. Significantly higher PMIz values in the male than in female population presumably come as a consequence of the increased physical activities of the male subjects. Namely, tarsals and metatarsals, with ligaments and tendons from the foot arch, could resist impact and maintain stability during walking, running, or jumping. Metatarsals mainly bear the longitudinal pressure from its base to head, which explains the greatest variation in ratio of PMIz values—the load bearing along the z axis has presumably undergone adaptability changes (63). The effect of age on bone dimension and robusticity should be noted. No consensus has been reached. It was found that the subperiosteal diameter increased with age (64–66). However, some studies found that mechanical loads during adulthood had little effect on the external dimensions of long bone diaphysis and the age-related changes in diaphyseal cross-sectional size of bone were not evident (67–70). It may indicate that the diaphyseal cross-sectional properties of bone were mainly affected by physical activity before skeletal maturity (70). The effect of age and mechanical loads on the geometric and inertial characteristics of metatarsal bone needs further in-depth studies of larger sample size of different ethnical/racial groups.
How to best implement the CSI analysis for sex estimation in forensics and archeology can be discussed, but some methodological issues have to be resolved. Firstly, the measurements that differ in the male and female populations should be identified. Those variables may be geometric (length, width, height, SA: V) and inertial (PMIs). The present paper paves the way for sex estimation by introducing the concept of PMI-oriented bone coordinate system normalization. PMIz is the attribute of the rotational movements; it is an analog of the mass of the translational movements. The advantage of the inertial analysis is the evidence that such analysis does not depend on factors such as nutrition and genetics, as is the case for linear variables. It quantitatively assesses the foot bone physical properties, providing more accurate data than qualitatively measured pelvis and cranium or metrical approaches focusing on a single bone element (20, 71). Secondly, the method that yields precise measurements based on 3D models should be determined. The present paper introduces a bone positioning method. The body coordinate system sets COM as the origin, achieving bone location, and sets three PAIs of bone as the body coordinate axes, positioning bone posture to avoid measurement error caused by different scanning positions, which ensures the high accuracy of dimensions along the axis (bone length, width, and height). One additional advantage of this method is that the dimension of bone along the axis can be obtained automatically, reducing the possible error caused by manual measurement.
This study is the continuation of the ongoing scientific efforts to employ virtual 3D reconstruction in determination of individuals’ sex and age (2, 72). Foot bones were chosen purposely due to their wide availability in both archeological and forensic context owing to more resistance to the rigors of time than long bones (18). The accuracy of virtual analysis of the metatarsal bone is proven in a previous investigation that evaluated the efficacy of a radiological method to estimate the individuals’ sex using measurements of the first and second metatarsals of a Portuguese Caucasian population (49).
The high prevalence of metatarsal bones at archeological and forensic sites justifies that the proposed method may be widely applied in archeology and forensics. The wide application of 3D CSI in forensics is constrained because of ethical issues, which also has limited the establishment of populations’ databases. However, the data obtained during routine medical examination may be stored and subsequently employed in forensic analysis. The analysis of metatarsal bones using radiography is rapid and noninvasive. The advantages of 3D CSI forensic analysis include, besides the potential for sex estimation, precise documentation and 3D demonstration of forensic findings for the court, reduction of trauma, and decreased risk of transmission of disease (1). It is interesting to note that the CSI analysis of the fourth metatarsal even allowed the scientists to explain the ground-dwelling biped walking pattern of Australopithecus afarensis dating back to 3.2 million years ago (73).
Some weaknesses of virtopsy-oriented skeletal assessments should be noted though. The quality of the CSI can be affected by many factors, including the scanning posture, error aggregation, resolution, and dose, resulting in the inconsistency in the 3D reconstruction models (74–76). Studies have shown that 3D bone models can achieve high accuracy at the sub-millimeter scale, while increasing the voxel resolution (from 0.3 to 0.15 mm) does not improve the accuracy of the models (77). Our previous study (33) compared the accuracy of 3D bone models reconstructed with different anisotropic voxels (different pixel sizes) and found no significant differences in the linear, volume, and surface area measurements of the models. In particular, the linear measurement values remained highly consistent, indicating that pixel size had no significant influence on model accuracy at the submillimeter scale. Micro CT scanning, providing scans at the few-micron level for small size samples, is commonly used to evaluate the trabecular bone microstructure (78–80). However, the effects of multi-detector CT and micro CT with different resolutions on the accuracy of 3D bone models are still unclear and need to be further studied. The standardization of the body coordinate system of bone is able to avoid the adverse effects arising from different scanning postures, while rating those quantities by percentage could reduce the effect from resolution and dose. The same bone can be reconstructed by a different operator or it can be reconstructed by the same operator for many times, so the parameter setting of the reconstruction process should be taken into consideration when comparing the results of different studies on the CSI analysis of the skeletal tissue. For statistical results, some assumptions were not confirmed, such as multivariate normality of the second to fifth metatarsals of the left side and the first and fifth metatarsals of the right side. The accuracy of formulae based on these metatarsal variables should be treated with caution, although discriminant function analysis is relatively robust against deviations from multivariate normality (81). It should be further highlighted that the accuracy of estimation may be influenced by the characteristics of the selected bone, population, sample size, and age. The promising results (cross-validated accuracy ranges) of this study may in part be driven by the small sample size as well as the same young age-group. The potential future application of this new proposed method for sex determination on unidentified individuals would not be as accurate as suggested in this study. Therefore, the methods should be tested (or independently developed) for distinct population groups, before being widely applied in individuals of unknown population origin (i.e., unidentified skeletons in forensic and bioarcheological contexts).
5 Conclusion
This study demonstrates that sexual dimorphism was found in both metatarsal bones’ geometric and inertial variables. A profound analysis of 60 subjects’ metatarsals revealed that discriminant functions based on geometric and inertial variables of metatarsal bones generated accuracies of 88.3%–98.3% in sex estimation. The ongoing studies are under way to test the potential of the proposed method on the sex determination of archaeological remains and of larger sample size with different population groups.
Data Availability Statement
The raw data supporting the conclusions of this article will be made available by the authors, without undue reservation.
Ethics Statement
The studies involving human participants were reviewed and approved by the Ethical Committee of Fujian Normal University. The patients/participants provided their written informed consent to participate in this study.
Author Contributions
YFF and MD conceived the study. YL, DA, RL, YXF, KD, MM, and GY collected and analyzed the data. YFF, YL, DA, and ZL wrote the manuscript, and all authors revised the final manuscript.
Funding
This study was supported by the National Natural Science Foundation of China (grant numbers 11672075, 11972119), Natural Science Foundation of Fujian Province (grant number 2019J01429), and Ministry of Education, Science and Technological Development of the Republic of Serbia (grant number III 45005).
Conflict of Interest
The authors declare that the research was conducted in the absence of any commercial or financial relationships that could be construed as a potential conflict of interest.
Publisher’s Note
All claims expressed in this article are solely those of the authors and do not necessarily represent those of their affiliated organizations, or those of the publisher, the editors and the reviewers. Any product that may be evaluated in this article, or claim that may be made by its manufacturer, is not guaranteed or endorsed by the publisher.
Acknowledgments
We would like to thank all subjects for their participation in this study and the First Affiliated Hospital of Fujian Medical University for providing Toshiba Aquilion One 320 Slice CT.
Supplementary Material
The Supplementary Material for this article can be found online at: https://www.frontiersin.org/articles/10.3389/fendo.2021.734362/full#supplementary-material
Abbreviations
3D, three-dimensional; CSI, cross-section imaging; HU, Hounsfield units; PMI, principal moment of inertia; PAI, principal axis of inertia; SDI, sexual dimorphism index; ICC, intraclass correlation coefficient; SA: V, surface-area-to-volume ratio; SDFA, stepwise discriminant function analysis.
References
1. Higginbotham-Jones J, Ward A. Forensic Radiology: The Role of Cross-Sectional Imaging in Virtual Post-Mortem Examinations. Radiography (2014) 20(1):87–90. doi: 10.1016/j.radi.2013.10.003
2. Ruder TD, Ampanozi G. Can Cross-Sectional Imaging as an Adjunct and/or Alternative to the Invasive Autopsy be Implemented With the NHS. J Forensic Radiol Imaging (2013) 1:28–9. doi: 10.1016/j.jofri.2012.11.008
3. Bello SM, Verveniotou E, Cornish L, Parfitt SA. 3-Dimensional Microscope Analysis of Bone and Tooth Surface Modifications: Comparisons of Fossil Specimens and Replicas. Scanning (2011) 33(5):316–24. doi: 10.1002/sca.20248
4. Halavi M, Hamilton KA, Parekh R, Ascoli G. Digital Reconstructions of Neuronal Morphology: Three Decades of Research Trends. Front Neurosci (2012) 6:49. doi: 10.3389/fnins.2012.00049
5. Yang S, Yang Z, Fischer K, Zhong K, Stadler J, Godenschweger F, et al. Integration of Ultra-High Field MRI and Histology for Connectome Based Research of Brain Disorders. Front Neuroanat (2013) 7:31. doi: 10.3389/fnana.2013.00031
6. Hishmat AM, Michiue T, Sogawa N, Oritani S, Ishikawa T, Fawzy IA, et al. Virtual CT Morphometry of Lower Limb Long Bones for Estimation of the Sex and Stature Using Postmortem Japanese Adult Data in Forensic Identification. Int J Legal Med (2015) 129(5):1173–82. doi: 10.1007/s00414-015-1228-9
7. Miranker M. A Comparison of Different Age Estimation Methods of the Adult Pelvis. J Forensic Sci (2016) 61(5):1173–79. doi: 10.1111/1556-4029.13130
8. Teke HY, Ünlütürk Ö, Günaydin E, Duran S, Özsoy S. Determining Gender by Taking Measurements From Magnetic Resonance Images of the Patella. J Forensic Leg Med (2018) 58:87–92. doi: 10.1016/j.jflm.2018.05.002
9. İşcan MY, Miller-Shaivitz P. Determination of Sex From the Tibia. Am J Phys Anthropol (1984) 64(1):53–7. doi: 10.1002/ajpa.1330640104
10. Dittrick J, Suchey JM. Sex Determination of Prehistoric Central California Skeletal Remains Using Discriminant Analysis of the Femur and Humerus. Am J Phys Anthropol (1986) 70(1):3–9. doi: 10.1002/ajpa.1330700103
11. Djukic K, Zelic K, Milenkovic P, Nedeljkovic N, Djuric M. Dental Age Assessment Validity of Radiographic Methods on Serbian Children Population. Forensic Sci Int (2013) 231(1–3):398. e1–5. doi: 10.1016/j.forsciint.2013.05.036
12. Passalacqua NV, Zhang Z, Pierce SJ. Sex Determination of Human Skeletal Populations Using Latent Profile Analysis. Am J Phys Anthropol (2013) 151(4):538–43. doi: 10.1002/ajpa.22295
13. Rutty GN, Brough A, Biggs MJP, Robinson C, Lawes SDA, Hainsworth SV. The Role of Micro-Computed Tomography in Forensic Investigations. Forensic Sci Int (2013) 225(1–3):60–6. doi: 10.1016/j.forsciint.2012.10.030
14. Rich J, Dean DE, Cheung YY. Forensic Implications of the Foot and Ankle. J Foot Ankle Surg (2003) 42(4):221–5. doi: 10.1016/S1067-2516(03)70032-5
15. Zeybek G, Ergur I, Demiroglu Z. Stature and Gender Estimation Using Foot Measurements. Forensic Sci Int (2008) 181(1–3):54. e1–5. doi: 10.1016/j.forsciint.2008.08.003
16. Johnstone-Belford E, Flavel A, Franklin D. Morphoscopic Observations in Clinical Pelvic MDCT Scans: Assessing the Accuracy of the Phenice Traits for Sex Estimation in a Western Australian Population. J Forensic Radiol Imaging (2018) 12(1–3):5–10. doi: 10.1016/j.jofri.2018.02.003
17. Mountrakis C, Eliopoulos C, Koilias CG, Manolis SK. Sex Determination Using Metatarsal Osteometrics From the Athens Collection. Forensic Sci Int (2010) 200(1–3):178.e1–7. doi: 10.1016/j.forsciint.2010.03.041
18. Byers S, Akoshima K, Curran B. Determination of Adult Stature From Metatarsal Length. Am J Phys Anthropol (1989) 79(3):275–9. doi: 10.1002/ajpa.1330790303
19. Gibelli D, Poppa P, Cummaudo M, Mattia M, Cappella A, Mazzarelli D, et al. Sex Assessment From the Volume of the First Metatarsal Bone: A Comparison of Linear and Volume Measurements. J Forensic Sci (2017) 62(6):1582–5. doi: 10.1111/1556-4029.13464
20. Kitashiro M, Ogihara N, Kokubo T, Matsumoto M, Nakamura M, Nagura T. Age-and Sex-Associated Morphological Variations of Metatarsal Torsional Patterns in Humans. Clin Anat (2017) 30(8):1058–63. doi: 10.1002/ca.22944
21. Alaeddini R, Walsh SJ, Abbas A. Forensic Implications of Genetic Analyses From Degraded DNA—a Review. Forensic Sci Int Genet (2010) 4(3):148–57. doi: 10.1016/j.fsigen.2009.09.007
22. Latham KE, Miller JJ. DNA Recovery and Analysis From Skeletal Material in Modern Forensic Contexts. Forensic Sci Res (2019) 4(1):51–9. doi: 10.1080/20961790.2018.1515594
23. Stone AC, Milner GR, Pääbo S, Stoneking M. Sex Determination of Ancient Human Skeletons Using DNA. Am J Phys Anthropol (1996) 99(2):231–8. doi: 10.1002/(SICI)1096-8644(199602)99:2<231::AID-AJPA1>3.0.CO;2-1
24. Masuyama K, Shojo H, Nakanishi H, Inokuchi S, Adachi N. Sex Determination From Fragmented and Degenerated DNA by Amplified Product-Length Polymorphism Bidirectional SNP Analysis of Amelogenin and SRY Genes. PloS One (2017) 12(1):e0169348. doi: 10.1371/journal.pone.0169348
25. Tekeli E, Gültekin T, Doksanaltı ME, Öztaner SH, Elma C. Accurate Sex Determination Using Ancient DNA Analysis for Human Skeletal Remains From Different Historical Archeological Sites in Turkey. Mediterr Archaeol Archaeom (2020) 20(1):93–106. doi: 10.5281/zenodo.3605672
26. Geigl E-M. On the Circumstances Surrounding the Preservation and Analysis of Very Old DNA. Archaeometry (2002) 44(3):337–42. doi: 10.1111/1475-4754.t01-1-00066
27. Latham KE, Madonna ME. DNA Survivability in Skeletal Remains. In: Pokines JT, Symes SA, editors. Manual of Forensic Taphonomy. Boca Raton, FL: CRC Press (2013). p. 403–26.
28. Dutta P, Bhosale S, Singh R, Gubrellay P, Patil J, Sehdev B, et al. Amelogenin Gene-the Pioneer in Gender Determination From Forensic Dental Samples. J Clin Diagn Res (2017) 11(2):ZC56. doi: 10.7860/JCDR/2017/22183.9407
29. Spoor CF, Zonneveld FW, Macho GA. Linear Measurements of Cortical Bone and Dental Enamel by Computed Tomography: Applications and Problems. Am J Phys Anthropol (1993) 91(4):469–84. doi: 10.1002/ajpa.1330910405
30. Coleman MN, Colbert MW. CT Thresholding Protocols for Taking Measurements on Three-Dimensional Models. Am J Phys Anthropol (2007) 133(1):723–5. doi: 10.1002/ajpa.20583
31. Loubele M, Maes F, Schutyser F, Marchal G, Jacobs R, Suetens P. Assessment of Bone Segmentation Quality of Cone-Beam CT Versus Multislice Spiral CT: A Pilot Study. Oral Surg Oral Med Oral Pathol Oral Radiol Endod (2006) 102(2):225–34. doi: 10.1016/j.tripleo.2005.10.039
32. Mah P, Reeves TE, McDavid WD. Deriving Hounsfield Units Using Grey Levels in Cone Beam Computed Tomography. Dentomaxillofac Radiol (2010) 39(6):323–35. doi: 10.1259/dmfr/19603304
33. Liu Y, Li R, Fan Y, Antonijević Ð, Milenković P, Li Z, et al. The Influence of Anisotropic Voxel Caused by Field of View Setting on the Accuracy of Three-Dimensional Reconstruction of Bone Geometric Models. AIP Adv (2018) 8(8):085111. doi: 10.1063/1.5041990
34. Tarli SB, Repetto E. Methodological Considerations on the Study of Sexual Dimorphism in Past Human Populations. Hum Evol (1986) 1(1):51–66. doi: 10.1007/BF02437285
35. Mukaka MM. A Guide to Appropriate Use of Correlation Coefficient in Medical Research. Malawi Med J (2012) 24(3):69–71. doi: 10.4314/mmj.v24i3
36. Mardia KV. Measures of Multivariate Skewness and Kurtosis With Applications. Biometrika (1970) 57(3):519–30. doi: 10.1093/biomet/57.3.519
37. Tabachnick BG, Fidell LS. Using Multivariate Statistics. 6th. Boston, MA: Pearson (2013) p. 285–354.
38. Kumari SS. Multicollinearity: Estimation and Elimination. J Contemp Res Manag (2008) 3(1):87–95.
39. Frayer DW, Wolpoff MH. Sexual Dimorphism. Annu Rev Anthropol (1985) 14(1):429–73. doi: 10.1146/annurev.an.14.100185.002241
40. Ruff C. Sexual Dimorphism in Human Lower Limb Bone Structure: Relationship to Subsistence Strategy and Sexual Division of Labor. J Hum Evol (1987) 16(5):391–416. doi: 10.1016/0047-2484(87)90069-8
41. Arsuaga JL, Carretero JM. Multivariate Analysis of the Sexual Dimorphism of the Hip Bone in a Modern Human Population and in Early Hominids. Am J Phys Anthropol (1994) 93(2):241–57. doi: 10.1002/ajpa.1330930208
42. Bruzek J. A Method for Visual Determination of Sex, Using the Human Hip Bone. Am J Phys Anthropol (2002) 117(2):157–68. doi: 10.1002/ajpa.10012
43. Case DT, Ross AH. Sex Determination From Hand and Foot Bone Lengths. J Forensic Sci (2007) 52(2):264–70. doi: 10.1111/j.1556-4029.2006.00365.x
44. Charisi D, Eliopoulos C, Vanna V, Koilias CG, Manolis SK. Sexual Dimorphism of the Arm Bones in a Modern Greek Population. J Forensic Sci (2011) 56(1):10–8. doi: 10.1111/j.1556-4029.2010.01538.x
45. Alabi AS, Aigbogun EO, Lemuel AM, Buhari MB. Sex Estimation From Radiogrametric Linear Dimensions of the Metacarpals and Phalanges in a Nigerian Population. Forensic Sci Int Rep (2020) 2:100097. doi: 10.1016/j.fsir.2020.100097
46. Bidmos MA, Mazengenya P. Accuracies of Discriminant Function Equations for Sex Estimation Using Long Bones of Upper Extremities. Int J Legal Med (2021) 135(3):1095–102. doi: 10.1007/s00414-020-02458-y
47. Loth SR, Henneberg M. Mandibular Ramus Flexure: A New Morphologic Indicator of Sexual Dimorphism in the Human Skeleton. Am J Phys Anthropol (1996) 99(3):473–85. doi: 10.1002/(SICI)1096-8644(199603)99:3<473::AID-AJPA8>3.0.CO;2-X
48. Zapico SC, Adserias-Garriga J. Estimation of Sex Based on Postcranial Elements in European American and Latin American Populations. J Forensic Leg Med (2021) 77:102098. doi: 10.1016/j.jflm.2020.102098
49. Robling AG, Ubelaker DH. Sex Estimation From the Metatarsals. J Forensic Sci (1997) 42(6):1062–9. doi: 10.1520/JFS14261J
50. Akhlaghi M, Bakhtavar K, Bakhshandeh H, Mokhtari T, Farahani MV, Parsa VA, et al. Sex Determination Based on Radiographic Examination of Metatarsal Bones in Iranian Population. Int J Med Toxicol Forensic Med (2017) 7(4):203–8. doi: 10.22037/ijmtfm.v7i4(Autumn).17059
51. Karakostis FA, Zorba E, Moraitis K. Osteometric Sex Determination Using Proximal Foot Phalanges From a Documented Human Skeletal Collection. Anthropol Anz (2014) 71(4):403–27. doi: 10.1127/0003-5548/2014/0423
52. Moneim WMA, Hady RHA, Maaboud RMA, Fathy HM, Hamed AM. Identification of Sex Depending on Radiological Examination of Foot and Patella. Am J Forensic Med Pathol (2008) 29(2):136–40. doi: 10.1097/PAF.0b013e318173f048
53. Swartz SM, Parker A, Huo C. Theoretical and Empirical Scaling Patterns and Topological Homology in Bone Trabeculae. J Exp Biol (1998) 201(4):573–90. doi: 10.1242/jeb.201.4.573
54. Doube M, Kłosowski MM, Wiktorowicz-Conroy AM, Hutchinson JR, Shefelbine SJ. Trabecular Bone Scales Allometrically in Mammals and Birds. Proc R Soc B Biol Sci (2011) 278(1721):3067–73. doi: 10.1098/rspb.2011.0069
55. Ryan TM, Shaw CN. Trabecular Bone Microstructure Scales Allometrically in the Primate Humerus and Femur. Proc R Soc B Biol Sci (2013) 280(1758):20130172. doi: 10.1098/rspb.2013.0172
56. Javaheri B, Razi H, Gohin S, Wylie S, Chang Y-M, Salmon P, et al. Lasting Organ-Level Bone Mechanoadaptation is Unrelated to Local Strain. Sci Adv (2020) 6(10):eaax8301. doi: 10.1126/sciadv.aax8301
57. Trinkaus E, Churchill SE, Ruff CB, Vandermeersch B. Long Bone Shaft Robusticity and Body Proportions of the Saint-Césaire 1 Châtelperronian Neanderthal. J Archaeol Sci (1999) 26(7):753–73. doi: 10.1006/jasc.1998.0345
58. Stock JT. Hunter-Gatherer Postcranial Robusticity Relative to Patterns of Mobility, Climatic Adaptation, and Selection for Tissue Economy. Am J Phys Anthropol (2006) 131(2):194–204. doi: 10.1002/ajpa.20398
59. Ruff C. Relative Limb Strength and Locomotion in Homo Habilis. Am J Phys Anthropol (2009) 138(1):90–100. doi: 10.1002/ajpa.20907
60. Karakostis FA, Zorba E, Moraitis K. Sex Determination Using Proximal Hand Phalanges. Pap Anthropol (2015) 24(2):37–56. doi: 10.12697/poa.2015.24.2.04
61. Ruff CB, Scott WW, Liu AY-C. Articular and Diaphyseal Remodeling of the Proximal Femur With Changes in Body Mass in Adults. Am J Phys Anthropol (1991) 86(3):397–413. doi: 10.1002/ajpa.1330860306
62. Lieberman DE, Devlin MJ, Pearson OM. Articular Area Responses to Mechanical Loading: Effects of Exercise, Age, and Skeletal Location. Am J Phys Anthropol (2001) 116(4):266–77. doi: 10.1002/ajpa.1123
63. Ker RF, Bennett MB, Bibby SR, Kester RC, Alexander RM. The Spring in the Arch of the Human Foot. Nature (1987) 325(6100):147–9. doi: 10.1038/325147a0
64. Smith RW, Walker RR. Femoral Expansion in Aging Women: Implications for Osteoporosis and Fractures. Science (1964) 145(3628):156–7. doi: 10.1126/science.145.3628.156
65. Ruff CB, Hayes WC. Subperiosteal Expansion and Cortical Remodeling of the Human Femur and Tibia With Aging. Science (1982) 217(4563):945–8. doi: 10.1126/science.7112107
66. Stein MS, Thomas CDL, Feik SA, Wark JD, Clement JG. Bone Size and Mechanics at the Femoral Diaphysis Across Age and Sex. J Biomech (1998) 31(12):1101–10. doi: 10.1016/S0021-9290(98)00127-4
67. Ruff CB, Walker A, Trinkaus E. Postcranial Robusticity in Homo. III: Ontogeny. Am J Phys Anthropol (1994) 93(1):35–54. doi: 10.1002/ajpa.1330930103
68. Trinkaus E, Churchill SE, Ruff CB. Postcranial Robusticity in Homo. II: Humeral Bilateral Asymmetry and Bone Plasticity. Am J Phys Anthropol (1994) 93(1):1–34. doi: 10.1002/ajpa.1330930102
69. Niinimäki S. The Relationship Between Musculoskeletal Stress Markers and Biomechanical Properties of the Humeral Diaphysis. Am J Phys Anthropol (2012) 147(4):618–28. doi: 10.1002/ajpa.22023
70. Myszka A, Piontek J. The Effect of Age on External Bone Morphology Properties in Adults. Anthropol 1962- (2013) 51(3):409–20.
71. Peckmann TR, Orr K, Meek S, Manolis SK. Sex Determination From the Talus in a Contemporary Greek Population Using Discriminant Function Analysis. J Forensic Leg Med (2015) 33:14–9. doi: 10.1016/j.jflm.2015.03.011
72. Rodríguez S, González A, Simón A, Rodríguez-Calvo MS, Febrero-Bande M, Cordeiro C, et al. The Use of Computerized Tomography in Determining Stature and Sex From Metatarsal Bones. Leg Med (2014) 16(5):252–7. doi: 10.1016/j.legalmed.2014.05.006
73. Ward CV, Kimbel WH, Johanson DC. Complete Fourth Metatarsal and Arches in the Foot of Australopithecus Afarensis. Science (2011) 331(6018):750–3. doi: 10.1126/science.1201463
74. Kubota Y, Hatada S, Kawaguchi Y. Important Factors for the Three-Dimensional Reconstruction of Neuronal Structures From Serial Ultrathin Sections. Front Neural Circuits (2009) 3:4.2009. doi: 10.3389/neuro.04.004.2009
75. Yu W, Zeng L. Iterative Image Reconstruction for Limited-Angle Inverse Helical Cone-Beam Computed Tomography. Scanning (2016) 38(1):4–13. doi: 10.1002/sca.21235
76. Michaeli JG, DeGroff MC, Roxas RC. Error Aggregation in the Reengineering Process From 3D Scanning to Printing. Scanning (2017) 2017:1218541. doi: 10.1155/2017/1218541
77. Sang Y-H, Hu H-C, Lu S-H, Wu Y-W, Li W-R, Tang Z-H. Accuracy Assessment of Three-Dimensional Surface Reconstructions of In Vivo Teeth From Cone-Beam Computed Tomography. Chin Med J (Engl) (2016) 129(12):1464. doi: 10.4103/0366-6999.183430
78. Jiang Y, Zhao J, Liao E-Y, Dai R-C, Wu X-P, Genant HK. Application of Micro-CT Assessment of 3-D Bone Microstructure in Preclinical and Clinical Studies. J Bone Miner Metab (2005) 23(1):122–31. doi: 10.1007/BF03026336
79. Bouxsein ML, Boyd SK, Christiansen BA, Guldberg RE, Jepsen KJ, Müller R. Guidelines for Assessment of Bone Microstructure in Rodents Using Micro–Computed Tomography. J Bone Miner Res (2010) 25(7):1468–86. doi: 10.1002/jbmr.141
80. Christiansen BA. Effect of Micro-Computed Tomography Voxel Size and Segmentation Method on Trabecular Bone Microstructure Measures in Mice. Bone Rep (2016) 5:136–40. doi: 10.1016/j.bonr.2016.05.006
Keywords: metatarsal, cross section, 3D reconstruction, principal moments of inertia, sex determination
Citation: Liu Y, Antonijević D, Li R, Fan Y, Dukić K, Mićić M, Yu G, Li Z, Djurić M and Fan Y (2021) Study of Sexual Dimorphism in Metatarsal Bones: Geometric and Inertial Analysis of the Three-Dimensional Reconstructed Models. Front. Endocrinol. 12:734362. doi: 10.3389/fendo.2021.734362
Received: 03 July 2021; Accepted: 21 September 2021;
Published: 14 October 2021.
Edited by:
Melissa Orlandin Premaor, Federal University of Minas Gerais, BrazilReviewed by:
Fotios Alexandros Karakostis, University of Tübingen, GermanyRoman Thaler, Mayo Clinic, United States
Copyright © 2021 Liu, Antonijević, Li, Fan, Dukić, Mićić, Yu, Li, Djurić and Fan. This is an open-access article distributed under the terms of the Creative Commons Attribution License (CC BY). The use, distribution or reproduction in other forums is permitted, provided the original author(s) and the copyright owner(s) are credited and that the original publication in this journal is cited, in accordance with accepted academic practice. No use, distribution or reproduction is permitted which does not comply with these terms.
*Correspondence: Yifang Fan, dGZ5ZkBmam51LmVkdS5jbg==; cHJvZmVnekAxMjYuY29t