 Tingting Che1
 Zhongming Wu
- 1NHC Key Laboratory of Hormones and Development, Tianjin Key Laboratory of Metabolic Diseases, Chu Hsien-I Memorial Hospital & Tianjin Institute of Endocrinology, Tianjin Medical University, Tianjin, China
- 2Department of Neurology, Chu Hsien-I Memorial Hospital, Tianjin Medical University, Tianjin, China
Purpose: Sleep duration is thought to play a key role in the development of metabolic syndrome. However, the results have been inconsistent.
Methods: We conducted a systematic review and meta-analysis of cohort studies and searched publications in PubMed, Embase, Cochrane Central Register of Controlled Trials, and Clinicaltrials.gov. The summary relative risks (RRs) were estimated using a random model. The sensitivity analysis was performed by sequentially excluding each study to test the robustness of the pooled estimates.
Finding: We included 13 studies involving 300,202 patients in which short sleep and long sleep significantly increased the risk of metabolic syndrome 15% (RR = 1.15, 95%CI = 1.09-1.22, p < 0.001) and 19% (RR = 1.19, 95%CI = 1.05-1.35, p < 0.001). Moreover, the relationship between sleep duration and metabolic syndrome risk presented a U-shaped curve. Short and long sleep increased the risk of obesity by 14% (RR = 1.14, 95%CI = 1.07-1.22, p<0.001) and 15% (RR = 1.15, 95%CI = 1.00-1.30, p = 0.04), and high blood pressure 16% (RR = 1.16, 95%CI = 1.02-1.31, p = 0.03) and 13% (RR = 1.13, 95%CI = 1.04-1.24, p = 0.01), respectively. Short sleep can potentially increase the risk of high blood sugar by 12% (RR = 1.12, 95%CI = 1.00-1.15, P = 0.05).
Implications: Based on our findings, sleep is a behavior that can be changed and is economical. Clinically doctors and health professionals should be encouraged to increase their efforts to promote healthy sleep for all people.
1 Introduction
Metabolic syndrome (MS) is a collection of metabolic disorders, including obesity, hypertension, hypertriglyceridemia, low high-density lipoprotein (HDL) cholesterol, and hyperglycemia. Prevalence of MS ranges from 20 to 45%, and the incidence of MS is projected to increase to approximately 53% by 2035 (1). The syndrome leads to adverse cardiovascular events (2) and the spread of diseases such as cancer (3). The total cost of these diseases, including the potential loss of health care and economic activity, places a significant financial burden on patients and health systems (4). Therefore, it is important to identify modifiable risk factors for MS (5).
Recently, the relationship between sleep and metabolic syndrome has attracted wide attention. Epidemiological evidence has reported the relationship between sleep duration and MS. However, the information published was not consistent (6–8). Ju (6) included 11 cross-sectional studies and three cohort studies and concluded that both short sleep and long sleep are risky behaviors that increase the risk of metabolic syndrome. Another meta-analysis, consisting of 10 cross-sectional studies and two cohort studies, concluded that short sleep duration was associated with metabolic syndrome development, while long sleep duration was not (7). The final meta-analysis, which included 18 cross-sectional studies, found a dose-response relationship between short sleep duration and metabolic syndrome. However, it does not support the idea that long sleep is associated with metabolic syndrome (8). Summing up previous meta-analyses, it can be found that short sleep is associated with an increased risk of MS, but the relationship between long sleep and MS risk is still controversial.
Wang (9) found a U-shaped relationship between sleep duration and the risk of hypertension. Shan (10) reported a U-shaped relationship between sleep duration and the risk of diabetes. Hypertension and diabetes are components of metabolic syndrome. Therefore, we hypothesize that a U-shaped relationship between sleep duration and the risk of metabolic syndrome exists as well. At the same time, we found that many cohort studies on sleep duration and metabolic syndrome have emerged in recent years. Given that cohort studies possess a higher level of evidence and can also draw causal inferences, we mainly included the latest cohort studies for our meta-analysis.
2 Methods
2.1 Literature and Search Strategy
We searched four databases (PubMed, Embase, Cochrane Central Register of Controlled Trials, and Clinicaltrials.gov) for reports relating to sleep and MS. The combination of two sets of keywords and exploded controlled vocabulary terms is showed in Table S1. The literature search was limited to English, updated to October 18, 2021. The protocol was registered in PROSPERO (No.CRD42020222990).
2.2 Inclusion Criteria and Data Extraction
The studies included in the meta-analysis must have met all the following inclusion criteria: 1) Outcome variables need to be defined as the incidence of MS or a group of metabolic abnormalities, including hyperglycemia, obesity, hypertension, or dyslipidemia. 2) Studies evaluated the association between sleep and MS. 3) Studies provided adjusted estimates of the relative risk (RR) (e.g., hazard ratio and odds ratio) and 95% confidence intervals (CIs). 4) Cohort studies of 1 year or longer that investigated the association between sleep and MS.
The following information was extracted from each study: 1) Name of the first author. 2) Year of publication. 3) Cohort name and country. 4) Baseline study dates. 5) Follow-up years. 6) Type of sleep disorder. 7) Sleep quality assessment tool. 8) Sleep duration. 9) Sample size. 10) Sex ratio and age. Two authors independently assessed the articles for compliance with the inclusion criteria and resolved disagreements through discussion.
2.3 Evaluation of Study Quality
The Newcastle Ottawa Scale (NOS) was used to assess the studies’ quality. The quality for each study was independently rated by two researchers. Due to the nature of observational studies, all the studies received 0 out of 9 points in the treatment quality. The evaluation of study quality includes eight domains: representation of the exposed cohort, selection of the non-exposed cohort, determination of exposure, absence of outcome events before the study began, whether the cohort was controlled for confounding factors, assessment of outcome events, adequacy of follow-up time, and completeness of follow-up. Each identified disagreement was resolved through team discussion and joint review.
2.4 Statistical Analysis
All reported RR were examined and extracted into two groups, the crude model and the most-adjusted model. The crude model is the model that does not control for covariates. The most-adjusted model is the model with the most covariates. If the study did not report the crude model, but reported the least-adjusted model and the most-adjusted model, we then pulled the least-adjusted results into the crude-model group. Hazard ratio (HR) and odds ratio (OR) were assumed to approximate the same relative risk and were collectively described as the RR in this meta-analysis. The relationship between sleep duration and MS was estimated by the combined RR and 95%CI, which were logarithmically converted. The significance of combined RR was determined by the Z-Test (P < 0.05 was considered statistically significant). The Q test and I2 were used to examine the heterogeneity between studies. A random-effect model (DerSimoniane-Laird method) was used to calculate pooled RR in the presence (p ≤ 0.10) or absence (p > 0.10) of heterogeneity, respectively. Subgroup analyses were conducted by the stratification of age and the components of MS. Sensitivity analyses were conducted by omitting a single study in each turn to test the robustness of our results.
Sensitivity analysis was performed after each exclusion to assess the stability of the results. Publication bias was evaluated by funnel plot, Begg’s test and Egger’s test (P < 0.05 was statistically significant). Statistical analysis was performed using Stata Version 16 (StataCorp LP, College Station, Texas, USA).
3 Results
3.1 Characteristics of the Studies
A flow chart of meta-analysis for exclusion/inclusion of individual articles is presented in Figure 1. Two thousand seven hundred and seventy-three articles were identified, of which 258 (9.3%) included data for the association between sleep and MS. Finally, 12 studies (11–22) were eligible based on the inclusion and exclusion criteria. Since the data were divided by sex in one study, it was considered separate studies in the subsequent data analysis (12). Therefore, 13 studies were included in the final meta-analysis.
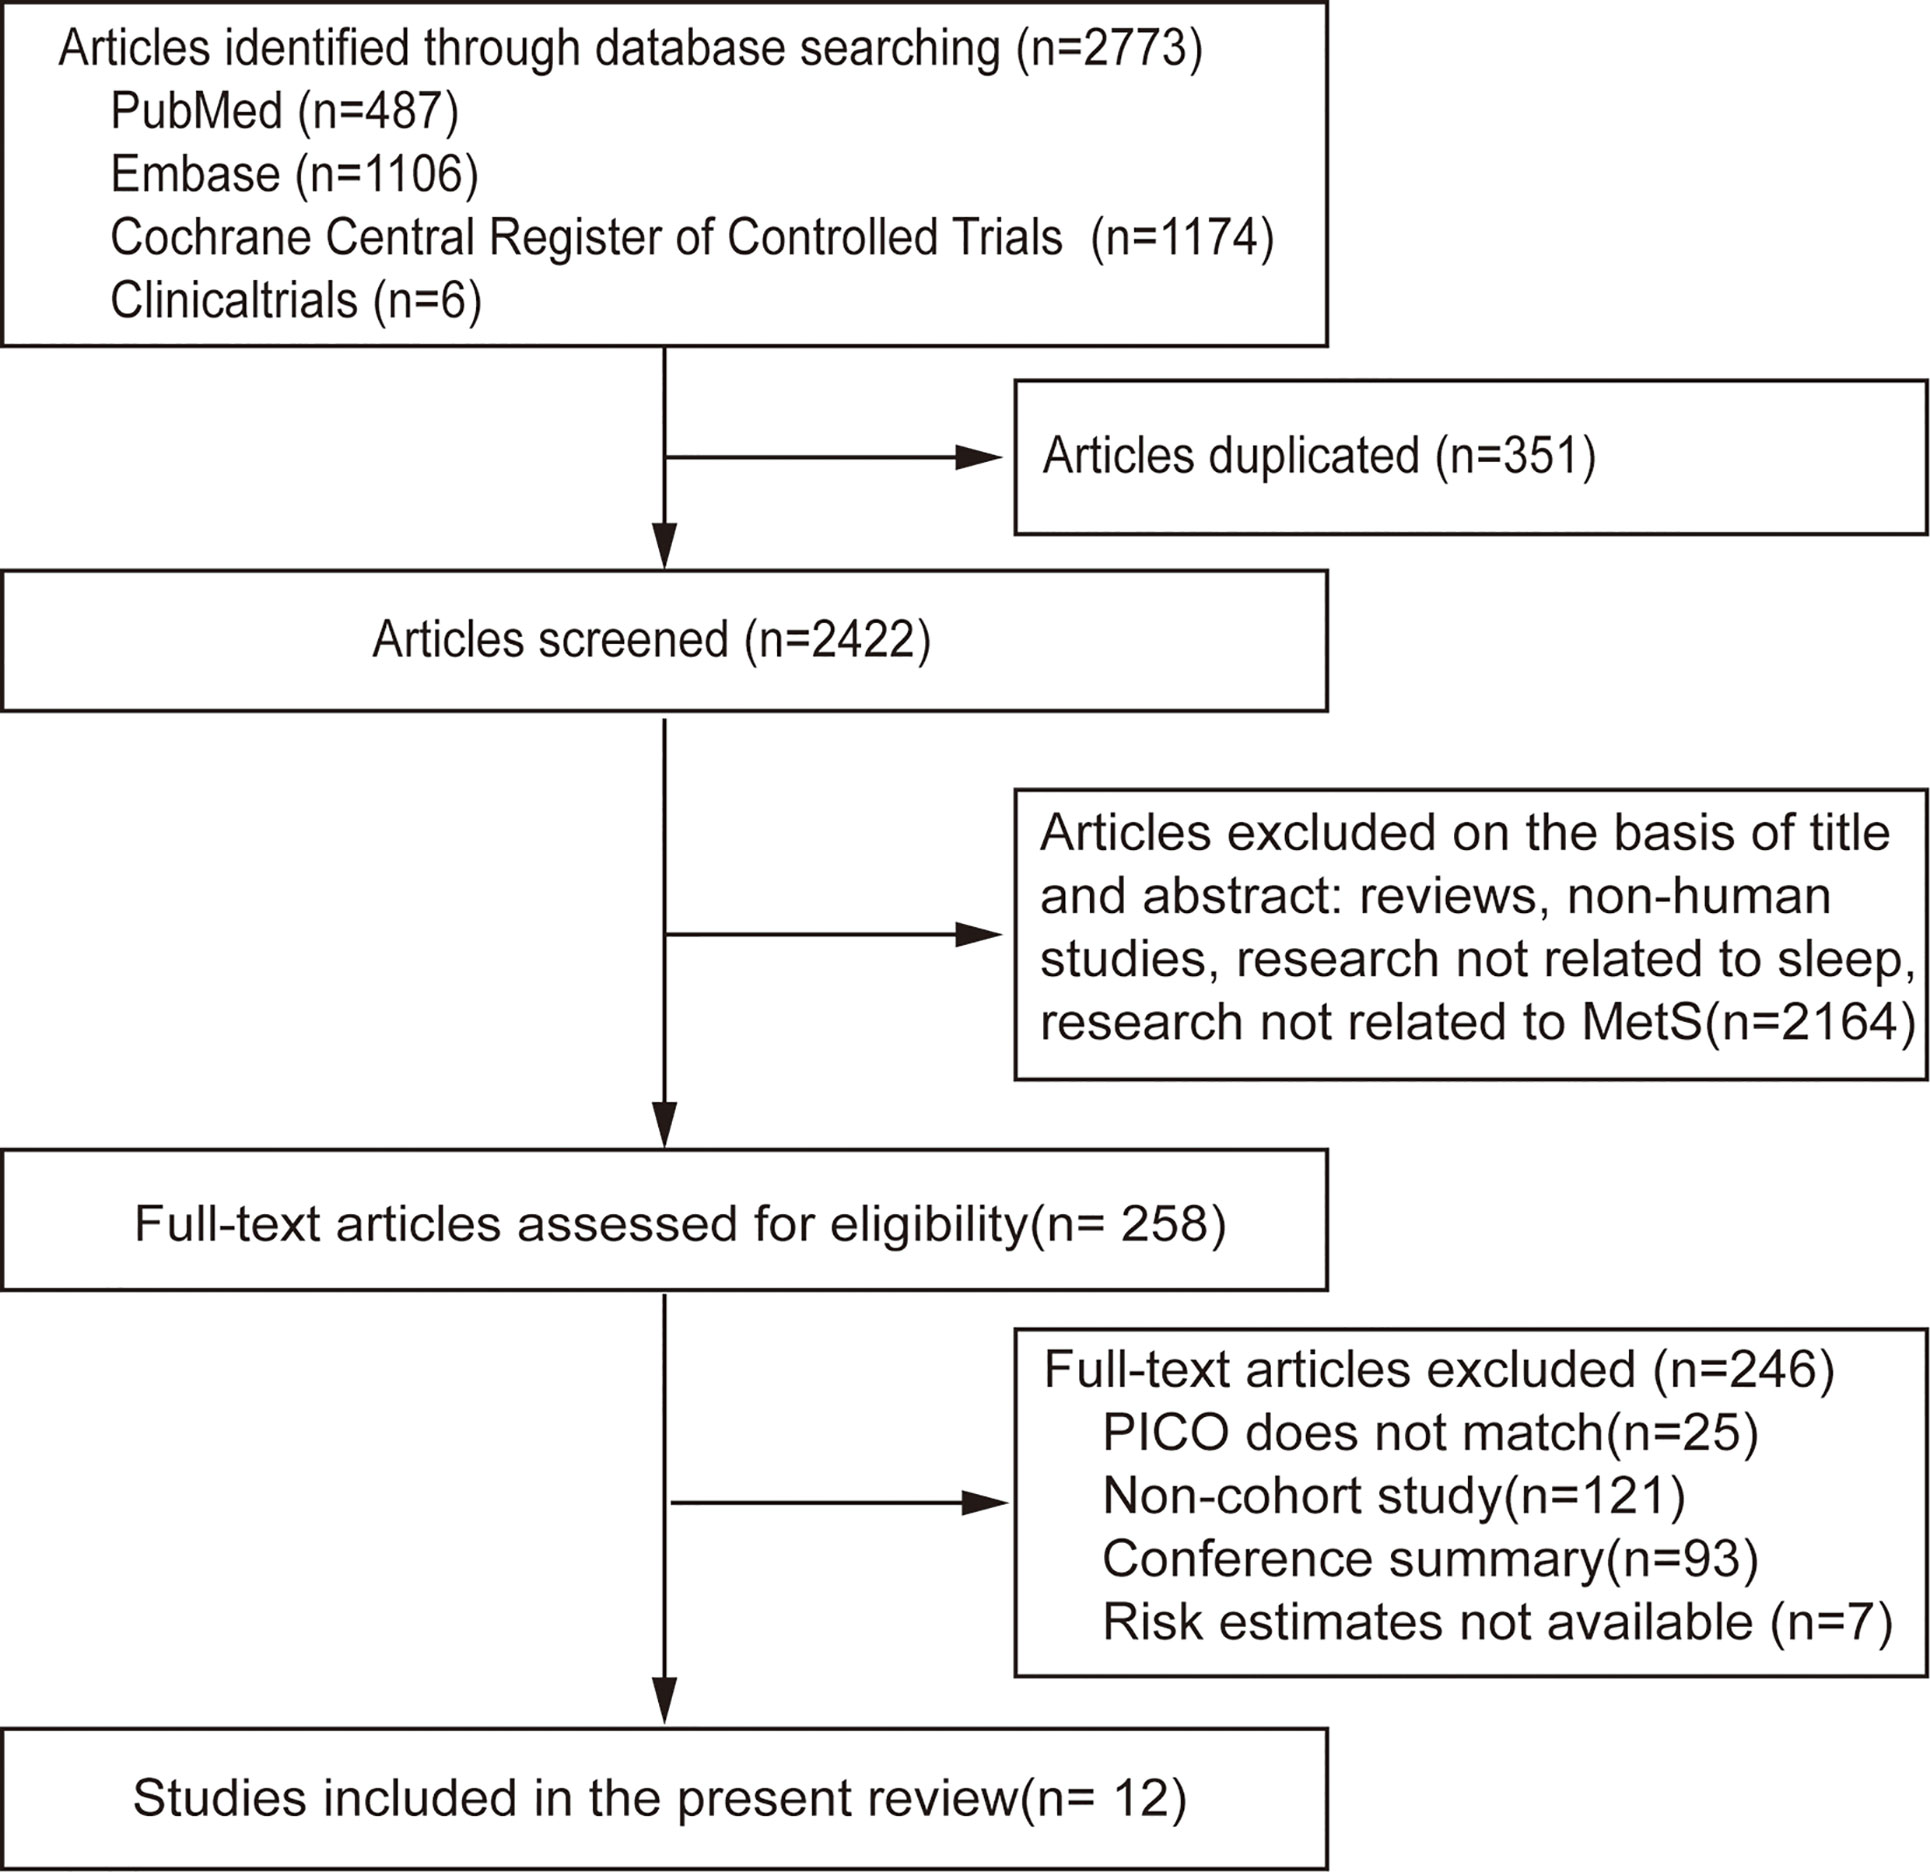
Figure 1 Flow chart of meta-analysis for exclusion/inclusion of individual articles.
Of the 13 included studies, 300,202 individuals were included, with 44,211 incident MS cases were observed during follow-up, and the estimated incidence of MS was 14.7%. The duration of follow-up ranged from 1 to 18 years. The age of the study participants was between 18 to 95 years. Eleven cohorts were from Asia (92% of individuals), one from the USA (1%), and one from Europe (7%). Eight studies used American Heart Association/National Heart, Lung, and Blood Institute for Asian populations (AHA/NHLBI), one National Cholesterol Education Program (NCEP) criteria, one WHO consultation, one Japanese Guidelines, one Consensus Statement Guidelines, and one Chinese Diabetes Association criteria to define MS. Sleep duration category (hr.) and other characteristics of the included studies are presented in Table 1. According to the Newcastle–Ottawa scales, all of the included studies had a quality score over 9, which indicated high quality (Table S2).
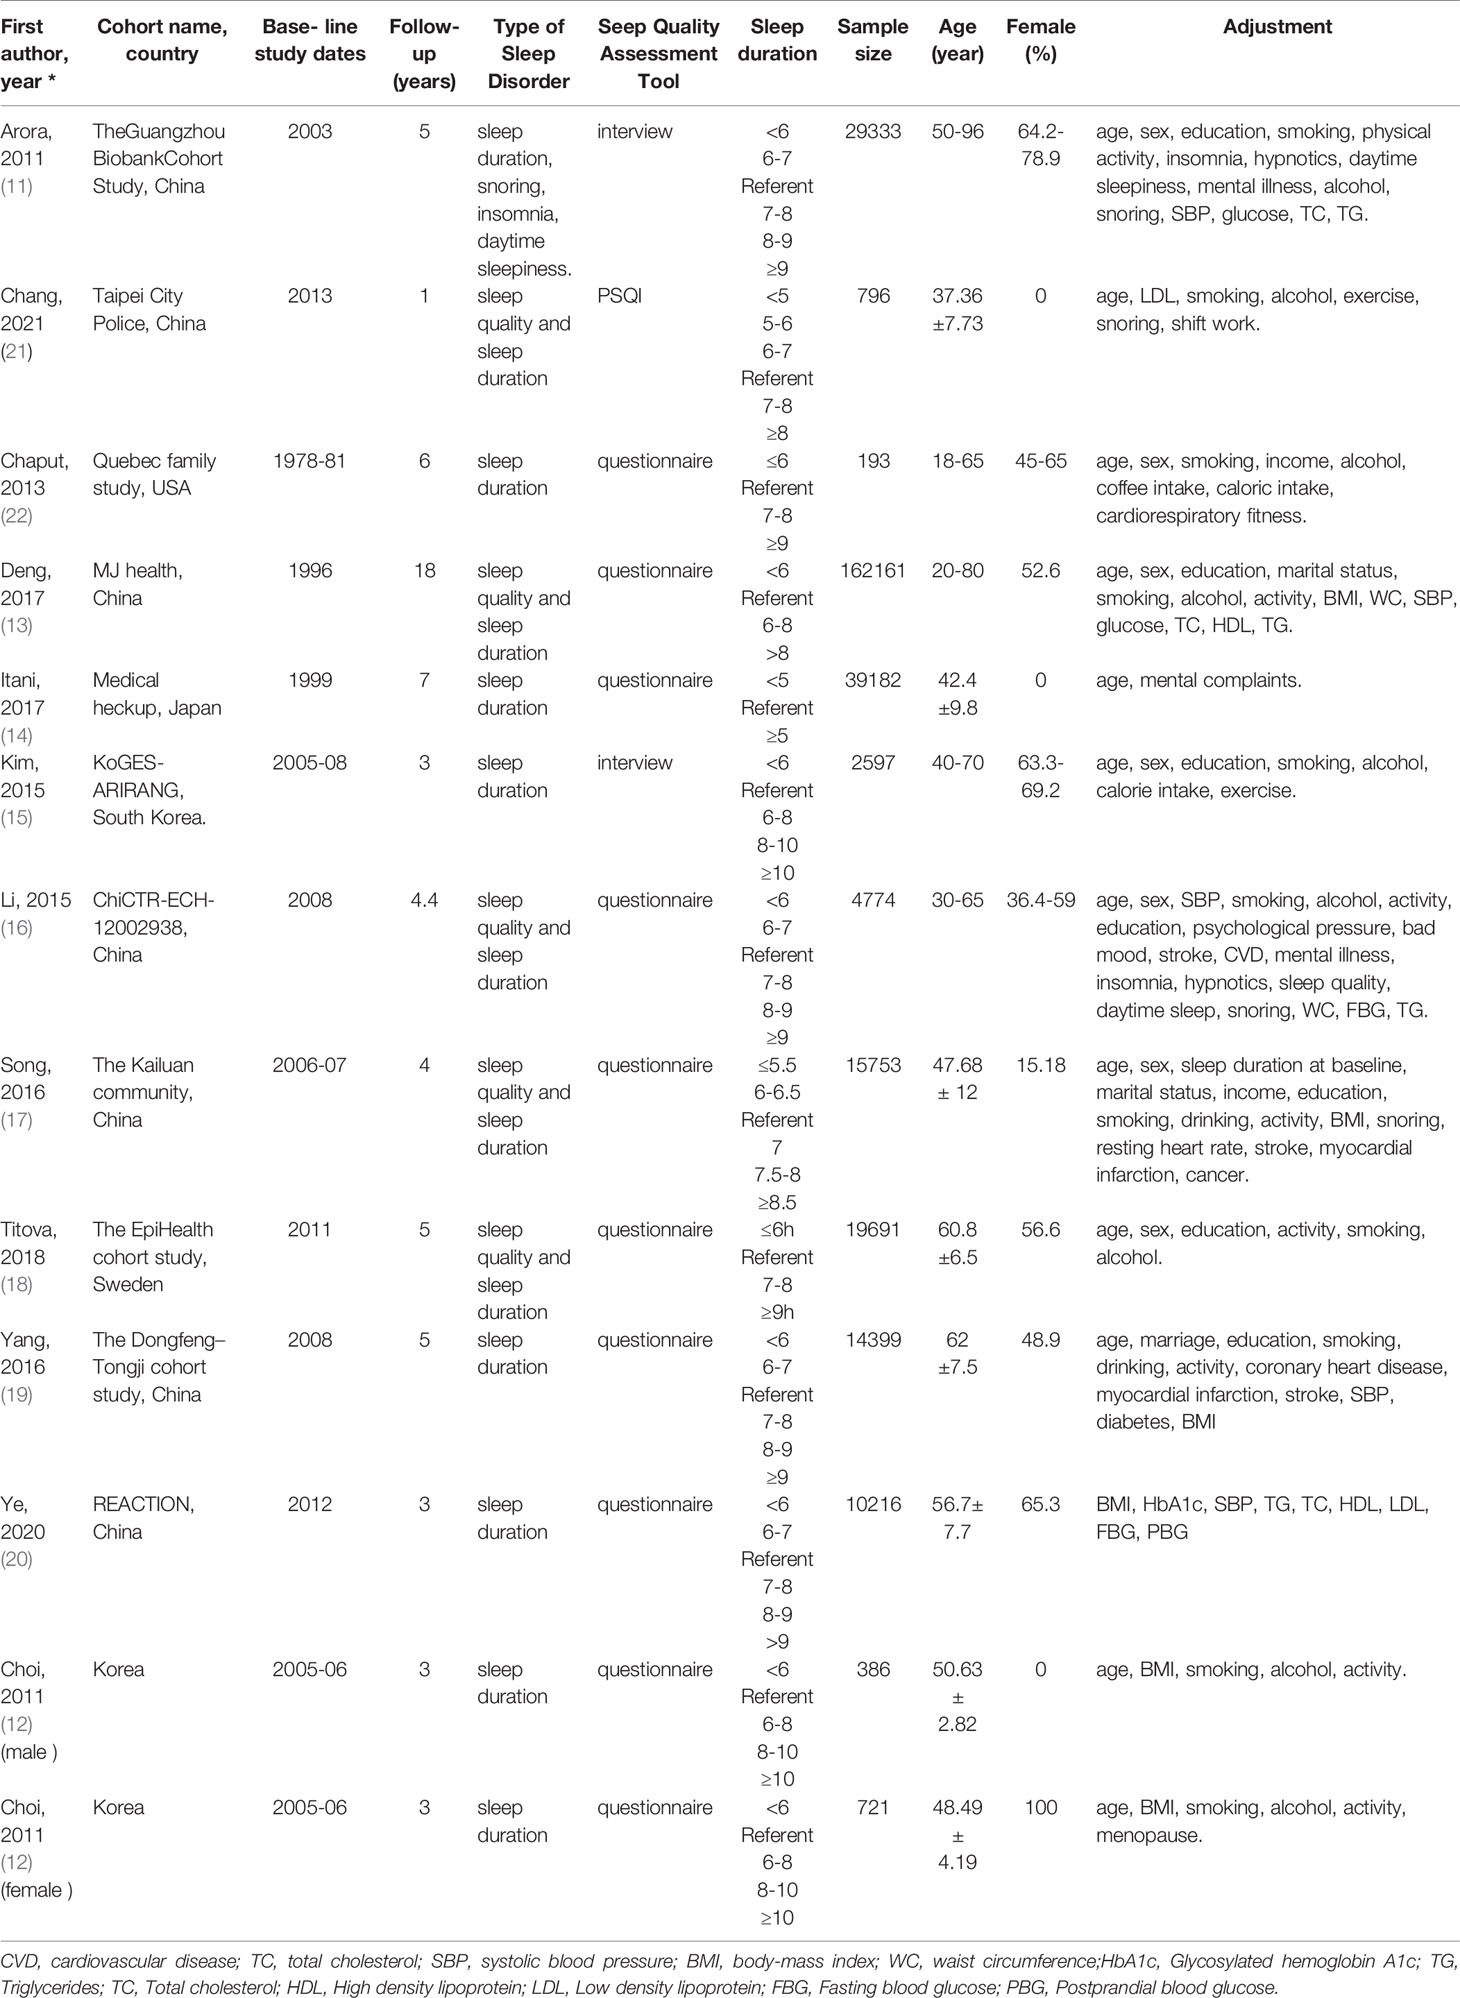
Table 1 Overview of the selected studies in the meta‐analysis.
3.2 Meta-Analysis Results
3.2.1 Sleep Duration and MS
3.2.1.1 Short Sleep Duration (<6 hours) and MS in the Most‐Adjusted Model
We identified 13 studies reporting the RRs using the most‐adjusted model. As shown in Figure 2, short sleep duration increased the risk of MS significantly (RR = 1.15, 95%CI = 1.09-1.22, p < 0.001) with evidence of between-study heterogeneity (I2 = 52.16%, ph = 0.01). Two of the studies looked at people aged 65 or older (11, 18), and short sleep duration did not increase the risk of MS (RR = 0.98, 95%CI = 0.91-1.06, p = 0.24) without evidence of between-study heterogeneity (I2 = 26.22%, ph = 0.64).
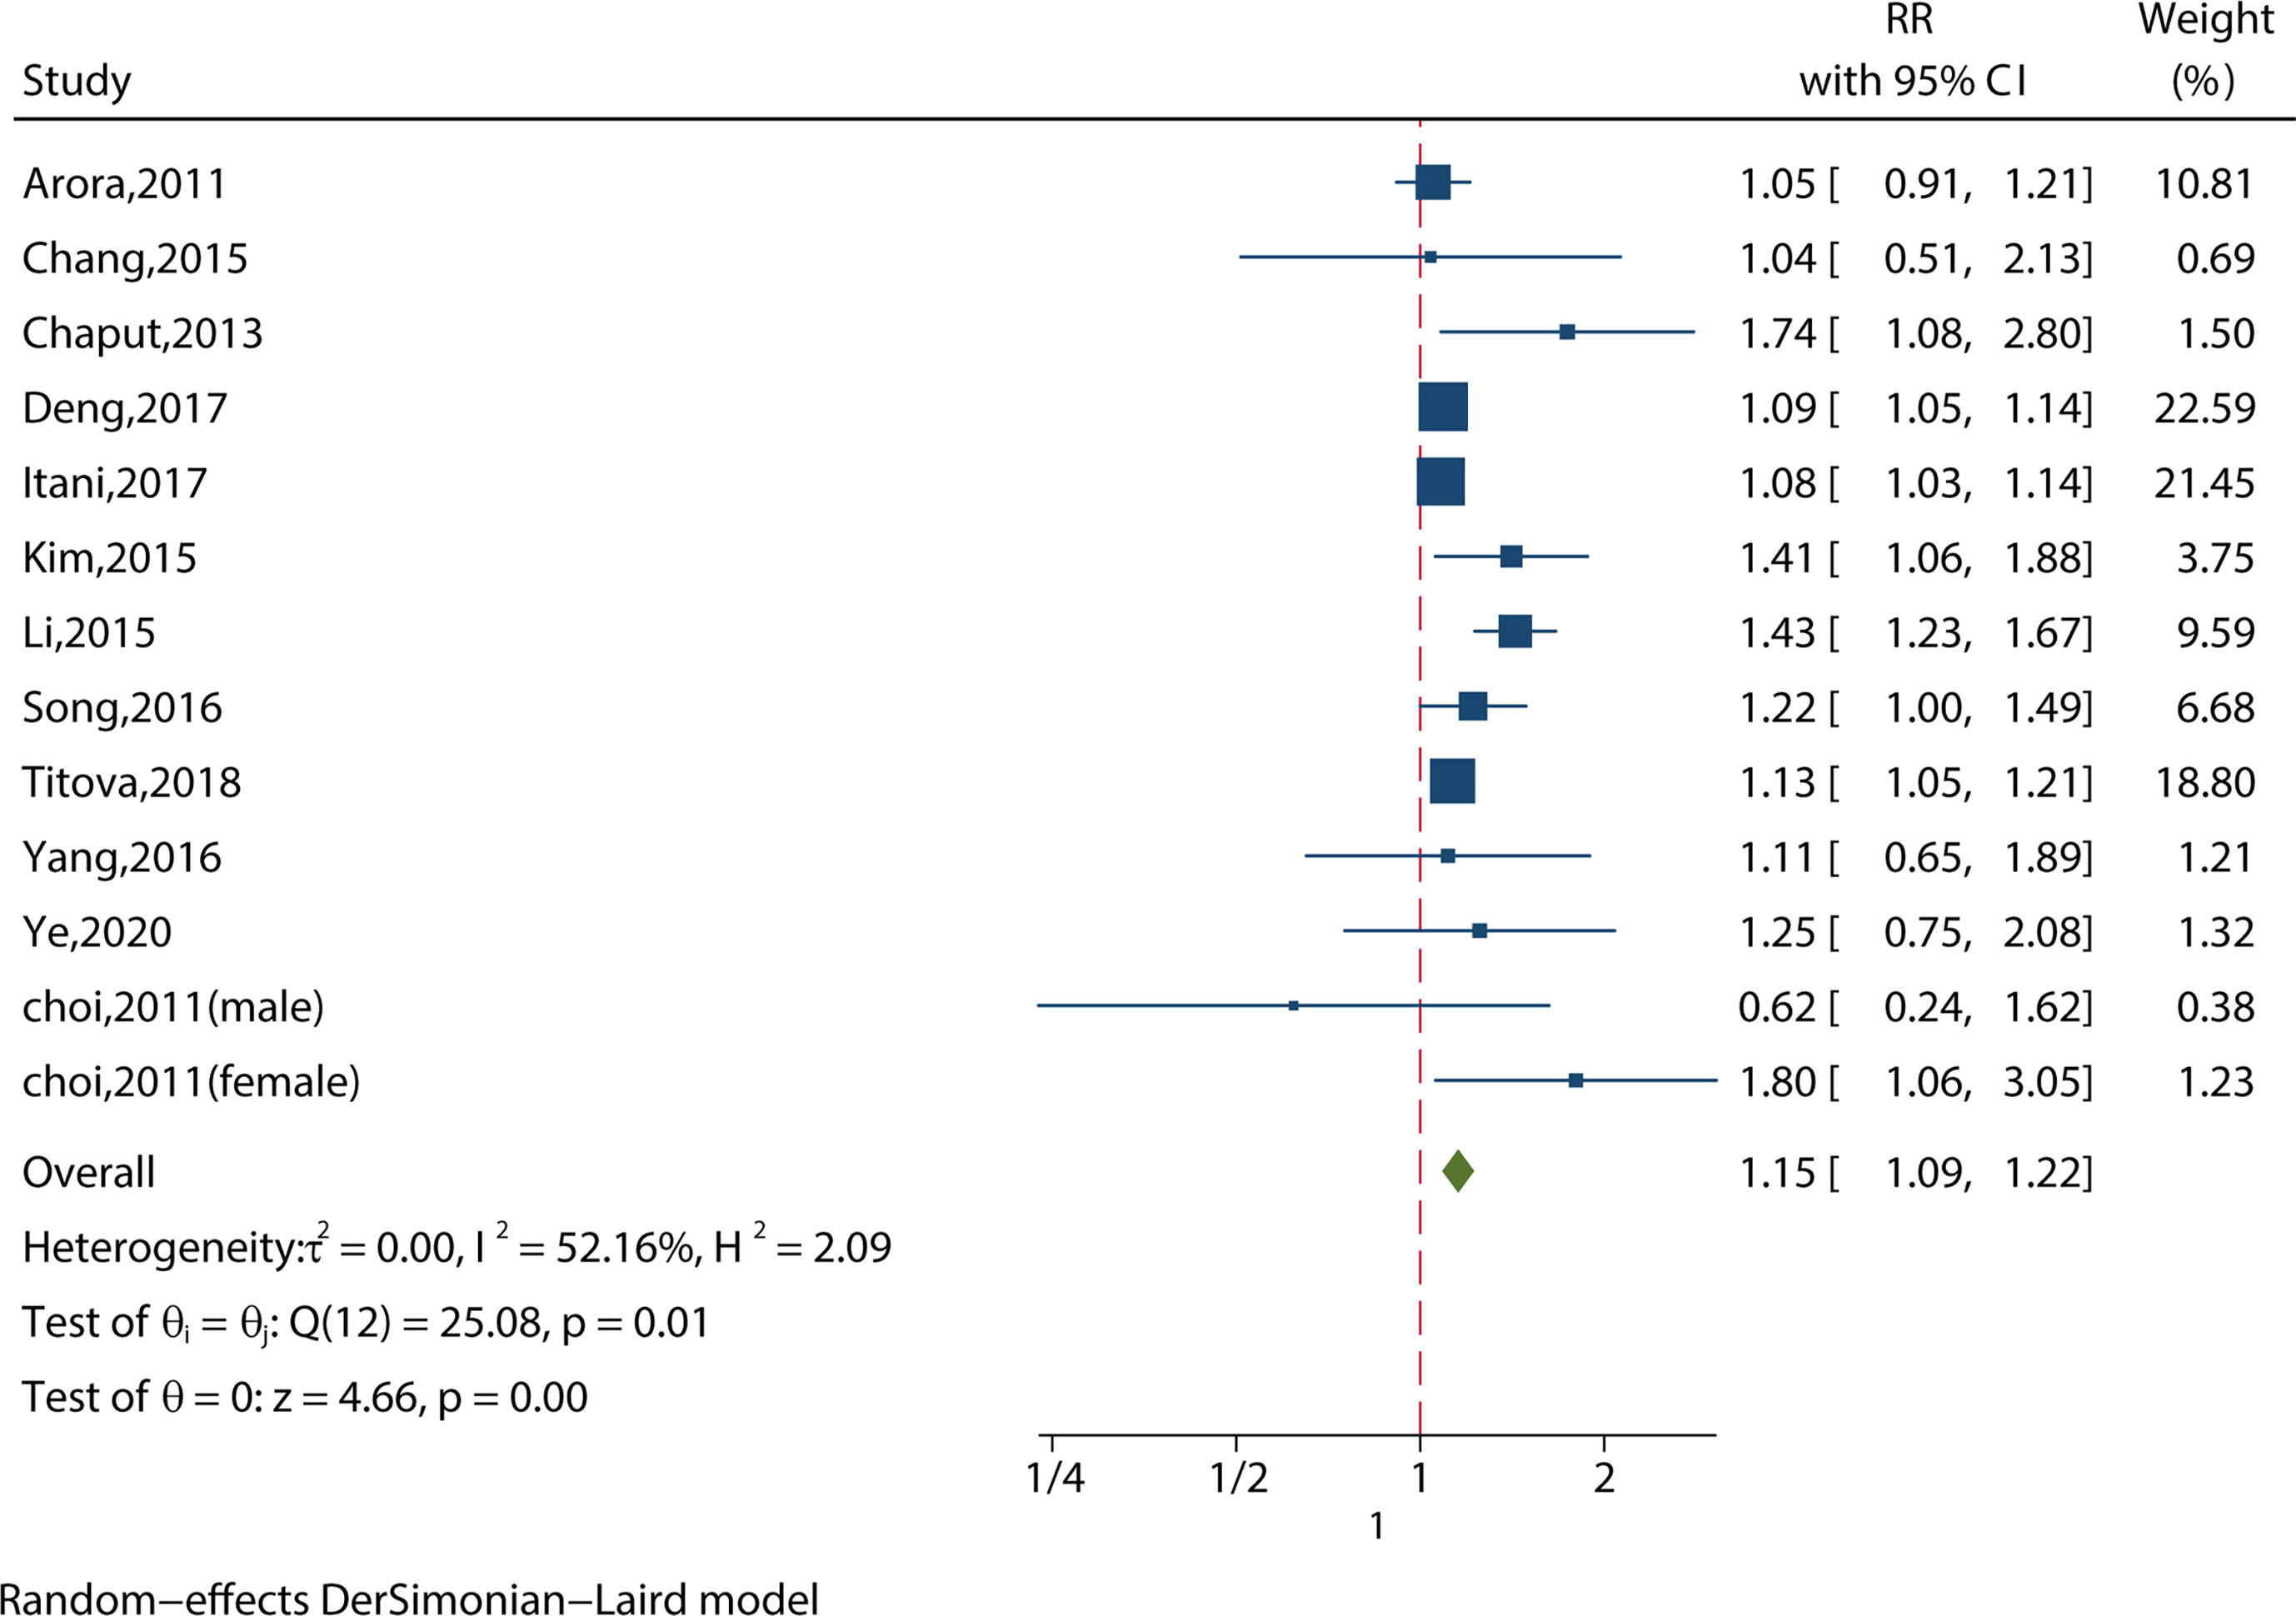
Figure 2 Meta-analysis of the association between short sleep and risk of metabolic syndrome in the most‐adjusted model.
3.2.1.2 Long Sleep Duration (>8 hours) and MS in the Most‐Adjusted Model
We identified 12 studies reporting the RRs using the most‐adjusted model. As shown in Figure 3, long sleep duration increased the risk of MS significantly (RR = 1.19, 95%CI = 1.05-1.35, p < 0.001) with evidence of between-study heterogeneity (I2 = 70.86%, ph = 0.01). Two of the studies investigated people aged 65 or older (11, 18), and found that long sleep duration increased the risk of MS (RR = 1.19, 95%CI = 1.04-1.35, p = 0.01) without evidence of between-study heterogeneity (I2 = 50.38%, ph = 0.16).
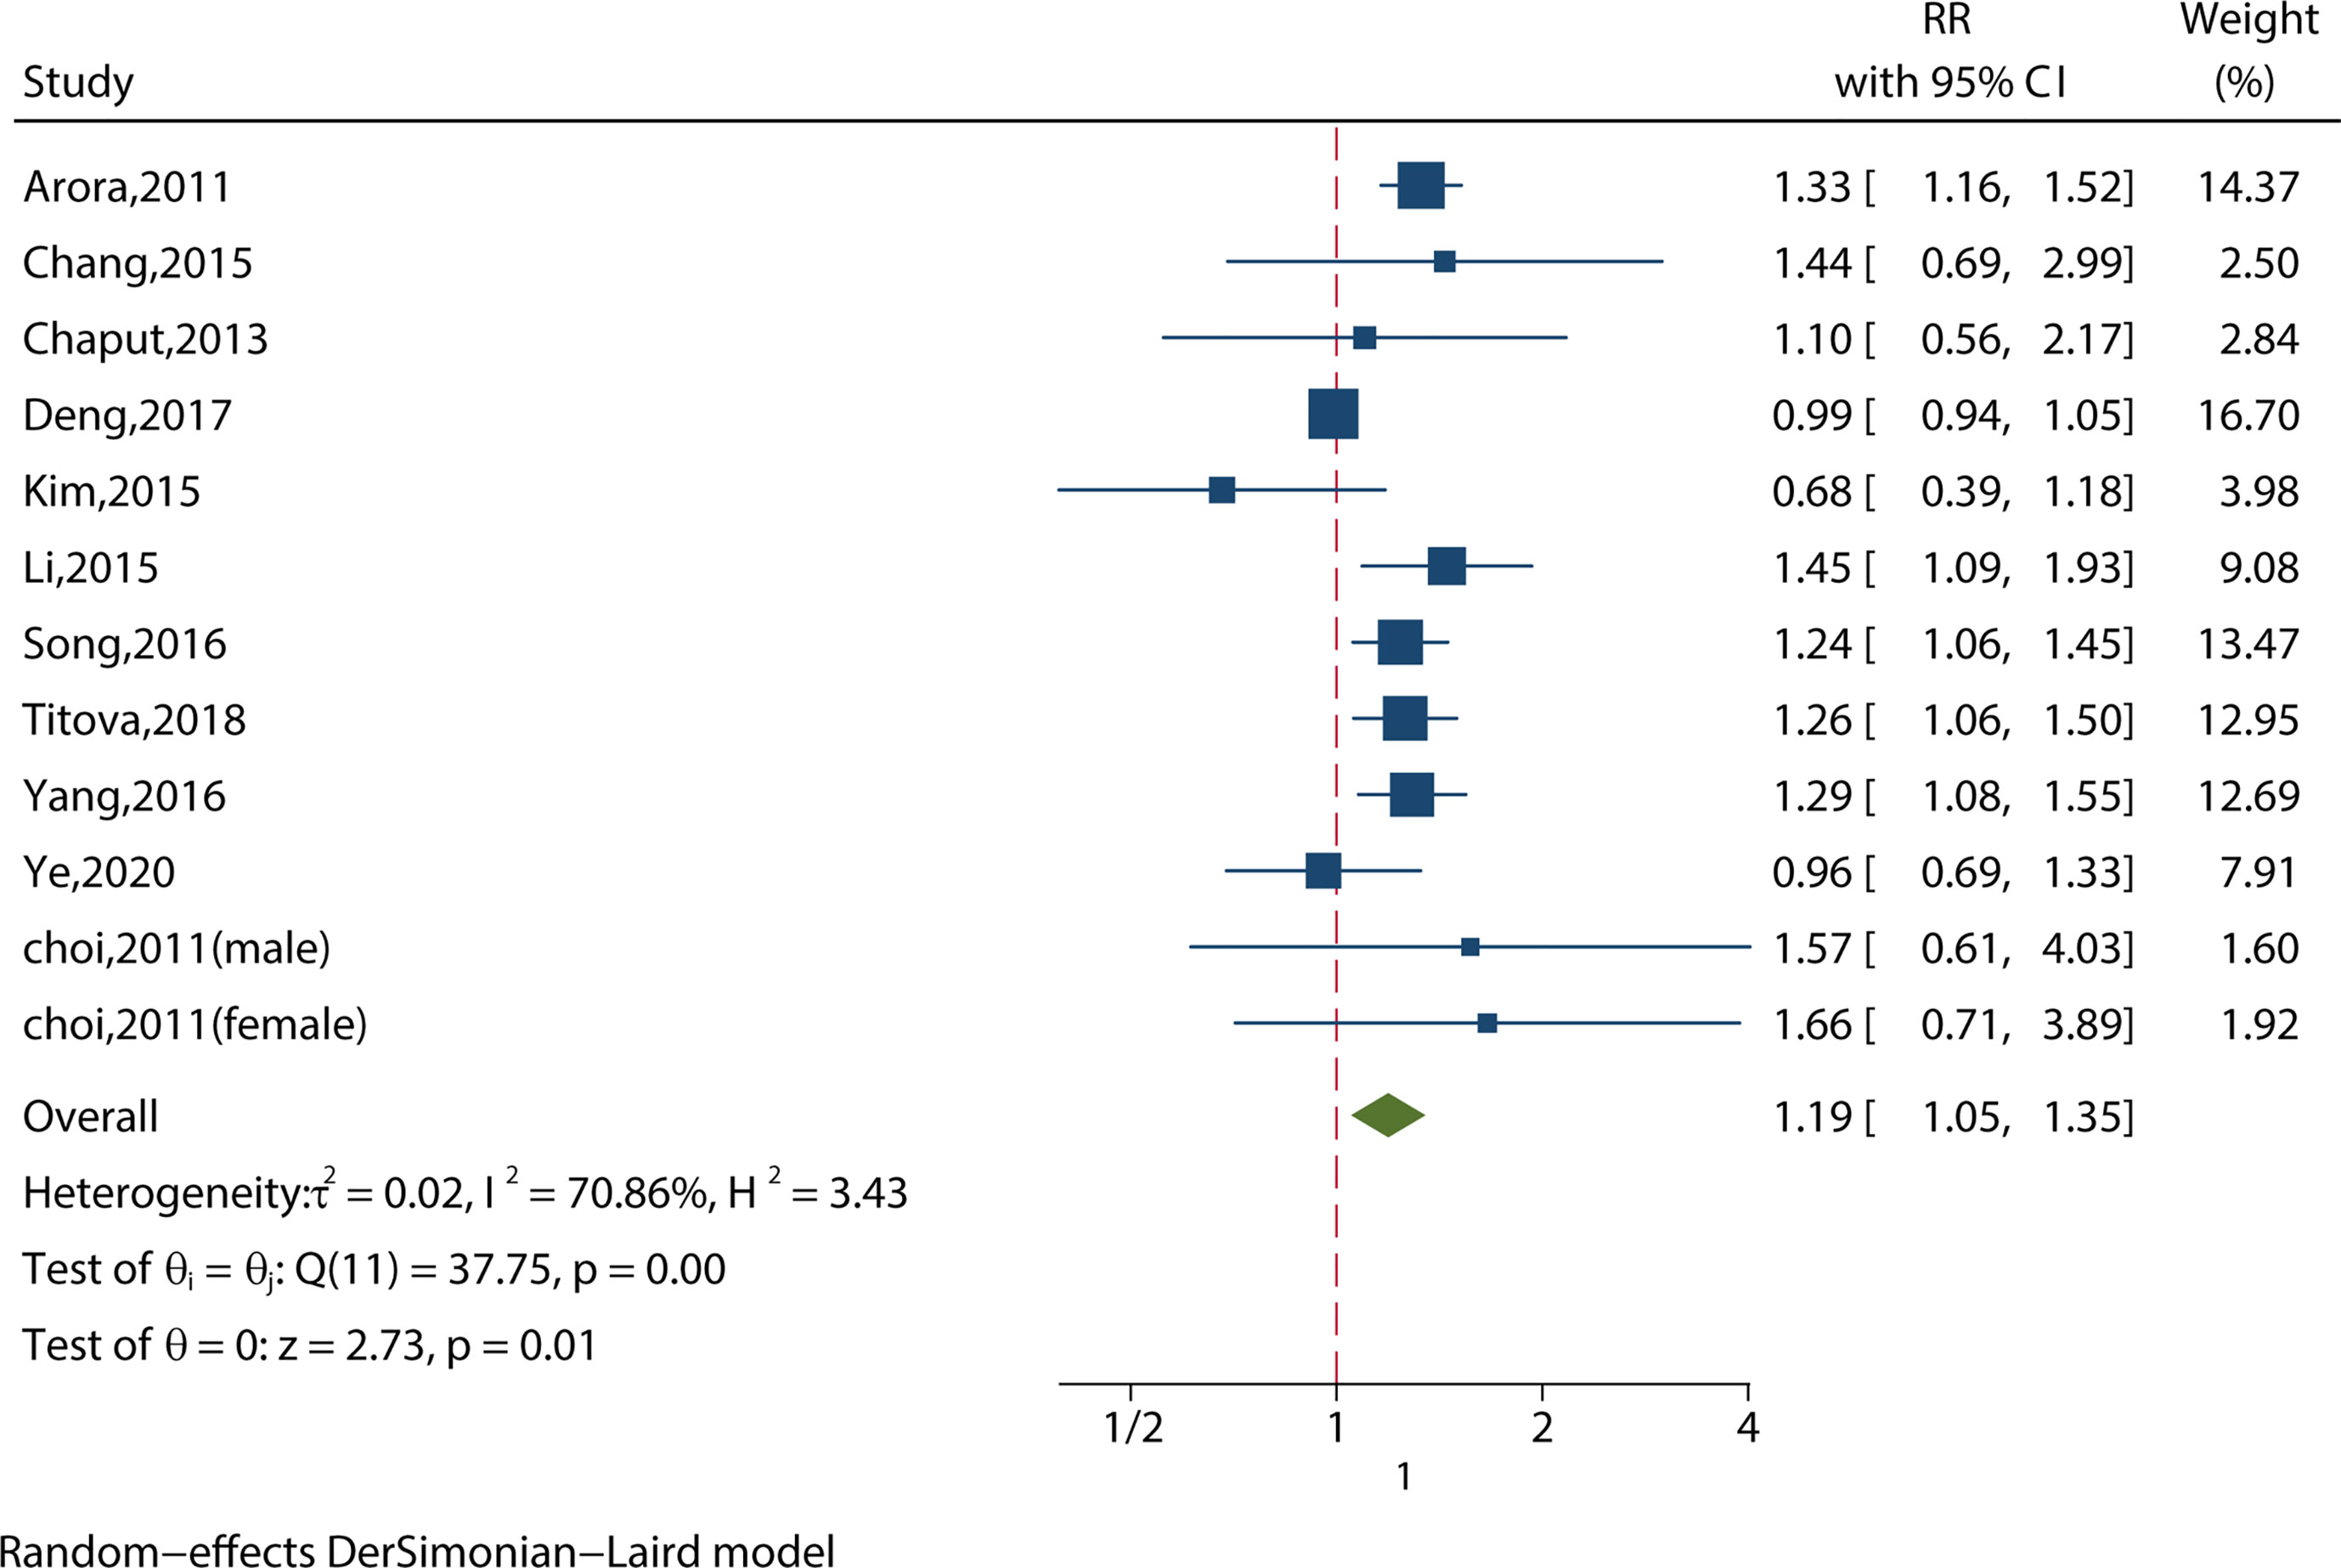
Figure 3 Meta-analysis of the association between long sleep and risk of metabolic syndrome in the most‐adjusted model.
3.2.1.3 Short Sleep Duration (<6 hours) and MS from Crude Models (or Least‐Adjusted Models)
We identified 10 studies reporting the RRs using a crude model or least-adjusted model. As shown in Figure 4, short sleep duration increased the risk of MS significantly (RR = 1.22, 95%CI = 1.12-1.32, p < 0.001) with evidence of between-study heterogeneity (I2 = 51.28%, ph = 0.03).
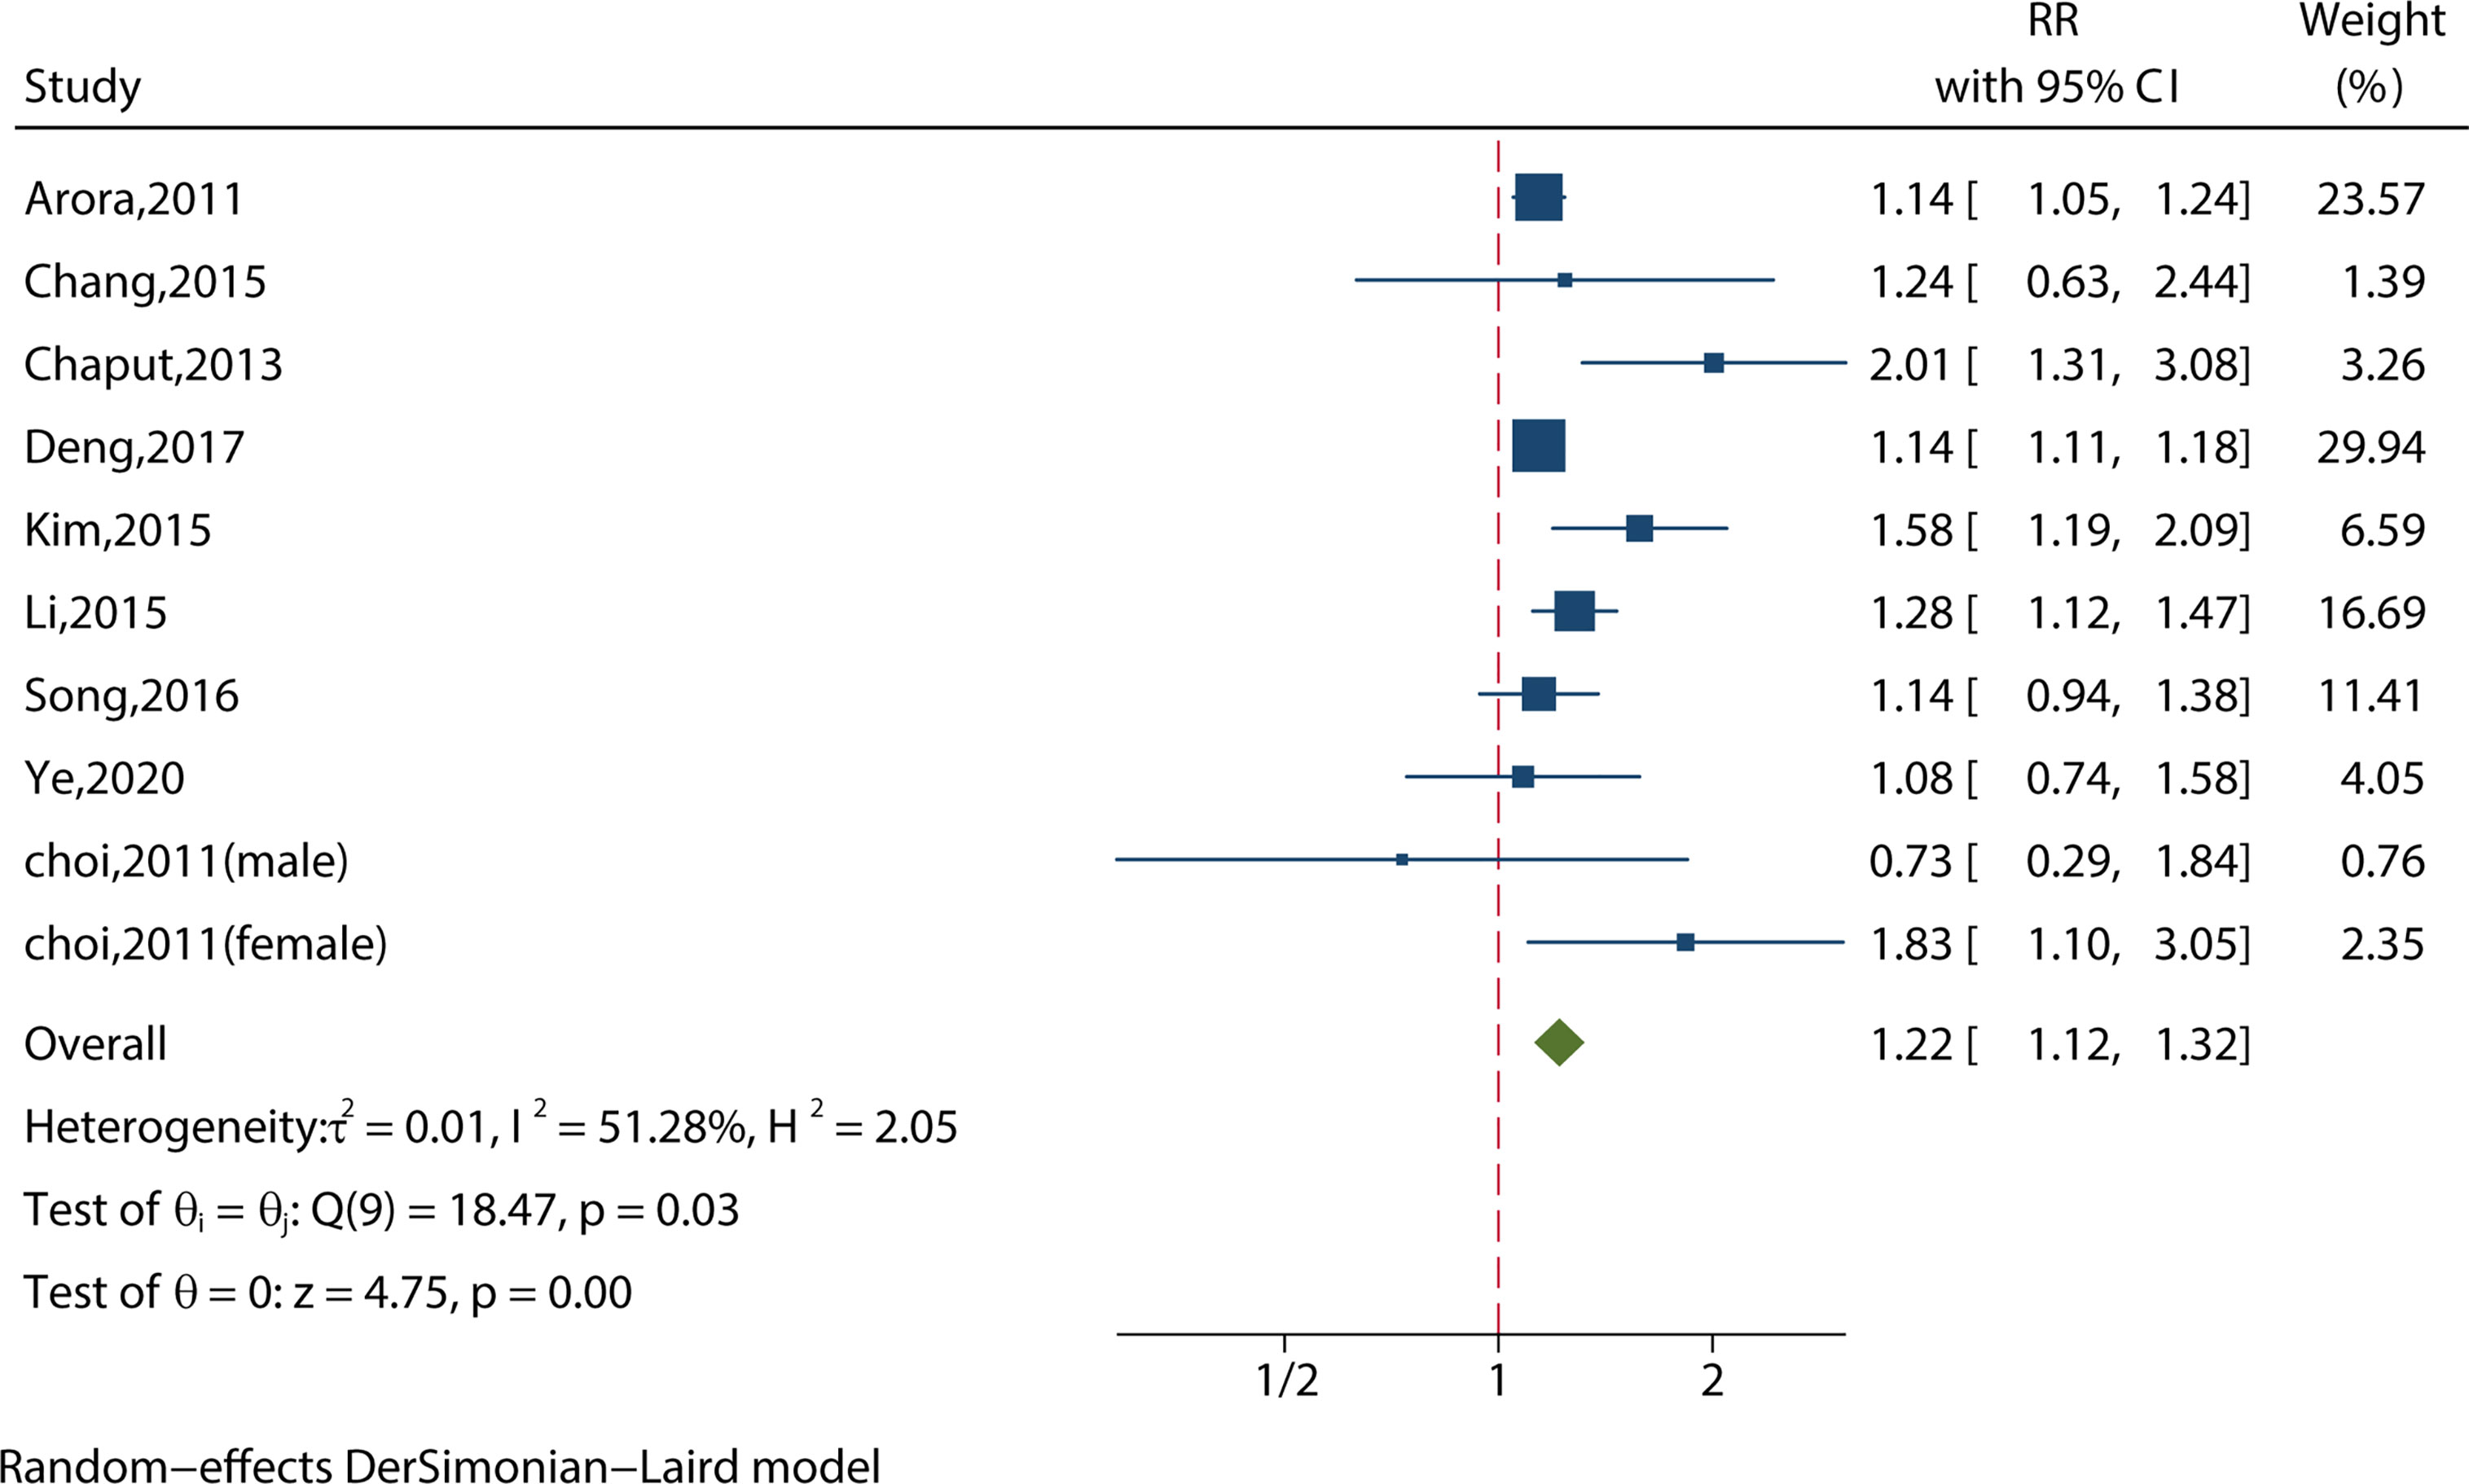
Figure 4 Meta-analysis of the association between short sleep and risk of metabolic syndrome from crude models or least-adjusted results.
3.2.1.4 Long Sleep Duration (>8 hours) and MS from Crude Models (or Least‐Adjusted Models)
We identified 10 studies reporting the RRs using a crude model or least-adjusted model. As shown in Figure 5, long sleep duration did not increase the risk of metabolic syndrome (RR = 1.08, 95%CI = 0.96-1.23, p = 0.20) with evidence of between-study heterogeneity (I2 = 64.27%, ph = 0.001).
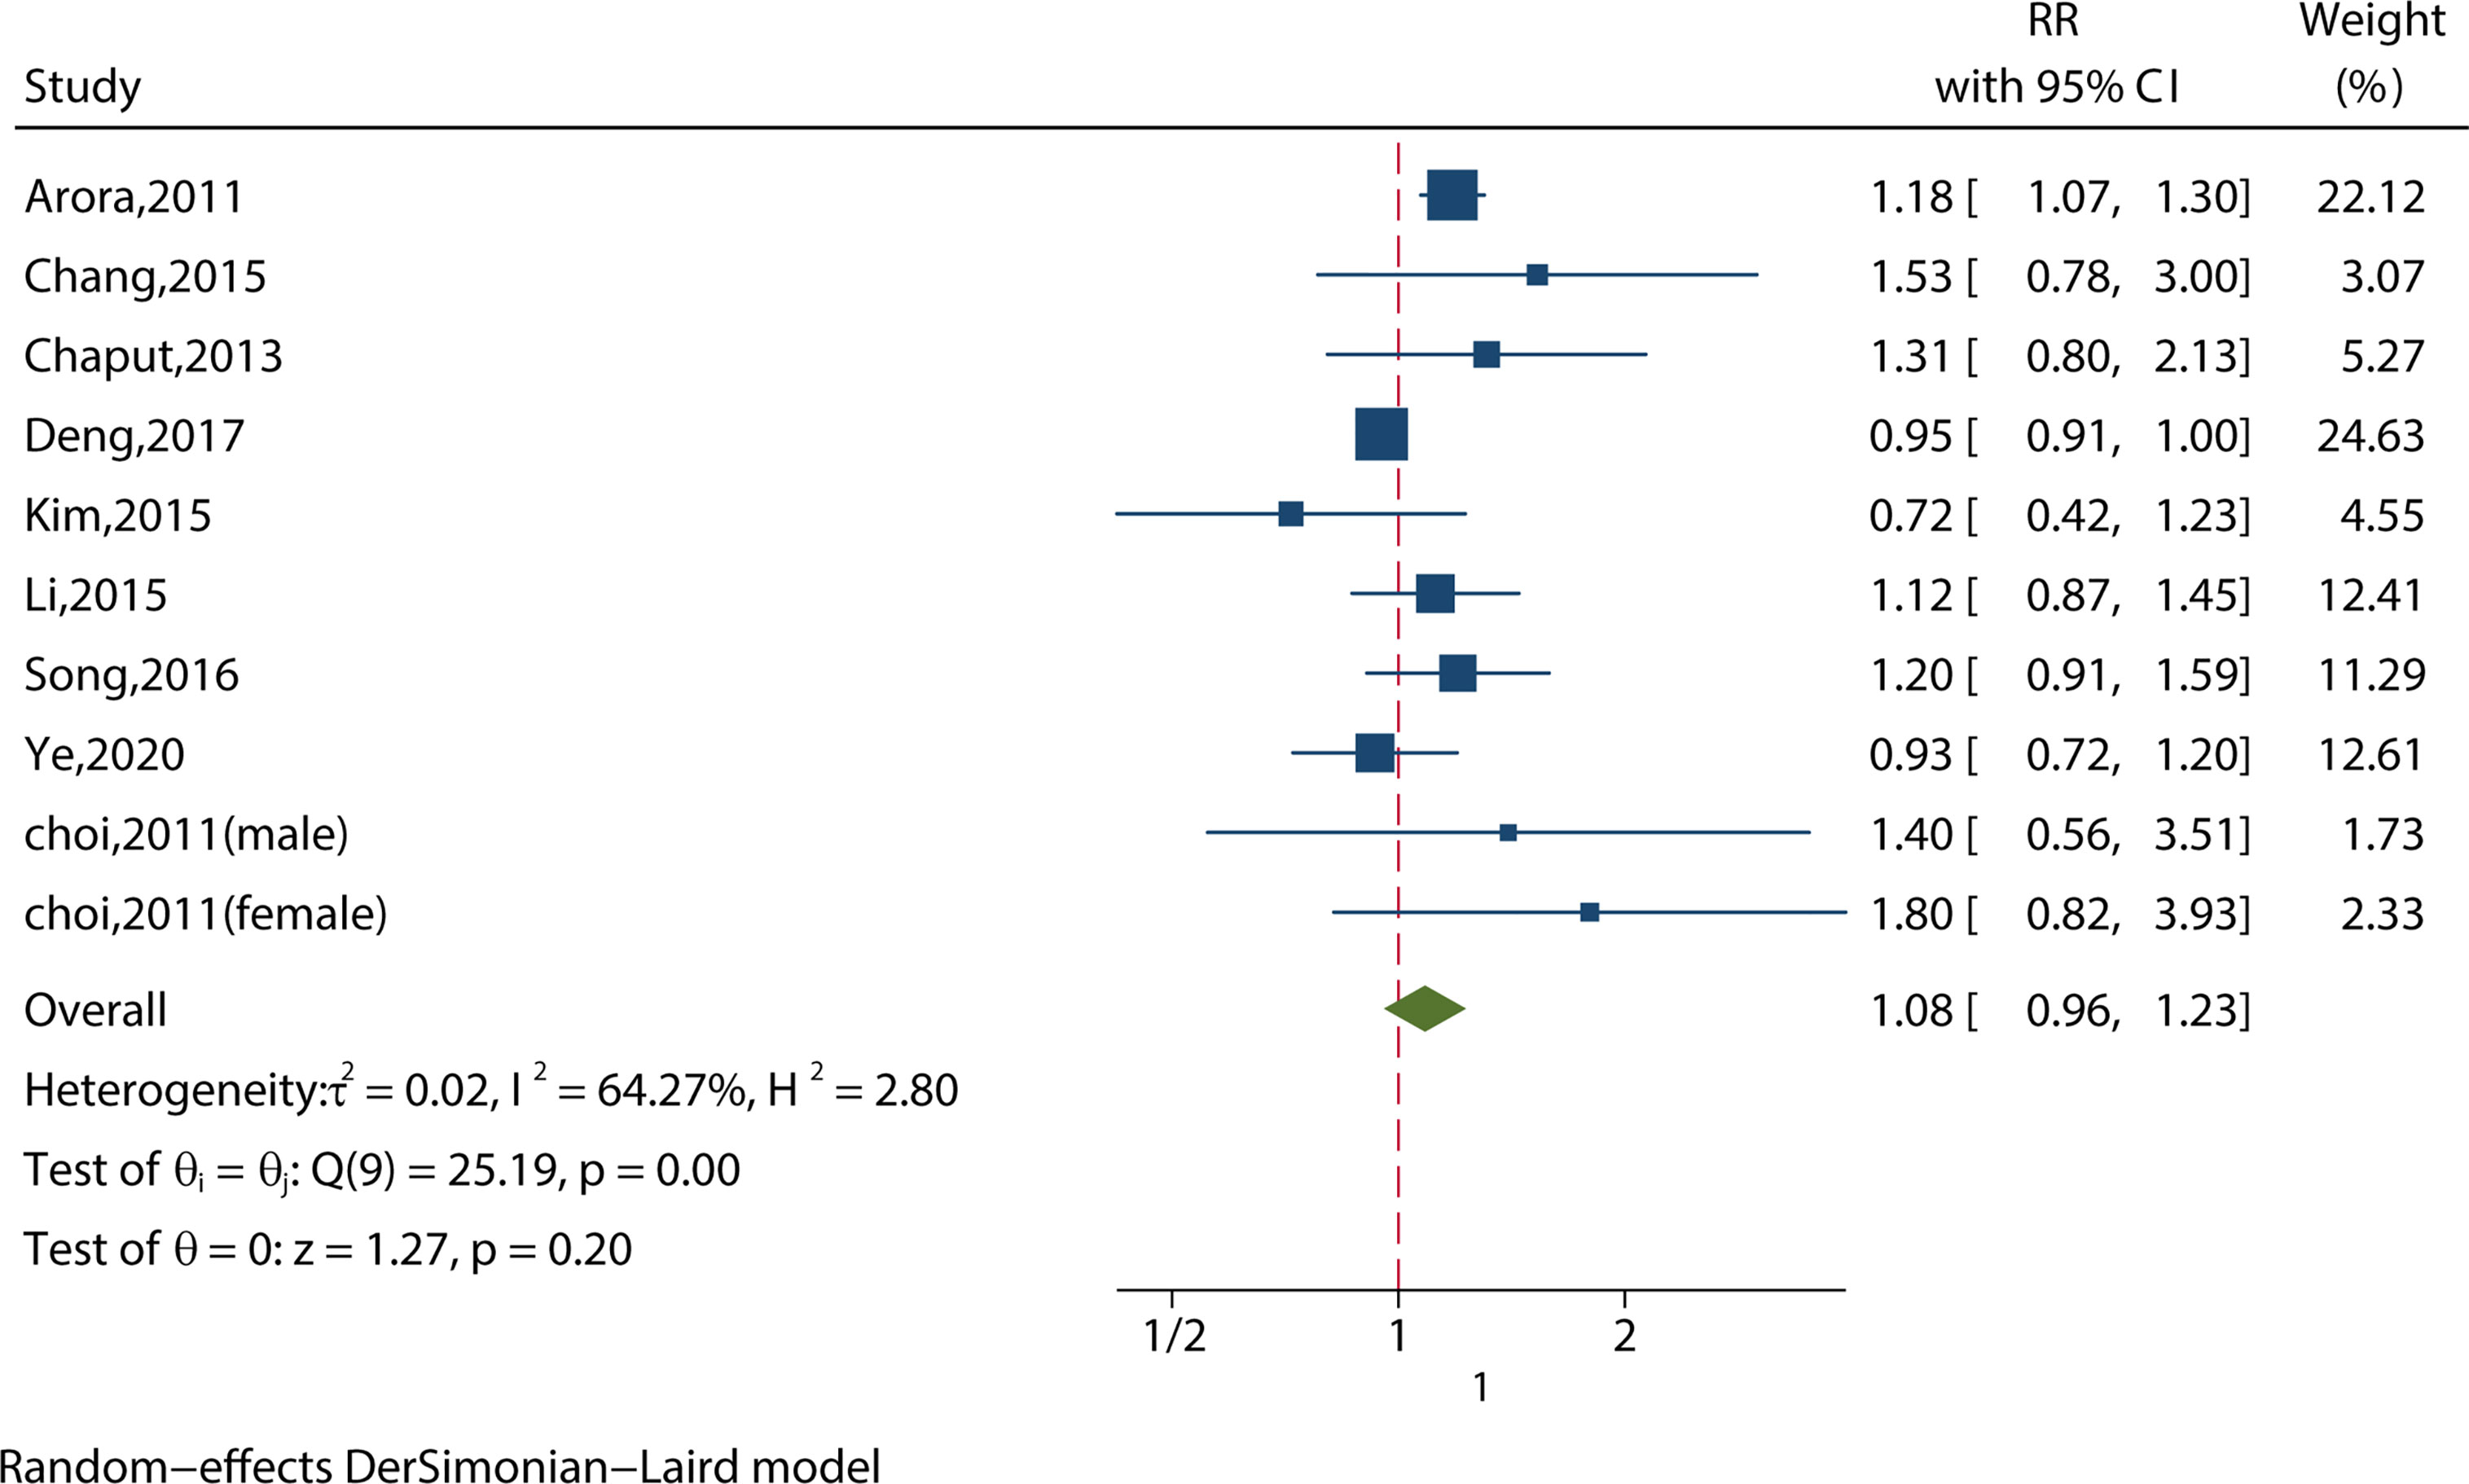
Figure 5 Meta-analysis of the association between long sleep and risk of metabolic syndrome from crude models or least-adjusted results.
3.2.1.5 A U-shaped Relationship Between Sleep Duration and Metabolic Syndrome.
Sleep duration (6-7 hours) increased the risk of MS (RR = 1.08, 95%CI = 1.01-1.16, p = 0.03; I2 = 15.03%, p = 0.32) (Figure S1). Sleep duration between 8 and 9 hours increased the risk of MS (RR = 1.12, 95%CI = 1.01-1.24, p = 0.04; I2 = 52.17%, p = 0.10; Figure S2). Sleep duration with more than 9 hours) increased the risk of MS (RR = 1.25, 95%CI = 1.13-1.39, p < 0.001; I2 = 19.27%, p = 0.27) (Figure S3).
Summary forest plot with a comparison of pooled RRs for different durations (<6 hours, 6-7 hours, 8-9 hours, and >9 hours) of sleep with MS risk presented a U-shaped curve (Figure 6).
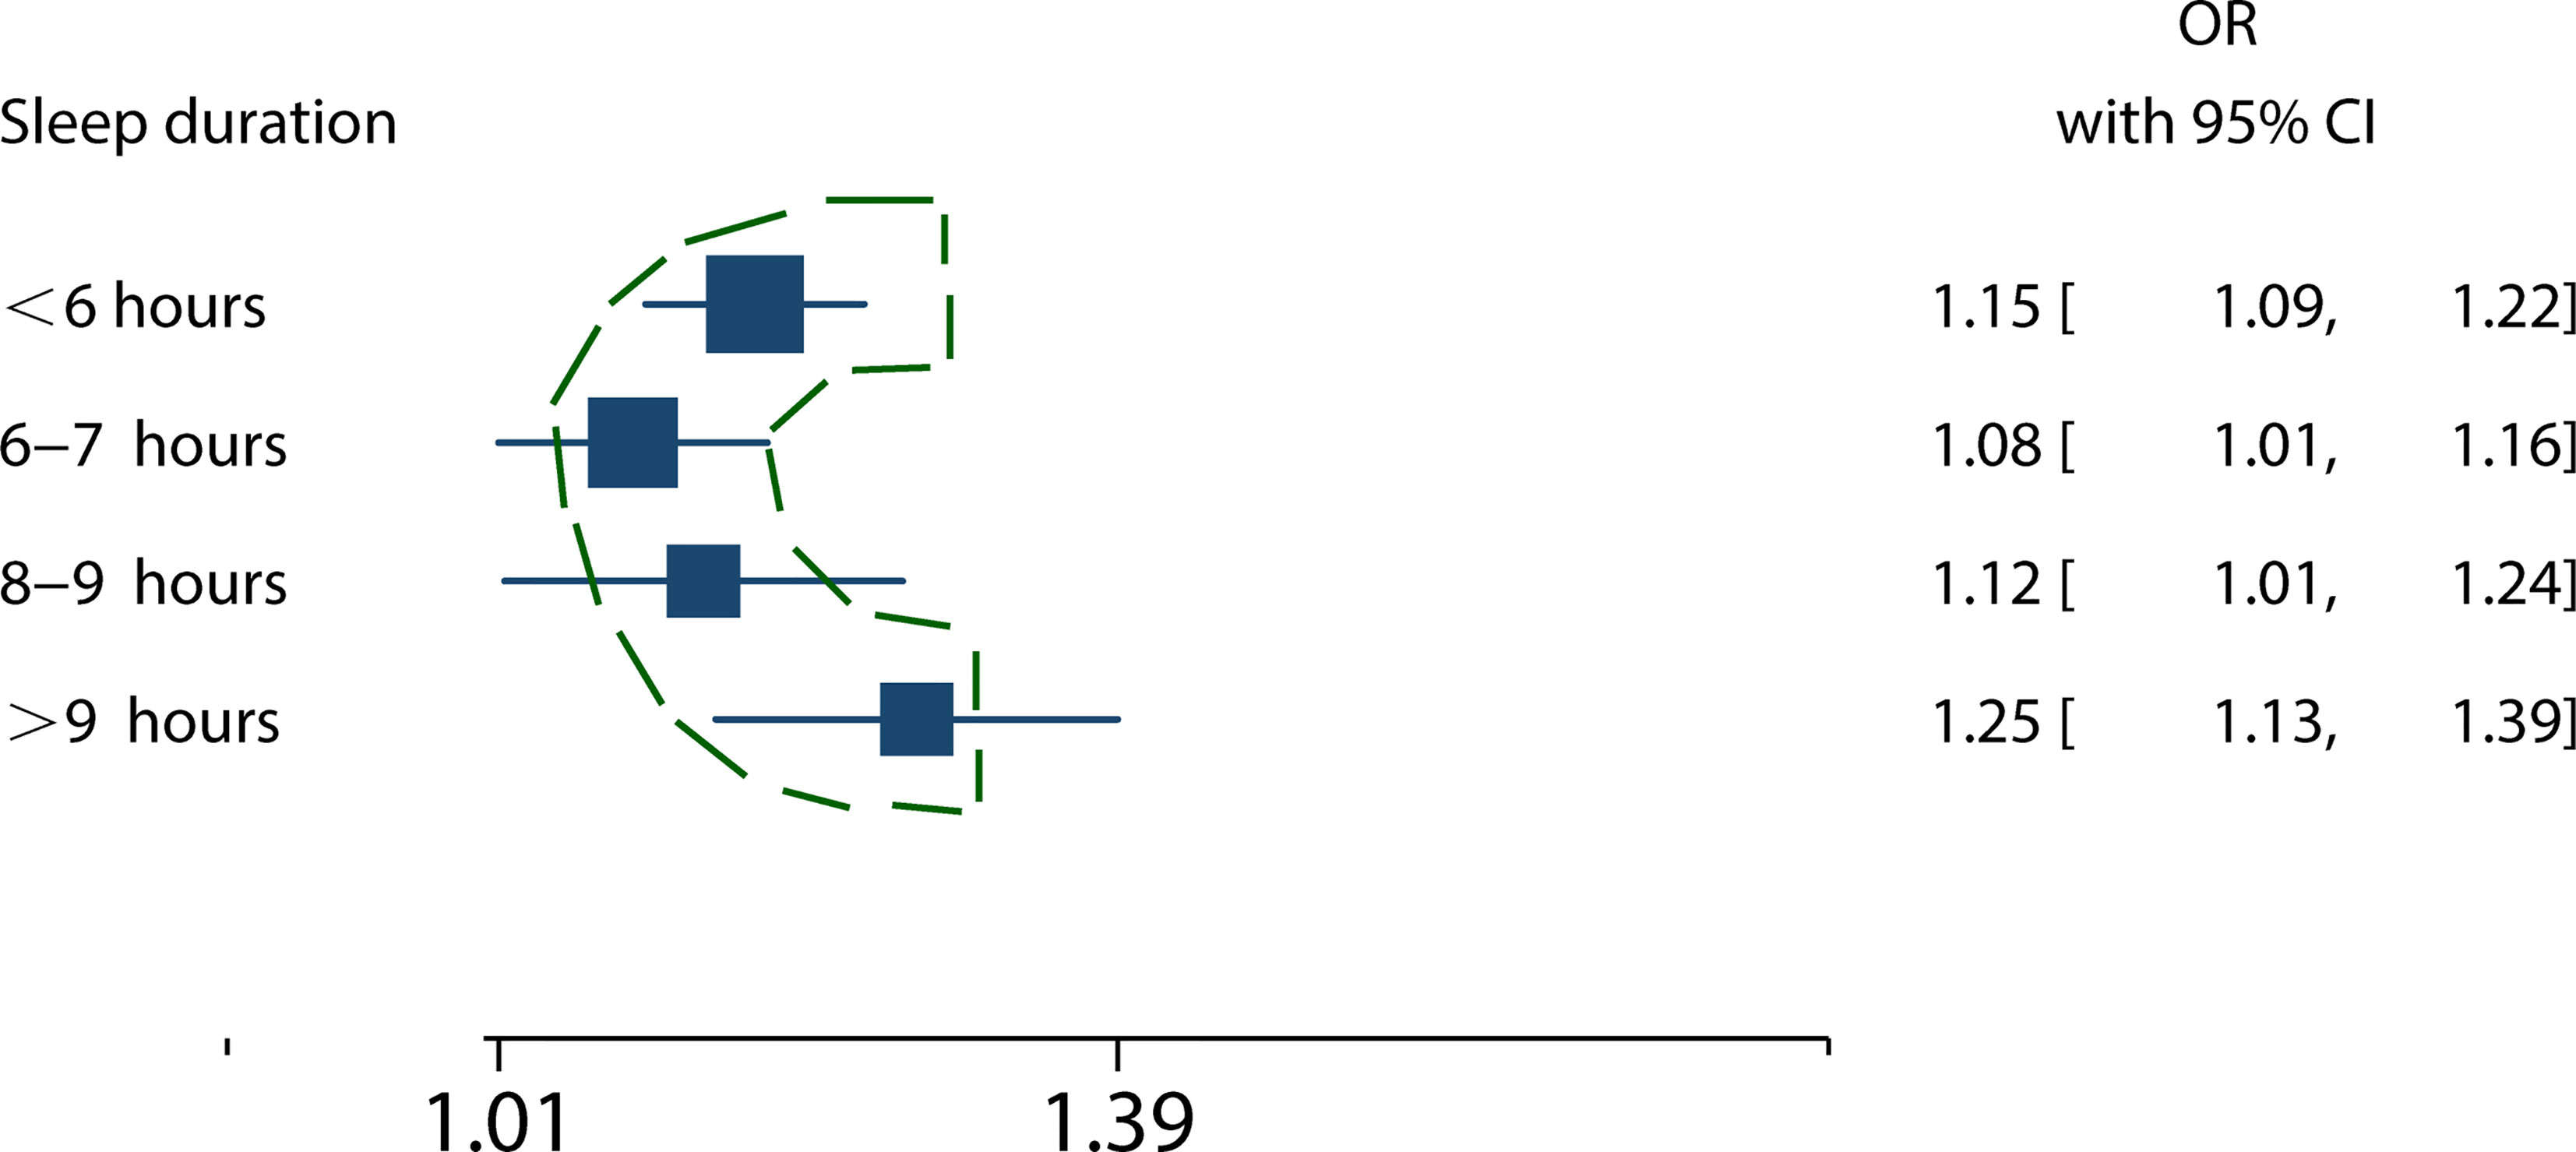
Figure 6 The relationship between sleep duration and MS risk presented a U-shaped curve. The squares represent the mixed RRs of different sleep duration in patients with MS. The broken outline in green illustrates the nonlinear trend, indicating the presence a U-shaped relationship.
3.2.2 Sleep Duration With Components of MS
3.2.2.1 Short Sleep Duration With Components of MS
The relationship between short sleep duration and components of the metabolic syndrome are presented in Table 2. Short sleep duration increased the risk of obesity (14% (95%CI=7-22%, p<0.001; I2 = 48.91%, ph = 0.07), hyperglycemia (RR = 1.12, 95%CI = 1.00-1.15, p = 0.05; I2 = 78.32%, p = 0.001) and hypertension (16% (95%CI=2-31%, p = 0.03; I2 = 90.56%, ph<0.001). However, short sleep duration does not increased the risk of hypertriglyceridemia (RR = 1.04, 95%CI = 0.96-1.12, p = 0.37; I2 = 65.06%, p = 0.01) and low HDL (RR = 0.98, 95%CI = 0.88-1.23, p = 0.11; I2 = 52.78%, p = 0.06).
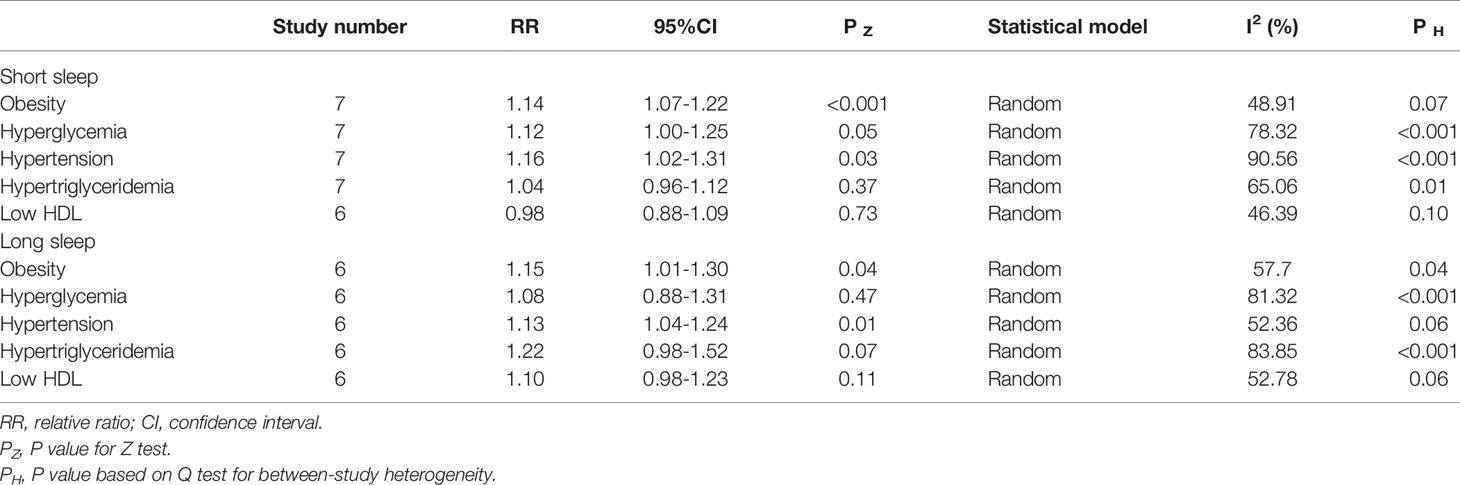
Table 2 Meta-analysis of the associations between sleep duration and the components of MS.
3.2.2.2 Long Sleep Duration With Components of MS
The relationship between long sleep duration and components of the metabolic syndrome are presented in Table 2. Long sleep duration increased the risk of obesity (RR = 1.15, 95%CI = 1.01-1.30, p = 0.04; I2 = 57.70%, p = 0.04), hyperglycemia (RR = 1.08, 95%CI = 0.88-1.31, p = 0.47; I2 = 81.32%, p< 0.001)and hypertension (RR = 1.13, 95%CI = 1.04-1.24, p = 0.01; I2 = 52.36%, p = 0.06). However, long sleep duration did not increase the risk of hypertriglyceridemia (RR = 1.22, 95% CI = 0.98-1.52, p = 0.07; I2 = 83.85%, p< 0.001) and low HDL (RR = 1.10, 95%CI = 0.98-1.23, p = 0.11; I2 = 52.78%, p = 0.06).
3.3 Sensitivity Analysis and Publication Bias
After excluding one study at a time, the sensitivity analysis confirmed the increased risk of MS for short sleep duration [RR with 95%CI ranging from 1.16 (1.09-1.23) to 1.18 (1.10-1.26)]. Similarly, the significant statistical significance was confirmed by the sensitivity analysis for long sleep duration (RR with 95%CI ranging from 1.18 (1.04-1.35) to 1.22 (1.07-1.39)). No publication bias was detected for short sleep duration (Begg’s test: p = 0.591 and Egger’s test: p = 0.102) and long sleep duration (Begg’s test: p = 1.369 and Egger’s test: p = 0.785). A visual inspection of the funnel plots also did not reveal apparent publication bias (Figure S4).
4 Discussion
In this study, we examined the causal relationship between sleep duration and MS by enrolling cohort studies and using meta-analysis techniques. Our findings suggest that both short and long sleep periods result in an increased risk of MS, and the risk of longer sleep duration is higher than that of short sleep duration. Moreover, the duration of sleep and the risk of MS presented a U-shaped curve. Both short and long sleep periods can increase the risk of MS components, such as obesity and high blood pressure. Short periods of sleep may increase the risk of hyperglycemia, another component of MS. A large sample size of 300,202 participants and the absence of publication bias make our study results more robust. Sensitivity analysis further confirmed the robustness of our conclusion.
Cohort studies move towards results and the temporal sequence between causes and effects is usually clear, whereas cross-sectional studies are difficult to make causal inferences or interpret established associations (23). Long sleep duration has not been found to be associated with an increased risk of MS in previous research (7, 24), which was mostly based on cross-sectional studies (25). Our findings show that both long and short sleep duration are associated with an increased risk of MS. The simplest model and the one with the most adjustments were derived from our meta-analysis. Surprisingly, long sleep had the opposite effect on MS, with the estimated effect in the crude model being non-statistically significant but evident in the adjusted model. This may be the reason why previous systematic evaluations could not yield positive results.
Interestingly, we found that short sleep did not increase the risk of MS in persons older than 65 years. It appears that the amount of sleep required by the elderly is less than that required by the young (26). First, older people slept significantly less than younger people when extremely long mandatory sleep periods were provided (27). This may be due to the fact that older people have lower ad lib sleep needs than younger people. Another interesting finding was that in healthy older adults, after sleep deprivation or experimental slow-wave sleep suppression, slow-wave sleep duration and slow-wave activity (SWA) rebounded more slowly than in younger adults (28, 29). Older people have lower homeostatic sleep buildup than younger people, based on this finding. Another finding is that older people have less subjective and objective sleepiness after selective slow-wave sleep deprivation, even when they’re resting (28). In addition, under sleep deprivation, the elderly showed less impairment in the sleep sensitive alert task than young people (30). There are numerous phenotypic signs of reduced homeostatic sleep drive in older people, which suggests that they require less sleep (27, 28). In other words, as we get older, our sleep requirements become less.
One literature only showed a dose-response relationship between short sleep duration and MS (8). Our meta-analysis collected evidence for further analysis of different sleep duration categories (<6 hours, 6-7 hours, 8-9 hours, and >9 hours). Our meta-regression results showed a U-shaped prediction of dose-dependent responses, which had not been found in previous meta-analyses. In other words, compared to seven to eight hours of sleep, every one-hour decrease in sleep duration corresponds to an 8% increase of the MS risk. Moreover, the risk of MS rises by 12% for each additional one hour of sleep.
Besides, we investigated the relationship between sleep duration and components of MS. Short sleep duration and long sleep duration increased the risk of obesity by 14% and 15%, respectively; the risk of hypertension was increased by 16% and 13%, respectively. Short sleep duration potentially increased the risk of hyperglycemia by 12%, while long sleep duration did not increase the risk of hyperglycemia. The possible reason is that the impaired blood glucose in MS mainly refers to elevated fasting blood glucose. However, many patients with impaired blood glucose present with normal fasting blood glucose and elevated postprandial blood glucose (31). For low-HDL, another component of MS, there was no statistically significant difference between short and long sleep duration.
The underlying mechanisms of the relationship between sleep and MS are not fully understood. The underlying mechanisms linking sleep to MS may differ between short and long term sleep. Several potential pathophysiology mechanisms may contribute to the relationship between short sleep duration and MS. Hormonal changes may be part of the explanation for MS caused by a short sleep. The low level of promoting anorexia hormone leptin and higher hunger hormone ghrelin levels has been found during short sleep in some experimental research (32, 33). Other hormone changes caused by the short sleep periods include an increase in cortisol production at night (34–36), a kind of hormone that can cause insulin resistance and promote weight gain, hyperglycemia and hypertension. Elevated catecholamines lead to increased sympathetic nerve activity, endothelial cell dysfunction, and impaired vasodilation. These changes also contribute to increased blood pressure (37–41). Some short sleep was found to reduce insulin sensitivity in adipocytes and affect the phosphorylation of the serine/threonine kinase Akt in the insulin signaling pathway (42).
The underlying mechanism between longer sleep and an increased risk of MS is currently thought to be speculative. Obstructive sleep apnea (OSA) may be a cause. Risk factors for OSA include snoring, increased body mass index (BMI), and aging. Snoring patients begin sleep with reduced pharyngeal dilator activity, leading to apnea and hypoventilation, and end with a slight awakening that restores muscle activity and reopens the upper airway. Repeated episodes of this can cause sleep fragmentation, which is associated with long periods of sleep. Sleep fragmentation and intermittent hypoxia can increase the excitability of the sympathetic nervous system, resulting in metabolic disorders (43). Moreover, About 70% of OSA patients are obese, which is a component of metabolic syndrome and is associated with insulin resistance. One study showed that weight loss in moderate to severe OSA patients reduced upper respiratory tract collapse and daytime sleepiness (44). Older adults have ventilatory control systems that are out of control. At the same time, older people have more airway collapse and lower ventilation capacity than younger people, and longer sleep associated with OSA makes them more vulnerable to metabolic disorders due to hypoxia (45). Finally, long sleep duration has been associated with several risk factors for MS morbidity, such as depression and low physical activity (46).
In addition, sleep appears to promote inflammatory homeostasis by affecting a variety of inflammatory mediators, such as cytokines. Prolonged sleep disturbances can lead to chronic, systemic, low-grade inflammation and are associated with a variety of diseases with inflammatory components, such as MS. This view is supported by Besedovsky (47). A consequence of MS as a chronic, low-grade inflammation is insulin resistance (48, 49). Various measures associated with the innate immune system have been used to assess low-grade inflammation, including C-reactive protein (CRP), IL-6, WBC count, neutrophil count, and platelet count (50). Studies have shown that short sleep duration is combined with increased inflammatory load (i.e., CRP, IL-6, TNF, and IFN-γ levels) (51). However, many studies have also reported the association between elevated inflammatory markers and long sleep duration (52–54). Although statistical adjustments have been made for various factors, including demographic variables, health behaviors, medication, and comorbidities, the association between long-term sleep duration and elevated inflammatory status is thought to be mediated by uncontrolled disease processes.
It should be noted that the results of this meta-analysis are based on self-reported sleep duration. Some researchers believe there is a common “sleep state misperception “ among people, which means they underestimate how long they sleep. Fernandez-Mendoza found sleep state misperception are present in people with normal sleep duration, but not in people who sleep less. In addition, sleep state misperception was associated with depression, anxiety-reflective personality traits and poor coping resources, but not with other factors, such as gender, age, race and education (55). In addition, different measurement tools of sleep duration may affect the interpretation of the study results and subsequent clinical application (56). Polysomnography (PSG) is the gold standard for measuring sleep, but its use is limited by cumbersome procedures. Matthews (57) proved that self-reported sleep duration was about 20-30 minutes longer than PSG. The sleep estimates assessed by PSG were 7 to 20 minutes longer than sleep duration assessed by activity-recording (57). Self-reported sleep duration is more widely used because it usually consists of a simple retrospective questionnaire given. Notably, self-reported habitual sleep duration was moderately associated not only with PSG sleep duration, but also with activity recording. The overlap variances are 16% and 25-29%, respectively (57, 58). Additionally, there was some heterogeneity in the results. Definitions of MS definitions are inconsistent, although similar in most respects, which may cause some heterogeneity in our results. Finally, the included studies were mainly conducted in Asia, the United States, and Sweden. These findings may not generalize to other ethnic groups.
5 Conclusion
After considering the typical risk factors for MS, both short and long sleep periods can increase the risk of MS. Furthermore, the relationship between the dose of sleep duration and MS risk presented a U-shaped curve. For the components of MS, both short and long sleep increased the risk of obesity and high blood pressure. Short sleep can potentially increase the risk of high blood sugar. However, the exact mechanism that causes this difference is not clear. Clinically doctors and health professionals should be encouraged to increase their efforts to promote healthy sleep for all people. Current trends in sleep disorders indicate the critical importance of integrating healthy sleep into MS control policies. Longer-term randomized controlled trials are needed to establish causality and to elucidate the underlying mechanisms.
Data Availability Statement
The original contributions presented in the study are included in the article/Supplementary Material. Further inquiries can be directed to the corresponding authors.
Author Contributions
Conception and design: ZW, XL, and TC. Data collection and interpretation: TC, CY, and DT. Data analyses: XZ. Manuscript draft and critical review: all authors. Final approval of the study content and manuscript and accountability for data integrity: all authors.
Funding
This work was supported by the National Natural Science Foundation of China (No. 81671835 and No. 32171339), the Key Projects of Tianjin Natural Science Foundation (No. 19JCZDJC36900), and the Tianjin Commission of Science and Technology (No. RC20165 and No. ZC20143).
Conflict of Interest
The authors declare that the research was conducted in the absence of any commercial or financial relationships that could be construed as a potential conflict of interest.
Publisher’s Note
All claims expressed in this article are solely those of the authors and do not necessarily represent those of their affiliated organizations, or those of the publisher, the editors and the reviewers. Any product that may be evaluated in this article, or claim that may be made by its manufacturer, is not guaranteed or endorsed by the publisher.
Acknowledgments
The authors would like to thank the staff and participants of Chu Hsien-I Memorial Hospital. We also thank TopEdit for English language editing.
Supplementary Material
The Supplementary Material for this article can be found online at: https://www.frontiersin.org/articles/10.3389/fendo.2021.773646/full#supplementary-material
References
1. Engin A. The Definition and Prevalence of Obesity and Metabolic Syndrome. Adv Exp Med Biol (2017) 960:1–17. doi: 10.1007/978-3-319-48382-5_1
2. Isomaa B, Almgren P, Tuomi T, Forsen B, Lahti K, Nissen M, et al. Cardiovascular Morbidity and Mortality Associated With the Metabolic Syndrome. Diabetes Care (2001) 24:683–9. doi: 10.2337/diacare.24.4.683
3. Esposito K, Chiodini P, Colao A, Lenzi A, Giugliano D. Metabolic Syndrome and Risk of Cancer: A Systematic Review and Meta-Analysis. Diabetes Care (2012) 35:2402–11. doi: 10.2337/dc12-0336
4. Grundy SM. Drug Therapy of the Metabolic Syndrome: Minimizing the Emerging Crisis in Polypharmacy. Nat Rev Drug Discovery (2006) 5:295–309. doi: 10.1038/nrd2005
5. Di Marzo V, Silvestri C. Lifestyle and Metabolic Syndrome: Contribution of the Endocannabinoidome. Nutrients (2019) 11:1956. doi: 10.3390/nu11081956
6. Ju SY, Choi WS. Sleep Duration and Metabolic Syndrome in Adult Populations: A Meta-Analysis of Observational Studies. Nutr Diabetes (2013) 3:e65. doi: 10.1038/nutd.2013.8
7. Xi B, He D, Zhang M, Xue J, Zhou D. Short Sleep Duration Predicts Risk of Metabolic Syndrome: A Systematic Review and Meta-Analysis. Sleep Med Rev (2014) 18:293–7. doi: 10.1016/j.smrv.2013.06.001
8. Iftikhar IH, Donley MA, Mindel J, Pleister A, Soriano S, Magalang UJ. Sleep Duration and Metabolic Syndrome. An Updated Dose-Risk Metaanalysis. Ann Am Thorac Society (2015) 12:1364–72. doi: 10.1513/AnnalsATS.201504-190OC
9. Wang Y, Mei H, Jiang YR, Sun WQ, Song YJ, Liu SJ, et al. Relationship Between Duration of Sleep and Hypertension in Adults: A Meta-Analysis. J Clin sleep Med JCSM Off Publ Am Acad Sleep Med (2015) 11:1047–56. doi: 10.5664/jcsm.5024
10. Shan Z, Ma H, Xie M, Yan P, Guo Y, Bao W, et al. Sleep Duration and Risk of Type 2 Diabetes: A Meta-Analysis of Prospective Studies. Diabetes Care (2015) 38:529–37. doi: 10.2337/dc14-2073
11. Arora T, Jiang CQ, Thomas GN, Lam KB, Zhang WS, Cheng KK, et al. Self-Reported Long Total Sleep Duration is Associated With Metabolic Syndrome: The Guangzhou Biobank Cohort Study. Diabetes Care (2011) 34:2317–9. doi: 10.2337/dc11-0647
12. Choi JK, Kim MY, Kim JK, Park JK, Oh SS, Koh SB, et al. Association Between Short Sleep Duration and High Incidence of Metabolic Syndrome in Midlife Women. Tohoku J Exp Med (2011) 225:187–93. doi: 10.1620/tjem.225.187
13. Deng HB, Tam T, Zee BC, Chung RY, Su X, Jin L, et al. Short Sleep Duration Increases Metabolic Impact in Healthy Adults: A Population-Based Cohort Study. Sleep (2017) 40:1–28. doi: 10.1093/sleep/zsx130
14. Itani O, Kaneita Y, Tokiya M, Jike M, Murata A, Nakagome S, et al. Short Sleep Duration, Shift Work, and Actual Days Taken Off Work are Predictive Life-Style Risk Factors for New-Onset Metabolic Syndrome: A Seven-Year Cohort Study of 40,000 Male Workers. Sleep Med (2017) 39:87–94. doi: 10.1016/j.sleep.2017.07.027
15. Kim JY, Yadav D, Ahn SV, Koh SB, Park JT, Yoon J, et al. A Prospective Study of Total Sleep Duration and Incident Metabolic Syndrome: The ARIRANG Study. Sleep Med (2015) 16:1511–5. doi: 10.1016/j.sleep.2015.06.024
16. Li X, Lin L, Lv L, Pang X, Du S, Zhang W, et al. U-Shaped Relationships Between Sleep Duration and Metabolic Syndrome and Metabolic Syndrome Components in Males: A Prospective Cohort Study. Sleep Med (2015) 16:949–54. doi: 10.1016/j.sleep.2015.03.024
17. Song Q, Liu X, Zhou W, Wang X, Wu S. Changes in Sleep Duration and Risk of Metabolic Syndrome: The Kailuan Prospective Study. Sci Rep (2016) 6:36861. doi: 10.1038/srep36861
18. Titova OE, Lindberg E, Elmståhl S, Lind L, Schiöth HB, Benedict C. Associations Between the Prevalence of Metabolic Syndrome and Sleep Parameters Vary by Age. Front Endocrinol (2018) 9:234. doi: 10.3389/fendo.2018.00234
19. Yang L, Xu Z, He M, Yang H, Li X, Min X, et al. Sleep Duration and Midday Napping With 5-Year Incidence and Reversion of Metabolic Syndrome in Middle-Aged and Older Chinese. Sleep (2016) 39:1911–8. doi: 10.5665/sleep.6214
20. Ye Y, Zhang L, Wang A, Wang Y, Wang S, Ning G, et al. Association of Sleep Duration With Stroke, Myocardial Infarction, and Tumors in a Chinese Population With Metabolic Syndrome: A Retrospective Study. Lipids Health Disease (2020) 19:155. doi: 10.1186/s12944-020-01328-1
21. Chang JH, Huang PT, Lin YK, Lin CE, Lin CM, Shieh YH, et al. Association Between Sleep Duration and Sleep Quality, and Metabolic Syndrome in Taiwanese Police Officers. Int J Occup Med Environ Health (2015) 28:1011–23. doi: 10.13075/ijomeh.1896.00359
22. Chaput JP, McNeil J, Després JP, Bouchard C, Tremblay A. Short Sleep Duration as a Risk Factor for the Development of the Metabolic Syndrome in Adults. Prev Med (2013) 57:872–7. doi: 10.1016/j.ypmed.2013.09.022
23. Grimes DA, Schulz KF. Cohort Studies: Marching Towards Outcomes. Lancet (2002) 359:341–5. doi: 10.1016/S0140-6736(02)07500-1
24. Xie J, Li Y, Zhang Y, Vgontzas AN, Basta M, Chen B, et al. Sleep Duration and Metabolic Syndrome: An Updated Systematic Review and Meta-Analysis. Sleep Med Rev (2021) 59:101451. doi: 10.1016/j.smrv.2021.101451
25. Hua J, Jiang H, Wang H, Fang Q. Sleep Duration and the Risk of Metabolic Syndrome in Adults: A Systematic Review and Meta-Analysis. Front Neurol (2021) 12:635564. doi: 10.3389/fneur.2021.635564
26. Mander BA, Winer JR, Walker MP. Sleep and Human Aging. Neuron (2017) 94:19–36. doi: 10.1016/j.neuron.2017.02.004
27. Klerman EB, Dijk DJ. Age-Related Reduction in the Maximal Capacity for Sleep–Implications for Insomnia. Curr Biol (2008) 18:1118–23. doi: 10.1016/j.cub.2008.06.047
28. Dijk DJ, Groeger JA, Stanley N, Deacon S. Age-Related Reduction in Daytime Sleep Propensity and Nocturnal Slow Wave Sleep. Sleep (2010) 33:211–23. doi: 10.1093/sleep/33.2.211
29. Munch M, Knoblauch V, Blatter K, Schroder C, Schnitzler C, Krauchi K, et al. The Frontal Predominance in Human EEG Delta Activity After Sleep Loss Decreases With Age. Eur J Neurosci (2004) 20:1402–10. doi: 10.1111/j.1460-9568.2004.03580.x
30. Adam M, Retey JV, Khatami R, Landolt HP. Age-Related Changes in the Time Course of Vigilant Attention During 40 Hours Without Sleep in Men. Sleep (2006) 29:55–7. doi: 10.1093/sleep/29.1.55
31. Yip WCY, Sequeira IR, Plank LD, Poppitt SD. Prevalence of Pre-Diabetes Across Ethnicities: A Review of Impaired Fasting Glucose (IFG) and Impaired Glucose Tolerance (IGT) for Classification of Dysglycaemia. Nutrients (2017) 9:1273. doi: 10.3390/nu9111273
32. Schmid SM, Hallschmid M, Jauch-Chara K, Born J, Schultes B. A Single Night of Sleep Deprivation Increases Ghrelin Levels and Feelings of Hunger in Normal-Weight Healthy Men. J sleep Res (2008) 17:331–4. doi: 10.1111/j.1365-2869.2008.00662.x
33. Spiegel K, Tasali E, Penev P, Van Cauter E. Brief Communication: Sleep Curtailment in Healthy Young Men is Associated With Decreased Leptin Levels, Elevated Ghrelin Levels, and Increased Hunger and Appetite. Ann Internal Med (2004) 141:846–50. doi: 10.7326/0003-4819-141-11-200412070-00008
34. Omisade A, Buxton OM, Rusak B. Impact of Acute Sleep Restriction on Cortisol and Leptin Levels in Young Women. Physiol behavior (2010) 99:651–6. doi: 10.1016/j.physbeh.2010.01.028
35. Spiegel K, Leproult R, L'Hermite-Baleriaux M, Copinschi G, Penev PD, Van Cauter E. Leptin Levels are Dependent on Sleep Duration: Relationships With Sympathovagal Balance, Carbohydrate Regulation, Cortisol, and Thyrotropin. J Clin Endocrinol Metab (2004) 89:5762–71. doi: 10.1210/jc.2004-1003
36. Spiegel K, Leproult R, Van Cauter E. Impact of Sleep Debt on Metabolic and Endocrine Function. Lancet (London England) (1999) 354:1435–9. doi: 10.1016/S0140-6736(99)01376-8
37. Ogawa Y, Kanbayashi T, Saito Y, Takahashi Y, Kitajima T, Takahashi K, et al. Total Sleep Deprivation Elevates Blood Pressure Through Arterial Baroreflex Resetting: A Study With Microneurographic Technique. Sleep (2003) 26:986–9. doi: 10.1093/sleep/26.8.986
38. Zhong X, Hilton HJ, Gates GJ, Jelic S, Stern Y, Bartels MN, et al. Increased Sympathetic and Decreased Parasympathetic Cardiovascular Modulation in Normal Humans With Acute Sleep Deprivation. J Appl Physiol (Bethesda Md. 1985) (2005) 98:2024–32. doi: 10.1152/japplphysiol.00620.2004
39. Sauvet F, Leftheriotis G, Gomez-Merino D, Langrume C, Drogou C, Van Beers P, et al. Effect of Acute Sleep Deprivation on Vascular Function in Healthy Subjects. J Appl Physiol (Bethesda Md. 1985) (2010) 108:68–75. doi: 10.1152/japplphysiol.00851.2009
40. Calvin AD, Covassin N, Kremers WK, Adachi T, Macedo P, Albuquerque FN, et al. Experimental Sleep Restriction Causes Endothelial Dysfunction in Healthy Humans. J Am Heart Assoc (2014) 3:e001143. doi: 10.1161/JAHA.114.001143
41. Yang H, Durocher JJ, Larson RA, Dellavalla JP, Carter JR. Total Sleep Deprivation Alters Cardiovascular Reactivity to Acute Stressors in Humans. J Appl Physiol (Bethesda Md. 1985) (2012) 113:903–8. doi: 10.1152/japplphysiol.00561.2012
42. Broussard JL, Ehrmann DA, Van Cauter E, Tasali E, Brady MJ. Impaired Insulin Signaling in Human Adipocytes After Experimental Sleep Restriction: A Randomized, Crossover Study. Ann Internal Med (2012) 157:549–57. doi: 10.7326/0003-4819-157-8-201210160-00005
43. Ma J, Zhang H, Wang H, Gao Q, Sun H, He S, et al. Association Between Self-Reported Snoring and Metabolic Syndrome: A Systematic Review and Meta-Analysis. Front Neurol (2020) 11:517120. doi: 10.3389/fneur.2020.517120
44. Smith PL, Gold AR, Meyers DA, Haponik EF, Bleecker ER. Weight Loss in Mildly to Moderately Obese Patients With Obstructive Sleep Apnea. Ann Internal Med (1985) 103:850–5. doi: 10.7326/0003-4819-103-6-850
45. Edwards BA, Wellman A, Sands SA, Owens RL, Eckert DJ, White DP, et al. Obstructive Sleep Apnea in Older Adults is a Distinctly Different Physiological Phenotype. Sleep (2014) 37:1227–36. doi: 10.5665/sleep.3844
46. Patel SR, Malhotra A, Gottlieb DJ, White DP, Hu FB. Correlates of Long Sleep Duration. Sleep (2006) 29:881–9. doi: 10.1093/sleep/29.7.881
47. Besedovsky L, Lange T, Haack M. The Sleep-Immune Crosstalk in Health and Disease. Physiol Rev (2019) 99:1325–80. doi: 10.1152/physrev.00010.2018
48. Saltiel AR, Olefsky JM. Inflammatory Mechanisms Linking Obesity and Metabolic Disease. J Clin Invest (2017) 127:1–4. doi: 10.1172/JCI92035
49. Wang M, Norman JE, Srinivasan VJ, Rutledge JC. Metabolic, Inflammatory, and Microvascular Determinants of White Matter Disease and Cognitive Decline. Am J Neurodegener Dis (2016) 5:171–7.
50. Krabbe KS, Reichenberg A, Yirmiya R, Smed A, Pedersen BK, Bruunsgaard H. Low-Dose Endotoxemia and Human Neuropsychological Functions. Brain Behav Immun (2005) 19:453–60. doi: 10.1016/j.bbi.2005.04.010
51. Smagula SF, Stone KL, Redline S, Ancoli-Israel S, Barrett-Connor E, Lane NE, et al. Actigraphy- and Polysomnography-Measured Sleep Disturbances, Inflammation, and Mortality Among Older Men. Psychosom Med (2016) 78:686–96. doi: 10.1097/PSY.0000000000000312
52. Carroll JE, Irwin MR, Stein Merkin S, Seeman TE. Sleep and Multisystem Biological Risk: A Population-Based Study. PloS One (2015) 10:e0118467. doi: 10.1371/journal.pone.0118467
53. Clark AJ, Dich N, Lange T, Jennum P, Hansen AM, Lund R, et al. Impaired Sleep and Allostatic Load: Cross-Sectional Results From the Danish Copenhagen Aging and Midlife Biobank. Sleep Med (2014) 15:1571–8. doi: 10.1016/j.sleep.2014.07.013
54. Prather AA, Vogelzangs N, Penninx BW. Sleep Duration, Insomnia, and Markers of Systemic Inflammation: Results From the Netherlands Study of Depression and Anxiety (NESDA). J Psychiatr Res (2015) 60:95–102. doi: 10.1016/j.jpsychires.2014.09.018
55. Fernandez-Mendoza J, Calhoun SL, Bixler EO, Karataraki M, Liao D, Vela-Bueno A, et al. Sleep Misperception and Chronic Insomnia in the General Population: Role of Objective Sleep Duration and Psychological Profiles. Psychosomatic Med (2011) 73:88–97. doi: 10.1097/PSY.0b013e3181fe365a
56. Lauderdale DS, Knutson KL, Yan LL, Liu K, Rathouz PJ. Self-Reported and Measured Sleep Duration: How Similar are They? Epidemiology (2008) 19:838–45. doi: 10.1097/EDE.0b013e318187a7b0
57. Matthews KA, Patel SR, Pantesco EJ, Buysse DJ, Kamarck TW, Lee L, et al. Similarities and Differences in Estimates of Sleep Duration by Polysomnography, Actigraphy, Diary, and Self-Reported Habitual Sleep in a Community Sample. Sleep Health (2018) 4:96–103. doi: 10.1016/j.sleh.2017.10.011
Keywords: sleep duration, metabolic syndrome, meta-analysis, obesity, diabetes
Citation: Che T, Yan C, Tian D, Zhang X, Liu X and Wu Z (2021) The Association Between Sleep and Metabolic Syndrome: A Systematic Review and Meta-Analysis. Front. Endocrinol. 12:773646. doi: 10.3389/fendo.2021.773646
Received: 10 September 2021; Accepted: 01 November 2021;
Published: 19 November 2021.
Edited by:
James Harper, Sam Houston State University, United StatesCopyright © 2021 Che, Yan, Tian, Zhang, Liu and Wu. This is an open-access article distributed under the terms of the Creative Commons Attribution License (CC BY). The use, distribution or reproduction in other forums is permitted, provided the original author(s) and the copyright owner(s) are credited and that the original publication in this journal is cited, in accordance with accepted academic practice. No use, distribution or reproduction is permitted which does not comply with these terms.
*Correspondence: Xuejun Liu, bGl1eHVlanVuMDIxOUAxNjMuY29t; Zhongming Wu, d3V6aG9uZ21pbmdAdG11LmVkdS5jbg==
†ORCID: Zhongming Wu, orcid.org/0000-0003-4133-9759