 Jinyun Wang1,2,3†
 Dingwei Liu
 Yong Xie
- 1Department of Gastroenterology, Digestive Disease Hospital, The First Affiliated Hospital of Nanchang University, Nanchang, Jiangxi, China
- 2Department of Gastroenterology, The First Affiliated Hospital of Nanchang University, Nanchang, Jiangxi, China
- 3Department of Gastroenterology, JiangXi Clinical Research Center for Gastroenterology, The First Affiliated Hospital of Nanchang University, Nanchang, China
Objective: Current evidence on the associations between plasma thyroid stimulating hormone and Helicobacter pylori infection is conflicting. Therefore, our study aimed to examine TSH in relation to H. pylori infection.
Methods: Based on the US National Health and Nutrition Examination Survey (NHANES) 1999-2000, a cross-sectional study was conducted with 948 participants aged 30 to 85 years. The associations between H. pylori seropositivity and TSH were evaluated using binary logistic regression models. A subgroup analysis stratified by sex, age, and body mass index was conducted.
Results: A higher serum TSH level was found in subjects with H. pylori seropositive than in subjects with H. pylori seronegative. A significant positive association was found between H. pylori seropositivity and TSH with increasing quartiles of hormonal levels in univariate regression models (Q4 vs Q1: OR = 1.659; 95% CI, 1.152-2.389) and in multivariate regression models (Q4 vs Q1: OR = 1.604; 95% CI, 1.087-2.367). In stratified analyses, the adjusted association of serum TSH with H. pylori seropositivity was statistically significant in male (Q4 vs Q1: OR = 1.894; 95% CI, 1.109-3.235), normal BMI (Q4 vs Q1: OR = 1.894; 95% CI, 1.109-3.235), overweight (Q4 vs Q1: OR = 2.124; 95% CI, 1.047-4.308);, obese (Q4 vs Q1: OR = 0.429; 95% CI, 0.220-0.837), and age over 60 years (Q4 vs Q1: OR = 1.999; 95% CI, 1.118-3.575).
Conclusion: High TSH levels were associated with H. pylori infection, especially among male, overweight and elderly adults.
1 Introduction
Helicobacter pylori, a gastric pathogen infecting more than half of the world’s population, which leads to chronic inflammation of the gastric mucosa (1). H. pylori infection has been associated with many gastric diseases, including chronic gastritis, peptic ulcers, gastric cancer, and mucosa-associated lymphoid tissue lymphoma (2). Furthermore, H. pylori infection has been proven to be associated with many extra-gastric diseases, such as autoimmune thyroid diseases, metabolic, neurological, and cardiovascular diseases (3–8).
A high level of thyroid stimulating hormone can negatively affect metabolic health in the euthyroid state (9). Previous studies have examined the role of H. pylori in thyroid disease (10). Silva et al. found that H. pylori Infection is associated with thyroid dysfunction in children with congenital hypothyroidism (11). Bugdaci et al. found that patients with hypothyroidism could not be achieved normal thyrotropin levels despite treatment with high doses of thyroxine under the condition of H. pylori infection (12). In addition, the association between H. pylori infection and treatment-refractory hypothyroidism has been proven (13, 14). TSH reflects both hypothyroidism and subclinical hyperthyroidism as a sensitive marker of thyroid function (15).However, the relationship between H. pylori infection and plasma TSH in the general population is limited and controversial (16–19).
In this study, we evaluated the association between H. pylori seroprevalence and plasma TSH level based on data from the 1999–2000 National Health and Nutrition Examination Survey (NHANES). Previous studies have reported that age (20), sex (21), race (22, 23), BMI (24), waist circumference (25), household size (26), education level (27), smoking behavior (25), alcohol behavior (28)and serum C-reactive protein (29) may were associated with H. pylori infection, so this study includes these variables for analysis.
2 Materials and methods
2.1 Study design
NHANES is a representative survey of the general US population, providing a wide range of information about the health and nutrition of the general population, and utilizing a complex, multistage, and probability sampling design to provide information about nutrition and health for the general US population (30, 31). Study data were collected from the US National Health and Nutrition Examination Survey (NHANES) 1999–2000. Because participants of this cycle included both H. pylori infection and plasma thyroid stimulating hormone data.
2.2 Sample size
Sample size was calculated assuming the following parameters: alpha error = 0.05, power = 80%, expected effect size: odds ratio (OR) = 1.5 (for the TSH as a risk factor), prevalence of H. pylori (outcome) = 0.50. A total of 150 participants were needed in the study. Considering the influence of other confounding factors, we expand the sample size as much as possible.
2.3 Study participants, inclusion criteria and exclusion criteria
In NHANES 1999–2000 cycle, 9965 subjects participated. After excluding subjects without information on laboratory and demographic variables, individuals with thyroid disease and those taking thyroid medications (32). 948 subjects were finally included for analyses. The sample selection flow chart is presented in Figure 1.
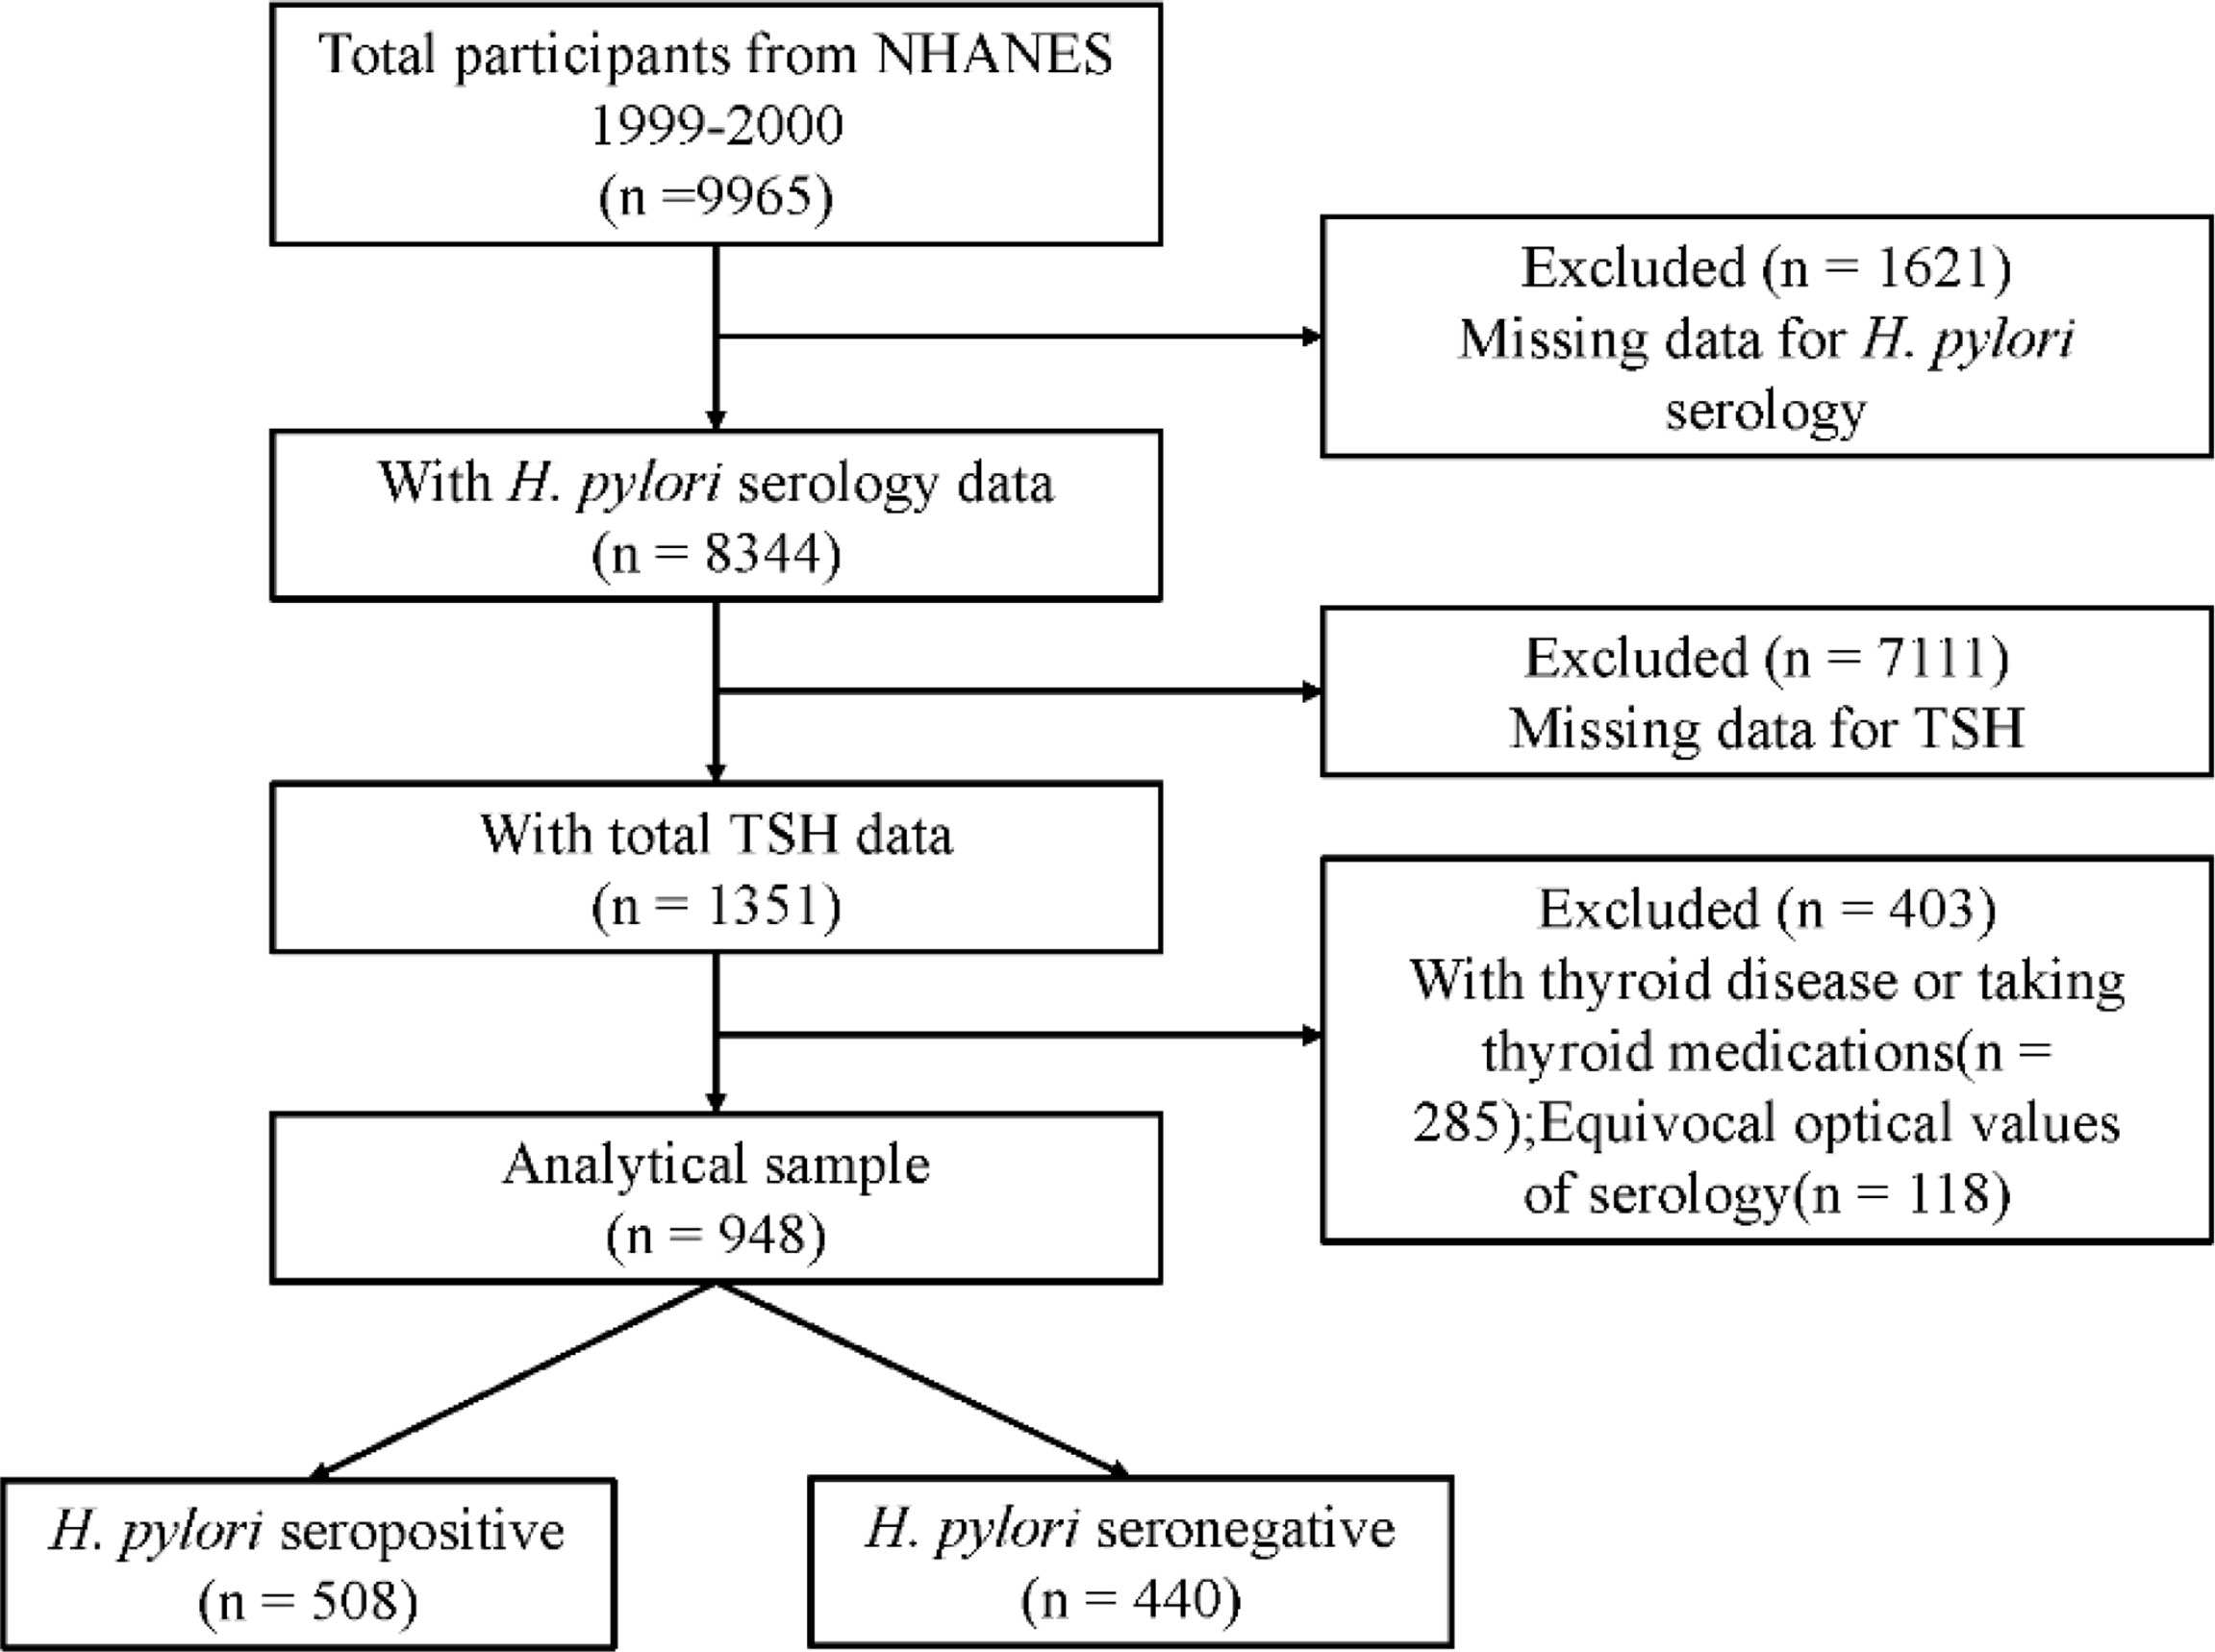
Figure 1 The sample selection flow chart.
2.4 Helicobacter pylori status
NHANES assessed H. pylori exposure by IgG antibody detection using an enzyme-linked immunoassay(ELISA) (33). Raw IgG results were not published as part of the NHANES datasets. The sensitivity, specificity, and reproducibility of ELISA were comparable to other serological tests for antibodies, such as immunofluorescence, complement fixation, hemagglutination, and radioimmunoassays (34, 35). Standard ELISA cut-offs were used to categorize participants into seropositive (optical density (OD) value ≥1.1) or seronegative (OD value <0.9) to H. pylori (36). Equivocal values (0.9–1.1) were excluded to prevent misleading statistical outcomes in this study (31).
2.5 Thyroid stimulating hormone
In this study, the dependent variable was H. pylori seropositivity, and the targeted independent variable was plasma thyroid stimulating hormone(TSH). The measurements of TSH were determined by the IMx ultrasensitive hTSH II microparticle enzyme immunoassay technique (37). serum TSH were obtained from the NHANES laboratory data files. Thyroid medications were identified in the prescription drug medication document.
2.6 Covariates
In this study, we added several covariates based on previous studies (31, 35, 36, 38), finally including age, sex, race, BMI, waist circumference, household size, education level, smoking behavior, alcohol behavior and serum C reactive protein. For covariates, sex, race, educational level, BMI, household size, education level, alcohol behavior and smoking behavior were used as categorical variables; age, waist circumference and serum C reactive protein were used as continuous variables. More detailed information on H. pylori seropositivity, serum TSH, and the covariates is publicly available at http://www.cdc.gov/nchs/nhanes/.
2.7 Statistical analyses
Continuous variables are presented as mean ± SD, and categorical variables are reported as numbers and percentages (15). The baseline characteristics among the different groups were compared using Chi-square test, Student’s t test, and Fisher’s exact test, as appropriate (15). The TSH levels were stratified into quartiles (Q1 to Q4). Subsequently, logistic regression models were used to assess the independent association between H. pylori seropositivity and TSH levels. In model 1, we adjusted no factors. In model 2, we adjusted age, sex, and BMI. Model 3 was additionally adjusted for race, educational level and household size. Differences with P < 0.05 were considered statistically significant. Finally, we stratified the above analyses by potential effect modifiers, including age groups, sex and BMI. In addition, the regression analyses were reported as ORs and 95% CIs. All statistical analyses were performed using SPSS version 26.
3 Results
3.1 Characteristics of included subjects
A total of 948 subjects were included in final analyses, of which 508 (53.59%) subjects were H. pylori seropositive and 440 (46.41%) subjects were H. pylori seronegative. In these two groups, age, race, household size, educational level and TSH were significantly different (P < 0.05). Compared with H. pylori seronegative individuals, patients with H. pylori seropositive had higher TSH levels (mean TSH, 2.02 IU/L vs 1.96 IU/L). More details are presented in Table 1 and Figure 2.
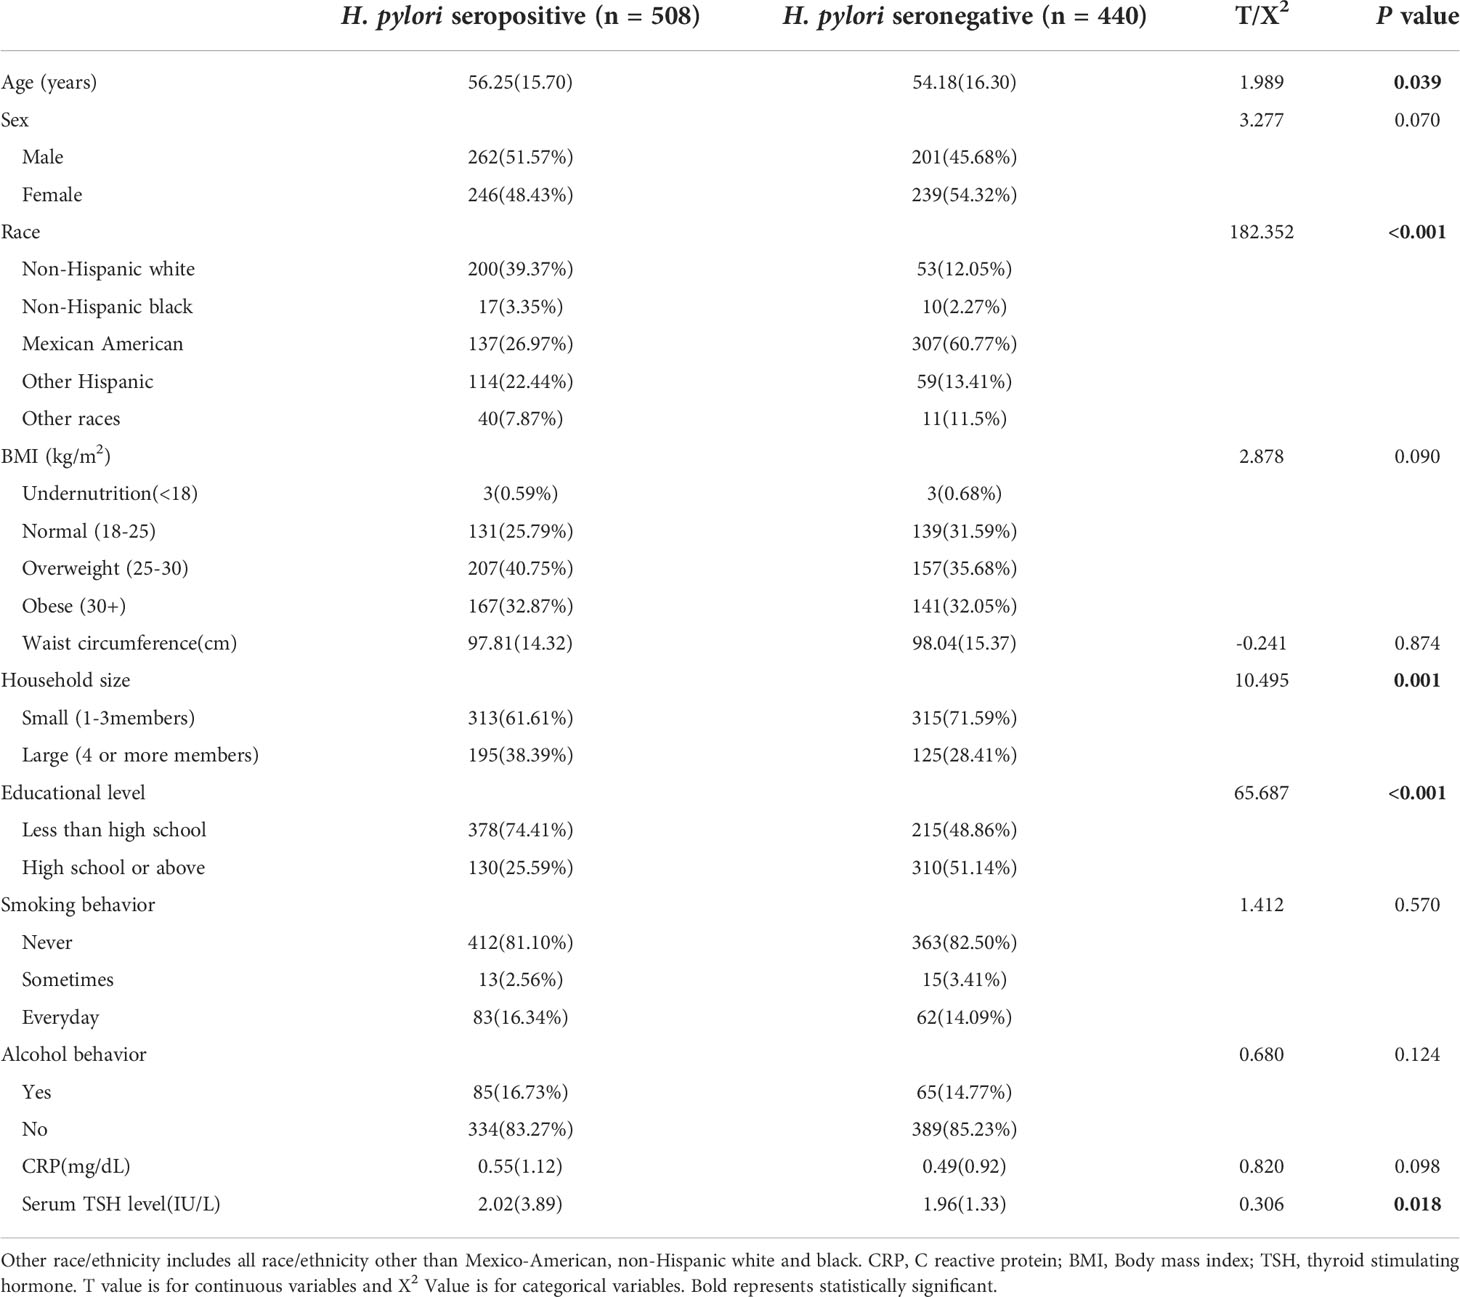
Table 1 Weighted characteristics of included subjects.
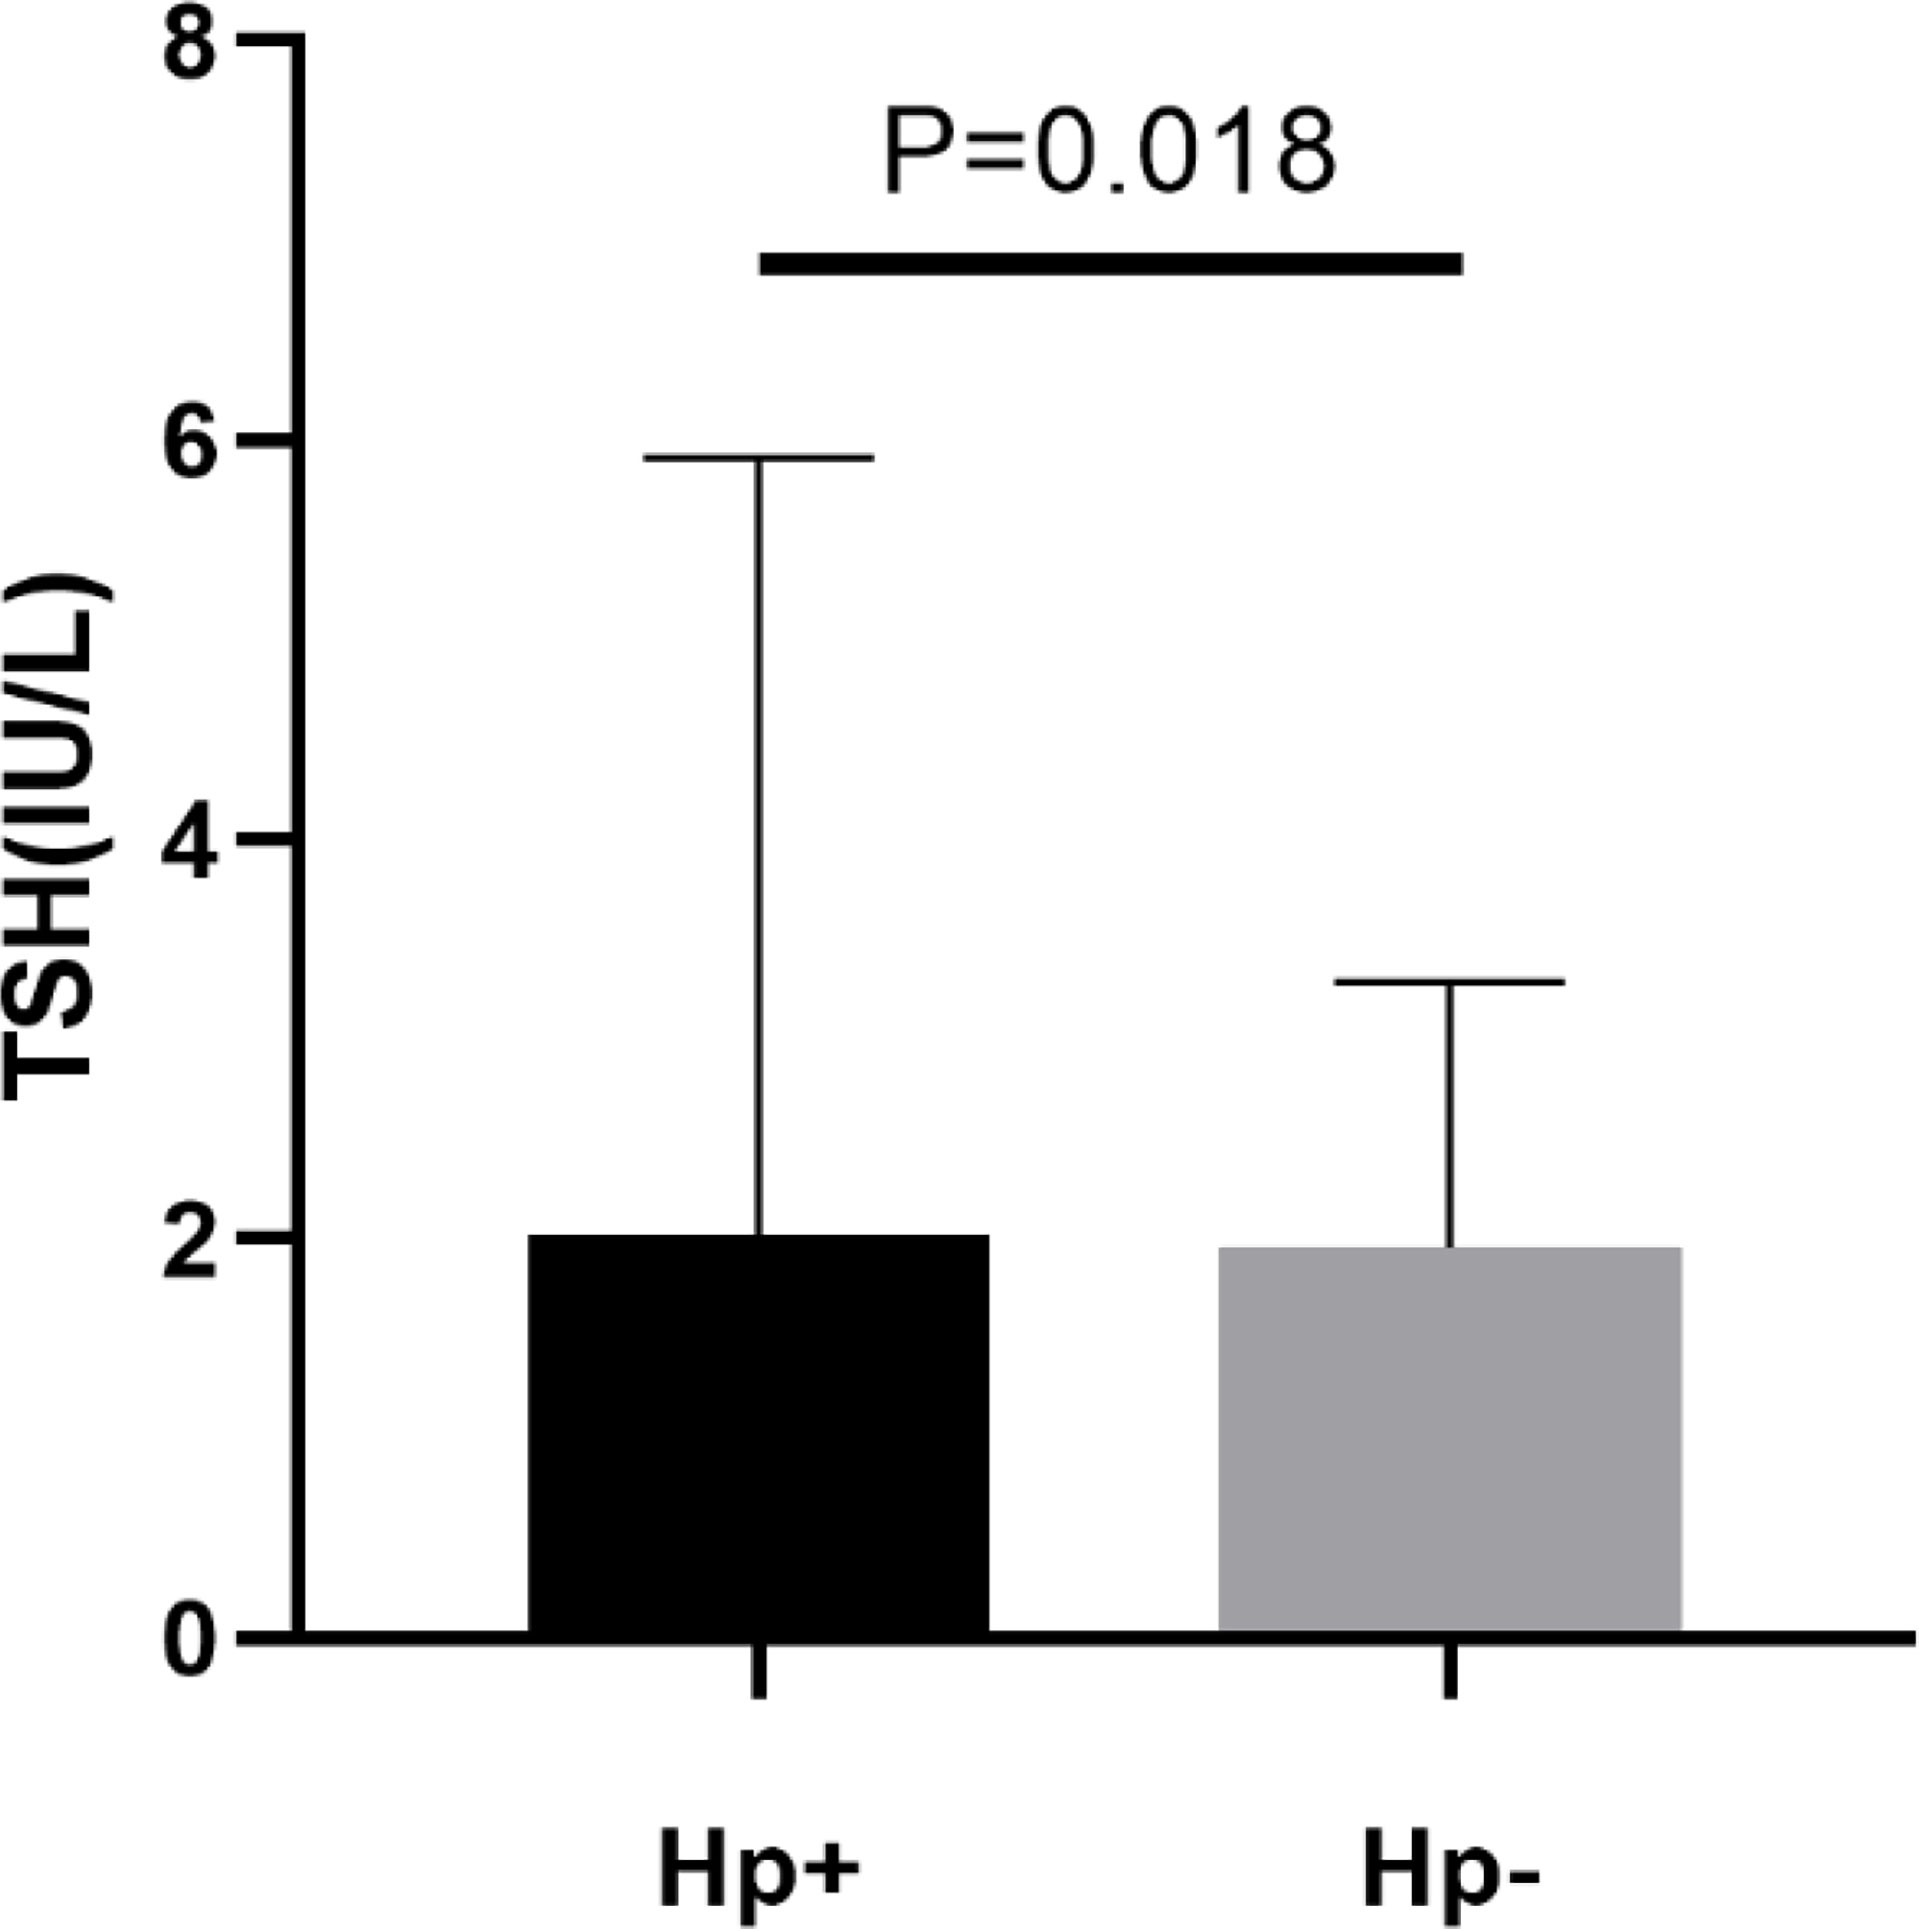
Figure 2 Levels of plasma thyroid stimulating hormone (TSH) in patients with H. pylori seropositive (Hp+) and H. pylori seronegative (Hp-).
3.2 Association between H. pylori Seropositivity and TSH
3.2.1 Multiple regression model
Three weighted univariate and multivariate regression models were constructed: model 1, unadjusted; model 2, age, sex, and BMI that were adjusted; and model 3, covariates presented in Table 2 that were adjusted. In the unadjusted model, a significant positive association was found between H. pylori seropositivity and TSH with increasing quartiles of hormonal levels (Q4 vs Q1: OR = 1.659; 95% CI, 1.152-2.389; P=0.006). Furthermore, this association still existed after adjusting for confounding factors in the model 2 (Q4 vs Q1: OR = 1.794; 95% CI, 1.236-2.605; P=0.002) and model 3 (Q4 vs Q1: OR = 1.604; 95% CI, 1.087-2.367; P=0.017). Details are presented in Table 2.
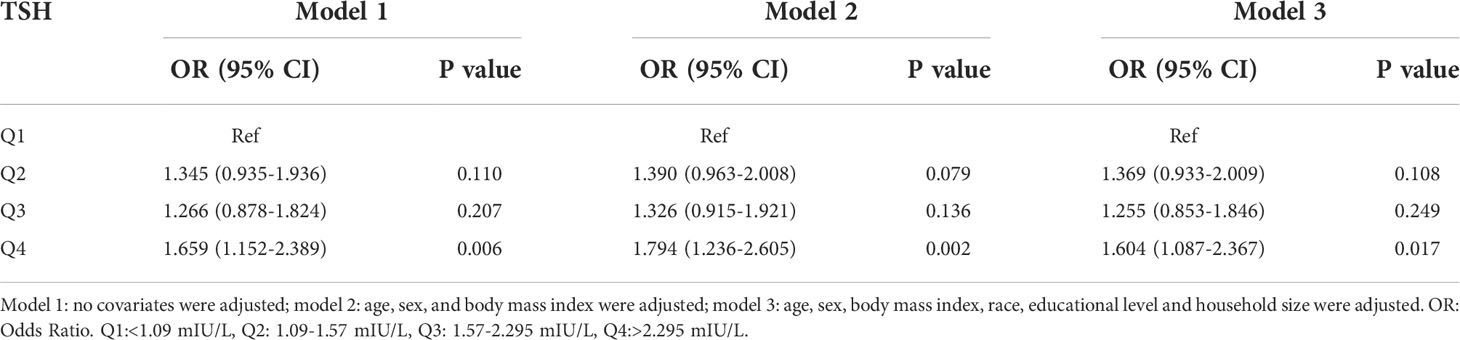
Table 2 Association of thyroid stimulating hormone level with Helicobacter pylori seropositivity.
3.2.2 Subgroup analyses
In the subgroup analyses stratified by sex, a positive association was observed between the H. pylori seropositivity and TSH in male (Q4 vs Q1: OR = 1.894; 95% CI, 1.109-3.235; P=0.019). However, this association disappeared after adjusting for confounding factors in the multivariate regression model (Q4 vs Q1: OR = 1.659; 95% CI, 0.942-2.920; P=0.080). The TSH was not related to H. pylori seropositivity in female. Details are presented in Table 3.
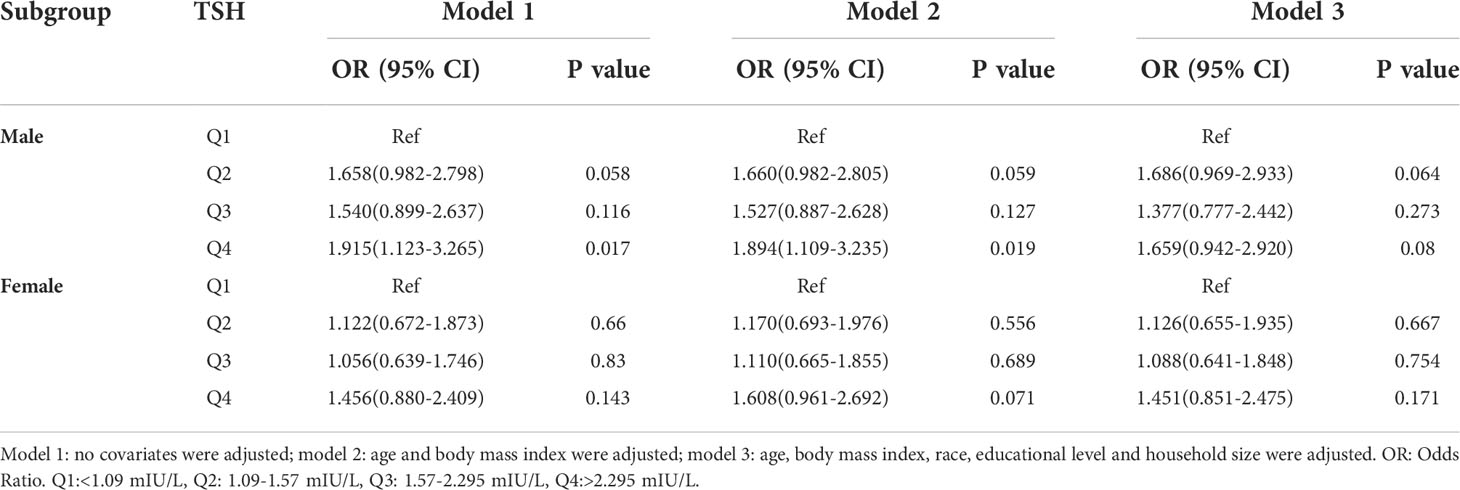
Table 3 Association of thyroid stimulating hormone level with Helicobacter pylori seropositivity based on subgroup of sex.
In the subgroup analyses stratified by BMI categories, a positive association was found between H. pylori seropositivity and TSH among normal (Q4 vs Q1: OR = 1.894; 95% CI, 1.109-3.235; P=0.019) and overweight (Q4 vs Q1: OR = 2.124; 95% CI, 1.047-4.308; P=0.037) subjects in model 2. However, a negative association was found between H. pylori seropositivity and TSH among obese subjects in model 2 (Q4 vs Q1: OR = 0.468; 95% CI, 0.248-0.886; P=0.020) and model 3 (Q4 vs Q1: OR = 0.429; 95% CI, 0.220-0.837; P=0.013). No statistically significant association was shown in any other model. Details are presented in Table 4.
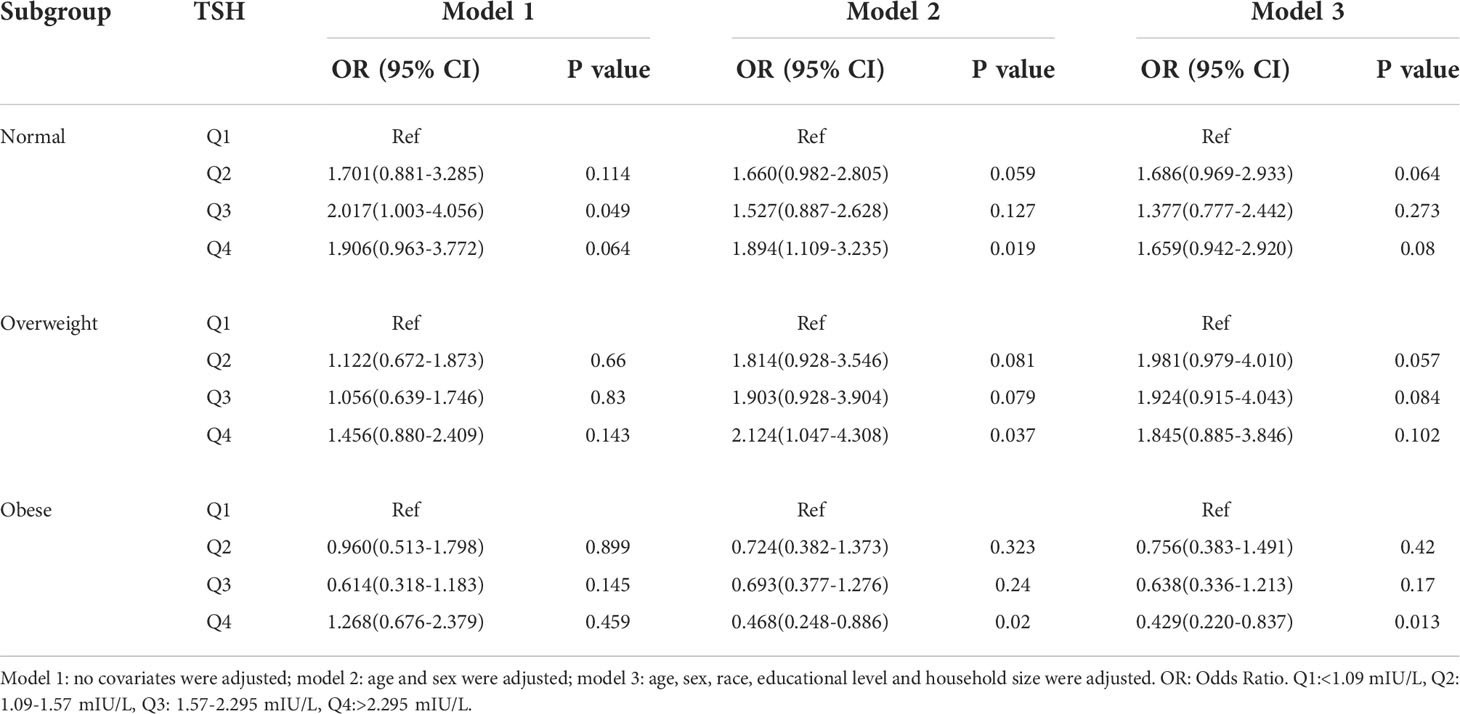
Table 4 Association of thyroid stimulating hormone level with Helicobacter pylori seropositivity based on subgroup of BMI.
In the subgroup analyses stratified by age, a positive association was observed between the H. pylori seropositivity and TSH among subjects aged over 60 years (Q4 vs Q1: OR = 1.999; 95% CI, 1.118-3.575; P=0.020); however, the TSH was not related to H. pylori seropositivity in other groups. Details are presented in Table 5.
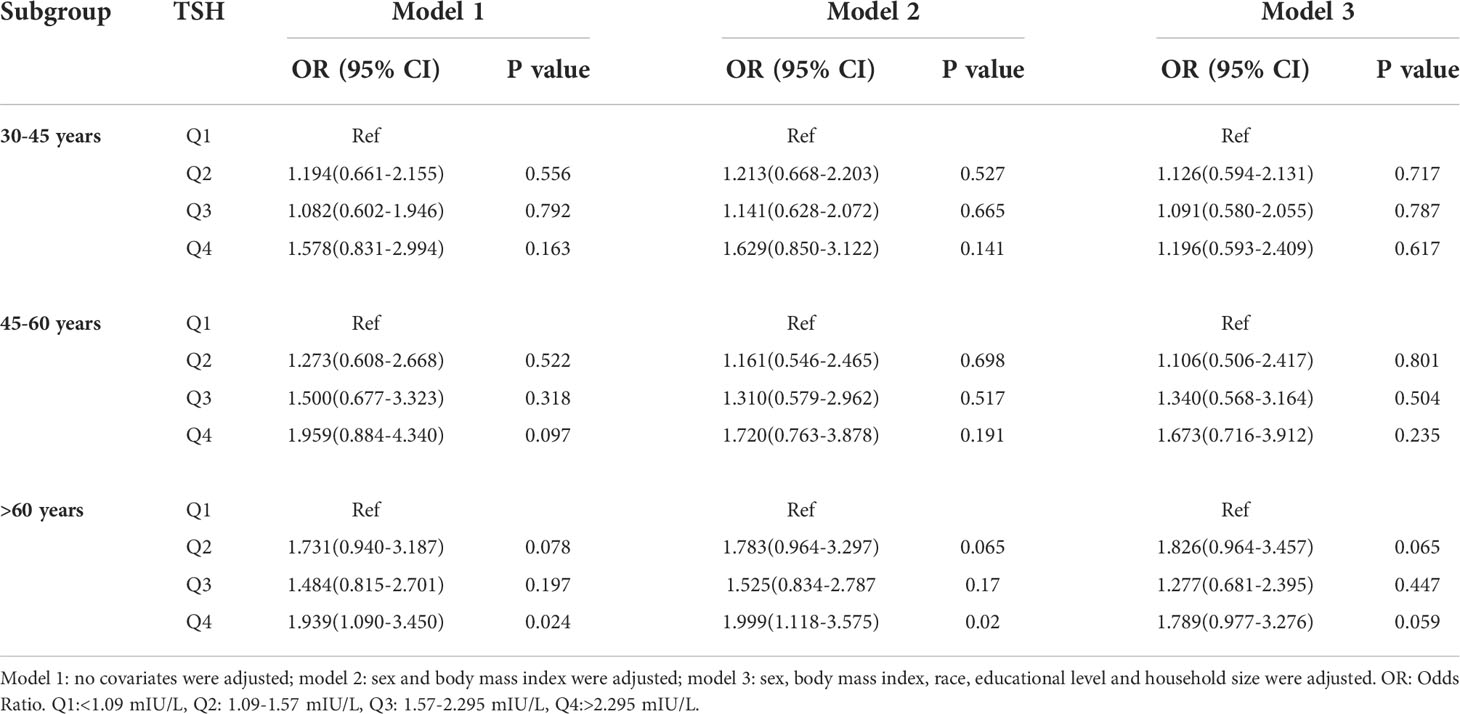
Table 5 Association of thyroid stimulating hormone level with Helicobacter pylori seropositivity based on subgroup of age.
4 Discussion
In this study, we conducted observational association analyses between TSH and H. pylori infection in the NHANES 1999-2000 dataset. To the best of our knowledge, this study is the first to demonstrate that high TSH levels might be significantly induce an increased risk of H. pylori infection using the data from NHANES. NHANES is characterized by a rigorous sampling design from the national population of the United States, high-quality research measurement, and detailed quality control procedures (31).
The results of this study suggest that there is a positive relationship between H. pylori seropositivity and TSH. In stratified analyses, the adjusted association of serum TSH with H. pylori seropositivity was statistically significant in male not female, and age over 60 years. Different TSH levels represent different thyroid function. NHANES documents provide a normal TSH reference range of 0.34-5.6mIU/L according to manufacturer guidelines (39).
Houston Consensus on H. pylori infection stated that H. pylori testing be considered in patients treated with medications whose absorption is known to be impacted by infection, such as thyroxin (40). Therefore, there must be a correlation between H. pylori infection and thyroid function. The mechanism by which high TSH increases the risk of H. pylori infection remains to be elucidated in detail. Based on the evidence available to date, it was reported that half-emptying time for liquids correlated with TSH level (r = 0.83, P < 0.0001) in type 1 diabetic patients (41). A review was also reported that TSH influence gastrointestinal function (42). We can speculate that low gastric motility may in relation to TSH level, which may lead to the gastric environment favorable to the colonization by H. pylori (43). Such changes could involve the microbiota imbalance in gastric mucosa. Zhang et al. has reported that remodeling of the gut microbiota structure could inhibit the occurrence of gastric antral inflammation and promote gastric motility (44).In addition, current data has clarified the association of obesity with GI motility disorders, which due to the decrease of ghrelin and imbalance of gut microbiota and gut-brain axis (45), all above may be an explanation of a negative association between H. pylori seropositivity and TSH levels in obese subjects, its own gastric motility disorder exceeds that caused by high TSH, which thus weakening the risk of TSH in H. pylori infection.
It was found that no significant differences in serum levels of TSH between lean and overweight/obese subjects (46). A mendelian randomization study has provided no evidence for a clinically relevant association between H. pylori and BMI/obesity (47). This was consistent with our results. The longer history of using birth control pills was strongly associated with hypothyroidism, especially for more than 10 years (39). Indeed, this may be an explanation of no significant association between H. pylori seropositivity and TSH levels in female. Due to the feature of NHANES database, this study failed to include data on contraceptive use, the persuasion of correlation between H. pylori seropositivity and TSH levels in female cohort was weak. Previous study has found that H. pylori seropositivity rates were higher in subjects with four or more household members (48, 49). This was consistent with our finding. The above results can prove that our cohort population has universal H. pylori epidemic characteristics, and the research results obtained under this cohort have strong persuasiveness. Overall, the current available data are limited, and further mechanistic studies are still necessary.
However, there are limitations to our studies. First, the data used in this study are not current because the date of serum TSH levels and H. pylori seropositivity is only provided in NHANES 1999-2000. Second, this study was designed as a cross-sectional study, which did not allow us to determine the causality between TSH levels and H. pylori seropositivity. Third, the bias caused by other potential confounding factors that did not be adjusted in this study, such as hypertension and diabetes, which may affect the results. At last, supplementing T3, T4 and serum iodine data may be more persuasive but the data is unavailable in this cycle.
5 Conclusion
In conclusion, circulating TSH levels were associated with the risk of H. pylori infection, especially among male, overweight and elderly adults. These people should focus on H. pylori screening because H. pylori is closely related to gastric cancer.
Data availability statement
The original contributions presented in the study are included in the article/supplementary material. Further inquiries can be directed to the corresponding author.
Ethics statement
Ethical review and approval was not required for the study on human participants in accordance with the local legislation and institutional requirements. Written informed consent for participation was not required for this study in accordance with the national legislation and the institutional requirements.
Author contributions
YX designed the experiment and supervised the study. DL contributed to formal analysis, JW wrote the manuscript. YX reviewed and revised the manuscript. All authors read and approved the final manuscript.
Funding
This study was supported by the National Natural Science Foundation of China [No.81970502, No.81860107, No.82060109] and the Science and Technology Project of Jiangxi Province [No.20203BBG73051, No.20201ZDG02007].
Conflict of interest
The authors declare that the research was conducted in the absence of any commercial or financial relationships that could be construed as a potential conflict of interest.
Publisher’s note
All claims expressed in this article are solely those of the authors and do not necessarily represent those of their affiliated organizations, or those of the publisher, the editors and the reviewers. Any product that may be evaluated in this article, or claim that may be made by its manufacturer, is not guaranteed or endorsed by the publisher.
References
1. Varon C, Azzi-Martin L, Khalid S, Seeneevassen L, Ménard A, Spuul P. Helicobacters and cancer, not only gastric cancer? Semin Cancer Biol (2021) 86(Pt 2):1138–54. doi: 10.1016/j.semcancer.2021.08.007
2. Atherton JC. The pathogenesis of helicobacter pylori-induced gastro-duodenal diseases. Annu Rev Pathol (2006) 1:63–96. doi: 10.1146/annurev.pathol.1.110304.100125
3. Astl J, Sterzl I. Activation of helicobacter pylori causes either autoimmune thyroid diseases or carcinogenesis in the digestive tract. Physiol Res (2015) 64(Suppl 2):S291–301. doi: 10.33549/physiolres.933118
4. Faria C, Zakout R, Araujo M. Helicobacter pylori and autoimmune diseases. BioMed Pharmacother (2013) 67(4):347–9. doi: 10.1016/j.biopha.2011.09.015
5. He C, Yang Z, Lu NH. Helicobacter pylori infection and diabetes: Is it a myth or fact? World J Gastroenterol (2014) 20(16):4607–17. doi: 10.3748/wjg.v20.i16.4607
6. Kucukazman M, Yeniova O, Dal K, Yavuz B. Helicobacter pylori and cardiovascular disease. Eur Rev Med Pharmacol Sci (2015) 19(19):3731–41.
7. Ju Z, Shen L, Zhou M, Luo J, Yu Z, Qu C, et al. Helicobacter pylori and alzheimer's disease-related metabolic dysfunction: Activation of TLR4/Myd88 inflammation pathway from p53 perspective and a case study of low-dose radiation intervention. ACS Chem Neurosci (2022) 13(7):1065–81. doi: 10.1021/acschemneuro.2c00082
8. Shi WJ, Liu W, Zhou XY, Ye F, Zhang GX. Associations of helicobacter pylori infection and cytotoxin-associated gene a status with autoimmune thyroid diseases: A meta-analysis. Thyroid (2013) 23(10):1294–300. doi: 10.1089/thy.2012.0630
9. Kim D, Vazquez-Montesino LM, Escober JA, Fernandes CT, Cholankeril G, Loomba R, et al. Low thyroid function in nonalcoholic fatty liver disease is an independent predictor of all-cause and cardiovascular mortality. Am J Gastroenterol (2020) 115(9):1496–504. doi: 10.14309/ajg.0000000000000654
10. Wang Y, Zhu S, Xu Y, Wang X, Zhu Y. Interaction between gene a-positive helicobacter pylori and human leukocyte antigen II alleles increase the risk of graves disease in Chinese han population: An association study. Gene (2013) 531(1):84–9. doi: 10.1016/j.gene.2013.07.069
11. Silva IN, Marcal LV, Queiroz D. Helicobacter pylori infection is associated with thyroid dysfunction in children with congenital hypothyroidism. Front Pediatr (2022) 10:875232. doi: 10.3389/fped.2022.875232
12. Bugdaci MS, Zuhur SS, Sokmen M, Toksoy B, Bayraktar B, Altuntas Y. The role of helicobacter pylori in patients with hypothyroidism in whom could not be achieved normal thyrotropin levels despite treatment with high doses of thyroxine. Helicobacter (2011) 16(2):124–30. doi: 10.1111/j.1523-5378.2011.00830.x
13. Jamil Sr Salman MZZ S, Akhtar M, Iqbal S, Bhalli A, Farooq H. Determining the association between helicobacter pylori infection and treatment-refractory hypothyroidism. Cureus (2022) 14(1):e21316. doi: 10.7759/cureus.21316
14. Mirgoli OJ, Ramjas V, Munugoti S, Silverstein H, Malik F, Salem A, et al. An unusual cause of refractory hypothyroidism. Cureus (2022) 14(3):e23522. doi: 10.7759/cureus.23522
15. Fan H, Liu Z, Zhang X, Wu S, Shi T, Zhang P, et al. Thyroid stimulating hormone levels are associated with genetically predicted nonalcoholic fatty liver disease. J Clin Endocrinol Metab (2022) 107(9):2522–9. doi: 10.1210/clinem/dgac393
16. Skelin M, Lucijanić T, Amidžić Klarić D, Rešić A, Bakula M, Liberati-Čizmek AM, et al. Factors affecting gastrointestinal absorption of levothyroxine: A review. Clin Ther (2017) 39(2):378–403. doi: 10.1016/j.clinthera.2017.01.005
17. Triantafillidis JK, Georgakopoulos D, Gikas A, Merikas E, Peros G, Sofroniadou K, et al. Relation between helicobacter pylori infection, thyroid hormone levels and cardiovascular risk factors on blood donors. Hepatogastroenterology (2003) 50(Suppl 2):cccxviii–cccxx.
18. Nilsson T, Lapidus L, Lindstedt G, Nyström E, Eggertsen R. Relations between helicobacter pylori, thyroid disease and cardiovascular risk factors in a 56-65-year-old population. Scand J Prim Health Care (2000) 18(2):111–2. doi: 10.1080/028134300750019007
19. Tomasi PA, Dore MP, Fanciulli G, Sanciu F, Realdi G, Delitala G. Is there anything to the reported association between helicobacter pylori infection and autoimmune thyroiditis? Dig Dis Sci (2005) 50(2):385–8. doi: 10.1007/s10620-005-1615-z
20. Weiner N, Shaoul R. Impact of age, gender, and addition of probiotics on treatment success for helicobacter pylori in children. Glob Pediatr Health (2015) 2:2333794X–15607798X. doi: 10.1177/2333794X15607798
21. Hawkey CJ, Wilson I, Naesdal J, Långström G, Swannell AJ, Yeomans ND. Influence of sex and helicobacter pylori on development and healing of gastroduodenal lesions in non-steroidal anti-inflammatory drug users. Gut (2002) 51(3):344–50. doi: 10.1136/gut.51.3.344
22. Brown LM. Helicobacter pylori: epidemiology and routes of transmission. Epidemiol Rev (2000) 22(2):283–97. doi: 10.1093/oxfordjournals.epirev.a018040
23. Epplein M, Signorello LB, Zheng W, Peek RM Jr, Michel A, Williams SM, et al. Race, African ancestry, and helicobacter pylori infection in a low-income united states population. Cancer Epidemiol Biomarkers Prev (2011) 20(5):826–34. doi: 10.1158/1055-9965.EPI-10-1258
24. Suki M, Leibovici Weissman Y, Boltin D, Itskoviz D, Tsadok Perets T, Comaneshter D, et al. Helicobacter pylori infection is positively associated with an increased BMI, irrespective of socioeconomic status and other confounders: A cohort study. Eur J Gastroenterol Hepatol (2018) 30(2):143–8. doi: 10.1097/MEG.0000000000001014
25. Park Y, Kim TJ, Lee H, Yoo H, Sohn I, Min YW, et al. Eradication of helicobacter pylori infection decreases risk for dyslipidemia: A cohort study. Helicobacter (2021) 26(2):e12783. doi: 10.1111/hel.12783
26. Shak JR, Sodikoff JB, Speckman RA, Rollin FG, Chery MP, Cole CR, et al. Anemia and helicobacter pylori seroreactivity in a rural Haitian population. Am J Trop Med Hyg (2011) 85(5):913–8. doi: 10.4269/ajtmh.2011.11-0101
27. Cheng H, Hu F, Zhang L, Yang G, Ma J, Hu J, et al. Prevalence of helicobacter pylori infection and identification of risk factors in rural and urban Beijing, China. Helicobacter (2009) 14(2):128–33. doi: 10.1111/j.1523-5378.2009.00668.x
28. Liu SY, Han XC, Sun J, Chen GX, Zhou XY, Zhang GX. Alcohol intake and helicobacter pylori infection: a dose-response meta-analysis of observational studies. Infect Dis (Lond) (2016) 48(4):303–9. doi: 10.3109/23744235.2015.1113556
29. Ishida Y, Suzuki K, Taki K, Niwa T, Kurotsuchi S, Ando H, et al. Significant association between helicobacter pylori infection and serum c-reactive protein. Int J Med Sci (2008) 5(4):224–9. doi: 10.7150/ijms.5.224
30. Curtin LR, Mohadjer LK, Dohrmann SM, Montaquila JM, Kruszan-Moran D, Mirel LB, et al. The national health and nutrition examination survey: Sample design, 1999-2006. Vital Health Stat 2 (2012) 155:1–39.
31. Huang J, Liu Z, Ma J, Liu J, Lv M, Wang F, et al. The association between helicobacter pylori seropositivity and bone mineral density in adults. Med Inflamm (2022) 2022:2364666. doi: 10.1155/2022/2364666
32. Turyk ME, Anderson HA, Persky VW. Relationships of thyroid hormones with polychlorinated biphenyls, dioxins, furans, and DDE in adults. Environ Health Perspect (2007) 115(8):1197–203. doi: 10.1289/ehp.10179
33. Berrett AN, Gale SD, Erickson LD, Brown BL, Hedges DW. Folate and inflammatory markers moderate the association between helicobacter pylori exposure and cognitive function in US adults. Helicobacter (2016) 21(6):471–80. doi: 10.1111/hel.12303
34. Cardenas VM, Graham DY. Smoking and helicobacter pylori infection in a sample of U.S. adults. Epidemiology (2005) 16(4):586–90. doi: 10.1097/01.ede.0000165365.52904.4a
35. Huang JW, Xie C, Niu Z, He LJ, Li JJ. The relation between helicobacter pylori immunoglobulin G seropositivity and leukocyte telomere length in US adults from NHANES 1999-2000. Helicobacter (2020) 25(6):e12760. doi: 10.1111/hel.12760
36. Meier HCS, Miller FW, Dinse GE, Weinberg CR, Cho CC, Parks CG. Helicobacter pylori seropositivity is associated with antinuclear antibodies in US adults, NHANES 1999-2000. Epidemiol Infect (2020) 148:e20. doi: 10.1017/S0950268820000126
37. Fortenberry GZ, Hu H, Turyk M, Barr DB, Meeker JD. Association between urinary 3, 5, 6-trichloro-2-pyridinol, a metabolite of chlorpyrifos and chlorpyrifos-methyl, and serum T4 and TSH in NHANES 1999-2002. Sci Total Environ (2012) 424:351–5. doi: 10.1016/j.scitotenv.2012.02.039
38. Baccaglini L, Schoenbach VJ, Poole C, McKaig RG, Ibrahim J, Baric RS, et al. Association between herpes simplex virus type 1 and helicobacter pylori in US adolescents. Oral Surg Oral Med Oral Pathol Oral Radiol Endod (2006) 101(1):63–9. doi: 10.1016/j.tripleo.2004.12.018
39. Qiu Y, Hu Y, Xing Z, Fu Q, Zhu J, Su A. Birth control pills and risk of hypothyroidism: a cross-sectional study of the national health and nutrition examination survey, 2007-2012. BMJ Open (2021) 11(6):e46607. doi: 10.1136/bmjopen-2020-046607
40. El-Serag HB, Kao JY, Kanwal F, Gilger M, LoVecchio F, Moss SF, et al. Houston Consensus conference on testing for helicobacter pylori infection in the united states. Clin Gastroenterol Hepatol (2018) 16(7):992–1002. doi: 10.1016/j.cgh.2018.03.013
41. De Block CE, De Leeuw IH, Pelckmans PA, Callens D, Máday E, Van Gaal LF. Delayed gastric emptying and gastric autoimmunity in type 1 diabetes. Diabetes Care (2002) 25(5):912–7. doi: 10.2337/diacare.25.5.912
42. Tache Y, Stephens RJ, Ishikawa T. Central nervous system action of TRH to influence gastrointestinal function and ulceration. Ann NY Acad Sci (1989) 553:269–85. doi: 10.1111/j.1749-6632.1989.tb46649.x
43. Gumurdulu Y, Serin E, Ozer B, Aydin M, Yapar AF, Kayaselçuk F, et al. The impact of B(12) treatment on gastric emptying time in patients with helicobacter pylori infection. J Clin Gastroenterol (2003) 37(3):230–3. doi: 10.1097/00004836-200309000-00008
44. Zhang X, Liu W, Zhang S, Wang J, Yang X, Wang R, et al. Wei-Tong-Xin ameliorates functional dyspepsia via inactivating TLR4/MyD88 by regulating gut microbial structure and metabolites. Phytomedicine (2022) 102:154180. doi: 10.1016/j.phymed.2022.154180
45. Miron I, Dumitrascu DL. Gastrointestinal motility disorders in obesity. Acta Endocrinol (Buchar) (2019) 15(4):497–504. doi: 10.4183/aeb.2019.497
46. Adamska A, Raczkowski A, Stachurska Z, Kondraciuk M, Krętowski AJ, Adamski M, et al. Body composition and serum concentration of thyroid hormones in euthyroid men and women from general population. J Clin Med (2022) 11(8):2118. doi: 10.3390/jcm11082118
47. den Hollander WJ, Broer L, Schurmann C, Meyre D, den Hoed CM, Mayerle J, et al. Helicobacter pylori colonization and obesity - a mendelian randomization study. Sci Rep (2017) 7(1):14467. doi: 10.1038/s41598-017-14106-4
48. Chong SK, Lou Q, Zollinger TW, Rabinowitz S, Jibaly R, Tolia V, et al. The seroprevalence of helicobacter pylori in a referral population of children in the united states. Am J Gastroenterol (2003) 98(10):2162–8. doi: 10.1111/j.1572-0241.2003.07683.x
Keywords: thyroid stimulating hormone, TSH, Helicobacter pylori infection, NHANES, CDC
Citation: Wang J, Liu D and Xie Y (2022) Association between Helicobacter pylori infection and serum thyroid stimulating hormone in the National Health and Nutrition Examination Survey 1999-2000. Front. Endocrinol. 13:1018267. doi: 10.3389/fendo.2022.1018267
Received: 13 August 2022; Accepted: 26 October 2022;
Published: 11 November 2022.
Edited by:
Leonidas H. Duntas, National University of Athens, GreeceReviewed by:
Hassan Abdelwahid, Suez Canal University, EgyptZhenyu Zhang, Nanjing Medical University, China
Copyright © 2022 Wang, Liu and Xie. This is an open-access article distributed under the terms of the Creative Commons Attribution License (CC BY). The use, distribution or reproduction in other forums is permitted, provided the original author(s) and the copyright owner(s) are credited and that the original publication in this journal is cited, in accordance with accepted academic practice. No use, distribution or reproduction is permitted which does not comply with these terms.
*Correspondence: Yong Xie, eGlleW9uZ190ZmFob25jdUAxNjMuY29t
†These authors have contributed equally to this work and share first authorship