 Jialong Yu
 Yihan Zhang2
 Jian Zheng
 Xiubo Lu
- 1Department of Thyroid Surgery, The First Affiliated Hospital of Zhengzhou University, Henan, China
- 2Department of Ophthalmology, The First Affiliated Hospital of Zhengzhou University, Henan, China
Purpose: To create an ultrasound -based deep learning radiomics nomogram (DLRN) for preoperatively predicting the presence of RET rearrangement among patients with papillary thyroid carcinoma (PTC).
Methods: We retrospectively enrolled 650 patients with PTC. Patients were divided into the RET/PTC rearrangement group (n = 103) and the non-RET/PTC rearrangement group (n = 547). Radiomics features were extracted based on hand-crafted features from the ultrasound images, and deep learning networks were used to extract deep transfer learning features. The least absolute shrinkage and selection operator regression was applied to select the features of nonzero coefficients from radiomics and deep transfer learning features; then, we established the deep learning radiomics signature. DLRN was constructed using a logistic regression algorithm by combining clinical and deep learning radiomics signatures. The prediction performance was evaluated using the receiver operating characteristic curve, calibration curve, and decision curve analysis.
Results: Comparing the effectiveness of the models by linking the area under the receiver operating characteristic curve of each model, we found that the area under the curve of DLRN could reach 0.9545 (95% confidence interval: 0.9133–0.9558) in the test cohort and 0.9396 (95% confidence interval: 0.9185–0.9607) in the training cohort, indicating that the model has an excellent performance in predicting RET rearrangement in PTC. The decision curve analysis demonstrated that the combined model was clinically useful.
Conclusion: The novel ultrasonic-based DLRN has an important clinical value for predicting RET rearrangement in PTC. It can provide physicians with a preoperative non-invasive primary screening method for RET rearrangement diagnosis, thus facilitating targeted patients with purposeful molecular sequencing to avoid unnecessary medical investment and improve treatment outcomes.
1. Introduction
Thyroid cancer is the most common endocrine tumor; papillary thyroid carcinoma (PTC) is the most common type of pathological cancer, accounting for approximately 80%–90% of all thyroid cancers (1). Yasuhiro et al. studied 5897 patients with PTC and reported that PTC is inert cancer with a low mortality rate and >90% overall survival rate (2). However, some histological subtypes of PTC show aggressive behavior, have a high recurrence and distant metastasis, or lead to death (3, 4). Therefore, early discrimination against these PTCs that require aggressive medical intervention is important.
Several genetic alterations have been used as a tool for diagnosing diseases and predicting prognosis owing to the advancement in molecular genetics (5, 6). On a molecular basis, some genetic alterations are closely associated with the clinicopathological features of PTC. Fusco et al. first reported the RET chromosomal rearrangement was in PTC. RET is a proto-oncogene that encodes a plasma membrane-bound RET tyrosine kinase receptor for ligands of the glial-derived neurotrophic factor family (7). Chromosomal rearrangements cause RET/PTC-related carcinogenesis (8).
Thus far, at least 13 different forms of RET/PTC rearrangements have been found; these rearrangements are almost exclusively found in PTC (9). Among all rearrangement forms, RET/PTC3 and RET/PTC1 are the most common, accounting for >90% of all rearrangements. The prognostic role of RET rearrangements has been confirmed in other studies as the presence of RET/PTC3 rearrangements and both large tumors size and advanced tumor stage at the time of diagnosis are positively associated; these studies highlight that RET/PTC3 has a significant role in metastatic spread (10–13). However, RET/PTC1 rearrangement is more prevalent than RET/PTC3 in less aggressive classical variants (14, 15).
Ultrasound is the primary imaging technique for the evaluation of thyroid nodules. Predicting molecular alterations in PTC by analyzing conventional ultrasound features is controversial, mainly due to the limitation of conventional ultrasound images and high interobserver variability (16). Radiomics can automatically extract innumerable high-dimensional features from images; however, these features cannot be assessed visually. Radiomics has recently shown clinical importance in the thyroid (17). Radiomics based on ultrasound images has been used to predict molecular properties in thyroid cancer (18–20).
Machine learning is the scientific technique that emphasizes how computers learn from data. It can be found at the intersection of statistics and computer science (21). Deep transfer learning (DTL) is a new type of machine learning method developed via the advancement of artificial neural networks. DTL depends on a network of computational units that gradually extract higher-lever features from the input data (22). DTL is widely used in medicine, including in the field of the thyroid (23, 24).
To our knowledge, there are no published studies aimed at identifying the presence of RET rearrangement in PTC using ultrasound radiomics combined with DTL. Therefore, we evaluated the association between RET rearrangement and ultrasound radiomics DTL and established a deep learning radiomics nomogram (DLRN) to predict RET rearrangement in PTC.
2. Materials and methods
2.1. Ethics statement
This study was approved by the Ethics Committee of the First Affiliated Hospital of Zhengzhou University (Number: 2022-KY-1002-002).
2.2. Clinical data
Between June 2020 and June 2022, we enrolled consecutive patients from the Department of Thyroid Surgery of the First Affiliated Hospital of Zhengzhou University; informed consent from patients was exempted. The inclusion criteria were as follows: (1) patients who were treated for the first time; (2) patients who preoperatively underwent ultrasound examination within 2 weeks; (3) patients who had pathologically confirmed PTC; and (4) patients with well-preserved clinical data, imaging data, and pathological specimens. The exclusion criteria were as follows: (1) patients who underwent preoperative radiotherapy, chemotherapy, or radiofrequency ablation; (2) patients who presented with other head and neck tumor diseases; (3) patients with multifocal or bilateral PTC; and (4) patients with poor quality ultrasound images. Figure 1 shows the patient recruitment pathway. The patients were divided into training and test cohorts using a 5-fold cross-validation method.
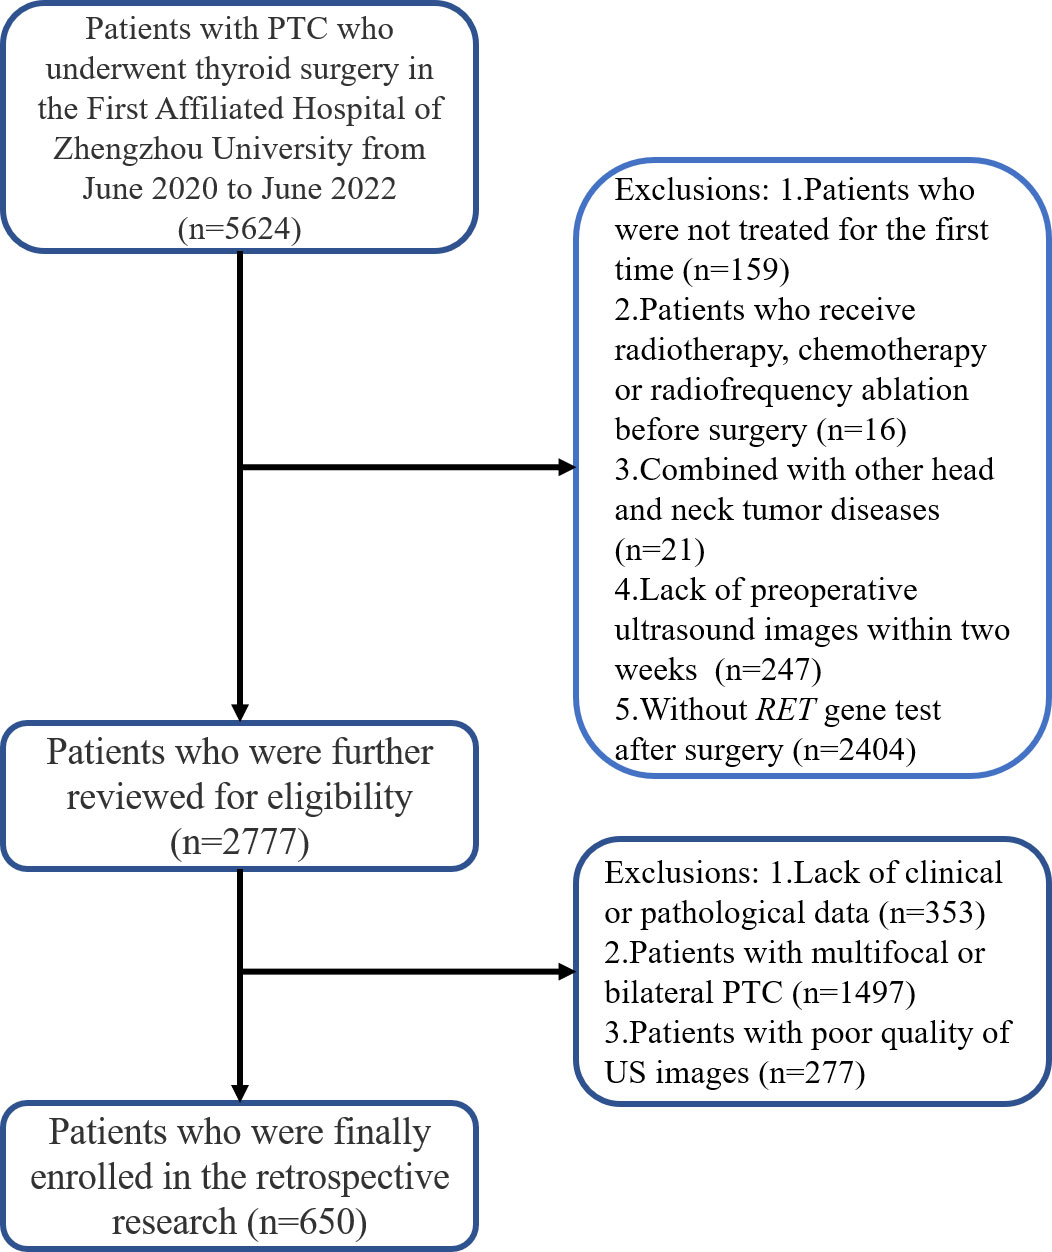
Figure 1 The patient recruitment pathway.
2.3. Ultrasound examination and image acquisition
All enrolled patients underwent a preoperative neck ultrasound examination. The ultrasound machines included HITACHI HI VISION Ascendus (Japan), TOSHIBA aplio500 (Japan), SAMSUNG LA3-16A (Korea), and PHILIPS RPIQ5 (Netherlands). The ultrasound examinations were performed with a 5–12 MHz transducer by radiologists with 5–10 years of experience in thyroid ultrasound evaluation. After placing the patients in the supine position, longitudinal and transverse continuous scanning were performed to obtain longitudinal and transverse images of the thyroid nodules. All selected thyroid nodules were evaluated for the following ultrasound feature composition (mixed cystic and solid, cystic, or solid), echogenicity (hypoechoic, isoechoic, or hyperechoic), tumor margin (irregular, ill-defined, or smooth), vertical and horizontal diameter ratio (<1 or ≥1), shape (irregular, ill-defined, or regular), and calcification (macrocalcification, microcalcification, non-calcification, or cluster calcification); the American College of Radiology Thyroid Imaging Reporting and Data System (ACR-TI-RADS) score of each nodule was calculated by the same radiologists. Supplement Tables 1, 2 show the detailed process of calculating the ACR-TI-RADS score and category.
2.4. Region of interest segmentation
Two radiologists with >3 years of experience who were blinded to the pathological results reviewed the ultrasound images of the enrolled patients using Picture Archiving and Communication Systems, selected appropriate images, stored the selected images in BMP format, and then converted them to NII format. The open-source software 3D Slicer (version 4.1.13.0, available at https://www.slicer.org/) was used for texture analysis. The region of interest of the target nodule was manually segmented using a 3D Slicer. The interobserver and intraobserver agreements were measured using random 130 nodules delineated by a radiologist twice within 2 weeks. The interclass correlation coefficient was used to evaluate the interobserver and intraobserver agreement of the feature extraction. An interclass correlation coefficient larger than 0.75 was considered a satisfactory agreement.
2.5. Features extraction and signature building
All handcrafted features were extracted using an in-house feature analysis program implemented in Pyradiomics (http://pyradiomics.readthedocs.io); 1477 handcrafted features were extracted from each ultrasound image. After the least absolute shrinkage and selection operator (LASSO) feature screening, we input the final features into the machine learning models such as LR, SVM, random forest, XGBoost, and so on for prediction model construction.
Deep learning features were extracted from pre-trained convolutional neural networks via transfer learning. In this study, resnet50 was chosen as the pre-trained convolutional neural network model18. The resnet50 model was trained on the ILSVRC-2012 dataset. The image that had the largest tumor area was selected to represent each patient; the gray values were normalized to the range [−1, 1] using min-max transformation. Then, each cropped subregion image was resized to 224 × 224 with the nearest interpolation. The obtained images were used as the model input. Since the dimension of deep migration features was 2048, we used the principal component analysis to reduce the dimension of deep migration features and ensure the balance between features. We reduced the dimension of deep learning to 128 dimensions for improving the generalization ability of the model and reducing the risk of overfitting. After compressing the deep learning feature by principal component analysis, all compressed features were standardized using the Z-score method, and the mean and variance (standard deviation) of each column of features were calculated. Each column of features was subtracted from the mean, divided by variance, and transformed into a standard normal distribution. We used the least absolute shrinkage and selection operator (LASSO) to filter out features whose coefficients were not 0, selected and reduced the dimension of fusion features, and obtained the optimal subset of fusion features.
Based on the selected radiomics features and 128 compressed DTL features, we aimed to create a deep learning radiomics (DLR) signature. We followed the same path as the radiomics signature or DTL signature. After LASSO feature screening, we input the final features into the machine learning models for predictive model construction to obtain the final DLR signature.
2.6. Construction of DLRN and predictive performance
We referred to clinical data with the conventional ultrasound features commonly referred to as clinical features. First, the features used for building clinical signatures were selected by baseline statistics with a p-value of <0.05. We also used the same machine learning model in the radiomics signature-building process.
DLRN was prepared in combination with clinical and DLR signatures. The diagnostic efficacy of the nomogram was tested in the test cohort; the receiver operating characteristic curves were drawn to assess the diagnostic efficacy of the nomogram. The calibration efficiency of the nomogram was estimated by drawing calibration curves; the Hosmer–Lemeshow analytical fit was used to evaluate the calibration ability of the nomogram. Decision curve analysis (DCA) was mapped to evaluate the clinical utility of predictive models. Figure 2 shows the whole process of model building.
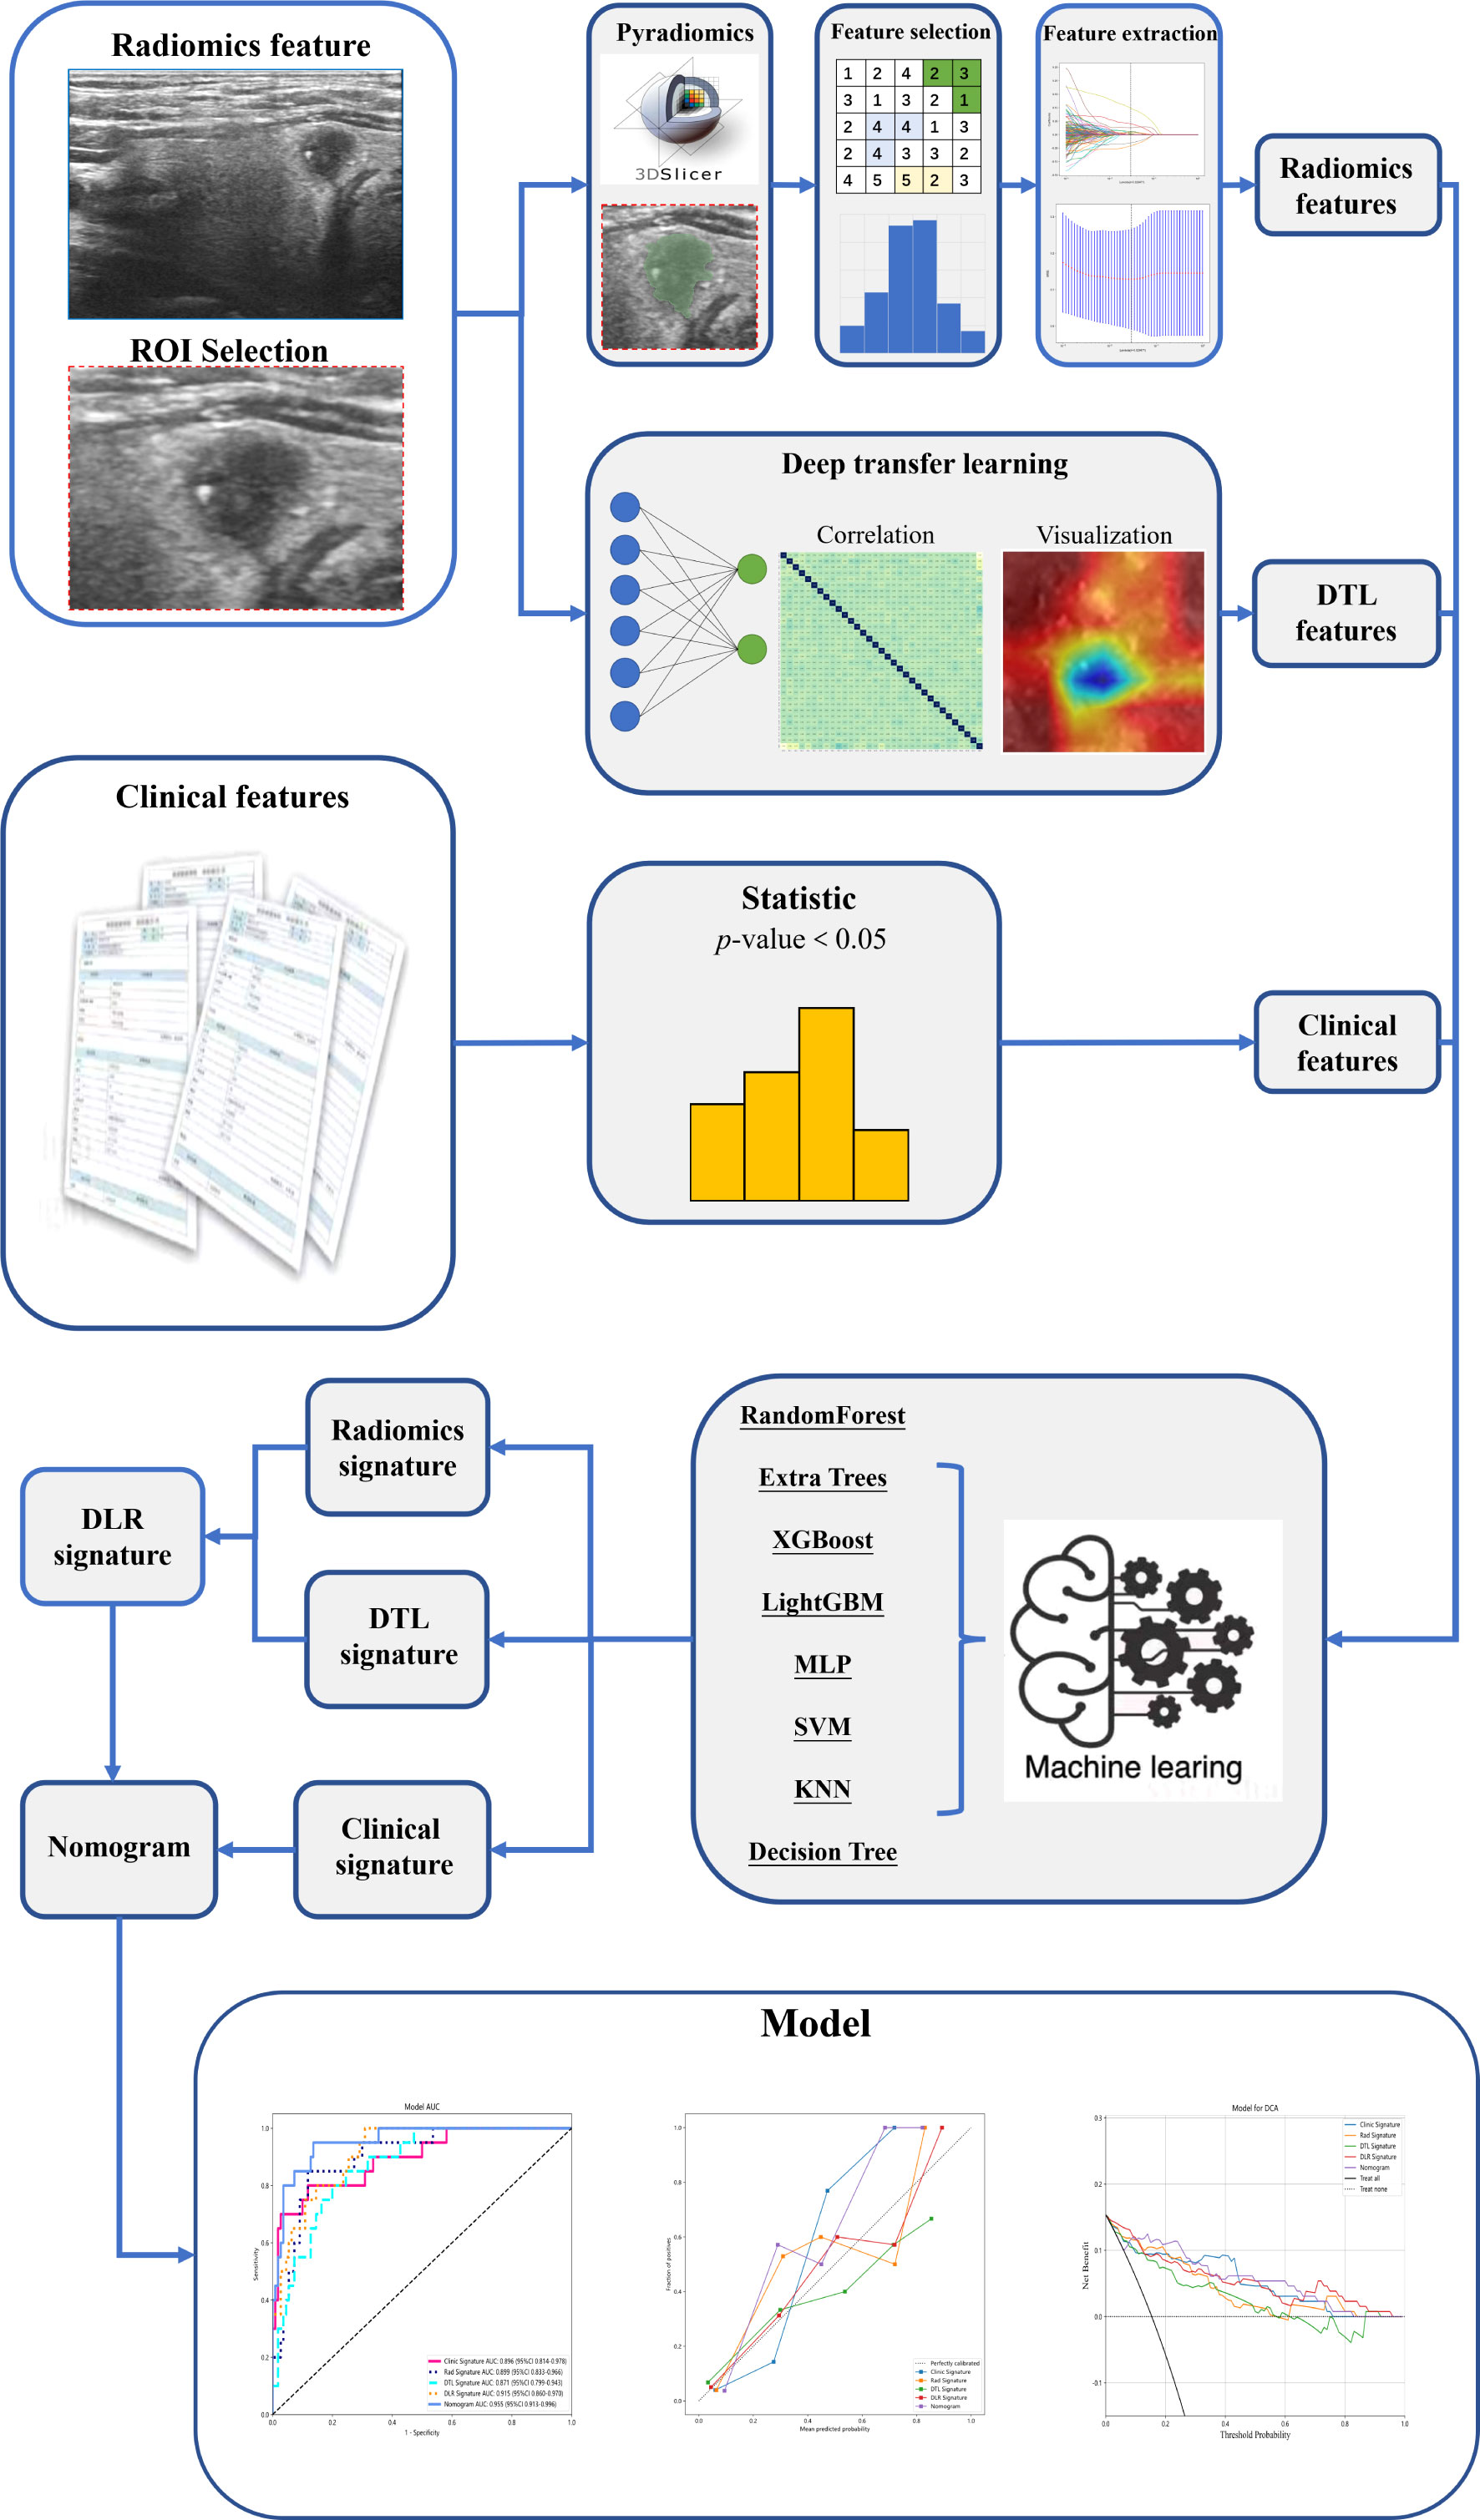
Figure 2 The process of model building.
2.7. Detection of RET/PTC rearrangements
Genomic DNA was extracted from postoperative specimens using AmoyDX provided by Amoy Diagnostics Co., Ltd. (Xiamen, China). RET rearrangements were analyzed using the next-generation sequencing method. Amplification and analysis were conducted on an ABI 7500 Real-Time PCR System (Applied Biosystem, CA, USA). Next, we performed a real-time fluorescence amplification refractory mutation system-polymerase chain reaction. Each rearrangement was further confirmed by direct Sanger sequencing; the results of RET rearrangement to be tested were finally read.
2.8. Statistical analysis
Descriptive statistics of continuous variables were expressed as mean ± standard deviation; categorical variables were presented as median (interquartile range) and frequency (%). The independent sample t-test was used for continuous factors with normal distribution; the Mann–Whitney U test was used for continuous factors without normal distribution. The categorical variables were compared using the χ2 test or Fisher exact test. The Delong’s test was used to compare the area under the curve (AUC). The Hosmer–Lemeshow test was used to assess whether the expected and actual probabilities were calculated with the prediction model. P < 0.05 was considered statistically significant.
3. Results
3.1. Features statistics
We enrolled 650 patients with PTC: 103 patients had RET/PTC rearrangement and 547 had non-RET/PTC rearrangement. Table 1 shows the clinical features of all patients. Significant differences were noted in the clinical characteristics between the two cohorts, including age, tumor size, sex, TPOAb, TGAb, echogenicity, vertical and horizontal diameter ratio, calcification, and ACR-TI-RADS score.
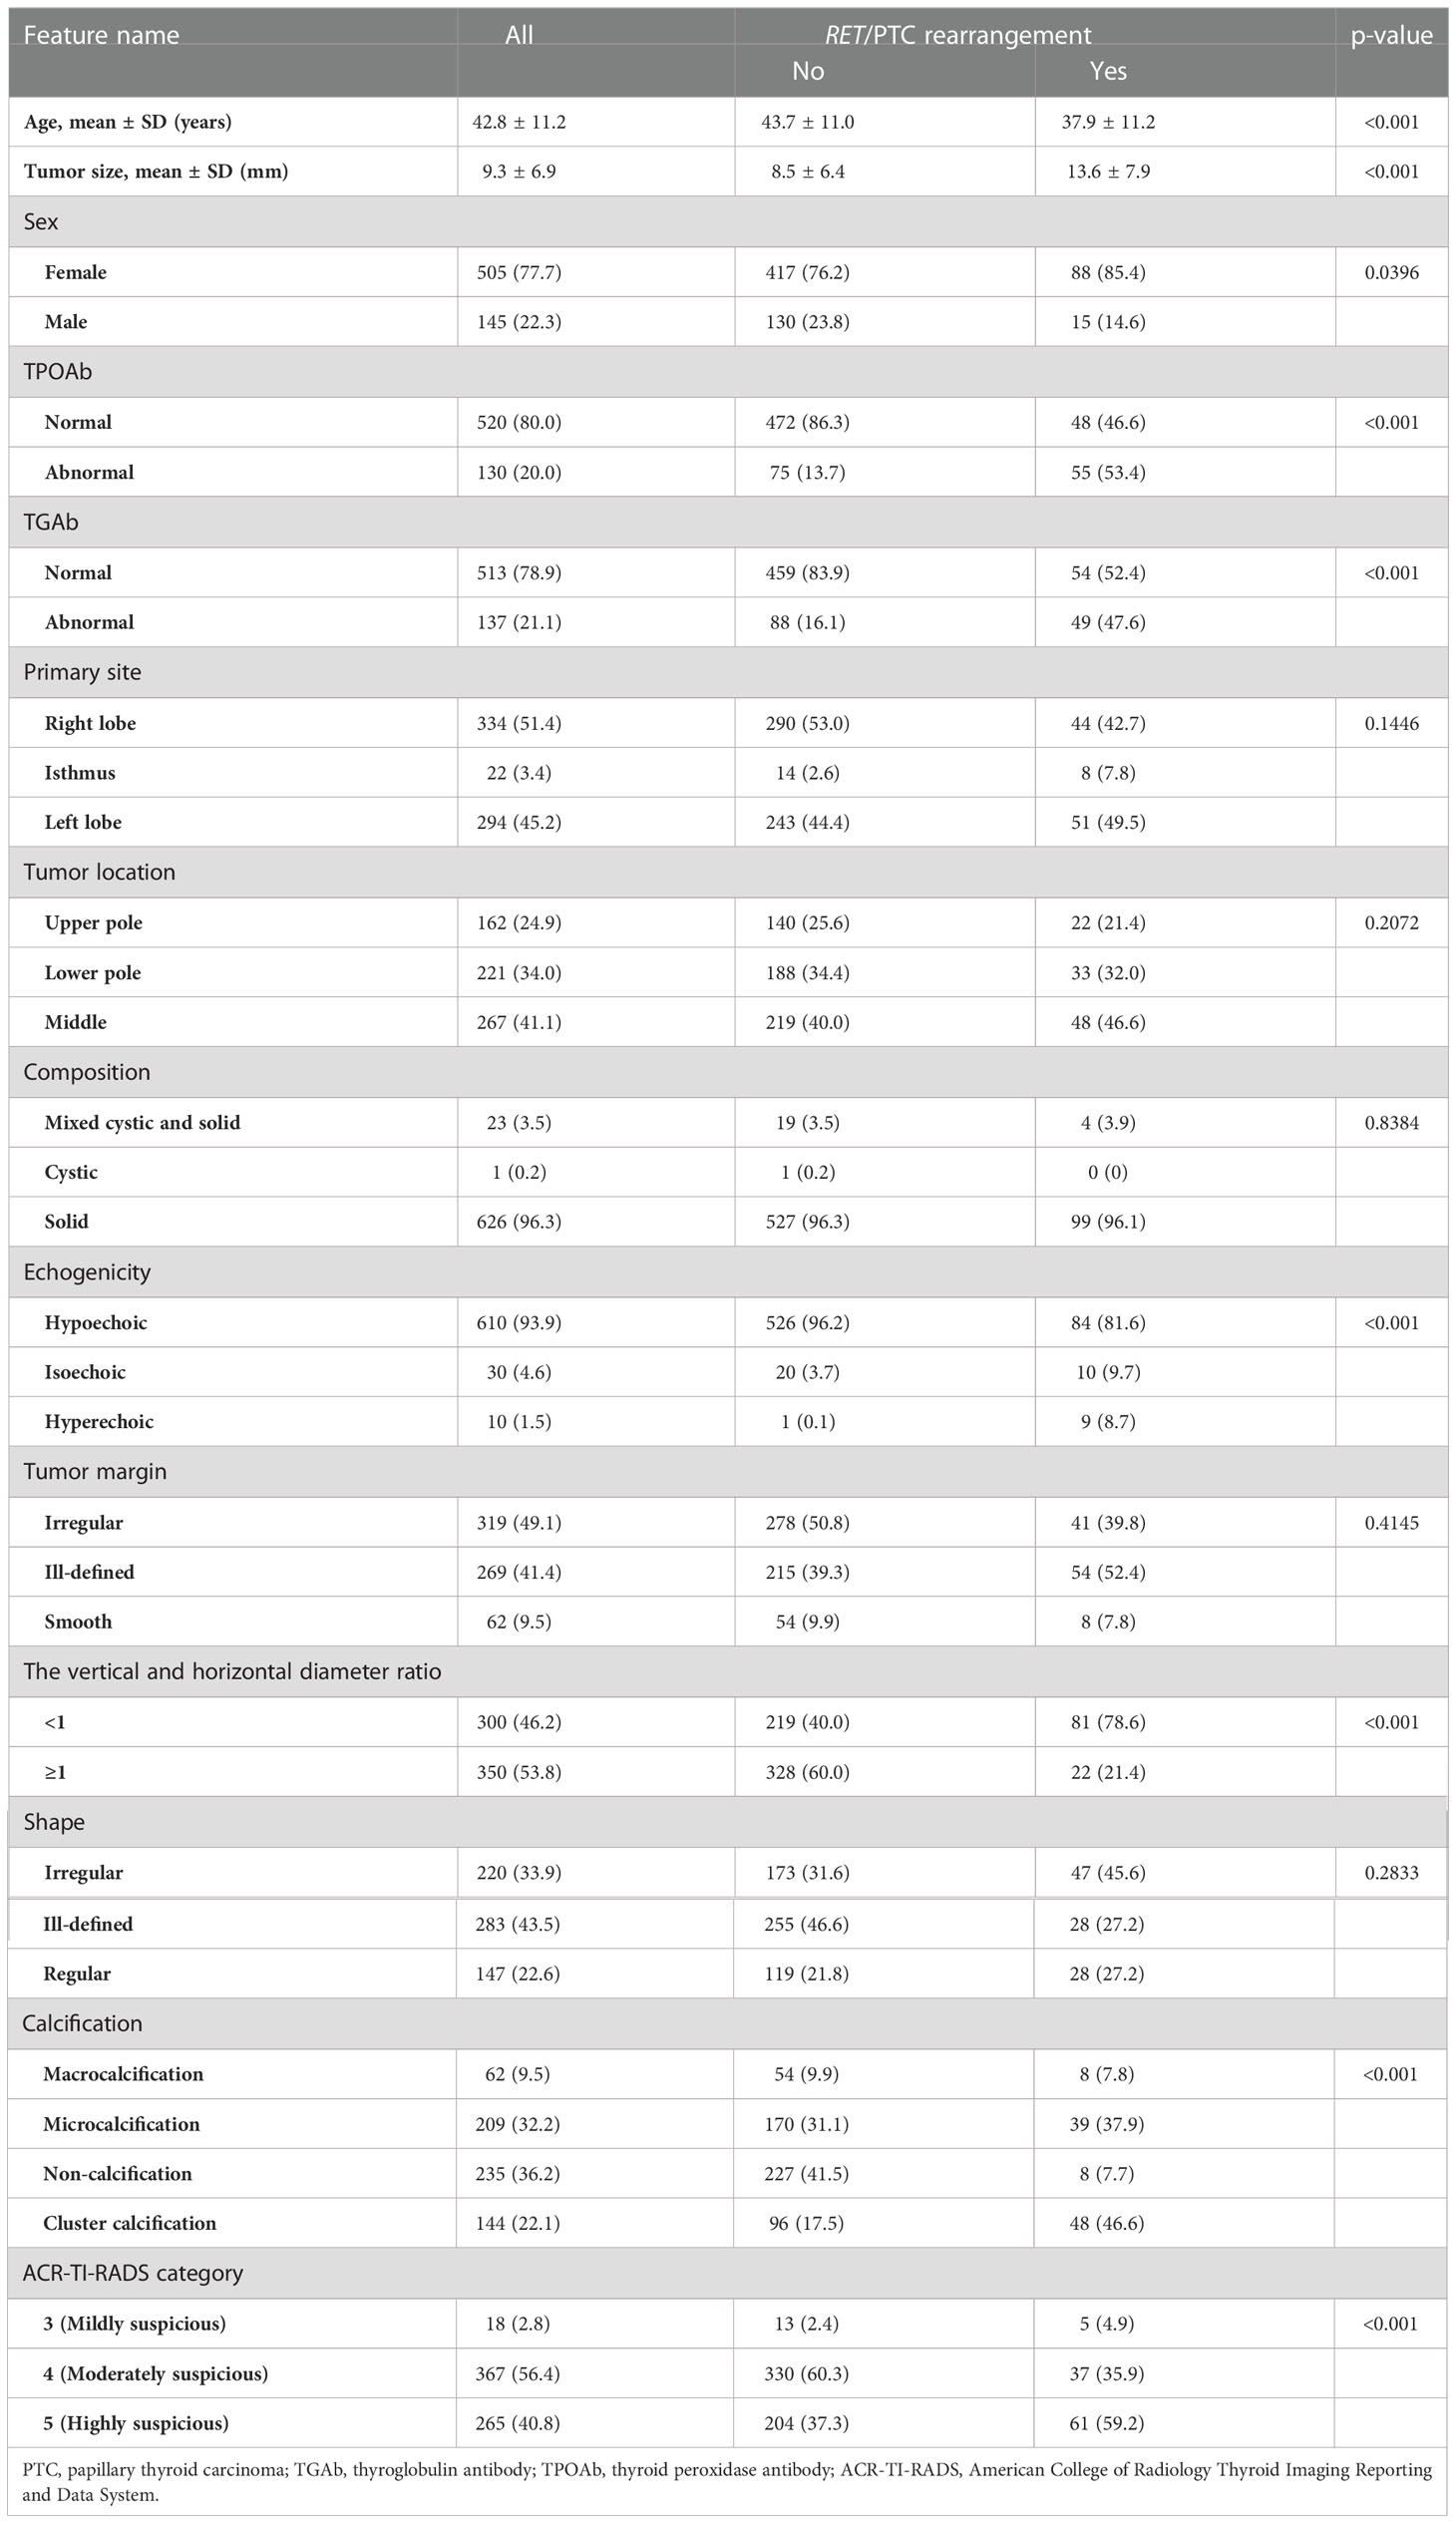
Table 1 The clinical features of all enrolled patients.
In radiomics, 1477 handcrafted features were extracted, including 306 first-order features, 14 shape features, and the last texture features. In DTL, we compared and visualized the correlation coefficients of the deep learning features. We established that the collinearity between the features was weak, indicating that deep learning still further captured the differences.
For investigating the interpretability of the DLR, we visualized the network by applying the gradient-weighted class activation mapping, which could provide a rough localization map highlighting the import regions for the classification target. The last convolutional layer of the last res-block was made transparent (Figure 3).
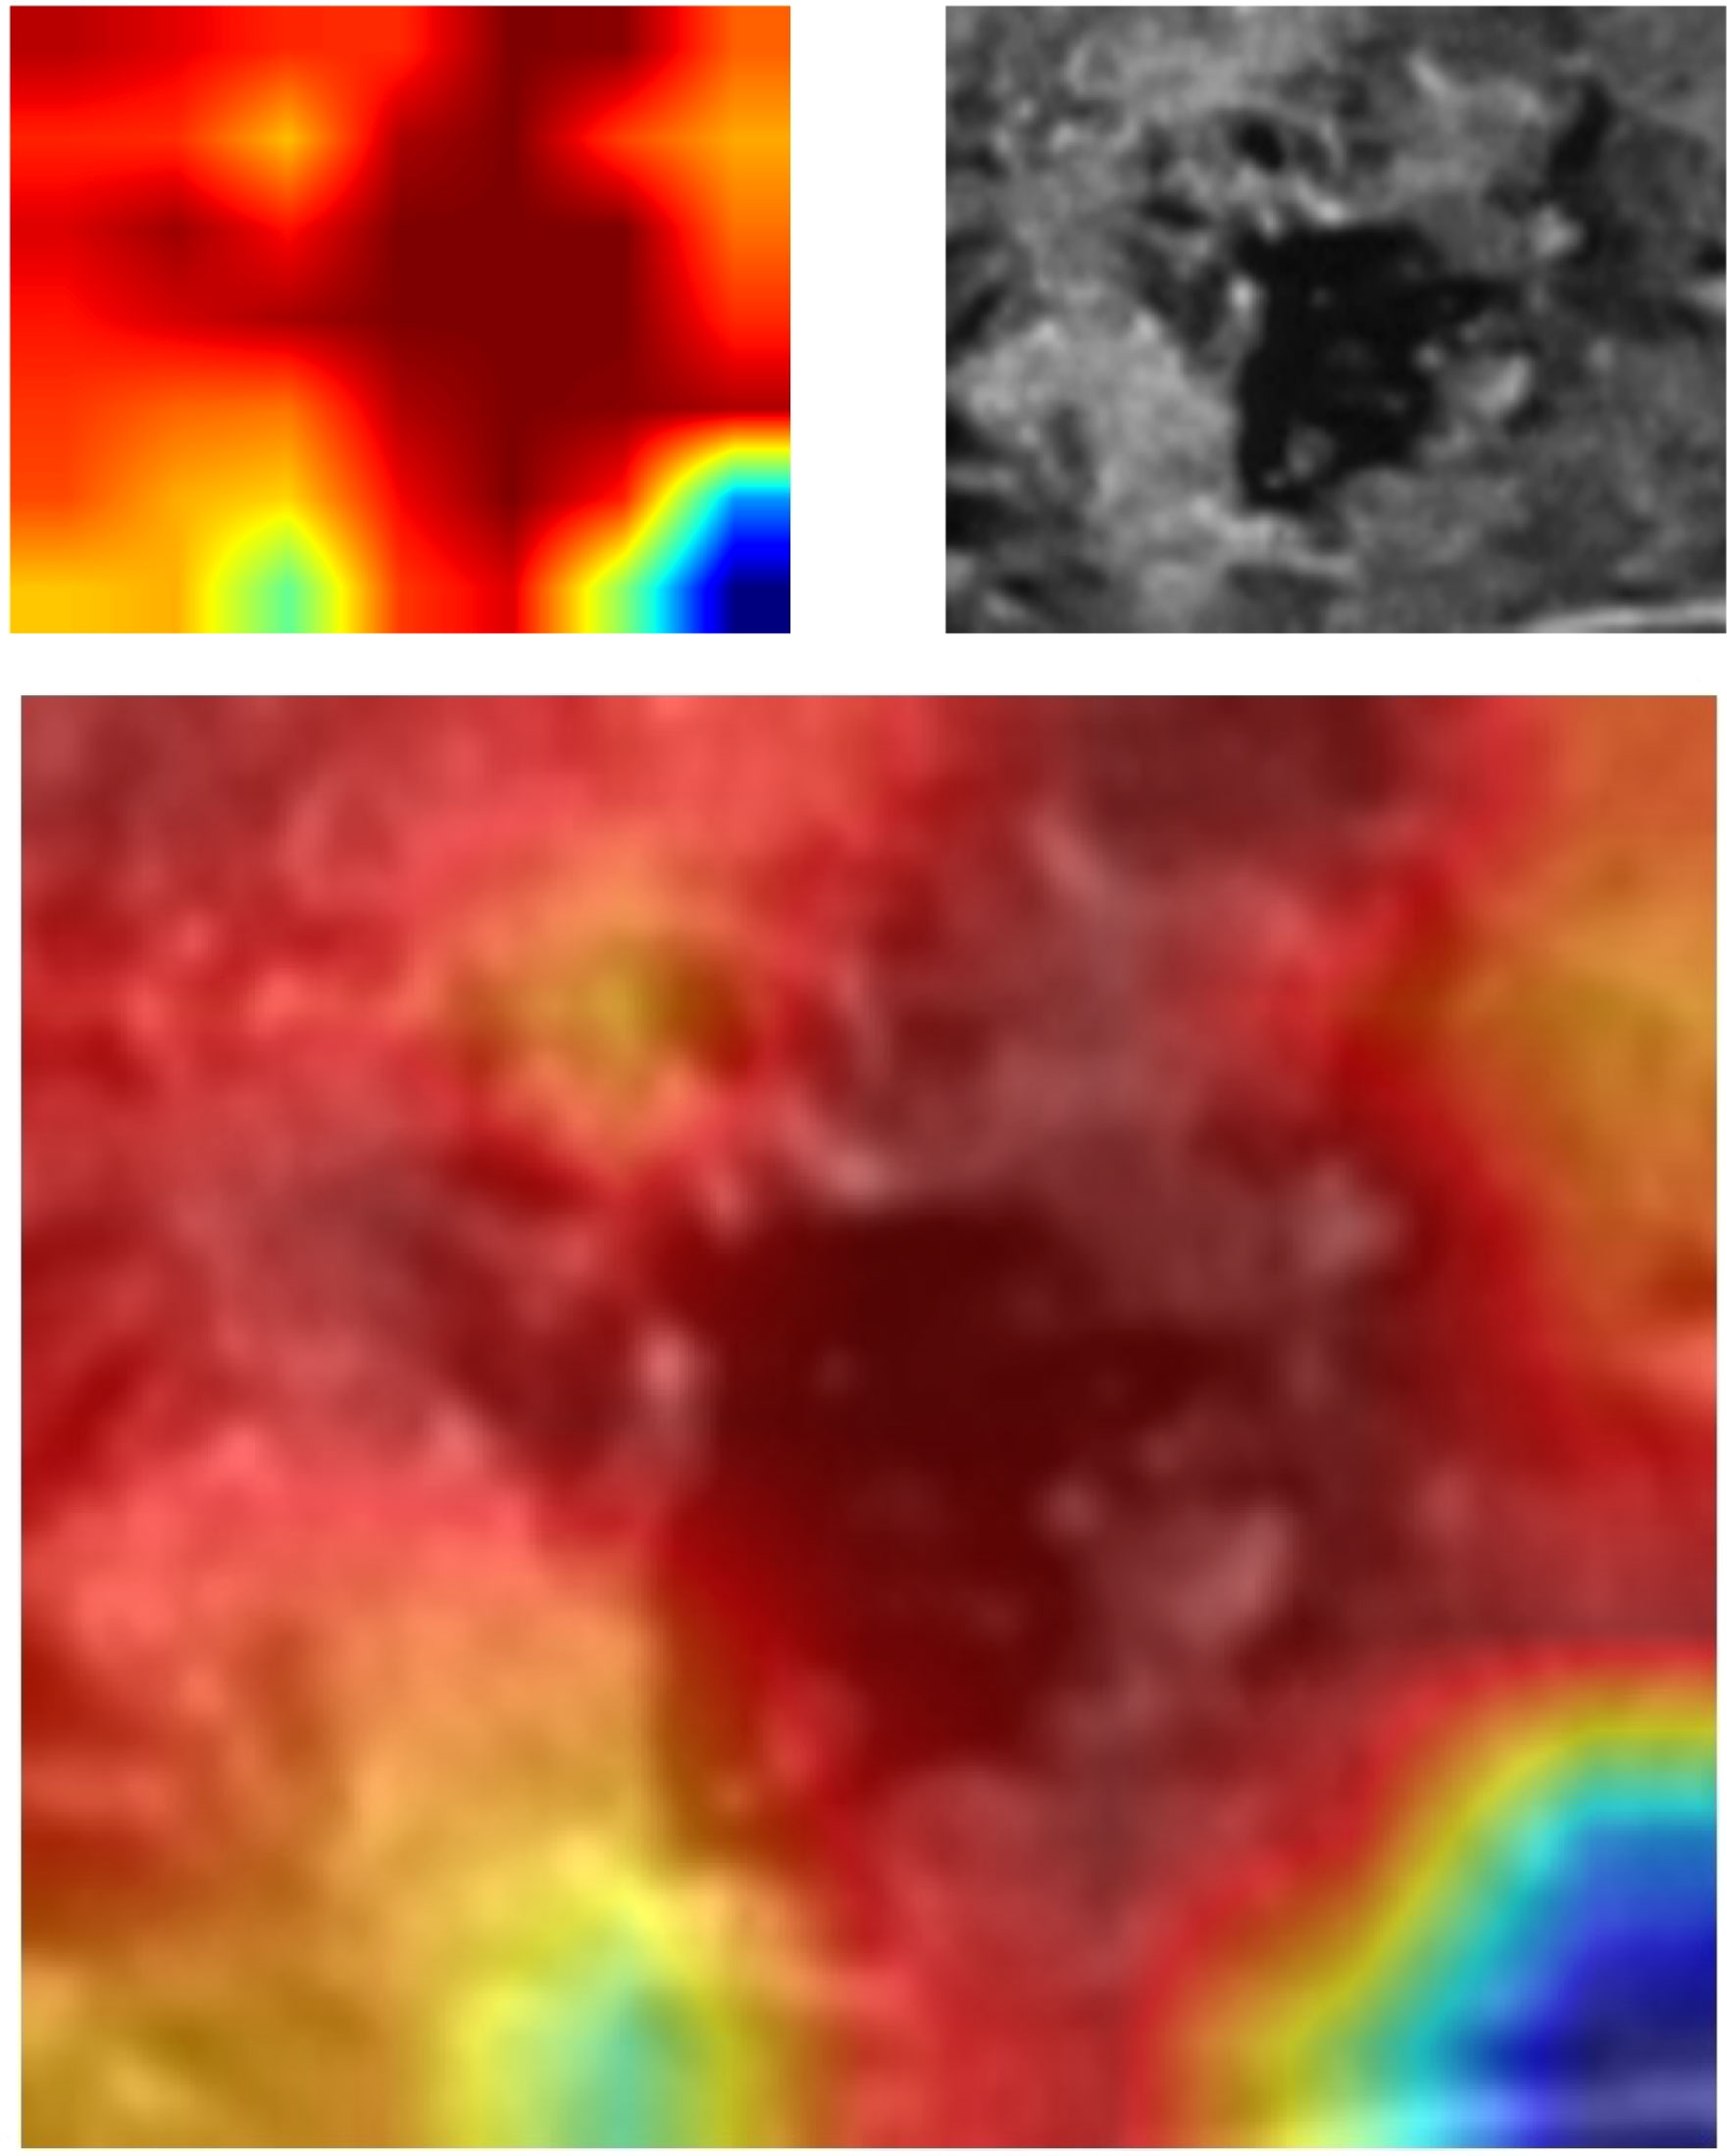
Figure 3 Grad-CAM visualization. Grad-CAM, gradient-weighted class activation mapping.
Next, 19 features of nonzero coefficients were selected from radiomics features and deep learning features to obtain the DLR-score with a LASSO logistic regression model in the training cohort. Coefficients, mean standard error of 10 folds validation, and the value of the coefficients in the final selected none zero features are shown in Figure 4. The DLR score is shown below:
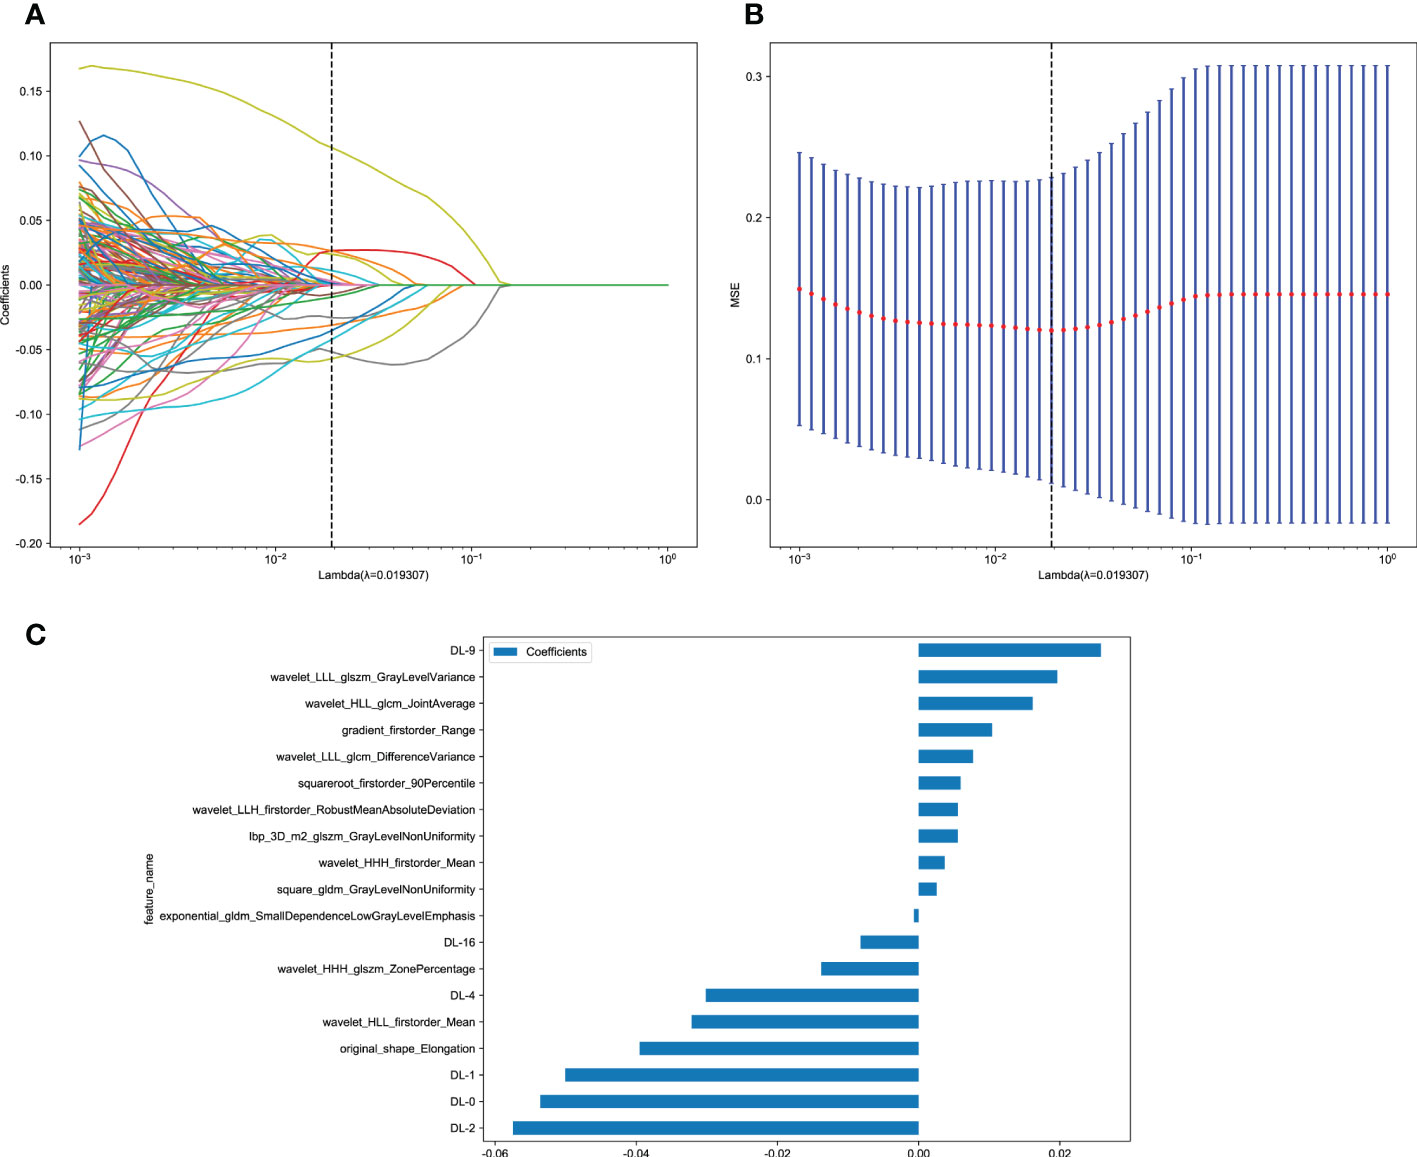
Figure 4 Deep learning radiomics (DLR) feature selection using the least absolute shrinkage and selection operator (LASSO) logistic regression model in the training cohort and the histogram of the DLR-score based on the selected features. (A) Coefficients of 10-fold cross-validation. (B) Mean square error of 10-fold validation. (C) The histogram of the DLR-score based on the selected features. Depending on the regulation weight λ, LASSO shrinks all regression coefficients towards zero and sets the coefficients of many irrelevant features exactly to zero. To find an optimal λ, 10-fold cross-validation with minimum criteria was employed, where the final value of λ yielded minimum cross-validation error. The retained features with nonzero coefficients were used for regression model fitting and combined into a DLR signature. Subsequently, we obtained a DLR score for each patient by a linear combination of retained features weighed by their model coefficients.
DLR_score = 0.15893069804681456–− 0.000667 × exponential_gldm_SmallDependenceLowGrayLevelEmphasis + 0.010403 × gradient_firstorder_Range + 0.005532 × lbp_3D_m2_glszm_GrayLevelNonUniformity − 0.039521 × original_shape_Elongation + 0.002556 × square_gldm_GrayLevelNonUniformity + 0.005940 × squareroot_firstorder_90Percentile + 0.003671 × wavelet_HHH_firstorder_Mean − 0.013805 × wavelet_HHH_glszm_ZonePercentage − 0.032163 × wavelet_HLL_firstorder_Mean + 0.016144 × wavelet_HLL_glcm_JointAverage + 0.005555 × wavelet_LLH_firstorder_RobustMeanAbsoluteDeviation + 0.007702 × wavelet_LLL_glcm_DifferenceVariance + 0.019646 × wavelet_LLL_glszm_GrayLevelVariance − 0.053602 × DL-0 − 0.050075 × DL-1 − 0.057482 × DL-2 − 0.030163 × DL-4 + 0.025809 × DL-9 − 0.008247 × DL-16
3.2. Signature efficiency comparison
A 5-fold cross-validation method was used; we divided all patients into the training and test cohorts, and the test cohort was to be fixed for a fair comparison. To compare the efficiency of each signature, we further selected the best model from each signature-building process.
The optimal model was obtained using radiomics features compared with an LR, SVM, KNN, Decision Tree, Random Forest, Extra Trees, XGBoost, and LightGBM classifier. The features of other categories were similarly related and modeled. LR performs almost the best performance in each model of the RET/PTC rearrangement respectively. Figure 5 shows the receiver operating characteristic analysis of different models on the test cohort.
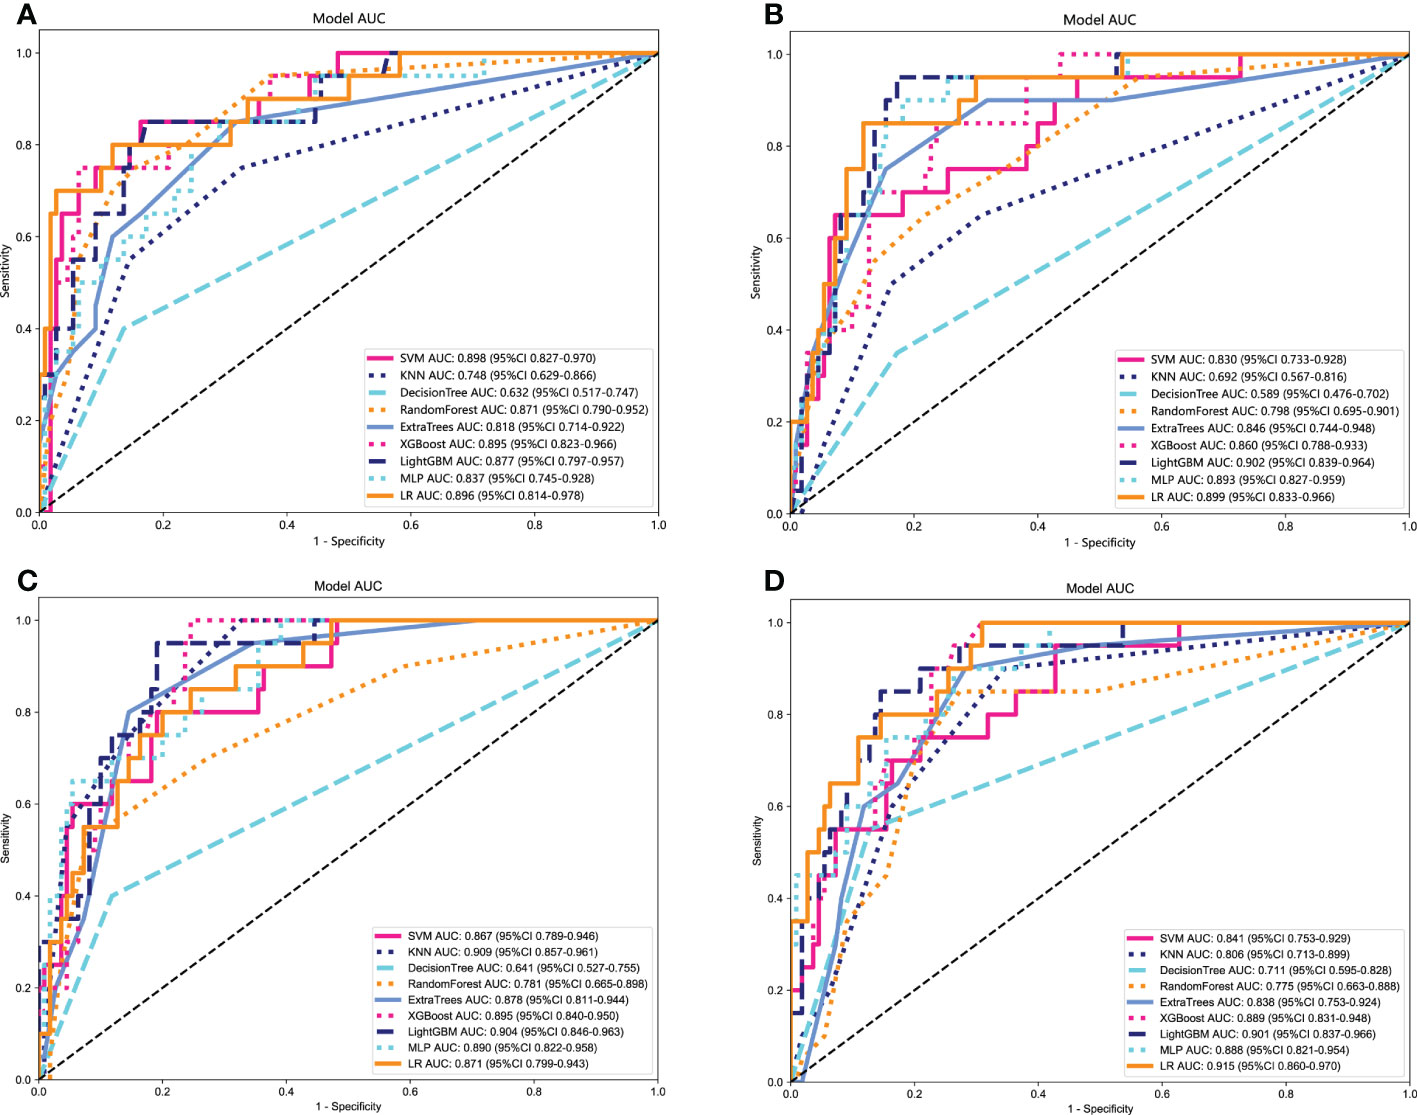
Figure 5 Receiver operating characteristic (ROC) curves of different models in the test cohort. (A) ROC curves of different models on Clinical signature. (B) ROC curves of different models on Rad signature. (C) ROC curves of different models on DTL signature. (D) ROC curves of different models on DLR signature.
3.3. Establishment and validation of the Nomogram
In the training cohort, with both clinical signature AUC = 0.8442 [95% confidence interval (CI): 0.8009–0.8874] and radiomics signature AUC = 0.8638 (95% CI: 0.8262–0.9014), DLR is combined radiomics and DTL features achieved AUC = 0.9335 (95% CI: 0.9119–0.9551). In the test cohort, with both clinical signature AUC = 0.8959 (95% CI: 0.8141–0.9777) and radiomics signature AUC = 0.8991 (95% CI: 0.8325–0.9656), DLR was also the best model between radiomics signature and DLR signature [(DLR: 0.9150) vs. (Rad: 0.8991, DTL: 0.8709)]. DLRN using the logistic regression algorithm was performed to combine the clinical signature and DLR signature, which shows that the best performance AUC was 0.9545 (95% CI 0.9133–0.9958). Table 2 shows all models that we used to predict the RET/PTC rearrangement. Figure 6 shows the AUC in both the training and test cohorts. To compare the clinical signature, DTL signature, DLR signature, radiomics signature, and Nomogram, the Delong test was used (Table 3).
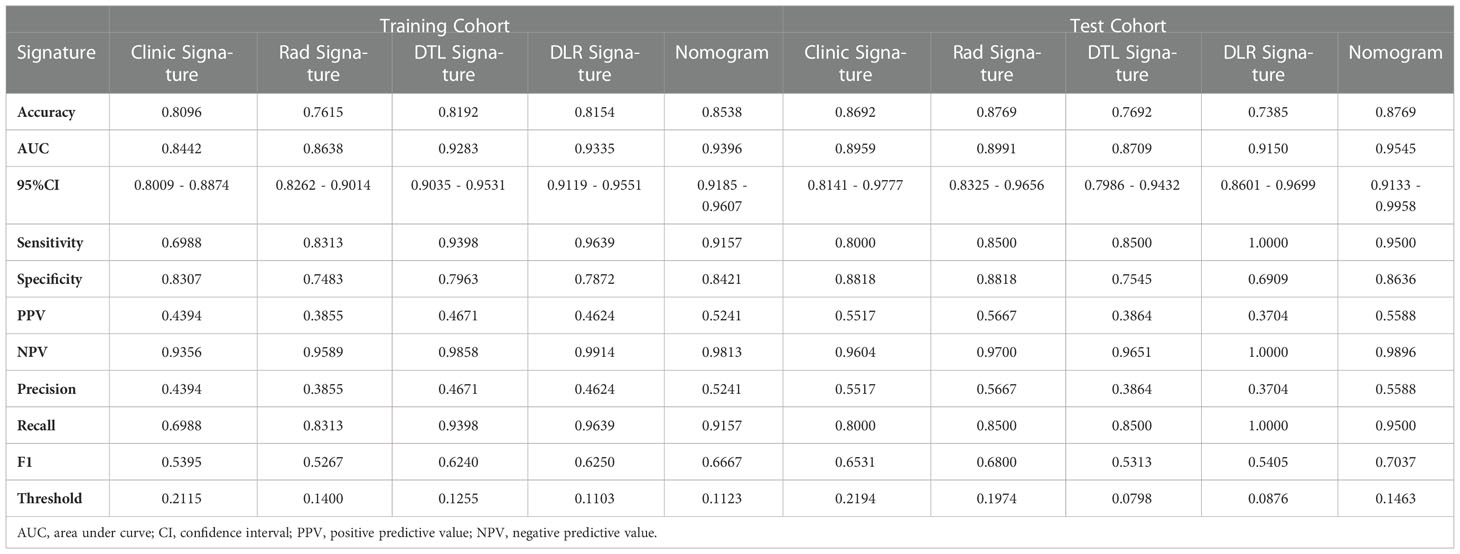
Table 2 Predictive efficacy of all models in training cohort and test cohort.
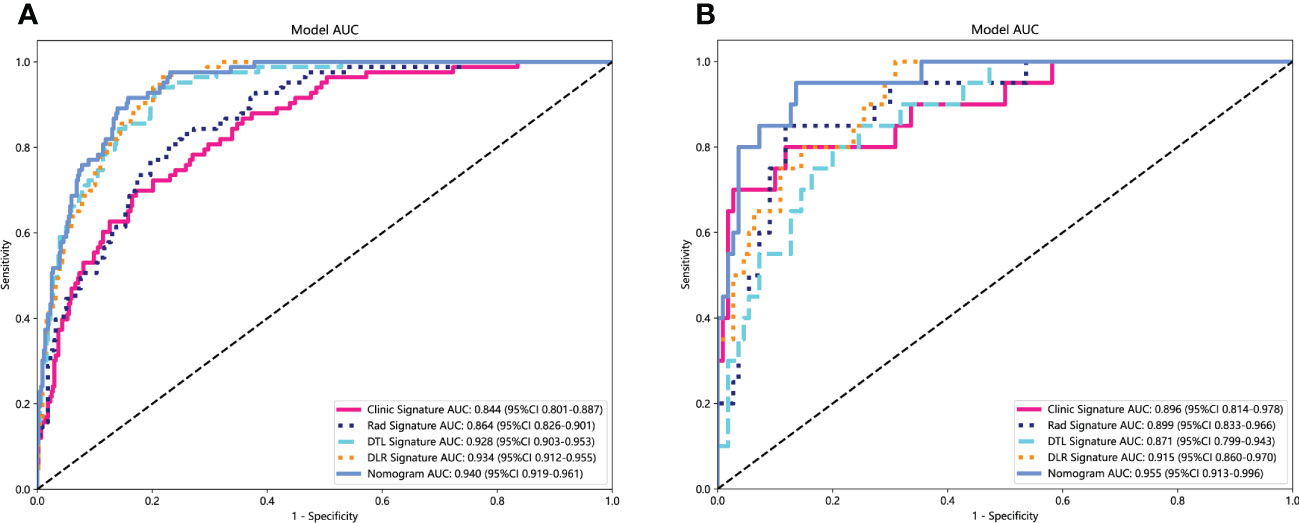
Figure 6 Receiver operating characteristic (ROC) curves of clinic signature, Rad signature, DTL signature, DLR signature and Nomogram. (A) in training cohort; (B) in test cohort.
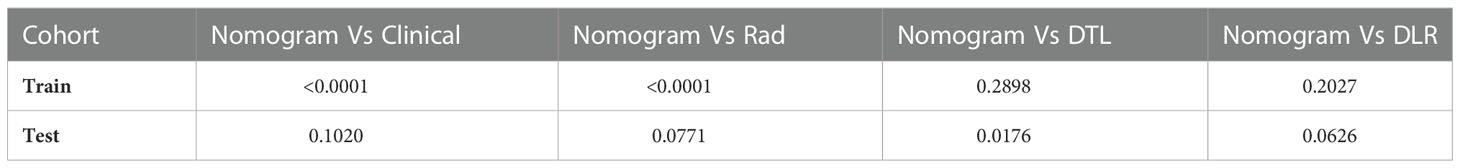
Table 3 Delong test for each model.
The Nomogram calibration curves showed good agreement between the predicted and observed RET/PTC rearrangement in the training and test cohorts. The p-values of the Hosmer–Lemeshow test were 0.5655, 0.4756, 0.3451, 0.9988, and 0.2142 inspections of clinical signature, radiomics signature, DTL signature, DLR signature, and Nomogram (Table 4). This shows that Nomogram perfectly fits in both the training and test cohorts. Figure 7 shows the calibration curves in the training and test cohorts.
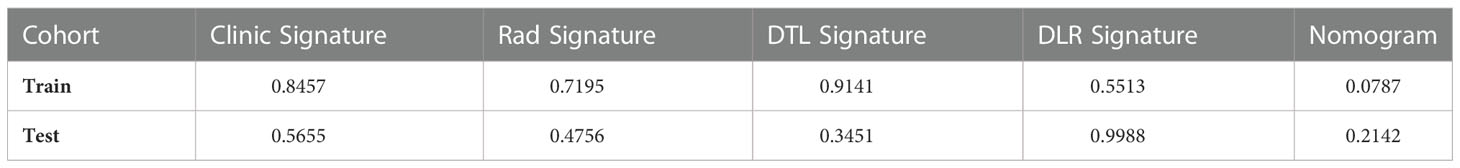
Table 4 Hosmer–Lemeshow test.
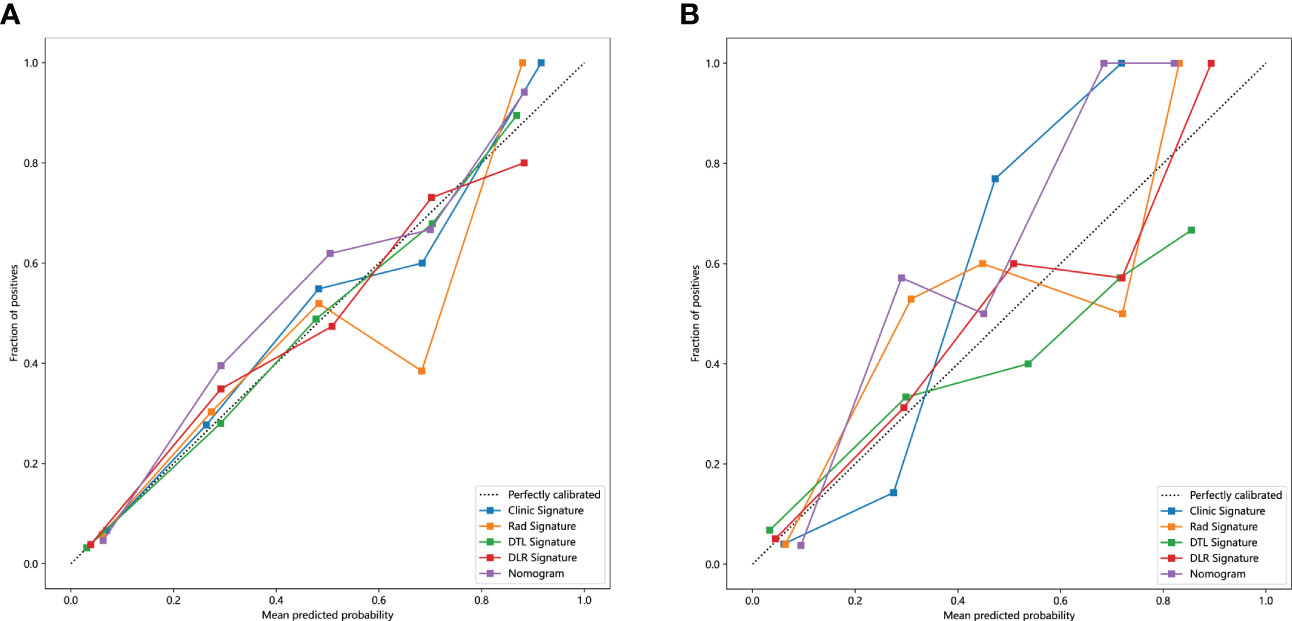
Figure 7 The calibration curves clinic signature, Rad signature, DTL signature, DLR signature and Nomogram. (A) in the training cohort; (B) in the test cohort.
We also evaluated each model through DCA. DCA for the clinical signature, radiomics signature, DTL signature, DLR signature, and Nomogram is presented in Figure 8. The preoperative prediction of RET/PTC rearrangement using a radiomics nomogram has been shown to have better clinical benefits.
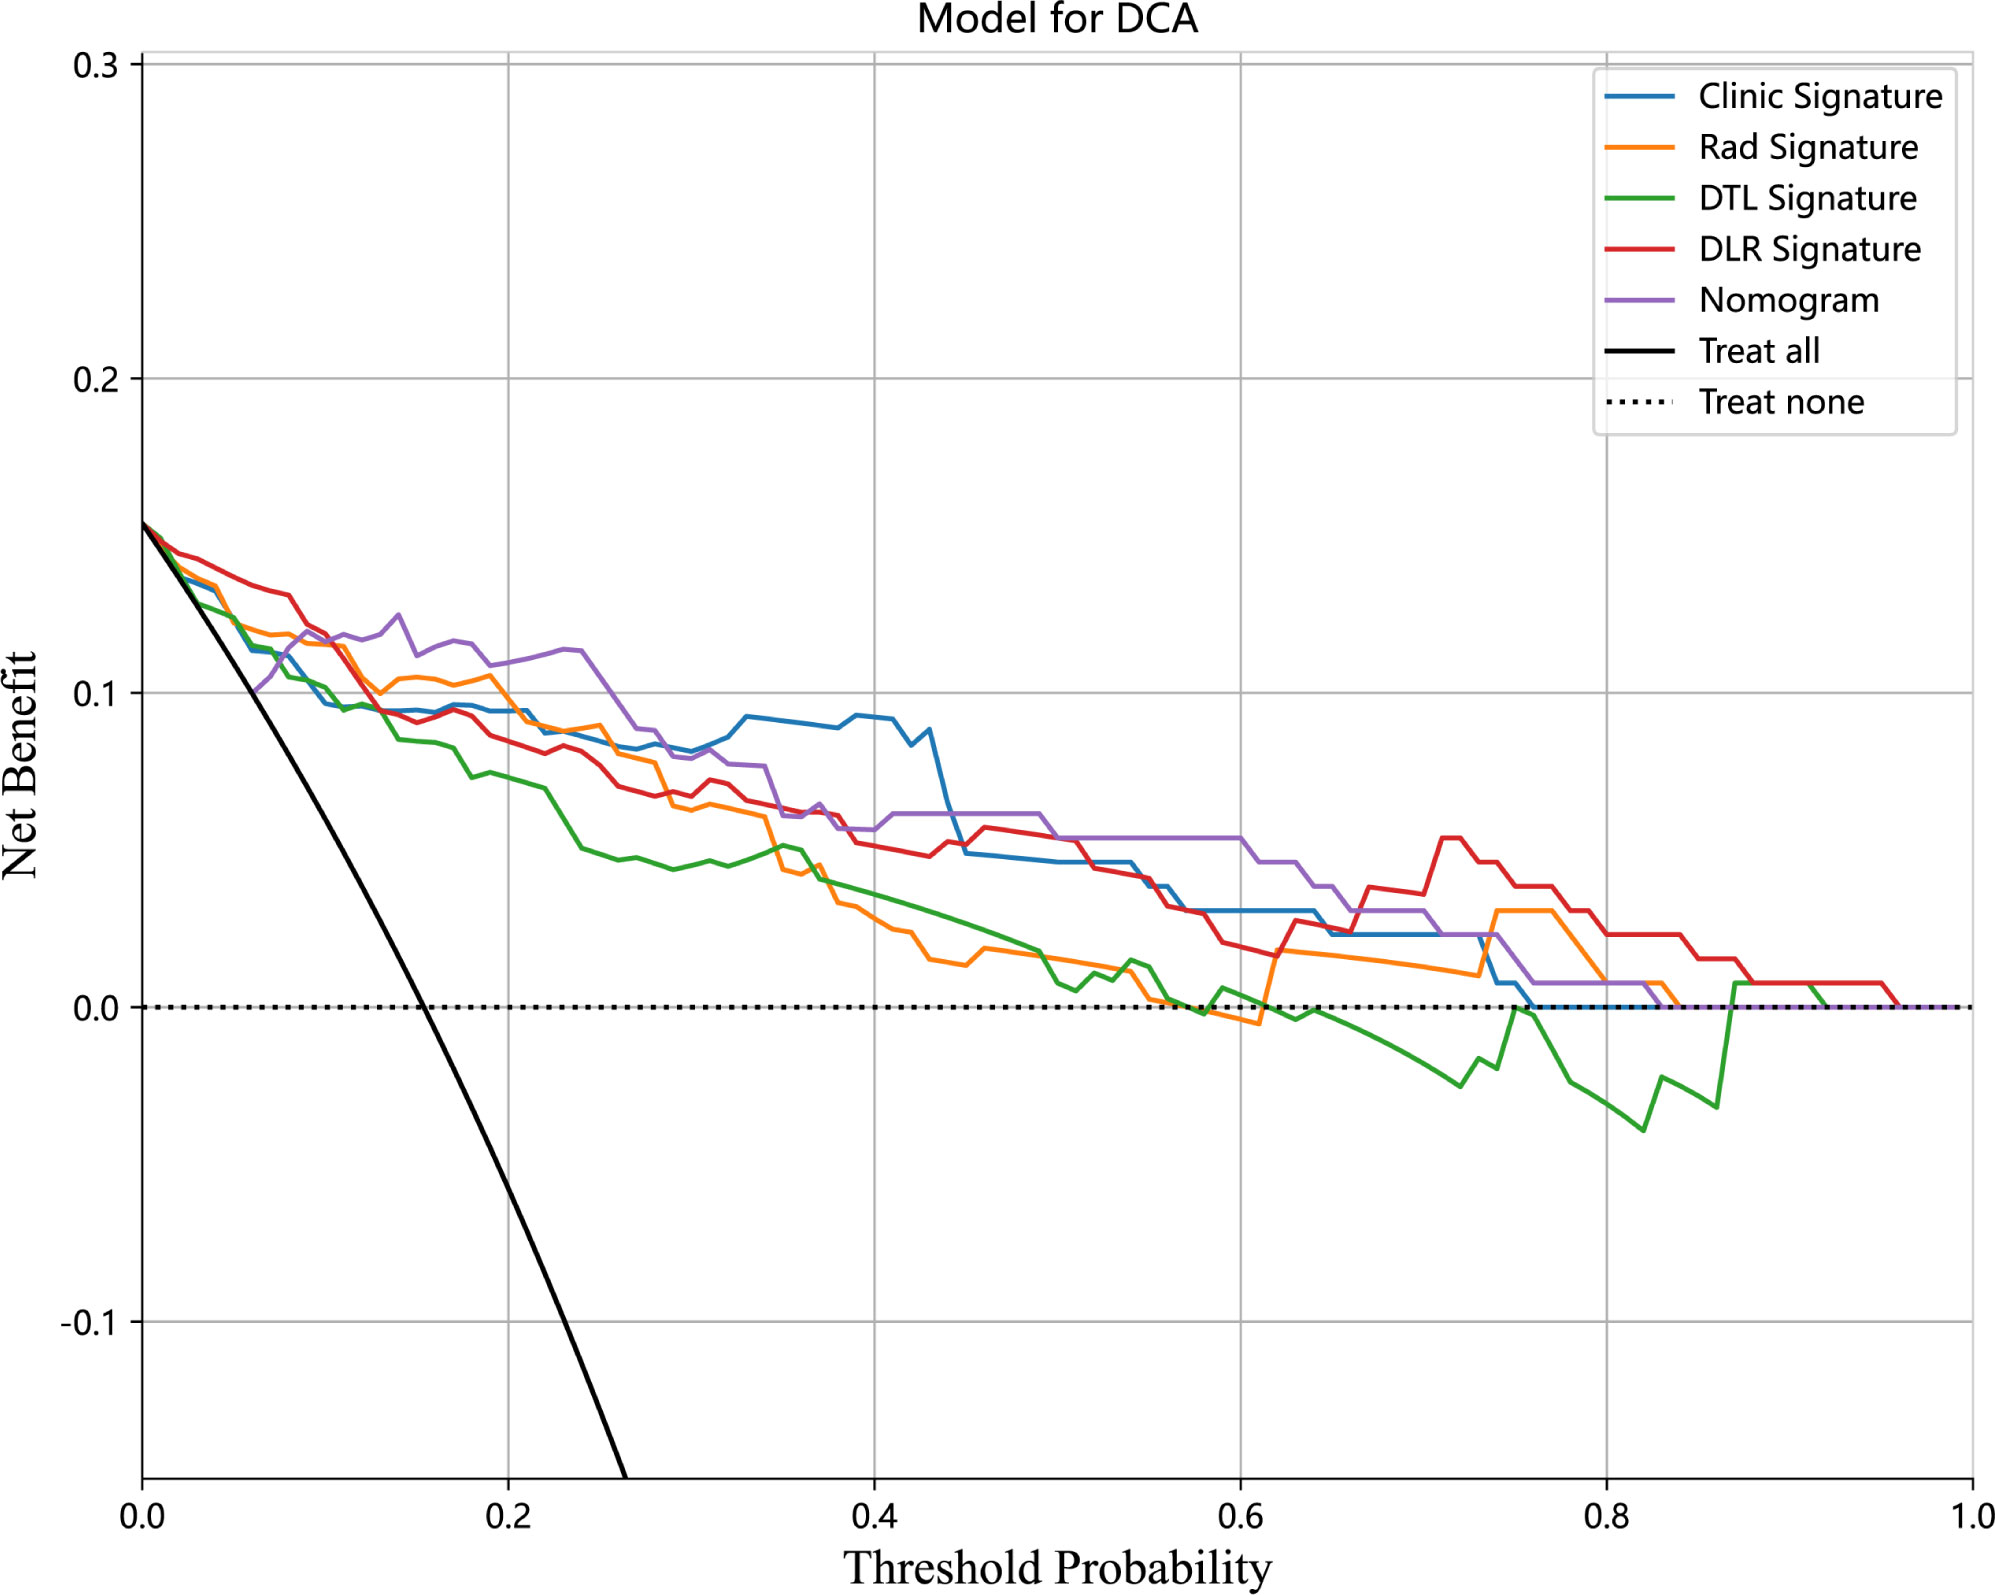
Figure 8 Decision curve analysis (DCA) for the Clinical signature, Rad signature, DTL signature, DLR signature, and Nomogram in the test cohort.
Based on the clinical signature and DLR signature, we established the nomogram to predict the RET/PTC rearrangement (Figure 9).
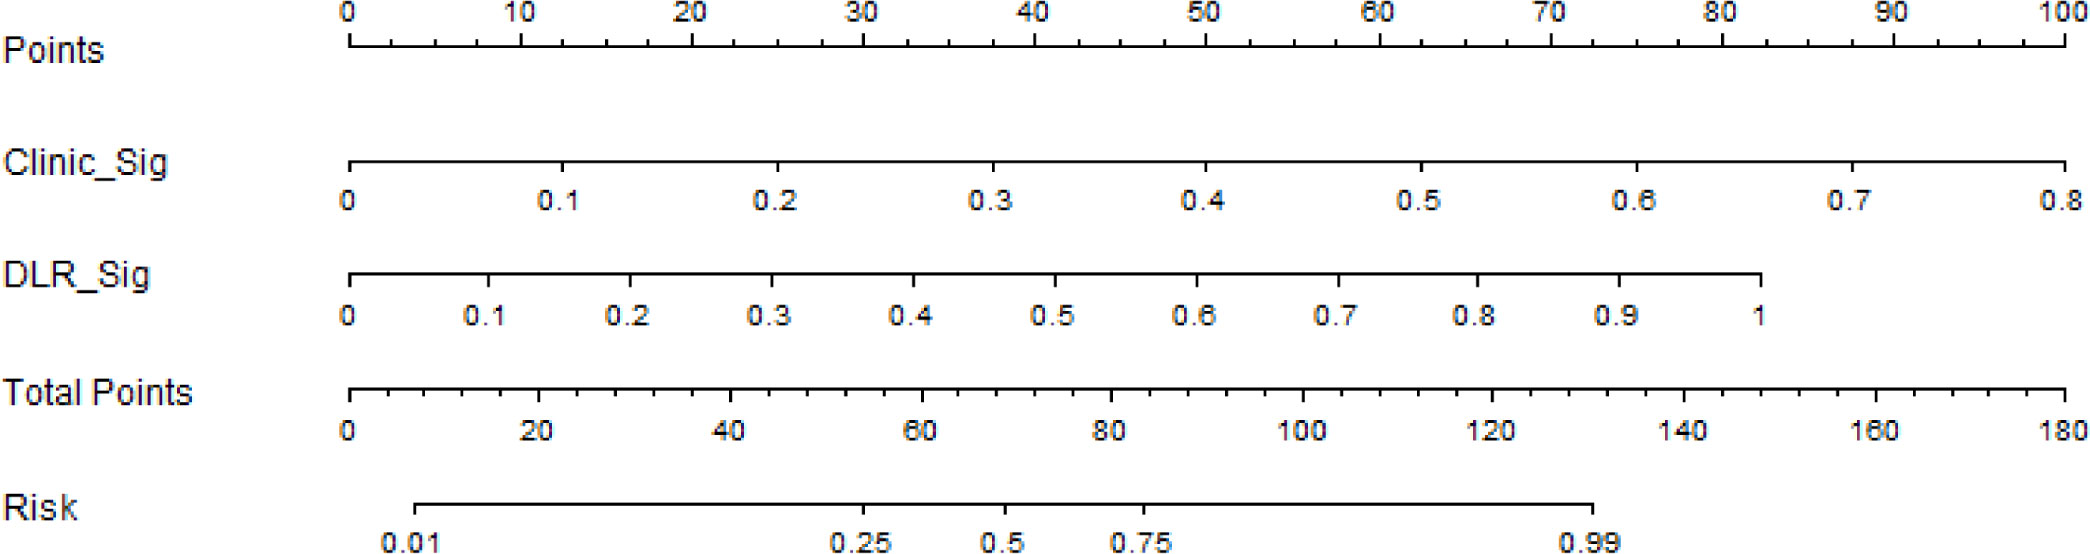
Figure 9 The nomogram to predict RET/PTC rearrangement.
4. Discussion
Most patients with PTC have an excellent prognosis for long-term survival; however, some subtypes of PTC have an aggressive tumor process wherein RET rearrangements are positively associated with high-risk pathological factors for PTC, such as early occurrence, large tumor, rapid growth, and high metastatic capacity (12). RET rearrangements play an important role in the occurrence and development of PTC and can be used as a significant indicator for the diagnosis of PTC. The RET/PTC3 rearrangement is more aggressive than the RET/PTC1 rearrangement, among the most common subtypes of RET rearrangements (14). Therefore, preoperative determination of RET rearrangement will successfully assist in making more aggressive treatment strategies for patients with high-risk PTC. However, due to the low incidence of RET rearrangement in sporadic PTC (approximately 20%), as a routine preoperative examination, the RET gene test is not of good clinical utility.
In this study, we created a novel model built by ultrasound radiomics combined with DTL for the preoperative prediction of RET rearrangement in patients with PTC. We developed and validated five models, the clinical, radiomics, DTL, DLR, and DLRN signatures, for the prediction of the presence of RET/PTC rearrangement by quantitative analysis of thyroid ultrasound images. In both training and test cohorts, DLRN demonstrated the best-predicted performance compared with the other models. The AUC of DLRN in the test cohort could reach 0.9545 (95% CI: 0.9133–0.9558) in the test cohort and 0.9396 (95% CI: 0.9185–0.9607) in the training cohort. DCA showed that DLRN can improve preoperative RET rearrangement prediction. Thus, our results are valuable and can be distinguished from previous studies as the first attempt at combining DLR based on ultrasound images and the clinically rare RET/PTC rearrangement; we also demonstrated the clinical feasibility of DLRN. Furthermore, our study provides a preoperative method to non-invasively assess RET information and assist in design-making when clinicians are faced with ultrasound images that are difficult to determine with the naked eye.
Radiomics uses high-throughput automated extraction algorithms to evaluate the geometry, texture, and echo intensity of nodules; it also shifts from the traditional use of images for visual interpretation to their conversion to quantitative features (25, 26). Radiomics has been used to predict the molecular characteristics of various tumors (27). Concerning thyroid, radiomics has been proposed based on ultrasound images to predict the BRAF mutation (19, 20, 28); however, the models showed limited ability. Moreover, the BRAF mutation is the most representative mutation in PTC and has low specificity among all molecular features. Meanwhile, the significance of traditional ultrasound features for prediction is neglected. Although conventional ultrasound examinations rely only on the radiologist’s visual description of the nodal features and cannot dig deeper into the information and the interpretation of ultrasound images is operator-dependent, there is interobserver variability. By designing the DLR model using ultrasound images and clinical factors, we simultaneously incorporated the DLR and traditional ultrasound features. In this study, four traditional ultrasound features, such as hypoechoic, vertical and horizontal diameter ratio of <1, cluster calcification, and ACR-TI-RADS 5 (highly suspicious), were associated with RET/PTC rearrangement. However, data on the association between RET rearrangement and traditional ultrasound features of PTC are very scarce and frequently inconsistent (16). Previous studies have pointed out that the BRAF mutation of PTC is associated with ultrasound features, such as hypoechoic, microcalcification, and irregular margins (29). Therefore, the traditional ultrasound features with RET/PTC rearrangement in our study were not very representative; however, our results can be used as a reference for further study of RET/PTC rearrangement in ultrasound radiomics. Compared with the DLR signature based on only containing DLR features, incorporating traditional ultrasound features of the nomogram showed a better predictive performance. The ultrasound features are supposed to be included in the analysis along with radiomics parameters for enhancing the diagnostic ability of gene mutation.
Deep learning has shown remarkable progress in medical image analysis, advancing the field forward at a quick pace. DLR has more advantages than hand-crafted and radiomics features. For example, deep learning can extract multilevel features from original images via a hierarchical neural network and automatically identify tumor boundaries. In this study, 19 features with nonzero coefficients were filtered from radiomics and DTL features to create the DLR signature. Among the selected DTL features, there were four most significant and robust features associated with RET rearrangement. For the selected radiomics features, most reflected the image texture and voxel intensity. The human visual system cannot recognize these features; however, these DLR features can serve as an auxiliary tool for the prediction of RET rearrangement in PTC.
There are certain limitations to our study: (1) First, the samples of RET rearrangement were not compared by different subtypes, such as RET/PTC1 and RET/PTC3, due to the insufficient sample size, concluding that this study could only perform primary screening of patients with RET rearrangement in PTC and not predict the specific subtypes. (2) Second, as this was a retrospective study, a selection bias may exist. Therefore, we aim to conduct a prospective study in the future to control for confounding variables. (3) Lastly, there was a lack of external validation as it was a single-center, small-sample study; therefore, this model needs to be further validated in a multi-center, larger sample size survey.
Data availability statement
The raw data supporting the conclusions of this article will be made available by the authors, without undue reservation.
Ethics statement
The studies involving human participants were reviewed and approved by The Ethics Committee of the First Affiliated Hospital of Zhengzhou University. Written informed consent from the participants’ legal guardian/next of kin was not required to participate in this study in accordance with the national legislation and the institutional requirements.
Author contributions
JY: collected the all data from our hospital, statistical analysis, and drafting of the manuscript. YZ: contributed to analysis and manuscript preparation. JZ and MJ: the accuracy of the data and proof reader. XL: supervision and proof reader. All authors contributed to the article and approved the submitted version.
Funding
This work was supported by the National Nature Science Foundation of China Youth Science Fund Project (No.81902881); Academic Leader of Young and Middle-aged Health in Henan Province (No.NSWJW-2020004) and Leading talents Plan in Henan Province (No.ZYYCYU202012116).
Acknowledgments
The authors appreciate assistance with the access of data from Information Management Center of the First Affiliated Hospital of Zhengzhou University.
Conflict of interest
The authors declare that the research was conducted in the absence of any commercial or financial relationships that could be construed as a potential conflict of interest.
Publisher’s note
All claims expressed in this article are solely those of the authors and do not necessarily represent those of their affiliated organizations, or those of the publisher, the editors and the reviewers. Any product that may be evaluated in this article, or claim that may be made by its manufacturer, is not guaranteed or endorsed by the publisher.
Supplementary material
The Supplementary Material for this article can be found online at: https://www.frontiersin.org/articles/10.3389/fendo.2022.1062571/full#supplementary-material
References
1. Siegel RL, Miller KD, Fuchs HE, Jemal A. Cancer statistics, 2021. CA Cancer J Clin (2021) 71(1):7–33. doi: 10.3322/caac.21654
2. Ito Y, Miyauchi A, Kihara M, Fukushima M, Higashiyama T, Miya A. Overall survival of papillary thyroid carcinoma patients: A single-institution long-term follow-up of 5897 patients. World J Surg (2018) 42(3):615–22. doi: 10.1007/s00268-018-4479-z
3. Grogan RH, Kaplan SP, Cao H, Weiss RE, Degroot LJ, Simon CA, et al. A study of recurrence and death from papillary thyroid cancer with 27 years of median follow-up. Surgery (2013) 154(6):1436–46;discussion 46-7. doi: 10.1016/j.surg.2013.07.008
4. Gan T, Huang B, Chen Q, Sinner HF, Lee CY, Sloan DA, et al. Risk of recurrence in differentiated thyroid cancer: A population-based comparison of the 7th and 8th editions of the American joint committee on cancer staging systems. Ann Surg Oncol (2019) 26(9):2703–10. doi: 10.1245/s10434-019-07275-1
5. Xing M. Molecular pathogenesis and mechanisms of thyroid cancer. Nat Rev Cancer (2013) 13(3):184–99. doi: 10.1038/nrc3431
6. Chu YH, Wirth LJ, Farahani AA, Nose V, Faquin WC, Dias-Santagata D, et al. Clinicopathologic features of kinase fusion-related thyroid carcinomas: An integrative analysis with molecular characterization. Mod Pathol (2020) 33(12):2458–72. doi: 10.1038/s41379-020-0638-5
7. Li AY, McCusker MG, Russo A, Scilla KA, Gittens A, Arensmeyer K, et al. Ret fusions in solid tumors. Cancer Treat Rev (2019) 81:101911. doi: 10.1016/j.ctrv.2019.101911
8. Fagin JA, Mitsiades N. Molecular pathology of thyroid cancer: Diagnostic and clinical implications. Best Pract Res Clin Endocrinol Metab (2008) 22(6):955–69. doi: 10.1016/j.beem.2008.09.017
9. Romei C, Elisei R. Ret/Ptc translocations and clinico-pathological features in human papillary thyroid carcinoma. Front Endocrinol (Lausanne) (2012) 3:54. doi: 10.3389/fendo.2012.00054
10. Zafon C, Obiols G, Castellví J, Tallada N, Baena JA, Simó R, et al. Clinical significance of Ret/Ptc and P53 protein expression in sporadic papillary thyroid carcinoma. Histopathology (2007) 50(2):225–31. doi: 10.1111/j.1365-2559.2006.02555.x
11. Fisher SB, Cote GJ, Bui-Griffith JH, Lu W, Tang X, Hai T, et al. Genetic characterization of medullary thyroid cancer in childhood survivors of the Chernobyl accident. Surgery (2019) 165(1):58–63. doi: 10.1016/j.surg.2018.08.029
12. Adeniran AJ, Zhu Z, Gandhi M, Steward DL, Fidler JP, Giordano TJ, et al. Correlation between genetic alterations and microscopic features, clinical manifestations, and prognostic characteristics of thyroid papillary carcinomas. Am J Surg Pathol (2006) 30(2):216–22. doi: 10.1097/01.pas.0000176432.73455.1b
13. Ullmann TM, Thiesmeyer JW, Lee YJ, Beg S, Mosquera JM, Elemento O, et al. Ret fusion-positive papillary thyroid cancers are associated with a more aggressive phenotype. Ann Surg Oncol (2022) 29(7):4266–73. doi: 10.1245/s10434-022-11418-2
14. Cancer Genome Atlas Research N. Integrated genomic characterization of papillary thyroid carcinoma. Cell (2014) 159(3):676–90. doi: 10.1016/j.cell.2014.09.050
15. Di Cristofaro J, Vasko V, Savchenko V, Cherenko S, Larin A, Ringel MD, et al. Ret/Ptc1 and Ret/Ptc3 in thyroid tumors from Chernobyl liquidators: Comparison with sporadic tumors from Ukrainian and French patients. Endocr Relat Cancer (2005) 12(1):173–83. doi: 10.1677/erc.1.00884
16. Lewinski A, Adamczewski Z, Zygmunt A, Markuszewski L, Karbownik-Lewinska M, Stasiak M. Correlations between molecular landscape and sonographic image of different variants of papillary thyroid carcinoma. J Clin Med (2019) 8(11):1916. doi: 10.3390/jcm8111916
17. Park VY, Lee E, Lee HS, Kim HJ, Yoon J, Son J, et al. Combining radiomics with ultrasound-based risk stratification systems for thyroid nodules: An approach for improving performance. Eur Radiol (2021) 31(4):2405–13. doi: 10.1007/s00330-020-07365-9
18. Yoon JH, Han K, Lee E, Lee J, Kim EK, Moon HJ, et al. Radiomics in predicting mutation status for thyroid cancer: A preliminary study using radiomics features for predicting Brafv600e mutations in papillary thyroid carcinoma. PloS One (2020) 15(2):e0228968. doi: 10.1371/journal.pone.0228968
19. Kwon MR, Shin JH, Park H, Cho H, Hahn SY, Park KW. Radiomics study of thyroid ultrasound for predicting braf mutation in papillary thyroid carcinoma: Preliminary results. AJNR Am J Neuroradiol (2020) 41(4):700–5. doi: 10.3174/ajnr.A6505
20. Wang YG, Xu FJ, Agyekum EA, Xiang H, Wang YD, Zhang J, et al. Radiomic model for determining the value of elasticity and grayscale ultrasound diagnoses for predicting Braf(V600e) mutations in papillary thyroid carcinoma. Front Endocrinol (Lausanne) (2022) 13:872153. doi: 10.3389/fendo.2022.872153
21. Handelman GS, Kok HK, Chandra RV, Razavi AH, Lee MJ, Asadi H. Edoctor: Machine learning and the future of medicine. J Internal Med (2018) 284(6):603–19. doi: 10.1111/joim.12822
22. Hosny A, Parmar C, Quackenbush J, Schwartz LH, Aerts H. Artificial intelligence in radiology. Nat Rev Cancer (2018) 18(8):500–10. doi: 10.1038/s41568-018-0016-5
23. Jiang Y, Yang M, Wang S, Li X, Sun Y. Emerging role of deep learning-based artificial intelligence in tumor pathology. Cancer Commun (Lond) (2020) 40(4):154–66. doi: 10.1002/cac2.12012
24. Bini F, Pica A, Azzimonti L, Giusti A, Ruinelli L, Marinozzi F, et al. Artificial intelligence in thyroid field-a comprehensive review. Cancers (Basel) (2021) 13(19):4740. doi: 10.3390/cancers13194740
25. Sorrenti S, Dolcetti V, Radzina M, Bellini MI, Frezza F, Munir K, et al. Artificial intelligence for thyroid nodule characterization: Where are we standing? Cancers (Basel) (2022) 14(14):3357. doi: 10.3390/cancers14143357
26. Mayerhoefer ME, Materka A, Langs G, Haggstrom I, Szczypinski P, Gibbs P, et al. Introduction to radiomics. J Nucl Med (2020) 61(4):488–95. doi: 10.2967/jnumed.118.222893
27. Qi Y, Zhao T, Han M. The application of radiomics in predicting gene mutations in cancer. Eur Radiol (2022) 32(6):4014–24. doi: 10.1007/s00330-021-08520-6
28. Tang J, Jiang S, Ma J, Xi X, Li H, Wang L, et al. Nomogram based on radiomics analysis of ultrasound images can improve preoperative braf mutation diagnosis for papillary thyroid microcarcinoma. Front Endocrinol (Lausanne) (2022) 13:915135. doi: 10.3389/fendo.2022.915135
Keywords: papillary thyroid carcinoma, radiomics, deep learning, nomogram, RET rearrangement, prediction
Citation: Yu J, Zhang Y, Zheng J, Jia M and Lu X (2022) Ultrasound images-based deep learning radiomics nomogram for preoperative prediction of RET rearrangement in papillary thyroid carcinoma. Front. Endocrinol. 13:1062571. doi: 10.3389/fendo.2022.1062571
Received: 06 October 2022; Accepted: 12 December 2022;
Published: 20 December 2022.
Edited by:
Jose Federico Carrillo, National Institute of Cancerology (INCAN), MexicoReviewed by:
Jianing Zhu, Zhejiang University, ChinaXiaozhu Liu, Second Affiliated Hospital of Chongqing Medical University, China
Copyright © 2022 Yu, Zhang, Zheng, Jia and Lu. This is an open-access article distributed under the terms of the Creative Commons Attribution License (CC BY). The use, distribution or reproduction in other forums is permitted, provided the original author(s) and the copyright owner(s) are credited and that the original publication in this journal is cited, in accordance with accepted academic practice. No use, distribution or reproduction is permitted which does not comply with these terms.
*Correspondence: Xiubo Lu, ZG9jdG9ybHV4aXVib0AxMjYuY29t; Meng Jia, ZHJfamlhbWVuZ0AxNjMuY29t