 Huan Wang1†
 Guixia Wang
 Weiwei Cui
- 1Department of Endocrinology and Metabolism, First Hospital of Jilin University, Changchun, China
- 2Department of Nutrition and Food Hygiene, School of Public Health, Jilin University, Changchun, China
Background: Triglyceride glucose (TyG) index as a more convenient and reliable predictor of insulin resistance (IR) is thought to be associated with many diseases, but its relationship with cancer remains unclear.
Methods: The meta-analysis was conducted to evaluate the effects of TyG index on cancer risk utilizing the available evidence. PubMed, EMBASE, Medline, Cochrane Library and Web of Science were searched from their inception up to July 2022. A random-effects model was used to calculate the effect estimates and 95% confidence intervals (CIs).
Results: A total of 6 observational studies met our inclusion criteria, which including 992292 participants. The meta-analysis indicated that the higher TyG index increased cancer risk compared to the lower TyG index group (total effect size =1.14, 95% CI [1.08, 1.20], P<0.001).
Conclusions: Our meta-analysis found that higher TyG index may increase the risk of cancer. More prospective cohort studies and basic research are warranted to verify the relationship.
1 Introduction
Cancer is the result of a serious disruption in the regulation of cell growth and proliferation, usually manifesting as a local abnormal tissue mass in the body (1, 2). Cancer can not only infiltrate and grow in the primary site and involve adjacent organs or tissues, but also spread to other parts of the body through a variety of ways (lymphatic metastasis, hematogenous metastasis and seeding metastasis), which will seriously increase its harmfulness (3, 4). At present, cancer incidence and mortality are increasing rapidly all over the world, posing a major challenge to society, healthcare systems, and patients and their families. The Global Burden of Cancer Report estimates that 19.3 million new cancer cases will be found and 10.0 million people will die from cancer in 2020, overtaking heart disease as the second common cause of death in the world (5, 6). According to the latest projections, an estimated 28.4 million new cancer cases will occur globally in 2040, a 47% increase from the corresponding 19.3 million cases in 2020 (5). Cancer will become the world’s leading cause of death and the greatest obstacle of extending life expectancy in the 21st century (7). Fortunately, recent studies have manifested that the elimination or reduction of known unhealthy lifestyles and environmental risk factors could prevent one-third to two-fifths of new cancer patients (8, 9). For example, people who often consume rich saturated fat and refined sugar in their daily life might increase body fat accumulation and impaired glucose and insulin regulation, which in turn altered physiological hormonal homeostasis and ultimately increased cancer risk (10, 11).
The formation of cancer is a complex process, the result of severe disturbances in the regulation of cell growth and proliferation. Recently, emerging evidence confirmed that Insulin resistance (IR), partly regulated by diet and lifestyle (12, 13), was strongly associated with the morbidity and mortality of various cancers, including colorectal cancer, breast cancer and lung cancer (14–18). This phenomenon might be due to the fact that IR directly increases cell proliferation and inhibits cell apoptosis, activates insulin-like growth factor (IGF-1) receptors or triggers oxidative stress and inflammatory processes, thereby promoting the occurrence and development of cancer (10, 19–22).
It is well known that the Homeostatic Model Assessment of Insulin Resistance and hyperinsulinemic-euglycemic clamp test can measure IR effectively (23, 24). Moreover, several studies have demonstrated that triglyceride glucose (TyG) index has been considered to be a more convenient and reliable predictor of IR compared to these two common measurement tools (23, 25). Furthermore, the TyG index has been reported to be closely related to the occurrence of cancer (26, 27). Nevertheless, recent studies have also shown that the cancer risk was not affected by the TyG index (28, 29). The role of TyG index in cancer risk remains controversial and its relationship has not been demonstrated in meta-analysis. Therefore, we performed a meta-analysis of all relevant observational studies focusing mainly on the association of cancer risk with TyG index.
2 Methods
2.1 Sources and methods of data retrieval
Our meta-analysis was conducted in accordance with the PRISMA guidelines and extensions (30) and the specific details are shown in Table S1. The electronic databases including PubMed, EMBASE, Web of Science, Medline and Cochrane Library were searched from the inception up to July 2022. The following terms (combined with the Boolean logical operator ‘OR.’ or ‘AND’) were used for the literature search: cancer, tumor, neoplasms [MeSH Terms], malignant neoplasm, carcinoma [MeSH Terms], triglyceride glucose index, TyG index, triglyceride glucose indices and Triglyceride/glucose index. Terms such as population, language and study design were not restricted in the literature search. The specific search strategies are listed in Table S2.
2.2 Inclusion and exclusion criteria
The eligible studies were based on the following criteria (1): the study design was observational study; (2) TyG index could be obtained via laboratory examination and cancer in a specific anatomical site was clearly defined as an outcome indicator; (3) Association between TyG index and cancer risk was presented by odds ratios (ORs) or hazard ratios (HRs) along with their 95% confidence intervals (CIs), or comprehensive data was provided to calculate them; Meanwhile, we excluded some studies such as in vitro studies, animal experiments, duplicate literature, reviews, letters, case report or conference papers. Two researchers independently reviewed all relevant studies, extracted potentially eligible data, fully discussed and resolved uncertainty and disagreements (Figure 1).
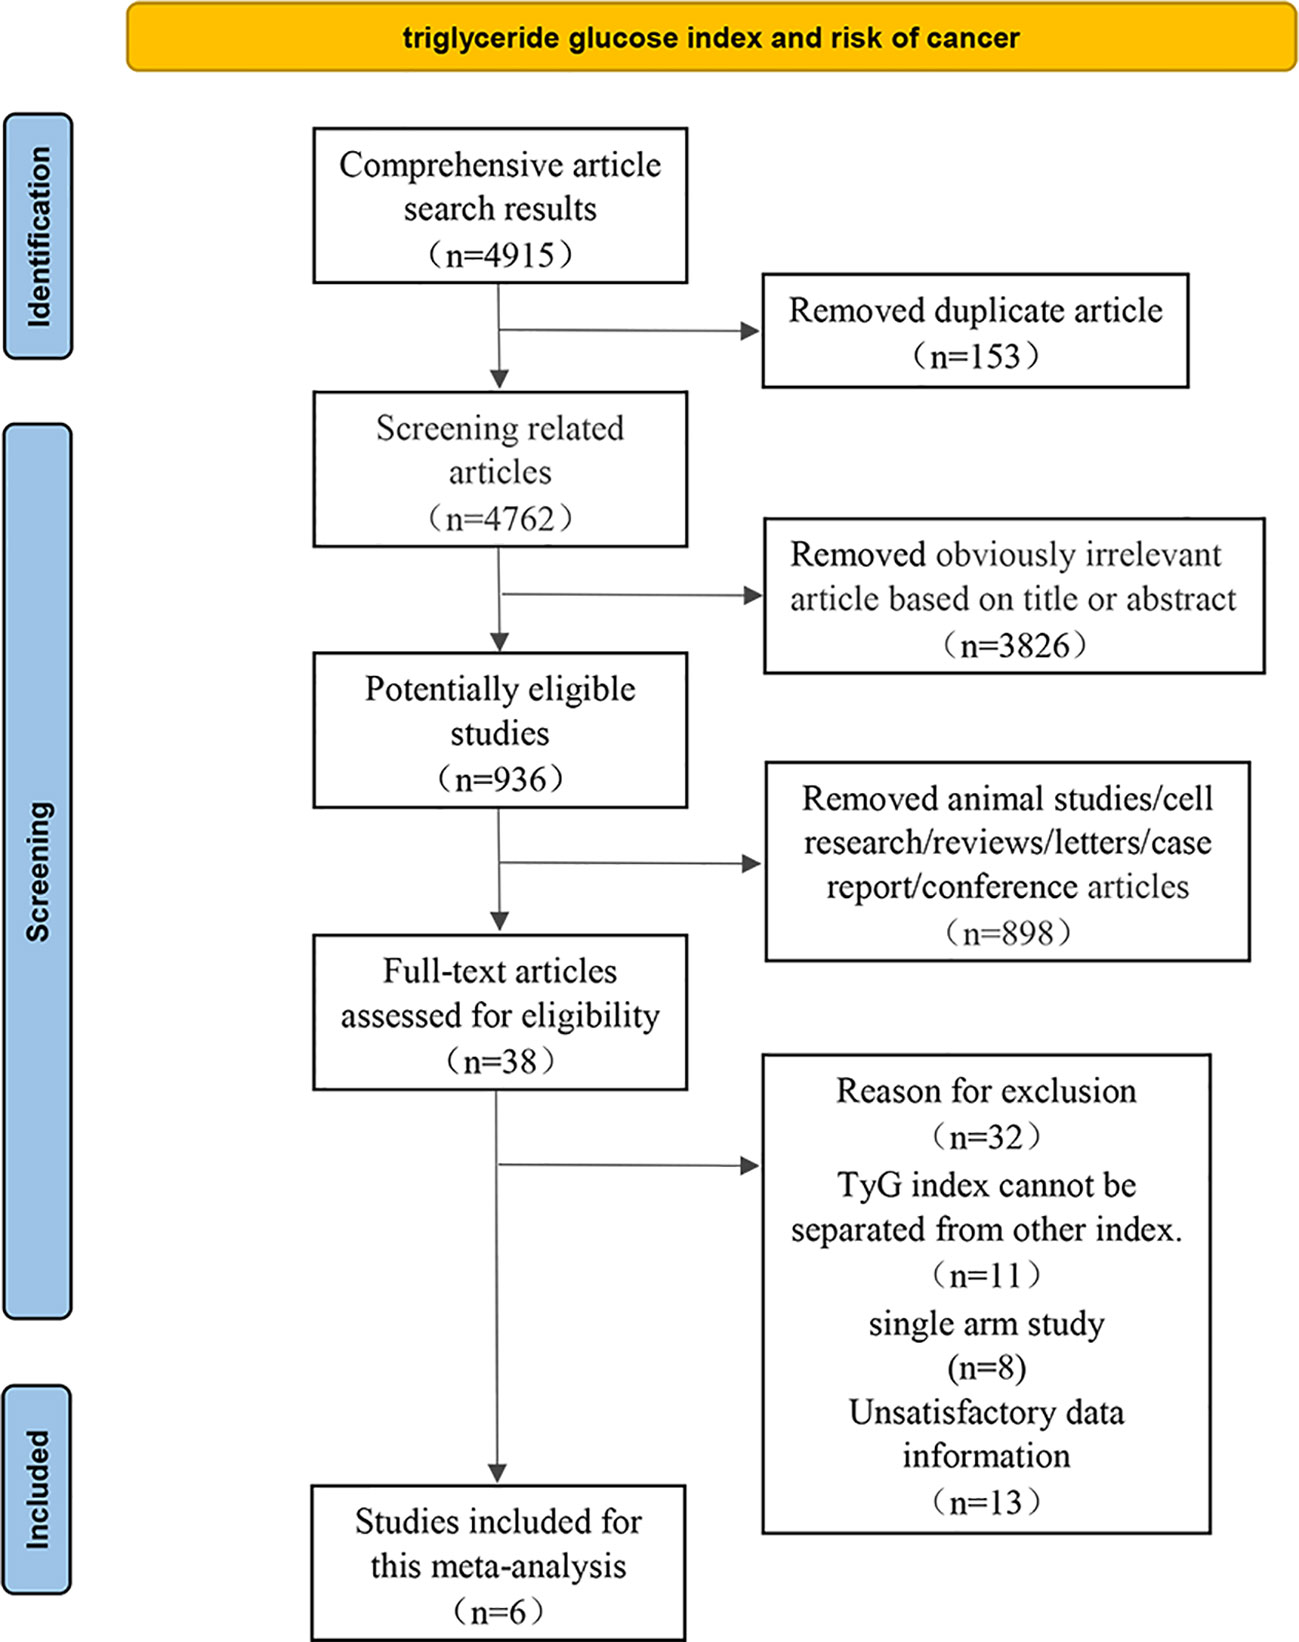
Figure 1 Flow diagram of the literature search and selection.
2.3 Data abstraction
We extracted the following crucial data among all included relevant studies: (1) first author, publication year, the nationality of subjects, study design, cancer site, sample size, mean age and gender of participant. (2) TyG index levels in different groups. (3) Adjusted total cancer risk estimates (OR or HR) and their corresponding 95% CIs.
2.4 Quality assessment
The quality of the observational literature was assessed independently by two investigators using the Newcastle-Ottawa scale (NOS) (31). This scale consists of three parts with a total of 9 points. Quality scores of greater than 6 is regarded as low bias risk (32). At the same time, the Grading of Recommendations Assessment, Development and Evaluation (GRADE) system was used to evaluate the quality and strength of evidence for observational study (33). The included trials were divided into four grades, with the higher the grade, the higher the quality of the literature.
2.5 Statistical analysis
Statistical analyses were carried out using the software RevMan version 5.3 and Stata version 12.0. The multivariate-adjusted risk estimates (OR or HR values) from all the individual studies were collected to calculate the total effect sizes and 95% CIs via random effects model. A statistical heterogeneity analysis was performed by using Cochran’s Q statistic and the I2 statistic (34). Significant heterogeneity was considered if the P value was<0.05 and we used the I2 value to estimate the degree of heterogeneity, whereby 25%, 50%, and 75% represented low, medium and high heterogeneity, respectively (35).
The sources of heterogeneity were explored via sensitivity analysis, subgroup analyses and meta-regression analysis. A sensitivity analysis was performed to evaluate the effect of a specific study on the overall results by excluding one individual study at a time and combining the effect values of the remaining studies (36). Study designs (cohort studies and case control studies), region of subjects (Asia and Europe) and type of cancer (obesity related cancers and non-obesity related cancers) were considered when conducting subgroup analyses (37). Meta-regression analyses were carried out to quantitatively assess heterogeneity among the strata.
Potential publication bias was assessed using funnel plot symmetry and Egger’s test (38, 39). Trim and fill method was conducted to correct the result of bias and evaluate the impact of bias on the pooled risk estimates (40).
3 Results
4915 relevant articles were identified initially screened from electronic databases, but only 6 articles (992292 participants) met our inclusion criteria (Figure 1). These six articles included three cohort studies (27, 29, 41) with 862726 participants and three case-control studies (42–44) with 129566 participants. The detailed results are summarized in Table 1. Four of these studies were conducted in Asia (41–44), only two in Europe (27, 29). In addition, the outcome of four studies were obesity-related cancers (27, 41, 43, 44) and two were non-obesity-related cancers (29, 42). The risk of bias within included literature were evaluated via the NOS (Tables 1; S3). This average NOS score was 7.17 for all included studies, indicating high study quality. Simultaneously, the GRADE system was utilized to classify the quality of the included evidence. Its results were considered to be of medium quality (Table 2).
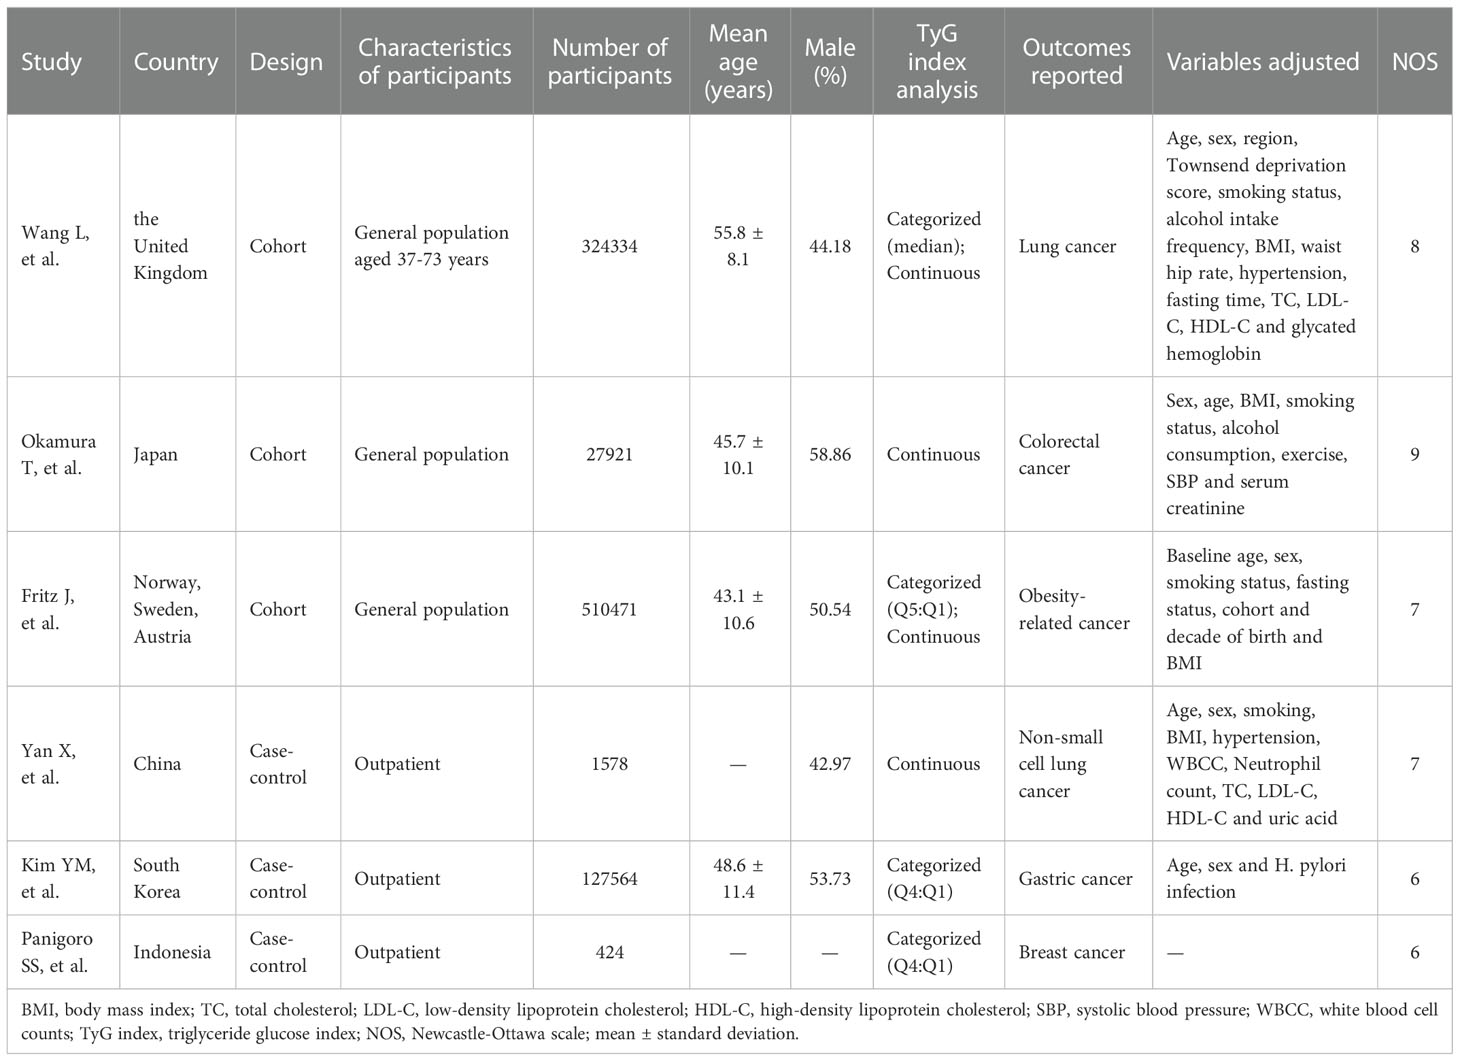
Table 1 Baseline characteristics of the participants.
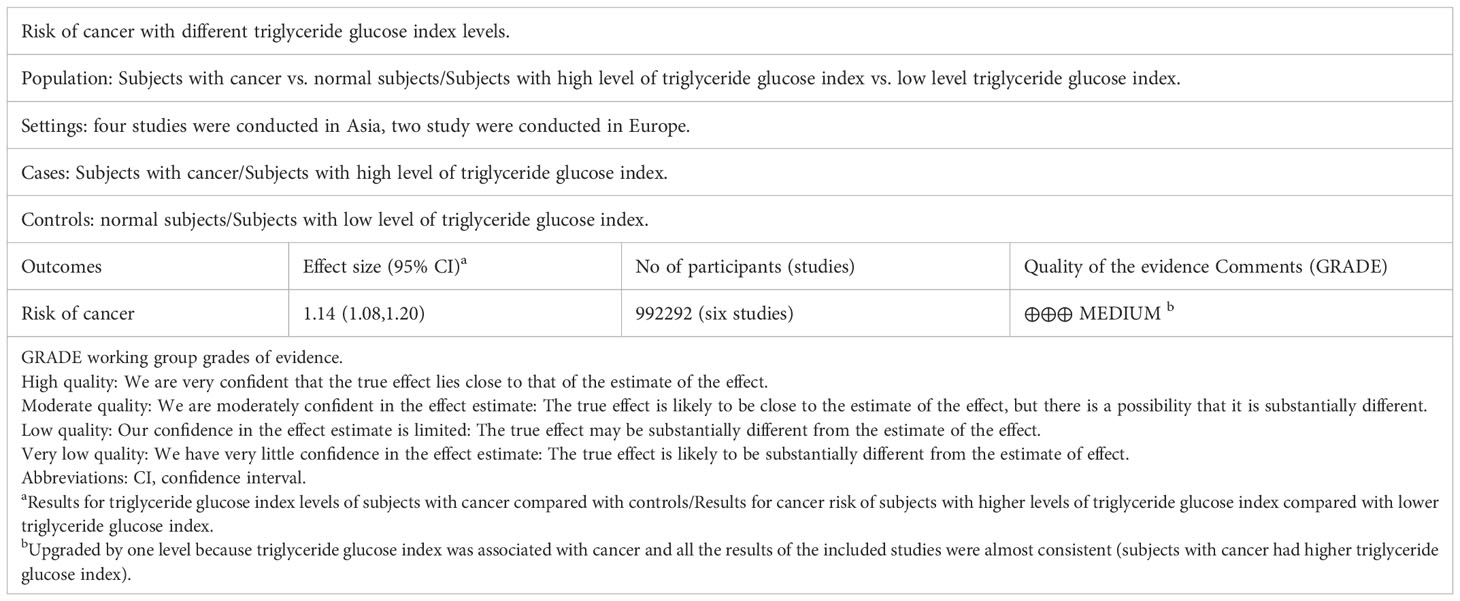
Table 2 The Summary of Findings (SoF) with GRADE system.
The meta-analysis showed that a higher TyG index increased the risk of cancer compared to a lower TyG index group (pooled effect size =1.14, 95% CI [1.08, 1.20], I2 =85.1%, P<0.001, Figure 2).
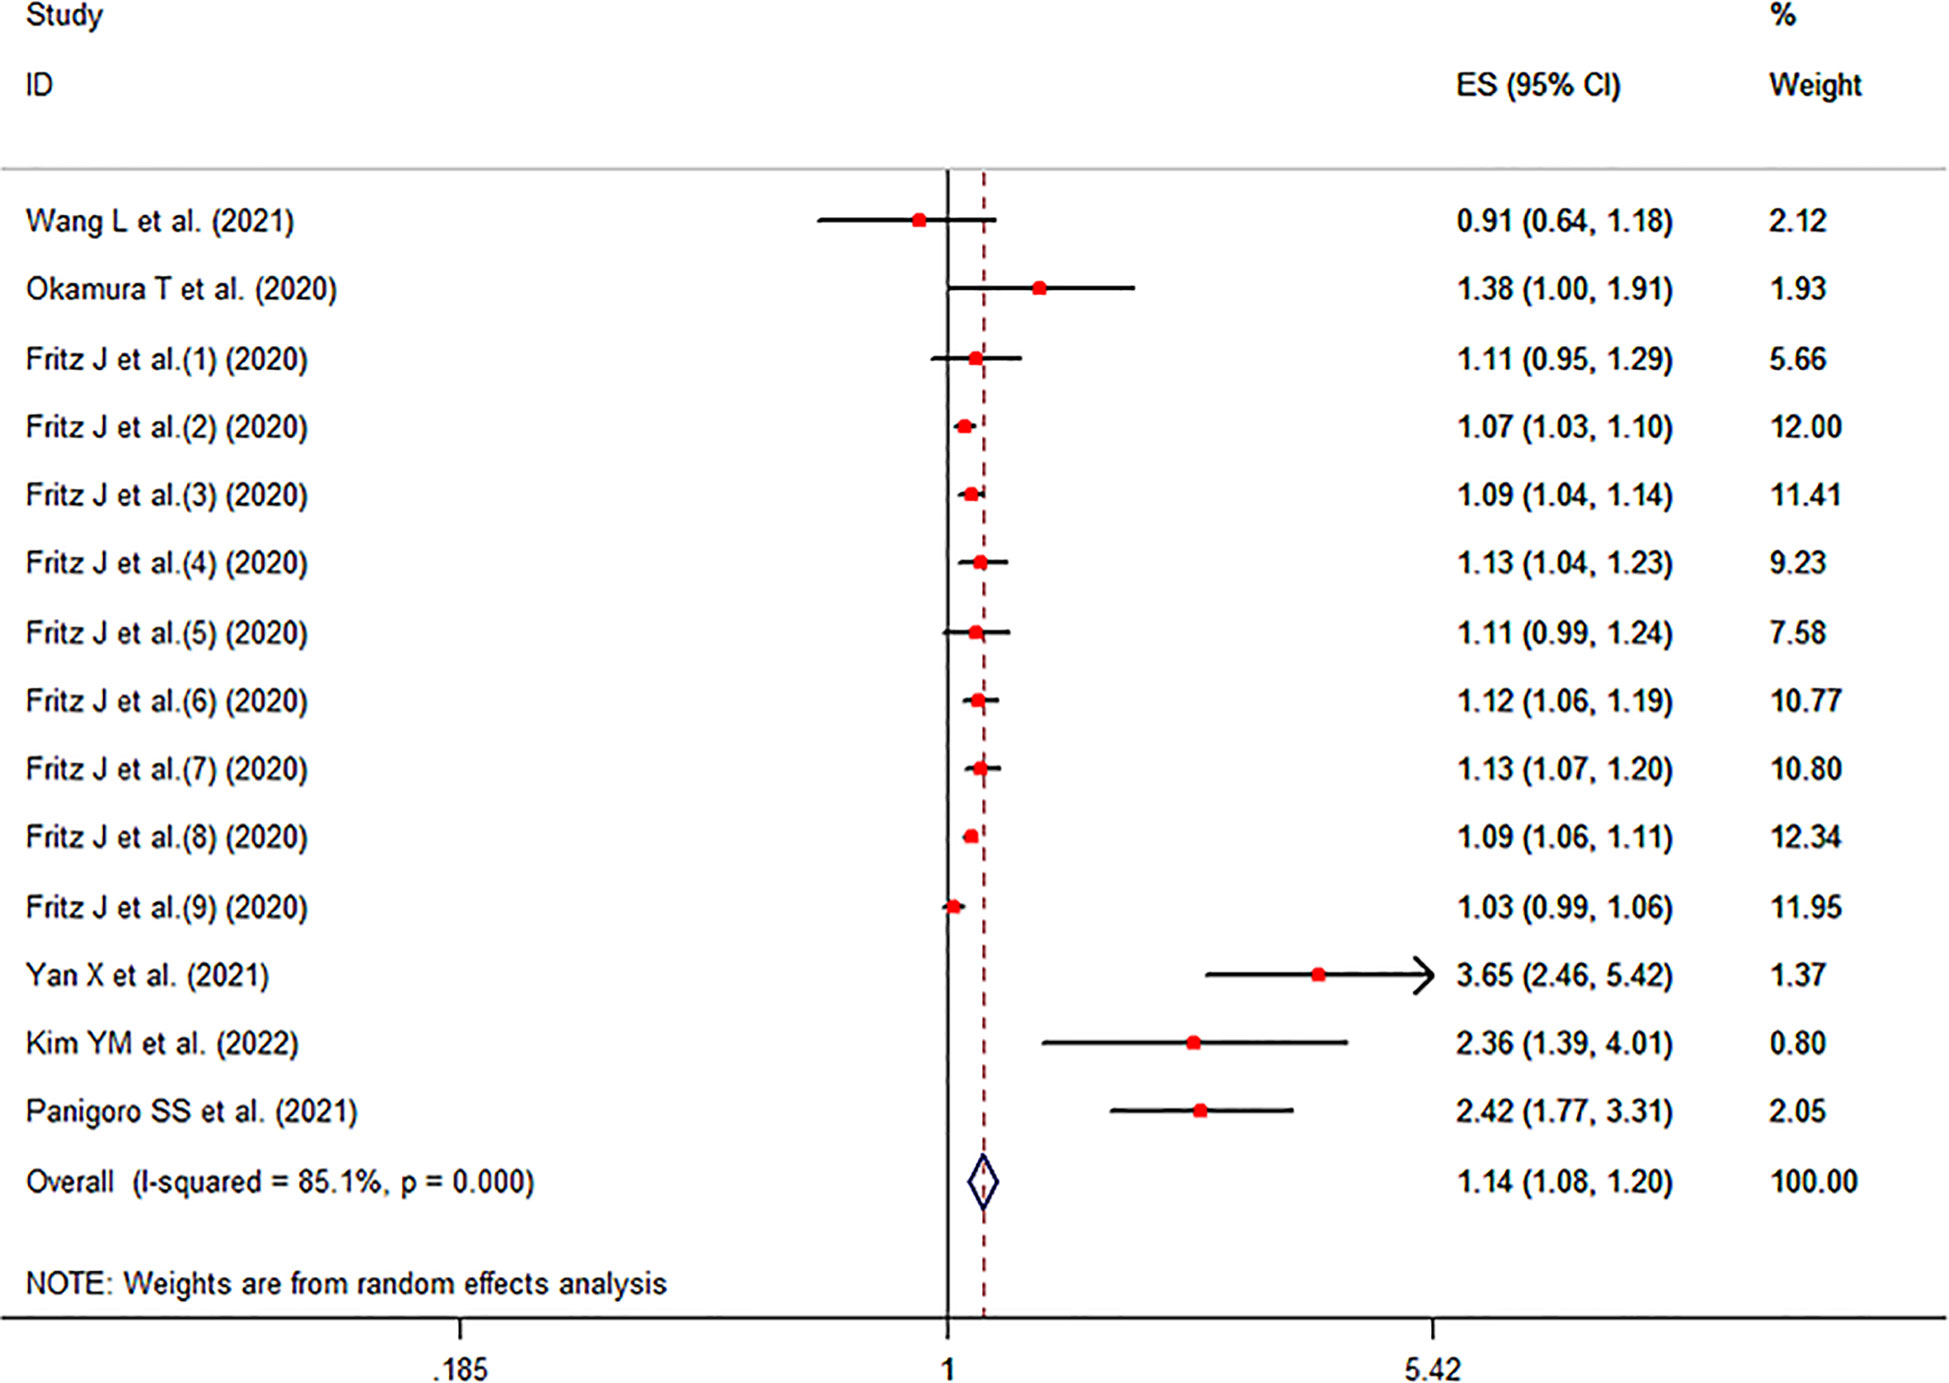
Figure 2 Forest plot of the cancer risk in subjects with high TyG index vs. control groups.
Sensitivity analysis indicated no extreme results affecting the pooled risk estimates (Figure S1). Meanwhile, the subgroup analyses were carried out in accordance with study design, region of subjects and cancer type. Cohort studies and case-control studies both showed a connection between TyG index and cancer (cohort studies: effect size =1.09, 95% CI [1.06,1.11], I2 =41.9, P<0.001; case-control studies: effect size =2.76, 95% CI [2.09,3.65], I2 =31.9, P<0.001). Moreover, in subgroup analyses of region, the TyG index was related to the risk of cancer in all results (Asia: effect size =2.29, 95% CI [1.51,3.49], I2 =79.6, P<0.001; Europe: effect size =1.08, 95% CI [1.06,1.11], I2 =40.1, P<0.001). Furthermore, the results of subgroup analysis in the light of the cancer type demonstrated that TyG index was associated with obesity-related cancers (effect size =1.11, 95% CI [1.07,1.16], I2 =77.8, P<0.001). However, the relationship was not found in another subgroup. The specific details are shown in Table 3. The meta-regression identified study design and region as significant moderators for the cancer development (P<0.001). However, no similar effect between obesity-related cancers and non-obesity-related cancers was observed (Table 4). Therefore, we reasoned that heterogeneity might be caused primarily by study design and region factors based on the results of subgroup and meta-regression analyses.The funnel plot was asymmetric on visual inspection, indicating a high potential for publication bias (Figure 3). At the same time, the publication bias was also found by the Egger’s test (P=0.012). However, the effect size was no significant change after the trim and fill (adjusted: pooled estimate [95%CI]:1.083 [1.022,1.147], P=0.007, number of trim and fill=4), suggesting that the publication bias had little effect on the results.
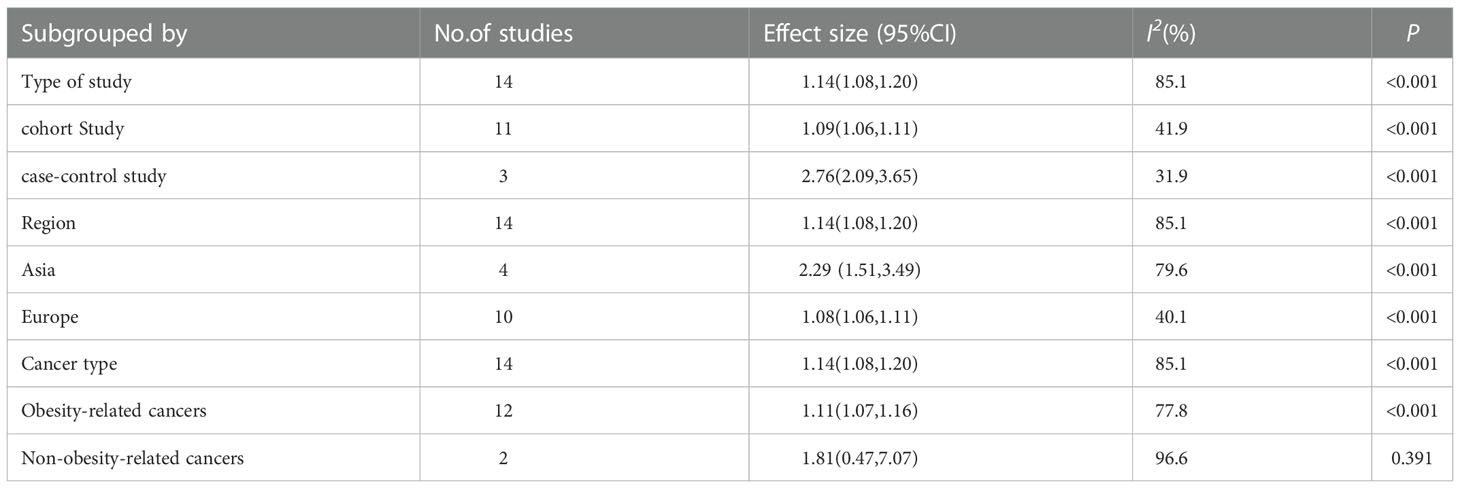
Table 3 Results of subgroup analyses.
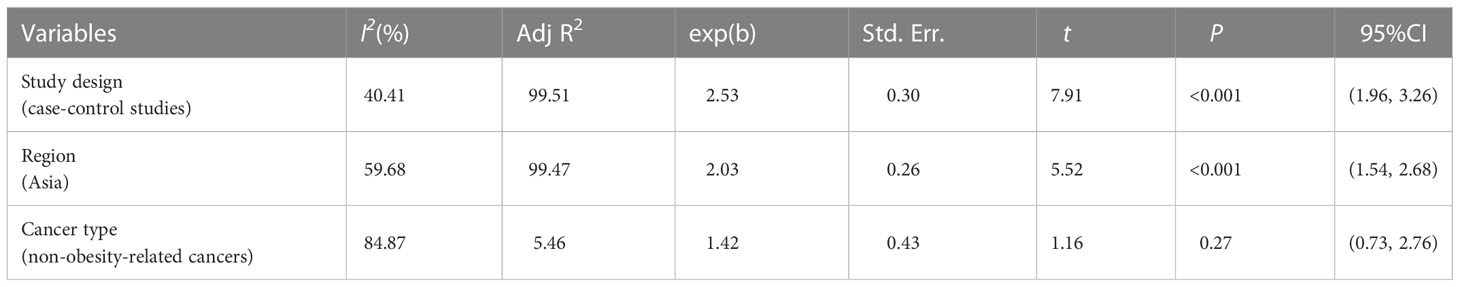
Table 4 Meta-regression for cancer incidence.
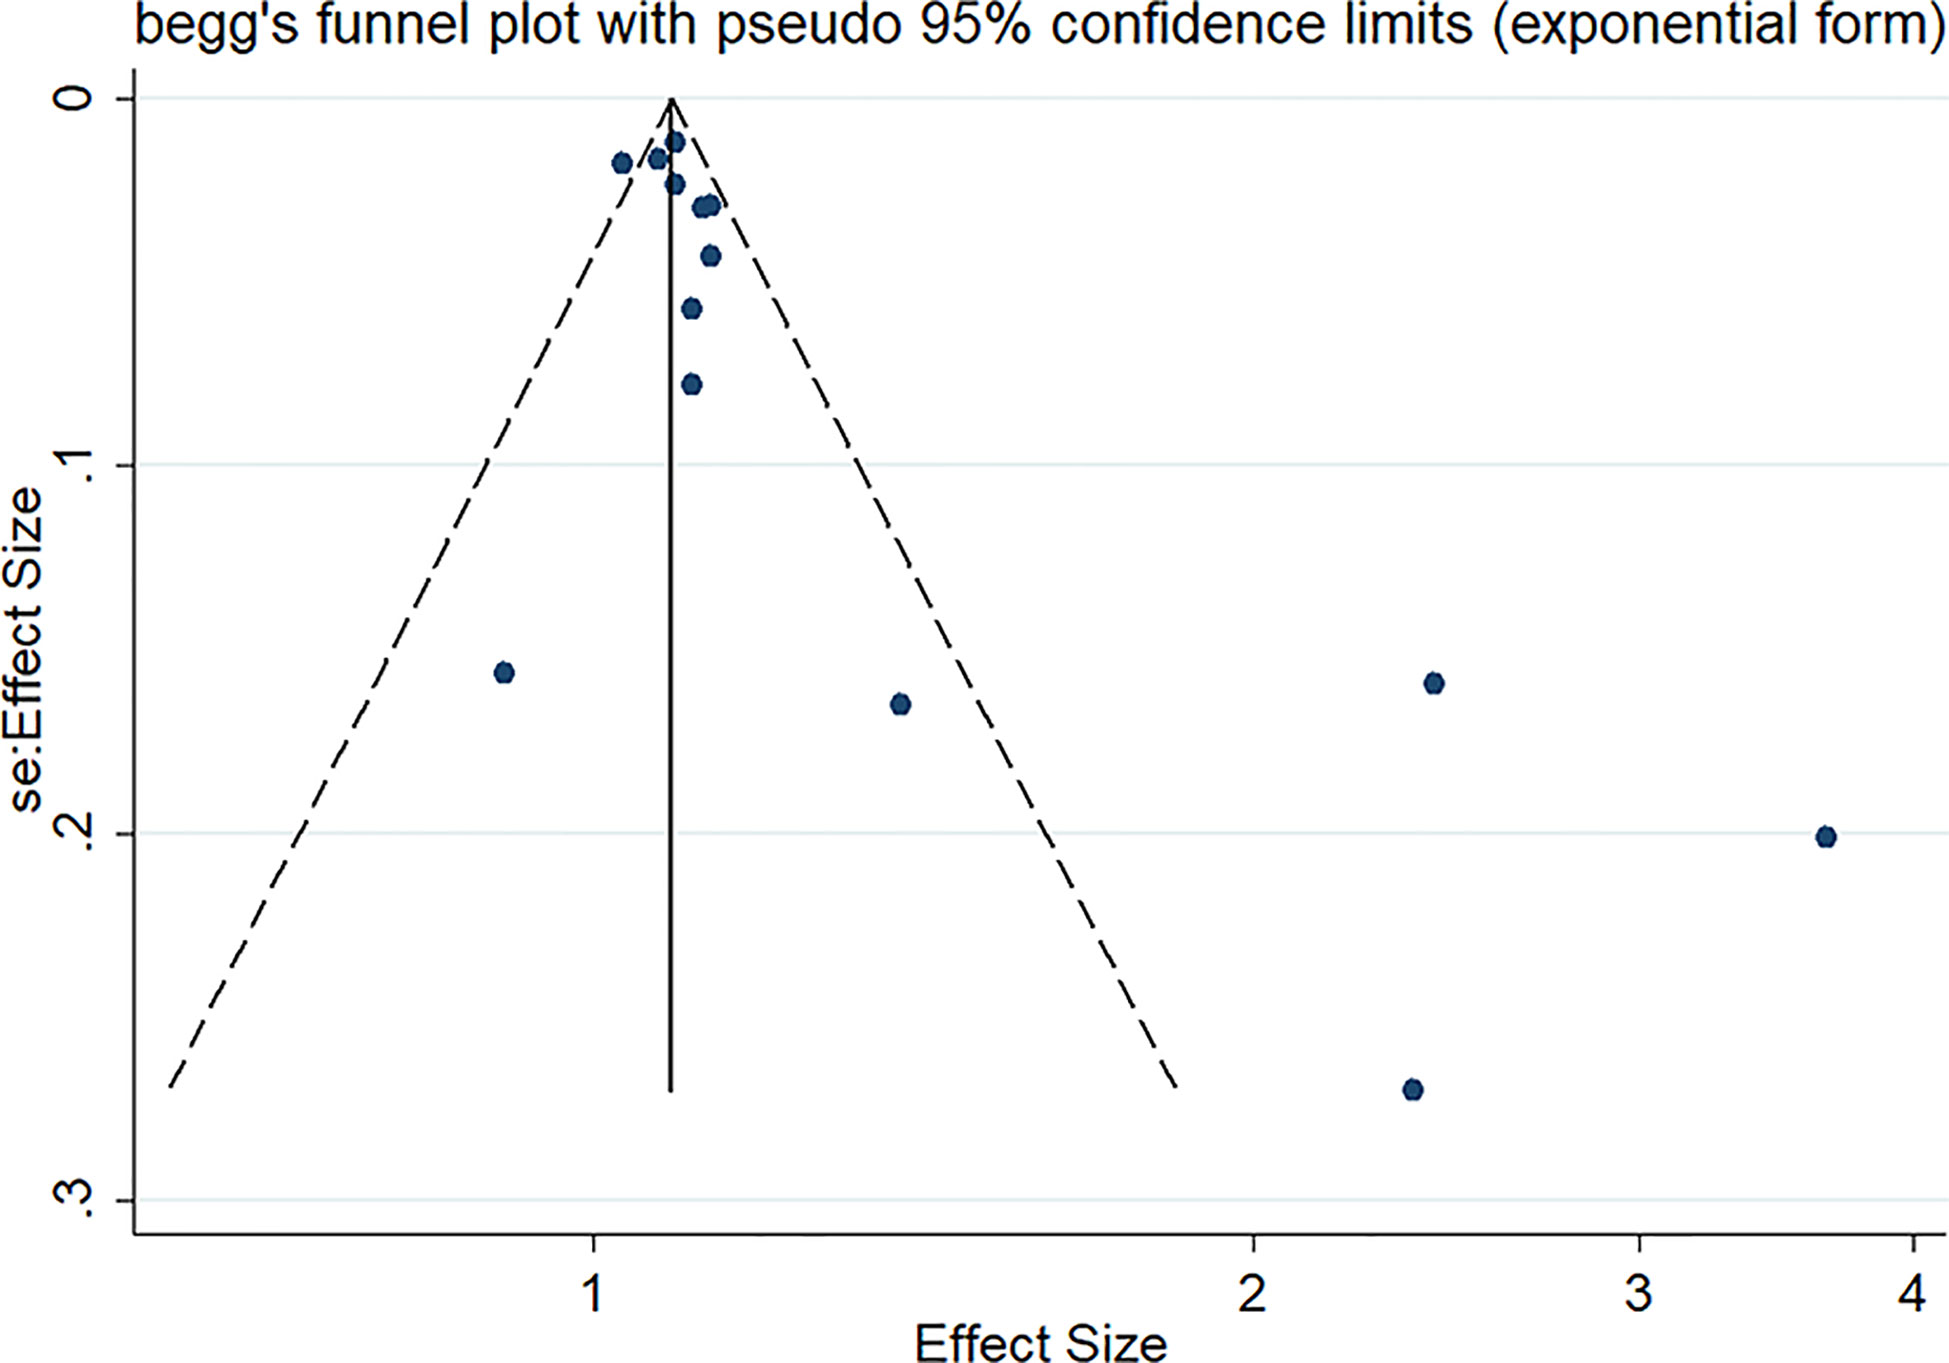
Figure 3 Funnel plot for the effect estimates of TyG index.
4 Discussion
With the rapid growth of cancer incidence and mortality, latest projections showed that cancer will become the main cause of death in countries around the world in the 21st century. Moreover, cancer has been confirmed to be closely related to IR in the current studies. However, as a valid predictor of IR, it is unclear whether cancer is related to TyG index. Our meta-analysis revealed that a higher TyG index was more likely to increase the likelihood of cancer compared to a lower TyG index group.
Although the specific mechanism of action of the TyG index on cancer has not been clarified, several potential mechanisms that could be related to IR or hyperinsulinemia have been proposed. First of all, IR syndrome has been considered as an important factor for cell proliferation (10, 19). Relevant studies have shown that hyperinsulinemia could affect energy metabolism by increasing the uptake of glucose by cells, and then activate certain signal transduction pathways in cells and directly increase the proliferation of cells and inhibit the apoptosis of cells, thereby promoting the occurrence of cancer (20, 45, 46). In addition, insulin likely plays a role in malignant transformation, cancer development and metastasis of various cells by binding to and activating its structurally related IGF-1 receptor (20, 21, 47). Moreover, high blood sugar itself also enhances the sensitivity of cells to IGF-1, which promotes the occurrence and development of cancer (48). Finally, IR triggers oxidative stress and inflammatory processes. Existing studies showed that IR indirectly promotes tumor growth through NF-κB and other pro-inflammatory signaling pathways (22). At the same time, abnormal blood sugar could increase oxidative stress, promote chronic inflammation, and then form a pro-angiogenic and anti-apoptotic microenvironment, which is an important cause of cancer (49, 50).
Our subgroup analyses demonstrated that high TyG index increased the risk of cancer in both Asia and Europe. However, the risk of developing cancer in Asia was about twice as high as in Europe. Ethnicity could be a crucial factor in this process (51, 52). Insulin secretion may itself be restricted in Asians relative to other regions (53). Moreover, Asian could consume more carbohydrate-containing foods than European, thereby increasing the likelihood of hypertriglyceridemia and impaired fasting glucose (54, 55) In addition, the phenomenon probably also was related to the level of social and economic development and rapid westernization of lifestyles (7, 56). Meanwhile, in our meta-analysis, considering the limited research in other regions, more relevant studies are needed in the future.
It has been widely accepted that obesity had a well-recognized association with cancer risk at various sites (57, 58). Moreover, our meta-analysis results also showed that TyG index was associated with cancer caused by obesity, and the cancer risk in high TyG index group was 1.11 times than that of lower level group. This could be attributed to the fact that obesity stimulates abnormal cell proliferation and inhibits cell apoptosis via adipocytokine activation (leptin and adiponectin), altered hormone metabolism, chronic (subclinical) inflammation, elevated insulin levels IGF-1 and other pathways, which negatively affects the incidence of cancer (27, 59–61). Although this relationship was not observed in the non-obesity related cancer group, some studies have demonstrated that higher fasting insulin levels and IR are associated with an increased risk of non-obesity-related cancers. The reasons may be that IR works through other pathways quite distinct from obesity (42, 62). Besides, limited by the number of studies, more studies are needed to explore its specific mechanism in the future.
Meanwhile, the high heterogeneity was observed in the results of our meta-analysis. Analyses of multiple methods demonstrated that research type and region could be attributed to the heterogeneity. This study also has several limitations. The studies included in the analysis were mainly observational studies, and its evidence level is lower than that of randomized controlled trials. In addition to the TyG index, residual confounding factors may also influence the relationship between cancer risk and TyG index, such as dietary and physical activity (63). Due to limitations in the number of studies, it’s unclear whether the TyG index increases cancer risk in a linear manner. Meanwhile, the sample sizes of contained studies varied widely, which may have unknown effects on the study results. Therefore, it is necessary to conduct more large-scale cohort studies and basic research, in order to obtain more conclusive evidence.
5 Conclusions
In summary, our meta-analysis indicated that higher TyG index may increase the risk of cancer. Considering the limitations of this meta-analysis, more prospective cohort studies and basic research are warranted to verify the relationship.
Data availability statement
The original contributions presented in the study are included in the article/Supplementary Material. Further inquiries can be directed to the corresponding authors.
Author contributions
HW and FY wrote and reviewed the manuscript; WC and GW made the meta-analysis design; HW, FY, YC, and FC carried out the specific study and analyzed the data. All authors contributed to the article and approved the submitted version.
Conflict of interest
The authors declare that the research was conducted in the absence of any commercial or financial relationships that could be construed as a potential conflict of interest.
Publisher’s note
All claims expressed in this article are solely those of the authors and do not necessarily represent those of their affiliated organizations, or those of the publisher, the editors and the reviewers. Any product that may be evaluated in this article, or claim that may be made by its manufacturer, is not guaranteed or endorsed by the publisher.
Supplementary material
The Supplementary Material for this article can be found online at: https://www.frontiersin.org/articles/10.3389/fendo.2022.1098492/full#supplementary-material
Supplementary Figure 1 | Sensitivity analysis for included studies.
References
1. Boubertakh B, Silvestri C, Di Marzo V. Obesity: The fat tissue disease version of cancer. Cells (2022) 11(12):1872. doi: 10.3390/cells11121872
2. Brücher BL, Jamall IS. Epistemology of the origin of cancer: A new paradigm. BMC Cancer (2014) 14:331. doi: 10.1186/1471-2407-14-331
3. Vaghari-Tabari M, Ferns GA, Qujeq D, Andevari AN, Sabahi Z, Moein S. Signaling, metabolism, and cancer: An important relationship for therapeutic intervention. J Cell Physiol (2021) 236(8):5512–32. doi: 10.1002/jcp.30276
4. Hanahan D, Weinberg RA. Hallmarks of cancer: The next generation. Cell (2011) 144(5):646–74. doi: 10.1016/j.cell.2011.02.013
5. Sung H, Ferlay J, Siegel RL, Laversanne M, Soerjomataram I, Jemal A, et al. Global cancer statistics 2020: Globocan estimates of incidence and mortality worldwide for 36 cancers in 185 countries. CA: Cancer J Clin (2021) 71(3):209–49. doi: 10.3322/caac.21660
6. Ferlay J, Soerjomataram I, Dikshit R, Eser S, Mathers C, Rebelo M, et al. Cancer incidence and mortality worldwide: Sources, methods and major patterns in globocan 2012. Int J Cancer (2015) 136(5):E359–86. doi: 10.1002/ijc.29210
7. Bray F, Ferlay J, Soerjomataram I, Siegel RL, Torre LA, Jemal A. Global cancer statistics 2018: Globocan estimates of incidence and mortality worldwide for 36 cancers in 185 countries. CA: Cancer J Clin (2018) 68(6):394–424. doi: 10.3322/caac.21492
8. Islami F, Goding Sauer A, Miller KD, Siegel RL, Fedewa SA, Jacobs EJ, et al. Proportion and number of cancer cases and deaths attributable to potentially modifiable risk factors in the united states. CA: Cancer J Clin (2018) 68(1):31–54. doi: 10.3322/caac.21440
9. Wilson LF, Antonsson A, Green AC, Jordan SJ, Kendall BJ, Nagle CM, et al. How many cancer cases and deaths are potentially preventable? Estimates for Australia in 2013. Int J Cancer (2018) 142(4):691–701. doi: 10.1002/ijc.31088
10. Renehan AG, Tyson M, Egger M, Heller RF, Zwahlen M. Body-mass index and incidence of cancer: A systematic review and meta-analysis of prospective observational studies. Lancet (2008) 371(9612):569–78. doi: 10.1016/s0140-6736(08)60269-x
11. Grosso G, Bella F, Godos J, Sciacca S, Del Rio D, Ray S, et al. Possible role of diet in cancer: Systematic review and multiple meta-analyses of dietary patterns, lifestyle factors, and cancer risk. Nutr Rev (2017) 75(6):405–19. doi: 10.1093/nutrit/nux012
12. Isharwal S, Misra A, Wasir JS, Nigam P. Diet & insulin resistance: A review & Asian Indian perspective. Indian J Med Res (2009) 129(5):485–99.
13. Roberts CK, Hevener AL, Barnard RJ. Metabolic syndrome and insulin resistance: Underlying causes and modification by exercise training. Compr Physiol (2013) 3(1):1–58. doi: 10.1002/cphy.c110062
14. Yamamoto S, Nakagawa T, Matsushita Y, Kusano S, Hayashi T, Irokawa M, et al. Visceral fat area and markers of insulin resistance in relation to colorectal neoplasia. Diabetes Care (2010) 33(1):184–9. doi: 10.2337/dc09-1197
15. Braun S, Bitton-Worms K, LeRoith D. The link between the metabolic syndrome and cancer. Int J Biol Sci (2011) 7(7):1003–15. doi: 10.7150/ijbs.7.1003
16. Siddique A, Kowdley KV. Insulin resistance and other metabolic risk factors in the pathogenesis of hepatocellular carcinoma. Clinics liver Dis (2011) 15(2):281–96, vii-x. doi: 10.1016/j.cld.2011.03.007
17. Jung SY, Papp JC, Sobel EM, Yu H, Zhang ZF. Breast cancer risk and insulin resistance: Post genome-wide gene-environment interaction study using a random survival forest. Cancer Res (2019) 79(10):2784–94. doi: 10.1158/0008-5472.Can-18-3688
18. Soliman PT, Wu D, Tortolero-Luna G, Schmeler KM, Slomovitz BM, Bray MS, et al. Association between adiponectin, insulin resistance, and endometrial cancer. Cancer (2006) 106(11):2376–81. doi: 10.1002/cncr.21866
19. Lu CC, Chu PY, Hsia SM, Wu CH, Tung YT, Yen GC. Insulin induction instigates cell proliferation and metastasis in human colorectal cancer cells. Int J Oncol (2017) 50(2):736–44. doi: 10.3892/ijo.2017.3844
20. Kim WY, Jin Q, Oh SH, Kim ES, Yang YJ, Lee DH, et al. Elevated epithelial insulin-like growth factor expression is a risk factor for lung cancer development. Cancer Res (2009) 69(18):7439–48. doi: 10.1158/0008-5472.Can-08-3792
21. Furstenberger G, Senn HJ. Insulin-like growth factors and cancer. Lancet Oncol (2002) 3(5):298–302. doi: 10.1016/s1470-2045(02)00731-3
22. Karin M. Nuclear factor-kappab in cancer development and progression. Nature (2006) 441(7092):431–6. doi: 10.1038/nature04870
23. Muniyappa R, Lee S, Chen H, Quon MJ. Current approaches for assessing insulin sensitivity and resistance in vivo: Advantages, limitations, and appropriate usage. Am J Physiol Endocrinol Metab (2008) 294(1):E15–26. doi: 10.1152/ajpendo.00645.2007
24. Wallace TM, Levy JC, Matthews DR. Use and abuse of homa modeling. Diabetes Care (2004) 27(6):1487–95. doi: 10.2337/diacare.27.6.1487
25. Matthews DR, Hosker JP, Rudenski AS, Naylor BA, Treacher DF, Turner RC. Homeostasis model assessment: Insulin resistance and beta-cell function from fasting plasma glucose and insulin concentrations in man. Diabetologia (1985) 28(7):412–9. doi: 10.1007/bf00280883
26. Zuber V, Marconett CN, Shi J, Hua X, Wheeler W, Yang C, et al. Pleiotropic analysis of lung cancer and blood triglycerides. J Natl Cancer Inst (2016) 108(12):djw167. doi: 10.1093/jnci/djw167
27. Fritz J, Bjørge T, Nagel G, Manjer J, Engeland A, Häggström C, et al. The triglyceride-glucose index as a measure of insulin resistance and risk of obesity-related cancers. Int J Epidemiol (2020) 49(1):193–204. doi: 10.1093/ije/dyz053
28. Sun M, Guo H, Wang Y, Ma D. Association of triglyceride glucose index with all-cause and cause-specific mortality among middle age and elderly us population. BMC Geriatr (2022) 22(1):461. doi: 10.1186/s12877-022-03155-8
29. Wang L, Si S, Li J, Li Y, Chen X, Xue F, et al. Triglyceride-glucose index is not associated with lung cancer risk: A prospective cohort study in the uk biobank. Front Oncol (2021) 11:774937. doi: 10.3389/fonc.2021.774937
30. Moher D, Liberati A, Tetzlaff J, Altman DG. Preferred reporting items for systematic reviews and meta-analyses: The prisma statement. PloS Med (2009) 6(7):e1000097. doi: 10.1371/journal.pmed.1000097
31. Stang A. Critical evaluation of the Newcastle-Ottawa scale for the assessment of the quality of nonrandomized studies in meta-analyses. Eur J Epidemiol (2010) 25(9):603–5. doi: 10.1007/s10654-010-9491-z
32. Lo CK, Mertz D, Loeb M. Newcastle-Ottawa Scale: Comparing reviewers’ to authors’ assessments. BMC Med Res Method (2014) 14:45. doi: 10.1186/1471-2288-14-45
33. Guyatt GH, Oxman AD, Vist GE, Kunz R, Falck-Ytter Y, Alonso-Coello P, et al. Grade: An emerging consensus on rating quality of evidence and strength of recommendations. Bmj (2008) 336(7650):924–6. doi: 10.1136/bmj.39489.470347.AD
34. Cochran WG. The combination of estimates from different experiments. Biometrics (2014) 10:101–29. doi: 10.2307/3001666
35. Higgins JP, Thompson SG, Deeks JJ, Altman DG. Measuring inconsistency in meta-analyses. Bmj (2003) 327(7414):557–60. doi: 10.1136/bmj.327.7414.557
36. Patsopoulos NA, Evangelou E, Ioannidis JP. Sensitivity of between-study heterogeneity in meta-analysis: Proposed metrics and empirical evaluation. Int J Epidemiol (2008) 37(5):1148–57. doi: 10.1093/ije/dyn065
37. Research WCRFAIfC. Continuous update project. recommendations and public health and policy implications. London: World Cancer Research Fund (2018).
38. Egger M, Davey Smith G, Schneider M, Minder C. Bias in meta-analysis detected by a simple, graphical test. Bmj (1997) 315(7109):629–34. doi: 10.1136/bmj.315.7109.629
39. Begg CB, Mazumdar M. Operating characteristics of a rank correlation test for publication bias. Biometrics (1994) 50(4):1088–101. doi: 10.2307/2533446
40. Palmer TM, Sutton AJ, Peters JL, Moreno SG. Contour-enhanced funnel plots for meta-analysis. Stata J (2008) 8(2):242–54. doi: 10.1177/1536867X0800800206
41. Okamura T, Hashimoto Y, Hamaguchi M, Obora A, Kojima T, Fukui M. Triglyceride-glucose index (Tyg index) is a predictor of incident colorectal cancer: A population-based longitudinal study. BMC Endocr Disord (2020) 20(1):113. doi: 10.1186/s12902-020-00581-w
42. Yan X, Gao Y, Tong J, Tian M, Dai J, Zhuang Y. Association between triglyceride glucose index and non-small cell lung cancer risk in Chinese population. Front Oncol (2021) 11:585388. doi: 10.3389/fonc.2021.585388
43. Kim YM, Kim JH, Park JS, Baik SJ, Chun J, Youn YH, et al. Association between triglyceride-glucose index and gastric carcinogenesis: A health checkup cohort study. Gastric Cancer (2022) 25(1):33–41. doi: 10.1007/s10120-021-01222-4
44. Panigoro SS, Sutandyo N, Witjaksono F, Siregar NC, Ramli R, Hariani R, et al. The association between triglyceride-glucose index as a marker of insulin resistance and the risk of breast cancer. Front Endocrinol (Lausanne) (2021) 12:745236. doi: 10.3389/fendo.2021.745236
45. Giovannucci E, Harlan DM, Archer MC, Bergenstal RM, Gapstur SM, Habel LA, et al. Diabetes and cancer: A consensus report. Diabetes Care (2010) 33(7):1674–85. doi: 10.2337/dc10-0666
46. Olefson S, Moss SF. Obesity and related risk factors in gastric cardia adenocarcinoma. Gastric Cancer (2015) 18(1):23–32. doi: 10.1007/s10120-014-0425-4
47. Pollak MN, Schernhammer ES, Hankinson SE. Insulin-like growth factors and neoplasia. Nat Rev Cancer (2004) 4(7):505–18. doi: 10.1038/nrc1387
48. Maile LA, Capps BE, Ling Y, Xi G, Clemmons DR. Hyperglycemia alters the responsiveness of smooth muscle cells to insulin-like growth factor-I. Endocrinology (2007) 148(5):2435–43. doi: 10.1210/en.2006-1440
49. Gapstur SM, Gann PH, Lowe W, Liu K, Colangelo L, Dyer A. Abnormal glucose metabolism and pancreatic cancer mortality. Jama (2000) 283(19):2552–8. doi: 10.1001/jama.283.19.2552
50. Stott-Miller M, Chen C, Schwartz SM. Type ii diabetes and metabolic syndrome in relation to head and neck squamous cell carcinoma risk: A seer-Medicare database study. Cancer Epidemiol (2013) 37(4):428–33. doi: 10.1016/j.canep.2013.03.006
51. Brito ADM, Hermsdorff HHM, Filgueiras MS, Suhett LG, Vieira-Ribeiro SA, Franceschini S, et al. Predictive capacity of triglyceride-glucose (Tyg) index for insulin resistance and cardiometabolic risk in children and adolescents: A systematic review. Crit Rev Food Sci Nutr (2021) 61(16):2783–92. doi: 10.1080/10408398.2020.1788501
52. Kang B, Yang Y, Lee EY, Yang HK, Kim HS, Lim SY, et al. Triglycerides/Glucose index is a useful surrogate marker of insulin resistance among adolescents. Int J Obes (2005) (2017) 41(5):789–92. doi: 10.1038/ijo.2017.14
53. Kodama K, Tojjar D, Yamada S, Toda K, Patel CJ, Butte AJ. Ethnic differences in the relationship between insulin sensitivity and insulin response: A systematic review and meta-analysis. Diabetes Care (2013) 36(6):1789–96. doi: 10.2337/dc12-1235
54. Jung CH, Choi KM. Impact of high-carbohydrate diet on metabolic parameters in patients with type 2 diabetes. Nutrients (2017) 9(4):322. doi: 10.3390/nu9040322
55. Kwon YJ, Lee JW, Kang HT. Secular trends in lipid profiles in Korean adults based on the 2005-2015 knhanes. Int J Environ Res Public Health (2019) 16(14):2555. doi: 10.3390/ijerph16142555
56. Chan JC, Malik V, Jia W, Kadowaki T, Yajnik CS, Yoon KH, et al. Diabetes in Asia: Epidemiology, risk factors, and pathophysiology. Jama (2009) 301(20):2129–40. doi: 10.1001/jama.2009.726
57. Lauby-Secretan B, Scoccianti C, Loomis D, Grosse Y, Bianchini F, Straif K. Body fatness and cancer–viewpoint of the iarc working group. New Engl J Med (2016) 375(8):794–8. doi: 10.1056/NEJMsr1606602
58. Bhaskaran K, Douglas I, Forbes H, dos-Santos-Silva I, Leon DA, Smeeth L. Body-mass index and risk of 22 specific cancers: A population-based cohort study of 5·24 million uk adults. Lancet (2014) 384(9945):755–65. doi: 10.1016/s0140-6736(14)60892-8
59. Renehan AG, Zwahlen M, Egger M. Adiposity and cancer risk: New mechanistic insights from epidemiology. Nat Rev Cancer (2015) 15(8):484–98. doi: 10.1038/nrc3967
60. Alemán JO, Eusebi LH, Ricciardiello L, Patidar K, Sanyal AJ, Holt PR. Mechanisms of obesity-induced gastrointestinal neoplasia. Gastroenterology (2014) 146(2):357–73. doi: 10.1053/j.gastro.2013.11.051
61. Doyle SL, Donohoe CL, Lysaght J, Reynolds JV. Visceral obesity, metabolic syndrome, insulin resistance and cancer. Proc Nutr Soc (2012) 71(1):181–9. doi: 10.1017/s002966511100320x
62. Argirion I, Weinstein SJ, Männistö S, Albanes D, Mondul AM. Serum insulin, glucose, indices of insulin resistance, and risk of lung cancer. Cancer Epidemiol Biomarkers Prev (2017) 26(10):1519–24. doi: 10.1158/1055-9965.Epi-17-0293
63. Shahavandi M, Djafari F, Shahinfar H, Davarzani S, Babaei N, Ebaditabar M, et al. The association of plant-based dietary patterns with visceral adiposity, lipid accumulation product, and triglyceride-glucose index in Iranian adults. Complementary therapies Med (2020) 53:102531. doi: 10.1016/j.ctim.2020.102531
Keywords: triglyceride glucose index, cancer, observational research, random effects model, meta-analysis
Citation: Wang H, Yan F, Cui Y, Chen F, Wang G and Cui W (2023) Association between triglyceride glucose index and risk of cancer: A meta-analysis. Front. Endocrinol. 13:1098492. doi: 10.3389/fendo.2022.1098492
Received: 15 November 2022; Accepted: 19 December 2022;
Published: 12 January 2023.
Edited by:
Javad Sharifi-Rad, University of Azuay, EcuadorReviewed by:
Daniela Calina, University of Medicine and Pharmacy of Craiova, RomaniaMonica Butnariu, Banat University of Agricultural Sciences and Veterinary Medicine, Romania
Copyright © 2023 Wang, Yan, Cui, Chen, Wang and Cui. This is an open-access article distributed under the terms of the Creative Commons Attribution License (CC BY). The use, distribution or reproduction in other forums is permitted, provided the original author(s) and the copyright owner(s) are credited and that the original publication in this journal is cited, in accordance with accepted academic practice. No use, distribution or reproduction is permitted which does not comply with these terms.
*Correspondence: Guixia Wang, Z3dhbmcxNjhAamx1LmVkdS5jbg==; Weiwei Cui, Y3Vpd2Vpd2VpQGpsdS5lZHUuY24=
†These authors have contributed equally to this work