 Adana A.M. Llanos1,2*
 John B. Aremu3
 Ting-Yuan David Cheng4,5Wenjin Chen6Marina A. Chekmareva6
 Elizabeth M. Cespedes Feliciano7Bo Qin8Yong Lin3Coral Omene9
 Thaer Khoury5Chi-Chen Hong5
 Song Yao5Christine B. Ambrosone5Elisa V. Bandera8
 Kitaw Demissie10
- 1Department of Epidemiology, Mailman School of Public Health, Columbia University Irving Medical Center, New York, NY, United States
- 2Herbert Irving Comprehensive Cancer Center, Columbia University Irving Medical Center, New York, NY, United States
- 3Department of Biostatistics and Epidemiology, Rutgers School of Public Health, Piscataway, NJ, United States
- 4Department of Epidemiology, University of Florida, Gainesville, FL, United States
- 5Department of Cancer Prevention and Control, Roswell Park Comprehensive Cancer Center, Buffalo, NY, United States
- 6Department of Pathology and Laboratory Medicine, Rutgers Robert Wood Johnson Medical School and Rutgers Cancer Institute of New Jersey, New Brunswick, NJ, United States
- 7Division of Research, Kaiser Permanente Northern California, Oakland, CA, United States
- 8Cancer Epidemiology and Health Outcomes, Rutgers Cancer Institute of New Jersey, New Brunswick, NJ, United States
- 9Department of Medicine, Rutgers Robert Wood Johnson Medical School and Rutgers Cancer Institute of New Jersey, New Brunswick, NJ, United States
- 10Department of Epidemiology and Biostatistics, SUNY Downstate Health Sciences University School of Public Health, Brooklyn, NY, United States
Background: The mechanisms underlying the association of overall and central body fatness with poorer breast cancer outcomes remain unclear; altered gene and/or protein expression of the adipokines and their receptors in breast tumors might play a role.
Methods: In a sample of Black and White women with primary invasive breast cancer, we investigated associations of body mass index (BMI), waist circumference, hip circumference, waist-to-hip ratio (WHR), fat mass index (FMI), and percent body fat with protein expression (log-transformed, n = 722) and gene expression (log2-transformed, n = 148) of leptin (LEP), leptin receptor (LEPR), adiponectin (ADIPOQ), and adiponectin receptors 1 and 2 (ADIPOR1, ADIPOR2). Multivariable linear models, adjusting for race, menopausal status, and estrogen receptor status, were used to assess these associations, with Bonferroni correction for multiple comparisons.
Results: In multivariable models, we found that increasing BMI (β = 0.0529, 95% CI: 0.0151, 0.0906) and FMI (β = 0.0832, 95% CI: 0.0268, 0.1397) were associated with higher LEP gene expression, corresponding to 34.5% and 38.3% increases in LEP gene expression for a standard deviation (SD) increase in BMI and FMI, respectively. Increasing BMI (β = 0.0028, 95% CI: 0.0011, 0.0045), waist circumference (β = 0.0013, 95% CI: 0.0005, 0.0022), hip circumference (β = 0.0015, 95% CI: 0.0007, 0.0024), and FMI (β = 0.0041, 95% CI: 0.0015, 0.0067) were associated with higher LEPR protein expression. These associations equate to 16.8%, 17.6%, 17.7%, 17.2% increases in LEPR protein expression for a 1-SD increase in BMI, waist circumference, hip circumference, and FMI, respectively. Further, these associations were stronger among White and postmenopausal women and ER+ cases; formal tests of interaction yielded evidence of effect modification by race. No associations of body fatness with LEP protein expression, LEPR gene expression, or protein or gene expression of ADIPOQ, ADIPOR1, and ADIPOR2 were found.
Conclusions: These findings support an association of increased body fatness – beyond overall body size measured using BMI – with higher LEP gene expression and higher LEPR protein expression in breast tumor tissues. Clarifying the impact of adiposity-related adipokine and adipokine receptor expression in breast tumors on long-term breast cancer outcomes is a critical next step.
Introduction
Epidemiologic evidence suggests that increasing obesity, measured using body mass index (BMI), is associated with elevated risk of postmenopausal breast cancer (1, 2) and poorer breast cancer outcomes among both pre- and postmenopausal women (2–4). However, differences have been observed by estrogen receptor (ER) status (3, 5). While increased premenopausal obesity is associated with increased risk of ER- but not ER+ disease, postmenopausal obesity is similarly associated with increased risk of both ER- and ER+ disease (5, 6). On the other hand, increasing waist-to-hip ratio (WHR) is associated with increased risk of ER+ disease among premenopausal women and with increased risk of both ER+ and ER- disease among postmenopausal women (7).
While the molecular mechanisms underlying the impact of overall and central obesity on poorer breast cancer outcomes are not well understood, it has been hypothesized that the biological effects of the adipokines, adiponectin (ADIPOQ) and leptin (LEP), which are secreted by adipocytes (8–13), and their respective receptors (adiponectin receptors 1 and 2 [ADIPOR1, ADIPOR2] and leptin receptor [LEPR], respectively) might play a role. Further, exploration of the relationship between central adiposity (rather than overall body size as measured by BMI) and adipokines and adipokine receptors might be the missing link. Circulating ADIPOQ levels decrease with increasing BMI (14–16) and are associated with increased breast cancer risk (17–20). Conversely, circulating LEP levels increase with increasing BMI (21, 22) and are associated with increased breast cancer risk in some studies (17, 23–25). Less is known about adipokine receptor protein and gene expression levels in breast tumor tissues or their associations with more accurate and specific measures of body fatness derived from anthropometry (e.g., waist circumference, hip circumference, waist-to-hip ratio [WHR]) or from bioelectrical impedance analysis (BIA) (e.g., fat mass index [FMI], percent body fat [BF%]). These data might provide novel insights about the impact of body fatness and adiposity-related biomarker expression (at the tumor level) on breast cancer outcomes.
ADIPOQ is the most abundantly secreted adipokine by adipocytes (15, 26), and along with its receptors, is expressed in histologically normal and malignant breast tissues (27, 28). ADIPOQ has anti-inflammatory and anti-atherogenic properties (26, 29), inhibits cellular proliferation, and promotes apoptosis (10, 13, 30), implying a protective role in breast carcinogenesis. LEP, also secreted by adipocytes, is expressed in histologically normal and malignant breast cells, as is the LEPR (31, 32), LEP, once bound to LEPR, induces the activation of several signaling pathways, promotes cell growth and proliferation, and promotes angiogenesis (33–38).
Data from our prior research were the first to examine correlations between circulating ADIPOQ and LEP levels in plasma and levels within the breast, demonstrating that circulating adipokine levels are generally poor surrogates for levels within the local organ (39). More recently, we demonstrated that adipokine and adipokine receptor protein and gene expression in breast tumor tissues are associated with more aggressive tumor features associated with worse prognosis (40, 41). Specifically, lower LEPR protein expression was associated with ER- status, triple-negative (TN) subtype (40), while lower gene expression of ADIPOQ, ADIPOR2, LEP, and LEPR were associated with more aggressive breast tumor features, including higher tumor grade, larger tumor size, ER- status, and human epidermal growth factor receptor 2 (HER2)-enriched and TN subtypes (41).
In the current study, we hypothesize that measures of body fatness are associated with LEPR, ADIPOR1, and ADIPOR2 expression profiles in the breast tumor microenvironment, which might contribute mechanistically to the development of more aggressive breast tumor phenotypes and poorer prognosis. To test this, we investigated associations of general obesity (BMI), body fat distribution (waist circumference, hip circumference, WHR), and body composition (FMI, BF%) with protein and gene expression of the adipokines and adipokine receptors in breast tissue specimens from participants in the Women’s Circle of Health Study (WCHS).
Materials and Methods
Study Sample and Data Collection
Study participants were women diagnosed with primary invasive breast cancer from 2001 through 2015 and enrolled in the WCHS (40, 41). Briefly, WCHS enrolled newly diagnosed breast cancer cases with histologically confirmed ductal carcinoma in situ (DCIS, stage 0) or invasive breast cancer (stages I–IV), who self-identified as either Black/African American or White, were 20–75 years of age, able to complete an interview in English, and had no history of cancer except non-melanomatous skin cancer. Data collection for the WCHS was conducted through in-person assessments (approximately 10 months after diagnosis) and included computer-assisted interviewer-administered questionnaires, as well as standardized protocols for taking anthropometric measurements during a home visit, including height, weight, waist circumference, and hip circumference, and body composition using a portable BIA scale (42). The baseline interview ascertained information on sociodemographic factors as well as established or probable breast cancer risk factors, including family and personal health history, reproductive history, hormone therapy use, and lifestyle exposures.
Nearly all WCHS participants (98%) consented to medical records release and for these participants, medical and pathology records were requested and retrieved from providers and institutions where participants reported receiving breast cancer care. Relevant clinical and breast tumor clinicopathologic data were abstracted and entered in an electronic database (43, 44).
Collection of Archived Breast Tumor Specimens and Tissue Microarray Construction
Tumor blocks and/or slides for WCHS participants were retrieved from hospitals upon written consent, with a retrieval rate of approximately 85%. Upon receipt at the Data Bank and Biorepository (DBBR) at Roswell Park Comprehensive Cancer Center, a board-certified pathologist (TK) reviewed hematoxylin and eosin (H&E) slides and circled areas where cores were selected for tissue microarray (TMA) construction. TMA cores ranged in size from 0.6 mm to 1.2 mm in diameter, and most WCHS participants’ tumors were represented by at least two TMA cores (range: 1 to 6 cores), which were placed into a recipient formalin-fixed paraffin-embedded (FFPE) block. The location of each core was recorded in a detailed TMA map file. The completed TMAs were stored at room temperature.
Protein Expression Analysis
For each WCHS participant included in the protein expression analysis (n = 722), immunohistochemistry (IHC) was used to stain TMAs of breast tumor specimens for LEP, LEPR, ADIPOQ, ADIPOR1, and ADIPOR2 as previously described (40). Briefly, IHC staining was performed using Ventana Discovery XT Automated Slide Stainer (Ventana Medical Systems, Inc., Tucson, AZ, USA). Deparaffinization, antigen retrieval, blocking, DAB detection, counterstain, post-counterstain, and slide cleaning steps were automated on the Discovery XT. Primary antibodies and secondary antibodies were manually applied at programmed steps. The following primary antibodies were used: rabbit monoclonal OB (LEP) antibody (1:40 dilution; Santa Cruz, cat #sc-842), mouse monoclonal Ob-R (LEPR) antibody (1:25 dilution; Santa Cruz, cat #sc-8391), mouse monoclonal adiponectin antibody (1:30 dilution; Abcam, cat #ab22554), rabbit monoclonal ADIPOR1 antibody (1:350 dilution; Abcam, cat #ab126611), and goat polyclonal ADIPOR2 antibody (1:25 dilution; Abcam, cat #ab77612). Optimal staining on control slides (human breast tissue TMAs) was obtained for each individual antibody. IHC was performed using the optimized conditions on the experimental WCHS TMA slides as well as on additional control slides. Primary antibodies were incubated at 37°C for 1–2 h; secondary antibodies were incubated at 37°C for 1 h, followed by either the DAB Map Detection Kit (Ventana, 760-124) or ChromoMap DAB kit (Ventana, 760-159). Slides were counterstained with hematoxylin (Ventana, 760-2021)and bluing reagent (Ventana, 760-2037) before cover slipping. A digital pathology analysis platform (VisioPharm, Hoersholm Denmark) was used to quantify protein expression of the adipokine receptors on each tissue core (45). Quantitative results were reported as a protein expression score defined as effective staining intensity (ESI) within the effective staining area (ESA) (45). Specimen artifacts, such as tissue folding were manually excluded from quantification. A board-certified pathologist (MAC) semi-quantitatively evaluated IHC expression for each tissue core stained (45). Semi-quantitative expression results were reported as: 0 (negative), 1 (weak expression), 2 (moderate expression), or 3 (strong expression). We observed high concordance between unsupervised, quantitative scores and pathologist-generated, semi-quantitative scores for LEP (r = 0.70, P<0.0001) and LEPR (r = 0.71, P<0.0001) (40). In the present analysis we included only quantitative protein expression data for LEP, LEPR, ADIPOQ, ADIPOR1, and ADIPOR2, which were averaged for participants with multiple TMA cores. Log-transformed protein expression data were used in the subsequent analysis.
Gene Expression Analysis
For each WCHS participant included in the gene expression analysis (n = 148), RNA was extracted from two 10µm curls (from representative breast tumor blocks without any pre-selection based on either the tumor or stromal contents so as to maintain and capture the entire tumor lesion and surrounding microenvironment) using the High Pure FFPET RNA Isolation Kit (Roche Molecular Systems, Inc., Pleasanton, CA, USA) and quantified using Qubit and Agilent Bioanalyzer (Agilent Technologies, Santa Clara, CA, USA). Gene expression of ADIPOQ, ADIPOR1, ADIPOR2, LEP, and LEPR were quantitated using NanoString nCounter® technology (NanoString Technologies, Seattle, WA, USA) (41). Raw count data were subjected to a series of normalization steps, including positive controls, housekeeping genes, and background subtraction, and the normalized data were log2-transformed and used in subsequent analyses (41).
Statistical Analyses
Descriptive statistics (mean and standard deviation [SD] and frequency and proportions) were used to describe the study sample and Pearson’s correlation analysis was used to assess pairwise correlations between adipokine receptor protein and gene expression. Multivariable linear regression models were utilized to evaluate the associations of BMI, waist circumference, hip circumference, WHR, FMI, and BF% with protein and gene expression of the adipokines and adipokine receptors. The difference in protein and gene expression per increase in SD of body fatness measures was also estimated, and a percentage increase was estimated as [exp(beta) - 1] x 100%. Models were adjusted for age, race, menopausal status, and ER status. All reported P-values are two-sided and P<0.05 was considered statistically significant. To account for multiple comparisons, we used Bonferroni correction with a criterion of P<0.0083 (i.e., 0.05/6) for statistical significance, given that there were six tests of association for protein and gene expression of each marker of interest. Analyses were performed using STATA (version 17, StataCorp, College Station, TX).
Results
Sociodemographic and tumor characteristics of the study sample included in the protein expression and the gene expression analytic samples are shown in Table 1. Across both groups, most participants met the criteria for increased metabolic risk (46, 47) based on overall obesity (BMI >30 kg/m2 [50.6%]), central obesity (waist circumference >88 cm [74.4%] and/or WHR >0.85 [64.1%]), elevated/abnormal FMI (≥9.5 kg/m2 [73.4%]), and BF% (>35% [76.2%]).
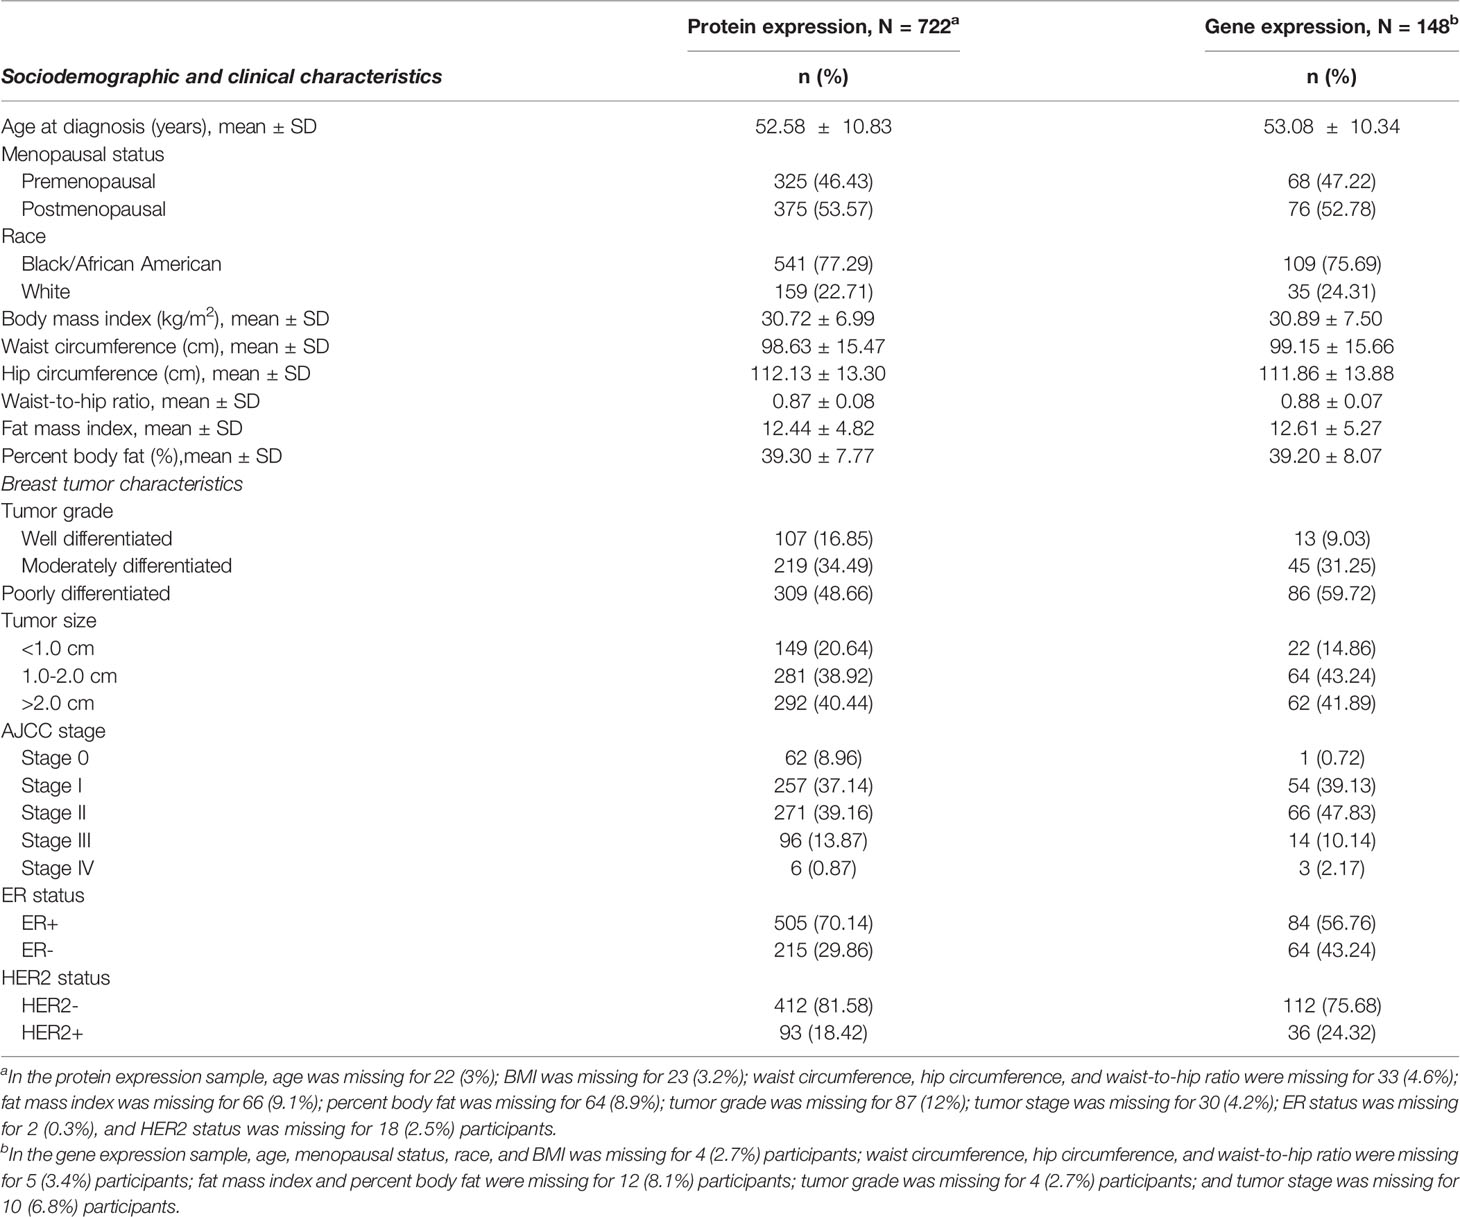
Table 1 Select characteristics of analytic samples included in the adipokine receptor protein expression and gene expression analysis.
There was no significant correlation between LEP protein and LEP gene expression (r = 0.11, P = 0.21), a weak positive correlation between LEPR protein and LEPR gene expression (r = 0.29, P = 0.0006), a weak positive correlation between ADIPOQ protein and ADIPOQ gene expression (r = 0.18, P = 0.04), no significant correlation between ADIPOR1 protein and ADIPOR1 gene expression (r = -0.03, P = 0.69), and a very weak positive correlation between ADIPOR2 protein and ADIPOR2 gene expression (r = 0.18, P = 0.04). In models adjusting for age, race, menopausal status, and ER status, we found that there were no significant associations between measures of body fatness and LEP protein expression (Table 2). In contrast, we found that women with increasing BMI (β = 0.0529, 95% CI: 0.0151, 0.0906), waist circumference (β = 0.0247, 95% CI: 0.0065, 0.0429), hip circumference (β = 0.0259, 95% CI: 0.0066, 0.0453), FMI (β = 0.0832, 95% CI: 0.0268, 0.1397), and BF% (β = 0.0396, 95% CI: 0.0025, 0.0767) had higher LEP gene expression. Only the findings for BMI and FMI were significant with correction for multiple comparisons and corresponds to 34.5% and 38.3% increases in LEP gene expression for a 1-SD increase in BMI and FMI, respectively. Women with greater body fatness had significantly higher LEPR protein expression: BMI (β = 0.0028, 95% CI: 0.0011, 0.0045), waist circumference (β = 0.0013, 95% CI: 0.0005, 0.0022), hip circumference (β = 0.0015, 95% CI: 0.0007, 0.0024), and FMI (β = 0.0041, 95% CI: 0.0015, 0.0067) (Table 3). These associations equate to 16.8%, 17.6%, 17.7%, 17.2% increases in LEPR protein expression for a 1-SD increase in BMI, waist circumference, hip circumference, and FMI, respectively. WHR was not associated with LEPR protein expression. Upon further adjustment for waist circumference, the observed associations between BMI (P = 0.08), hip circumference (P = 0.13), and BF% (P = 0.26) were consistent but attenuated, while the association for FMI was slightly stronger (β = 0.0055, 95% CI: 0.0005, 0.0010; 24.1% increase in LEPR protein expression), although not statistically significant (data not shown). Conversely, we found no association between body fatness and LEPR gene expression. Associations between body fatness and ADIPOQ expression (Table 4), ADIPOR1 expression (Table 5) and ADIPOR2 expression (Table 6) were not statistically significant, but the coefficients suggested that increasing body fatness might be associated with lower protein expression of ADIPOQ, ADIPOR1, and ADIPOR2, lower ADIPOQ gene expression. and higher gene expression of ADIPOR1 and ADIPOR2.
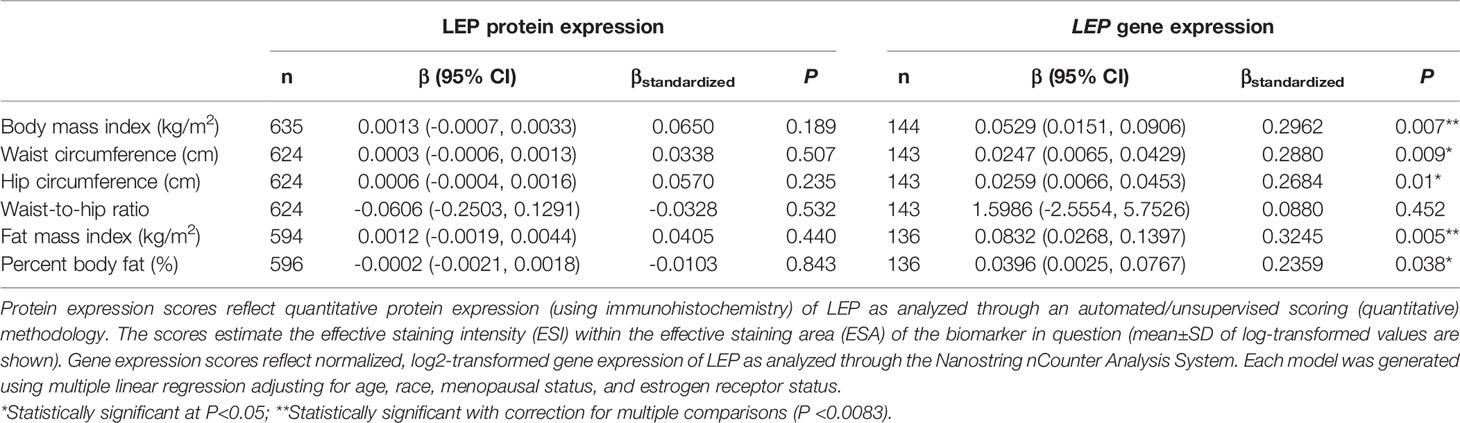
Table 2 Multivariable-adjusted associations of body fatness measures with LEP protein and LEP gene expression in breast tumor tissues.
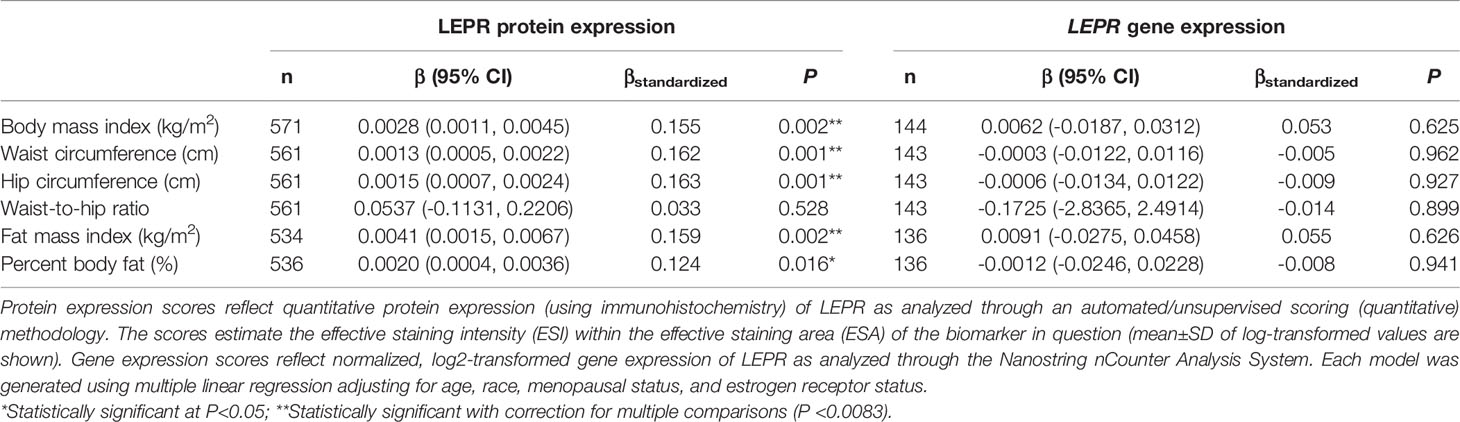
Table 3 Multivariable-adjusted associations of body fatness measures with LEPR protein and LEPR gene expression in breast tumor tissues.
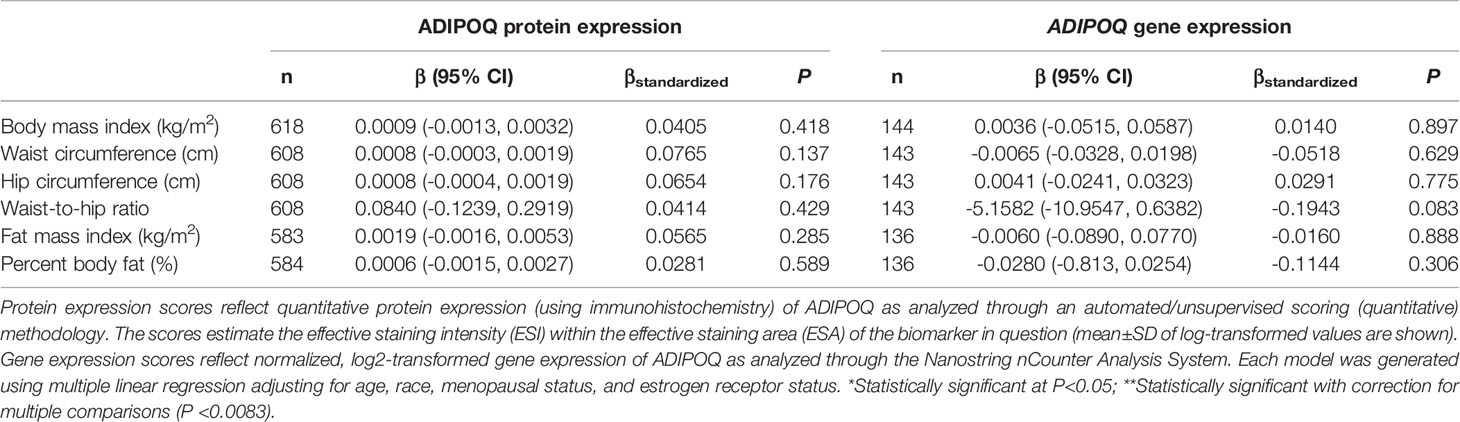
Table 4 Multivariable-adjusted associations of body fatness measures with ADIPOQ protein and ADIPOQ gene expression in breast tumor tissues.
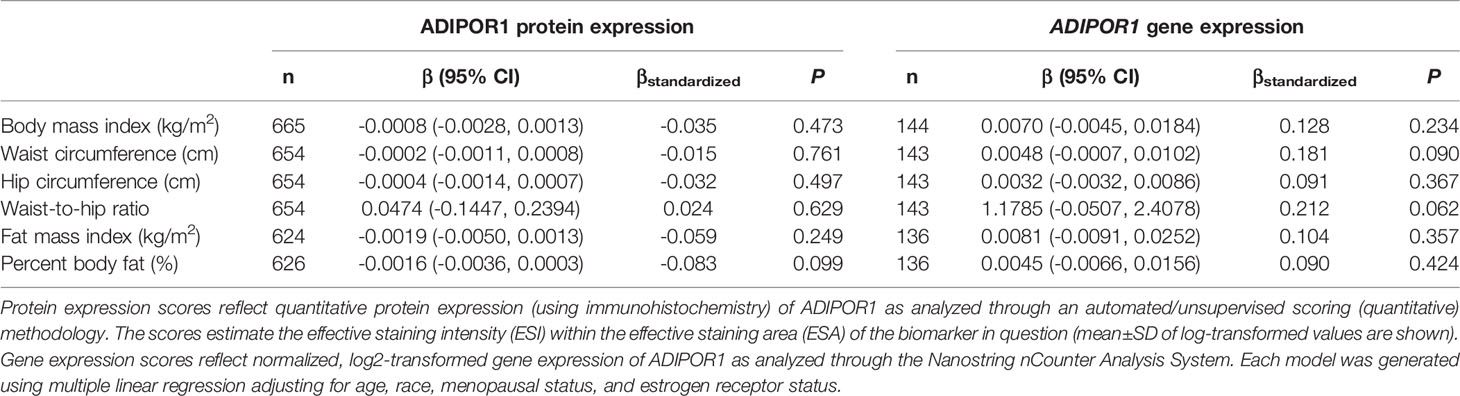
Table 5 Multivariable-adjusted associations of body fatness measures with ADIPOR1 protein and ADIPOR1 gene expression in breast tumor tissues.
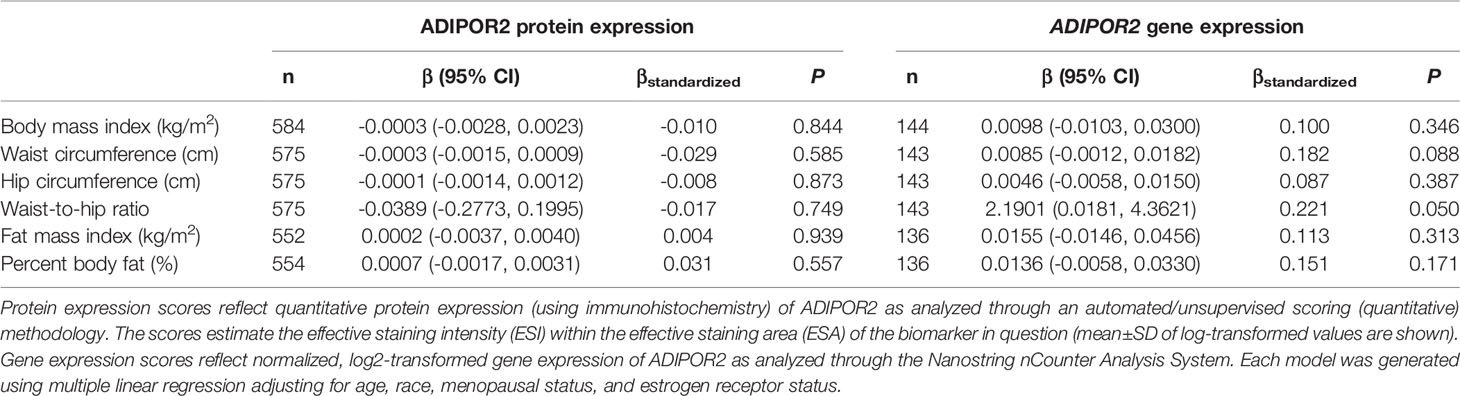
Table 6 Multivariable-adjusted associations of body fatness measures with ADIPOR2 protein and ADIPOR2 gene expression in breast tumor tissues.
Given the multivariable-adjusted associations observed between measures of body fatness and LEPR protein expression levels, we explored potential differences by race (Table 7), menopausal status (Table 8), and ER status (Table 9). Qualitatively, our observation that increasing body fatness measures are associated with higher LEPR protein expression appeared stronger among White women, postmenopausal women, and ER+ cases. Formal tests of interaction yielded statistically significant evidence of effect modification by race for some body fatness measures (BMI, P = 0.041; FMI, P = 0.016; and BF%, P = 0.019), but not others (waist circumference, P = 0.080; hip circumference, P = 0.086) (data not shown). However, we observed no evidence of effect modification by menopausal status (P-values for all body fatness measures >0.05), and limited evidence of effect modification by ER status (BMI, P = 0.318; waist circumference, P = 0.093; hip circumference, P = 0.059; WHR, P = 0.821; FMI, P = 0.250; and BF%, P = 0.553) (data not shown).
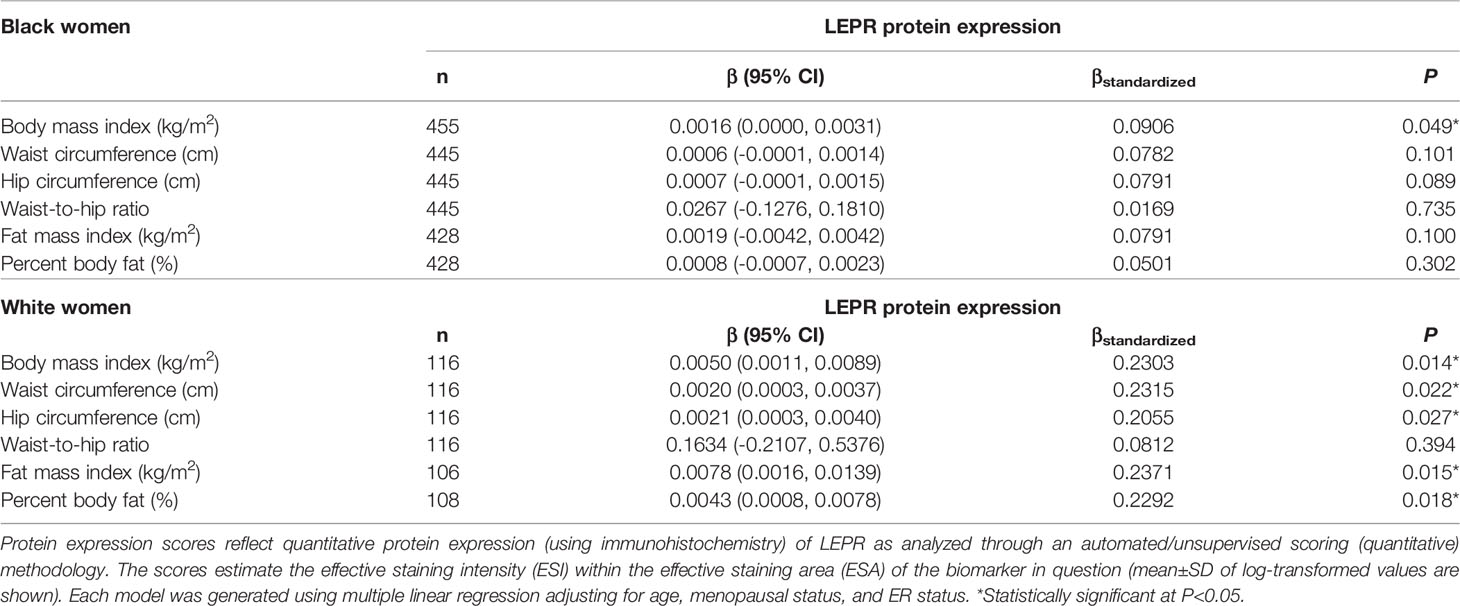
Table 7 Multivariable-adjusted associations of body fatness measures with LEPR protein expression in breast tumor tissues, stratified by race.
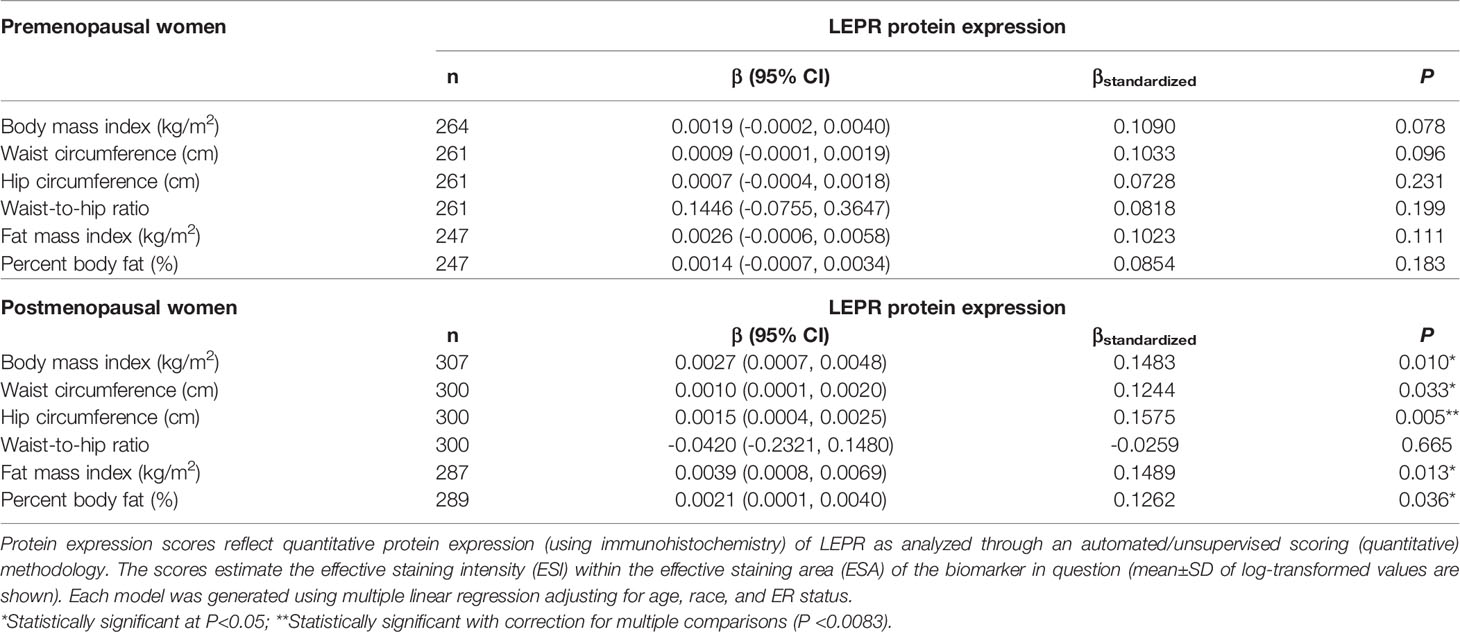
Table 8 Multivariable-adjusted associations of body fatness measures with LEPR protein expression in breast tumor tissues, stratified by menopausal status.
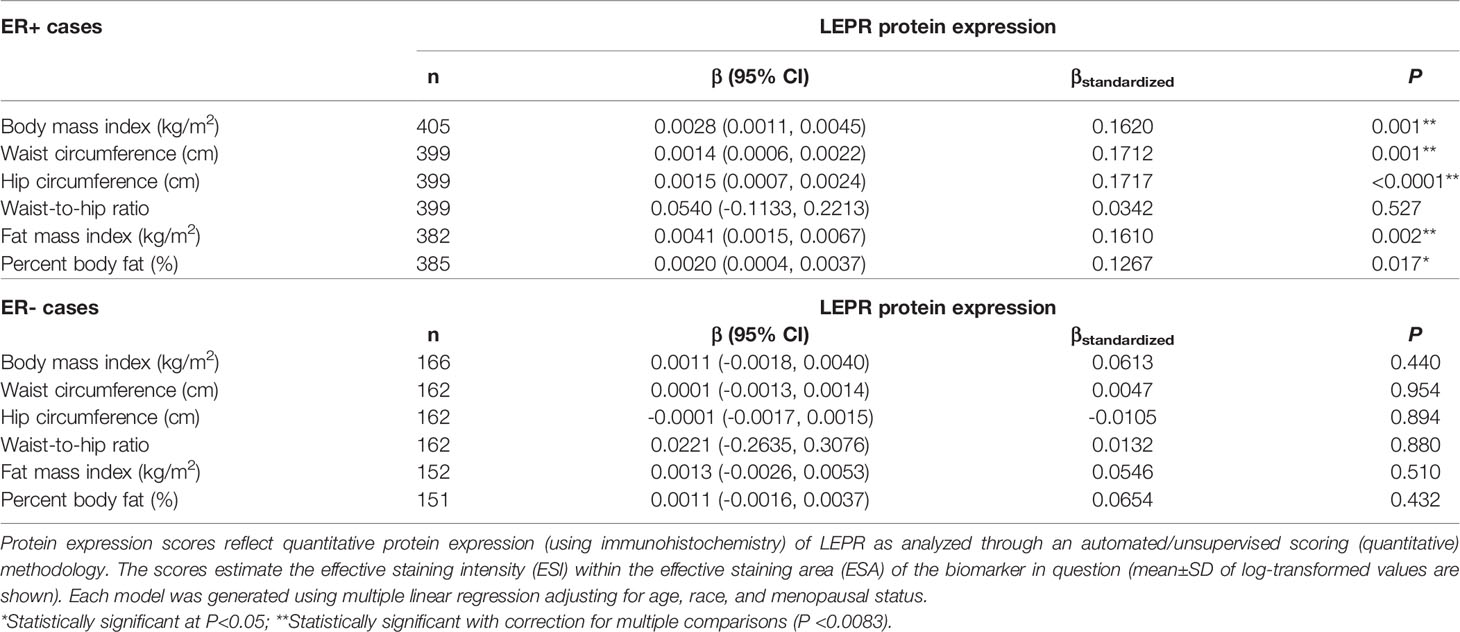
Table 9 Multivariable-adjusted associations of body fatness measures with LEPR protein expression in breast tumor tissues, stratified by ER status.
Discussion
Building on our prior research, here we examined the associations of body fatness measures with protein and gene expression of the adipokines, LEP and ADIPOQ, and the adipokine receptors, LEPR, ADIPOR1, and ADIPOR2 in breast tumor tissues. To our knowledge, this is the first study to investigate these associations in women with breast cancer. Partially consistent with our hypothesis, we found that greater body fatness is associated with increased LEP gene expression and LEPR protein expression, although we observed no associations between body fatness and LEPR gene expression, nor with protein or gene expression of ADIPOQ, ADIPOR1, and ADIPOR2.
Past studies show that BMI is positively associated with circulating leptin concentrations and inversely associated with circulating adipokine concentrations, which are associated with increased risk of some obesity-related cancers including breast cancer (reviewed by Yoon et al. (48)). Our finding that increasing measures of body fatness are positively associated with LEPR protein expression in breast tumors independent of age and menopausal status (with correction for multiplicity) support the hypothesis that LEPR protein expression in breast tumor tissues plays a role in breast carcinogenesis (49–54). Interestingly, our analysis showed significant effect modification by race (stronger among White women) and marginally significant effect modification by ER status (suggestion of stronger associations among ER+ cases, although our analysis was underpowered given the small sample of ER- cases). These findings further highlight the complex interplay among LEPR protein expression, adiposity, race, and breast tumor phenotype (55–58), which might require more precise adiposity measures, and identification and refinement of adiposity-associated biomarkers within breast tumor tissues that can predict breast cancer outcomes. We observed no significant associations between body fatness and LEPR gene expression, but we previously showed that gene expression of LEPR is significantly lower in ER- and TN breast tumors relative to ER+ and luminal A subtypes, respectively (41). While our sample with data on adipokine receptor gene expression was small and limited our statistical power, larger studies in the future will help clarify these findings. Nonetheless, our findings suggest that distribution of adiposity and adiposity-related expression profiles of the adipokines and adipokine receptors, especially LEP and LEPR, in the local organ might have differential impacts on breast cancer based on tumor subtype, and the crosstalk between ER and adipokine biomarkers and other inflammatory biomarkers might play a role (59).
Prior analysis from WCHS reported a lack of association between BMI and breast cancer risk, but higher hip circumference and waist circumference were associated with more than 2-fold increased risk of pre-menopausal breast cancer among women in the fourth quartiles for each measure compared to the first quartile.42 Further, findings from WCHS also showed that compared to BMI, WHR was more strongly associated with overall and breast cancer-specific mortality among Black women. Specifically, compared to the first quartile, women in the fourth quartile of WHR had 61% and 68% increased risk of overall and breast cancer specific death, respectively, while women with class I and class II obesity (compared to normal weight) had statistically non-significant increased risk of death ranging from 17—33% (44). From the combination of these findings, investigations of the associations between more accurate measures of adiposity and adipose tissue distribution (including overall adiposity, visceral adiposity, and subcutaneous adiposity assessed through computed tomography [CT]), in association with adipokine receptor protein and gene expression are critical to elucidating the impact of adiposity on breast carcinogenesis and progression. Such data are critical to determining the clinical utility of adipokine receptor expression profiles as biomarkers of breast cancer risk and prognosis and might contribute to the development of novel interventions and therapeutics targeting high breast tumor expression of these markers, particularly of LEPR, as a means of improving outcomes.
An important strength of this study is that it adds new knowledge regarding the potential impact of overall and central body fatness on adiposity-related biomarkers in breast tumor tissues. Our findings suggest that measures of body fatness are associated with the expression of adipokine receptors – primarily LEP and LEPR – in breast tumors. From this, we generated new hypotheses about the mechanisms linking central adiposity with breast cancer outcomes, which will be pursued. Another strength was the opportunity to perform stratified analysis of the associations of interest by race, menopausal status, and ER status, yielding novel findings. Lastly, our population-based sample that included a large proportion of Black women with breast cancer was also a strength. This study also has some limitations worth noting, including a relatively small sample size (particularly in the gene expression analysis [n = 148]), which may have reduced the power to detect meaningful associations and limit our ability to fully evaluate the complex associations of body fatness with breast cancer. Relatedly, our analysis included multiple comparisons which may have increased the likelihood of observing statistically significant associations. However, we addressed this concern using Bonferroni correction.
Despite these limitations, the findings substantiated our hypothesis that measures of body fatness are associated with expression of adipokine biomarkers in breast tumors. These data are an important step towards understanding the biologic effects of and potential mechanisms linking adiposity with breast cancer risk and prognosis.
Data Availability Statement
The raw data supporting the conclusions of this article will be made available by the authors, without undue reservation.
Ethics Statement
The studies involving human participants were reviewed and approved by Rutgers University Institutional Review Board. The patients/participants provided their written informed consent to participate in this study.
Author Contributions
AL: Grant funding, study conception and design, data collection, data analysis, data interpretation, and writing. JA: Literature search and data interpretation. T-YC: Data interpretation and manuscript editing. WC: Data collection and manuscript editing. MC: Pathology review, data collection, and manuscript editing. EC: Data interpretation and manuscript editing. BQ: Data collection, data interpretation, and manuscript editing. YL: Data analysis, data interpretation, and manuscript editing. CO: Data interpretation and manuscript editing. TK: Pathology review, data collection, and manuscript editing. C-CH: Grant funding, data collection, and manuscript editing. SY: Data collection, data interpretation, and manuscript editing. CA: Grant funding, data collection, data interpretation, and manuscript editing. EB: Grant funding, data collection, data interpretation, and manuscript editing. KD: Grant funding, data collection, data interpretation, and manuscript editing. All authors read and approved the final manuscript. All authors contributed to the article and approved the submitted version.
Funding
This study was supported by funding from the National Cancer Institute of the National Institutes of Health under the following award numbers: K01CA193527 (awarded to AL), P01CA151135 (awarded to CA), P30CA072720 (awarded to S. Libutti), R01CA100598 (awarded to CA), R01CA185623 (awarded to EB, KD, and C-CH), K08CA172722 (awarded to CO), K07CA201334 (awarded to T-YC), and K01CA226155 (awarded to EC). Support was also received by the U.S. Army Medical Research and Development Command under award number DAMD‐17‐01‐1‐0334 (awarded to D.H. Bovbjerg), the Breast Cancer Research Foundation (awarded to CA and C-CH), and a gift from the Philip L. Hubbell Family (awarded to CA). Tumor samples were received, processed and tracked under the auspices of the Roswell Park Comprehensive Cancer Center Data Bank and BioRepository Shared Resource, with funding from NCI-CCSG P30CA16056. Services, results and/or products in support of this research project were generated using the Rutgers Cancer Institute of New Jersey Biomedical Informatics Shared Resource (P30CA072720-5917) and the Biospecimen Repository and Histopathology Service Shared Resource (P30CA072720-5919). The New Jersey State Cancer Registry is funded by the National Cancer Institute’s Surveillance, Epidemiology and End Results (SEER) Program (#75N91021D00009), Centers for Disease Control and Prevention’s National Program of Cancer Registries (#5NU58DP006279) with additional support from the State of New Jersey and the Rutgers Cancer Institute of New Jersey.
Conflict of Interest
Author EC is employed by the company Kaiser Permanente Northern California.
The remaining authors declare that the research was conducted in the absence of any commercial or financial relationships that could be construed as a potential conflict of interest.
Publisher’s Note
All claims expressed in this article are solely those of the authors and do not necessarily represent those of their affiliated organizations, or those of the publisher, the editors and the reviewers. Any product that may be evaluated in this article, or claim that may be made by its manufacturer, is not guaranteed or endorsed by the publisher.
Acknowledgments
We are sincerely appreciative of the breast cancer advocates, community partners, and all study participants who made this work possible. We are equally grateful to the highly motivated, hardworking research personnel of the Women’s Circle of Health Study at the Rutgers School of Public Health, Rutgers Cancer Institute of New Jersey, Roswell Park Comprehensive Cancer Center, Mount Sinai School of Medicine (now Icahn School of Medicine at Mount Sinai), and the New Jersey State Cancer Registry.
Abbreviations
ADIPOQ, adiponectin; ADIPOR1, adiponectin receptor 1; ADIPOR2, adiponectin receptor 2; BIA, bioelectrical impedance analysis; BMI, body mass index; CI, confidence interval; CT, computed tomography; DCIS, ductal carcinoma in situ; ER, estrogen receptor; ESA, effective staining area; ESI, effective staining intensity; FFPE, formalin-fixed paraffin-embedded; H&E, hematoxylin and eosin; HER2, human epidermal growth factor receptor 2; LEP, leptin; LEPR, leptin receptor; SD, standard deviation; TMA, tissue microarray; TN, triple negative; WCHS, Women’s Circle of Health Study; WHR, waist-to-hip ratio.
References
1. Pearson-Stuttard J, Zhou B, Kontis V, Bentham J, Gunter MJ, Ezzati M. Worldwide Burden of Cancer Attributable to Diabetes and High Body-Mass Index: A Comparative Risk Assessment. Lancet Diabetes Endocrinol (2018) 6(6):e6–e15. doi: 10.1016/S2213-8587(17)30366-2
2. Sung H, Siegel RL, Torre LA, Pearson-Stuttard J, Islami F, Fedewa SA, et al. Global Patterns in Excess Body Weight and the Associated Cancer Burden. CA Cancer J Clin (2019) 69(2):88–112. doi: 10.3322/caac.21499
3. Seiler A, Chen MA, Brown RL, Fagundes CP. Obesity, Dietary Factors, Nutrition, and Breast Cancer Risk. Curr Breast Cancer Rep (2018) 10(1):14–27. doi: 10.1007/s12609-018-0264-0
4. Chan DS, Vieira AR, Aune D, Bandera EV, Greenwood DC, McTiernan A, et al. Body Mass Index and Survival in Women With Breast Cancer-Systematic Literature Review and Meta-Analysis of 82 Follow-Up Studies. Ann Oncol (2014) 25(10):1901–14. doi: 10.1093/annonc/mdu042
5. Kerlikowske K, Gard CC, Tice JA, Ziv E, Cummings SR, Miglioretti DL, et al. Risk Factors That Increase Risk of Estrogen Receptor-Positive and -Negative Breast Cancer. J Natl Cancer Inst (2016) 109(5):djw276. doi: 10.1093/jnci/djw276
6. Munsell MF, Sprague BL, Berry DA, Chisholm G, Trentham-Dietz A. Body Mass Index and Breast Cancer Risk According to Postmenopausal Estrogen-Progestin Use and Hormone Receptor Status. Epidemiol Rev (2014) 36:114–36. doi: 10.1093/epirev/mxt010
7. Bandera EV, Chandran U, Hong CC, Troester MA, Bethea TN, Adams-Campbell LL, et al. Obesity, Body Fat Distribution, and Risk of Breast Cancer Subtypes in African American Women Participating in the AMBER Consortium. Breast Cancer Res Treat (2015) 150(3):655–66. doi: 10.1007/s10549-015-3353-z
8. Cirillo D, Rachiglio AM, la Montagna R, Giordano A, Normanno N. Leptin Signaling in Breast Cancer: An Overview. J Cell Biochem (2008) 105(4):956–64. doi: 10.1002/jcb.21911
9. Cleary MP, Ray A, Rogozina OP, Dogan S, Grossmann ME. Targeting the Adiponectin:Leptin Ratio for Postmenopausal Breast Cancer Prevention. Front Biosci (Schol Ed). (2009) 1:329–57. doi: 10.2741/s30
10. Dos Santos E, Benaitreau D, Dieudonne MN, Leneveu MC, Serazin V, Giudicelli Y, et al. Adiponectin Mediates an Antiproliferative Response in Human MDA-MB 231 Breast Cancer Cells. Oncol Rep (2008) 20(4):971–7.
11. Fischer-Posovszky P, Wabitsch M, Hochberg Z. Endocrinology of Adipose Tissue - an Update. Hormone Metab Res (2007) 39(5):314–21. doi: 10.1055/s-2007-976539
12. Jarde T, Caldefie-Chezet F, Goncalves-Mendes N, Mishellany F, Buechler C, Penault-Llorca F, et al. Involvement of Adiponectin and Leptin in Breast Cancer: Clinical and In Vitro Studies. Endocr Relat Cancer. (2009) 16(4):1197–210. doi: 10.1677/ERC-09-0043
13. Wang Y, Lam KS, Xu JY, Lu G, Xu LY, Cooper GJ, et al. Adiponectin Inhibits Cell Proliferation by Interacting With Several Growth Factors in an Oligomerization-Dependent Manner. J Biol Chem (2005) 280(18):18341–7. doi: 10.1074/jbc.M501149200
14. Arita Y, Kihara S, Ouchi N, Takahashi M, Maeda K, Miyagawa J, et al. Paradoxical Decrease of an Adipose-Specific Protein, Adiponectin, in Obesity. Biochem Biophys Res Commun (1999) 257(1):79–83. doi: 10.1006/bbrc.1999.0255
15. Haluzik M, Parizkova J, Haluzik MM. Adiponectin and its Role in the Obesity-Induced Insulin Resistance and Related Complications. Physiol Res (2004) 53(2):123–9.
16. Weyer C, Funahashi T, Tanaka S, Hotta K, Matsuzawa Y, Pratley RE, et al. Hypoadiponectinemia in Obesity and Type 2 Diabetes: Close Association With Insulin Resistance and Hyperinsulinemia. J Clin Endocrinol Metab (2001) 86(5):1930–5. doi: 10.1210/jcem.86.5.7463
17. Chen DC, Chung YF, Yeh YT, Chaung HC, Kuo FC, Fu OY, et al. Serum Adiponectin and Leptin Levels in Taiwanese Breast Cancer Patients. Cancer Lett (2006) 237(1):109–14. doi: 10.1016/j.canlet.2005.05.047
18. Mantzoros C, Petridou E, Dessypris N, Chavelas C, Dalamaga M, Alexe DM, et al. Adiponectin and Breast Cancer Risk. J Clin Endocrinol Metab (2004) 89(3):1102–7. doi: 10.1210/jc.2003-031804
19. Miyoshi Y, Funahashi T, Kihara S, Taguchi T, Tamaki Y, Matsuzawa Y, et al. Association of Serum Adiponectin Levels With Breast Cancer Risk. Clin Cancer Res (2003) 9(15):5699–704.
20. Tworoger SS, Eliassen AH, Kelesidis T, Colditz GA, Willett WC, Mantzoros CS, et al. Plasma Adiponectin Concentrations and Risk of Incident Breast Cancer. J Clin Endocrinol Metab (2007) 92(4):1510–6. doi: 10.1210/jc.2006-1975
21. DeLellis Henderson K, Rinaldi S, Kaaks R, Kolonel L, Henderson B, Le Marchand L. Lifestyle and Dietary Correlates of Plasma Insulin-Like Growth Factor Binding Protein-1 (IGFBP-1), Leptin, and C-Peptide: The Multiethnic Cohort. Nutr cancer. (2007) 58(2):136–45. doi: 10.1080/01635580701328073
22. Ragin CC, Dallal C, Okobia M, Modugno F, Chen J, Garte S, et al. Leptin Levels and Leptin Receptor Polymorphism Frequency in Healthy Populations. Infect Agent Cancer. (2009) 4 Suppl 1:S13. doi: 10.1186/1750-9378-4-S1-S13
23. Han C, Zhang HT, Du L, Liu X, Jing J, Zhao X, et al. Serum Levels of Leptin, Insulin, and Lipids in Relation to Breast Cancer in China. Endocrine (2005) 26(1):19–24. doi: 10.1385/ENDO:26:1:019
24. Liu CL, Chang YC, Cheng SP, Chern SR, Yang TL, Lee JJ, et al. The Roles of Serum Leptin Concentration and Polymorphism in Leptin Receptor Gene at Codon 109 in Breast Cancer. Oncology (2007) 72(1-2):75–81. doi: 10.1159/000111097
25. Wu MH, Chou YC, Chou WY, Hsu GC, Chu CH, Yu CP, et al. Circulating Levels of Leptin, Adiposity and Breast Cancer Risk. Br J Cancer. (2009) 100(4):578–82. doi: 10.1038/sj.bjc.6604913
26. Maeda K, Okubo K, Shimomura I, Funahashi T, Matsuzawa Y, Matsubara K. cDNA Cloning and Expression of a Novel Adipose Specific Collagen-Like Factor, Apm1 (AdiPose Most Abundant Gene Transcript 1). Biochem Biophys Res Commun (1996) 221(2):286–9. doi: 10.1006/bbrc.1996.0587
27. Jarde T, Caldefie-Chezet F, Damez M, Mishellany F, Perrone D, Penault-Llorca F, et al. Adiponectin and Leptin Expression in Primary Ductal Breast Cancer and in Adjacent Healthy Epithelial and Myoepithelial Tissue. Histopathology (2008) 53(4):484–7. doi: 10.1111/j.1365-2559.2008.03121.x
28. Takahata C, Miyoshi Y, Irahara N, Taguchi T, Tamaki Y, Noguchi S. Demonstration of Adiponectin Receptors 1 and 2 mRNA Expression in Human Breast Cancer Cells. Cancer Lett (2007) 250(2):229–36. doi: 10.1016/j.canlet.2006.10.006
29. Kershaw EE, Flier JS. Adipose Tissue as an Endocrine Organ. J Clin Endocrinol Metab (2004) 89(6):2548–56. doi: 10.1210/jc.2004-0395
30. Dieudonne MN, Bussiere M, Dos Santos E, Leneveu MC, Giudicelli Y, Pecquery R. Adiponectin Mediates Antiproliferative and Apoptotic Responses in Human MCF7 Breast Cancer Cells. Biochem Biophys Res Commun (2006) 345(1):271–9. doi: 10.1016/j.bbrc.2006.04.076
31. Hu X, Juneja SC, Maihle NJ, Cleary MP. Leptin–a Growth Factor in Normal and Malignant Breast Cells and for Normal Mammary Gland Development. J Natl Cancer Inst (2002) 94(22):1704–11. doi: 10.1093/jnci/94.22.1704
32. O'Brien SN, Welter BH, Price TM. Presence of Leptin in Breast Cell Lines and Breast Tumors. Biochem Biophys Res Commun (1999) 259(3):695–8. doi: 10.1006/bbrc.1999.0843
33. Dieudonne MN, Machinal-Quelin F, Serazin-Leroy V, Leneveu MC, Pecquery R, Giudicelli Y. Leptin Mediates a Proliferative Response in Human MCF7 Breast Cancer Cells. Biochem Biophys Res Commun (2002) 293(1):622–8. doi: 10.1016/S0006-291X(02)00205-X
34. Hardwick JC, Van Den Brink GR, Offerhaus GJ, Van Deventer SJ, Peppelenbosch MP. Leptin is a Growth Factor for Colonic Epithelial Cells. Gastroenterology (2001) 121(1):79–90. doi: 10.1053/gast.2001.25490
35. Laud K, Gourdou I, Pessemesse L, Peyrat JP, Djiane J. Identification of Leptin Receptors in Human Breast Cancer: Functional Activity in the T47-D Breast Cancer Cell Line. Mol Cell Endocrinol (2002) 188(1-2):219–26. doi: 10.1016/S0303-7207(01)00678-5
36. Cao R, Brakenhielm E, Wahlestedt C, Thyberg J, Cao Y. Leptin Induces Vascular Permeability and Synergistically Stimulates Angiogenesis With FGF-2 and VEGF. Proc Natl Acad Sci U S A. (2001) 98(11):6390–5. doi: 10.1073/pnas.101564798
37. Park HY, Kwon HM, Lim HJ, Hong BK, Lee JY, Park BE, et al. Potential Role of Leptin in Angiogenesis: Leptin Induces Endothelial Cell Proliferation and Expression of Matrix Metalloproteinases In Vivo and In Vitro. Exp Mol Med (2001) 33(2):95–102. doi: 10.1038/emm.2001.17
38. Somasundar P, McFadden DW, Hileman SM, Vona-Davis L. Leptin Is a Growth Factor in Cancer. J Surg Res (2004) 116(2):337–49. doi: 10.1016/j.jss.2003.09.004
39. Llanos AA, Dumitrescu RG, Marian C, Makambi KH, Spear SL, Kallakury BV, et al. Adipokines in Plasma and Breast Tissues: Associations With Breast Cancer Risk Factors. Cancer Epidemiol Biomarkers Prev (2012) 21(10):1745–55. doi: 10.1158/1055-9965.EPI-12-0016
40. Llanos AAM, Lin Y, Chen W, Yao S, Norin J, Chekmareva MA, et al. Immunohistochemical Analysis of Adipokine and Adipokine Receptor Expression in the Breast Tumor Microenvironment: Associations of Lower Leptin Receptor Expression With Estrogen Receptor-Negative Status and Triple-Negative Subtype. Breast Cancer Res (2020) 22(1):18. doi: 10.1186/s13058-020-1256-3
41. Llanos AAM, Yao S, Singh A, Aremu JB, Khiabanian H, Lin Y, et al. Gene Expression of Adipokines and Adipokine Receptors in the Tumor Microenvironment: Associations of Lower Expression With More Aggressive Breast Tumor Features. Breast Cancer Res Treat (2020) 22:18. doi: 10.1007/s10549-020-05972-0
42. Bandera EV, Chandran U, Zirpoli G, Gong Z, McCann SE, Hong CC, et al. Body Fatness and Breast Cancer Risk in Women of African Ancestry. BMC cancer. (2013) 13:475. doi: 10.1186/1471-2407-13-475
43. George P, Chandwani S, Gabel M, Ambrosone CB, Rhoads G, Bandera EV, et al. Diagnosis and Surgical Delays in African American and White Women With Early-Stage Breast Cancer. J Womens Health (Larchmt). (2015) 24(3):209–17. doi: 10.1089/jwh.2014.4773
44. Bandera EV, Qin B, Lin Y, Zeinomar N, Xu B, Chanumolu D, et al. Association of Body Mass Index, Central Obesity, and Body Composition With Mortality Among Black Breast Cancer Survivors. JAMA Oncol (2021) 7(8):1–10. doi: 10.1001/jamaoncol.2021.1499
45. Chen W, Reiss M, Foran DJ. A Prototype for Unsupervised Analysis of Tissue Microarrays for Cancer Research and Diagnostics. IEEE Trans Inf Technol Biomed (2004) 8(2):89–96. doi: 10.1109/TITB.2004.828891
46. World Health Organization. Waist Circumference and Waist-Hip Ratio: A Report of a WHO Expert Consultation. Geneva, Switzerland: WHO Press, World Health Organization (2011).
47. Peltz G, Aguirre MT, Sanderson M, Fadden MK. The Role of Fat Mass Index in Determining Obesity. Am J Hum Biol (2010) 22(5):639–47. doi: 10.1002/ajhb.21056
48. Yoon YS, Kwon AR, Lee YK, Oh SW. Circulating Adipokines and Risk of Obesity Related Cancers: A Systematic Review and Meta-Analysis. Obes Res Clin Pract (2019) 13(4):329–39. doi: 10.1016/j.orcp.2019.03.006
49. Jarde T, Perrier S, Vasson MP, Caldefie-Chezet F. Molecular Mechanisms of Leptin and Adiponectin in Breast Cancer. Eur J Cancer. (2011) 47(1):33–43. doi: 10.1016/j.ejca.2010.09.005
50. Ishikawa M, Kitayama J, Nagawa H. Enhanced Expression of Leptin and Leptin Receptor (OB-R) in Human Breast Cancer. Clin Cancer Res (2004) 10(13):4325–31. doi: 10.1158/1078-0432.CCR-03-0749
51. Fiorio E, Mercanti A, Terrasi M, Micciolo R, Remo A, Auriemma A, et al. Leptin/HER2 Crosstalk in Breast Cancer: In Vitro Study and Preliminary In Vivo Analysis. BMC cancer. (2008) 8:305. doi: 10.1186/1471-2407-8-305
52. Kim Y, Kim SY, Lee JJ, Seo J, Kim YW, Koh SH, et al. Effects of the Expression of Leptin and Leptin Receptor (OBR) on the Prognosis of Early-Stage Breast Cancers. Cancer Res Treat (2006) 38(3):126–32. doi: 10.4143/crt.2006.38.3.126
53. Garofalo C, Koda M, Cascio S, Sulkowska M, Kanczuga-Koda L, Golaszewska J, et al. Increased Expression of Leptin and the Leptin Receptor as a Marker of Breast Cancer Progression: Possible Role of Obesity-Related Stimuli. Clin Cancer Res (2006) 12(5):1447–53. doi: 10.1158/1078-0432.CCR-05-1913
54. Jarde T, Caldefie-Chezet F, Damez M, Mishellany F, Penault-Llorca F, Guillot J, et al. Leptin and Leptin Receptor Involvement in Cancer Development: A Study on Human Primary Breast Carcinoma. Oncol Rep (2008) 19(4):905–11. doi: 10.3892/or.19.4.905
55. Suzuki R, Orsini N, Saji S, Key TJ, Wolk A. Body Weight and Incidence of Breast Cancer Defined by Estrogen and Progesterone Receptor Status–a Meta-Analysis. Int J Cancer. (2009) 124(3):698–712. doi: 10.1002/ijc.23943
56. van den Brandt PA, Spiegelman D, Yaun SS, Adami HO, Beeson L, Folsom AR, et al. Pooled Analysis of Prospective Cohort Studies on Height, Weight, and Breast Cancer Risk. Am J Epidemiol. (2000) 152(6):514–27. doi: 10.1093/aje/152.6.514
57. Yang XR, Chang-Claude J, Goode EL, Couch FJ, Nevanlinna H, Milne RL, et al. Associations of Breast Cancer Risk Factors With Tumor Subtypes: A Pooled Analysis From the Breast Cancer Association Consortium Studies. J Natl Cancer Inst (2011) 103(3):250–63. doi: 10.1093/jnci/djq526
58. Raut PK, Kim SH, Choi DY, Jeong GS, Park PH. Growth of Breast Cancer Cells by Leptin is Mediated via Activation of the Inflammasome: Critical Roles of Estrogen Receptor Signaling and Reactive Oxygen Species Production. Biochem Pharmacol (2019) 161:73–88. doi: 10.1016/j.bcp.2019.01.006
Keywords: adiposity, breast cancer, leptin (LEP), leptin receptor (LEPR), adiponectin (ADIPOQ), adiponectin receptors 1 and 2 (ADIPOR1, ADIPOR2), protein expression, gene expression
Citation: Llanos AAM, Aremu JB, Cheng T-YD, Chen W, Chekmareva MA, Cespedes Feliciano EM, Qin B, Lin Y, Omene C, Khoury T, Hong C-C, Yao S, Ambrosone CB, Bandera EV and Demissie K (2022) Greater Body Fatness Is Associated With Higher Protein Expression of LEPR in Breast Tumor Tissues: A Cross-Sectional Analysis in the Women’s Circle of Health Study. Front. Endocrinol. 13:879164. doi: 10.3389/fendo.2022.879164
Received: 18 February 2022; Accepted: 27 May 2022;
Published: 29 June 2022.
Edited by:
Giovanna Muscogiuri, University of Naples Federico II, ItalyReviewed by:
Eva Surmacz, Allysta Pharmaceuticals, Inc., United StatesAnn H. Rosendahl, Lund University, Sweden
Copyright © 2022 Llanos, Aremu, Cheng, Chen, Chekmareva, Cespedes Feliciano, Qin, Lin, Omene, Khoury, Hong, Yao, Ambrosone, Bandera and Demissie. This is an open-access article distributed under the terms of the Creative Commons Attribution License (CC BY). The use, distribution or reproduction in other forums is permitted, provided the original author(s) and the copyright owner(s) are credited and that the original publication in this journal is cited, in accordance with accepted academic practice. No use, distribution or reproduction is permitted which does not comply with these terms.
*Correspondence: Adana A.M. Llanos, YWw0MjQ4QGN1bWMuY29sdW1iaWEuZWR1